Integrated CFD-FEM approach for external gear pump vibroacoustic field prediction
 Cristian Ferrari
 Serena Morselli1
 - 1C. N. R.—National Research Council of Italy, STEMS Institute, Ferrara, Italy
- 2Siemens Digital Industries Software, Nantes, France
In this work, a three-dimensional fluid-structural and vibro-acoustics coupled model of a gear pump is presented. Gear pumps represent the majority of the positive displacement machines used for flow generation in fluid power systems. Typically, the dynamics of gear pumps are dependent on the characteristics of the fluid dynamics inside the pump, which translates into vibrations to the housing. These vibrations then propagate to the surrounding medium and emit sound. The purpose of this study is to propose a three-dimensional fully integrated computational model to simulate the complete gear pump behaviour from the fluid dynamics to the structural vibrations, up to the vibroacoustic response. In this hybrid configuration, a transient CFD (Computational Fluid Dynamics) model is first developed to simulate the 3D flow field with a deforming and re-meshing approach to take into account the variation of the volume between the gears. Second, the internal pressure field calculated at each time step is then used as a loading into a structural FEM (Finite Element Method) model of the gear pump to compute the actual stresses and deformations of the housing. Third, the results of the structural response are used as excitation in a vibroacoustic sub-model to simulate the radiated noise using a high-order FEM technique. The comparison between the numerical and experimental flow curves validates the CFD model. The sound power calculations from the vibroacoustic model show good comparison with the sound intensity measurements around the pump casing, confirming the validity of the proposed coupled model. The described CFD-FEM approach proves to be a powerful gear pump design tool: it provides a reliable estimate of gear pump working parameters such as fluid power and vibroacoustic characteristics, starting from the CAD (Computer-Aided Design) geometry of the components. Furthermore, being one of the first multi-domain simulation models of a gear pump, this work can be useful to researchers as a starting point to correlate the noise emitted with the internal flow in full 3D conditions.
1 Introduction
External gear pumps are a type of positive displacement pump that are commonly used for pumping water, light oils, chemical additives, resins, or solvents. They are preferred in applications where accurate dosing or high-pressure output are required and are widely used for energy transmission in hydraulic circuits and fluid power systems (Ivantysynova and Ivantysynova, 2003). Gear pumps use the actions of rotating cogs or gears to transfer fluids. The rotating gears develop a liquid seal with the pump casing and create a vacuum at the pump inlet. The fluid drawn into the pump is enclosed within the cavities of the rotating gears and transferred from one side (low pressure) to the discharge on the other side (higher pressure). A smooth pulse-free flow proportional to the rotational speed of the gears is delivered by the gear pump. Particularly, external gear pumps consist of two identical, interlocking gears supported by separate shafts. Generally, one gear is driven by a motor, and that gear drives the other gear, also known as the idler (Figure 1).
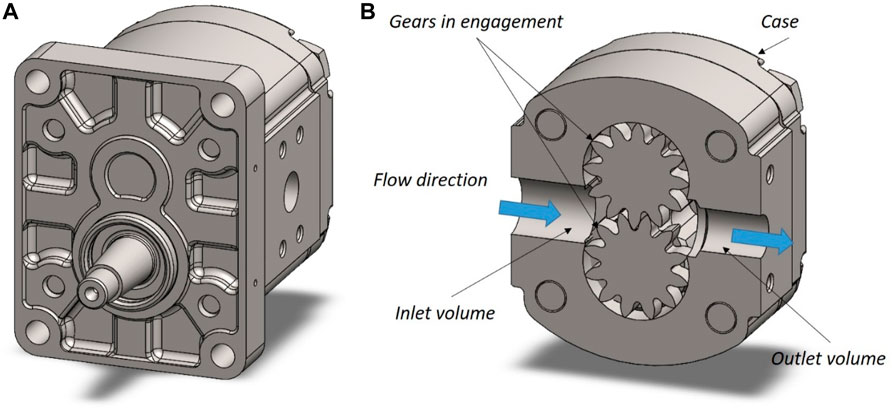
FIGURE 1. Simulated gear pump structural model (A) and exploded view (B).
The modern design methodologies of gear pumps mainly focus on the accurate prediction of their performance. For instance: hydraulic efficiency, pressure, torque, and sound power. Nowadays the noise emitted by gear pumps is a very important parameter for manufacturers and its correct prediction depends on the accuracy of the numerical models used.
The fluid dynamics characteristics are generally predicted by Lumped Parameter (LP) models or by Computational Fluid Dynamics (CFD) models. Examples of LP models can be found in Mancò and Nervegna (1989). In this work, a numerical-experimental comparison of the LP model of a gear pump was presented. The model was based on 6 Ordinary Differential Equations (ODEs) for each control volume which subdivides the internal fluid volume. The flow characteristics of the simulated gear pump were predicted, together with the pressure ripple, the pressure on the teeth, and the pressure force acting on the gear. In Casoli et al. (2008), an LP model based on a commercial code was developed for the resolution of the internal flow, the objective of this work being the optimization of some parameters of a gear pump. Another optimization study was carried out by Wang et al. (2011), demonstrating a gear and backlash wear plate design that reduced pressure variations and spikes to achieve the best system performance, including noise, efficiency, and fatigue resistance. The numerical and experimental results have been shown to validate the optimization approach. In addition, many studies have focused on CFD models that analyze internal flow, pressure ripple, and pressure force on the gear (Rundo, 2017), the space between gear and casing (Houzeaux and Codina, 2007), cavitation phenomena (Frosina et al., 2017). Moreover, a difficult problem in gear pump CFD analysis consists of simulating the contact point for the gear. In fact, in this region, the 3D numerical grid degenerates into a line. To solve this problem various numerical approaches have been used. Castillia et al. (2010) simulated the contact point between the teeth with a wall, whereas Frosina et al. (2017) replaced the contact with a minimum gap. In Yoon et al. (2017) and Jędraszczyk and Fiebig (2017), a numerical immersed solid approach is used in a CFD computation, to analyze the effects of rotational speed and gear tip clearance on volumetric efficiency. Furthermore, several approaches have been developed over the last 10 years to minimize the issues related to mesh deformation during the computation such as numerical effort and accuracy (Gorla C. et al., 2014; Concli F. et al., 2017; Mastrone M.N. et al., 2021; Maccioni, 2023).
Regarding the structural simulation of a gear pump, research by Ozsoy and Kurnaz (2017) focused on the optimization of the external housing based on structural analysis computed with the Finite Element Method (FEM). The optimized study led to a reduction in the thickness of the material used for the hydraulic gear pump cover.
Many researchers have studied the prediction of air-borne noise due to gear pumps. Carletti et al. (2016) and Miccoli et al (2016) presented an original and useful analysis procedure to predict the noise field generated by these mechanical systems. Experimental results were combined with harmonic response and vibroacoustic analyses so that the dynamic response of the system was estimated starting from a limited number of experimental vibrations acquired on the pump casing and its support structure.
In many studies for hydraulic noise applications, sound generation in pumps and motors is commonly classified into three categories: fluid-borne noise (FBN), structure-borne noise (SBN), and air-borne noise (ABN). This classification can be useful to understand the mechanisms involved in the generation and transmission of noise. In the last decade, the efforts of many researchers and engineers have been focused on coupling different sets of equations with the aim of simulating sequentially the internal flow, structural stress, and vibro-acoustic behaviour (Table 1, as some references).
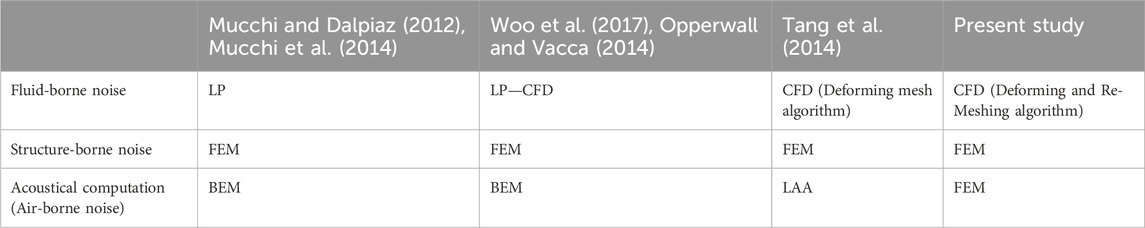
TABLE 1. Pump noise categories vs. literature and computational tools.
Tang et al. (2014) developed a coupled model based on the CFD analysis and a Lighthill’s acoustic analogy (LAA) algorithm. The fluid pressure and velocity distributions of the flow field were first calculated by means of a CFD model. The noise generated by the flow field was simulated and their sound pressure spectra were obtained by the LAA model. Mucchi and Dalpiaz (2012), Mucchi et al. (2014) studied the development of a combined approach between LP, FEM, and BEM (Boundary Element Method) to carry out a vibroacoustic analysis of a gear pump. Thanks to the LP model the dynamic behaviour of the internal components was accounted for; the external gear housing dynamics were simulated by a structural FEM analysis; and finally, the radiated noise was computed through a vibroacoustic BEM approach. Woo et al. (2017), Opperwall and Vacca (2014) presented a coupled approach to evaluate the noise emitted from external gear pumps. To assess the fluid-borne noise sources, the authors used an in-house simulation tool based on the LP−CFD coupled approach which divides the fluid domain inside the unit into four main control volume groups: inlet, outlet, driven, and drive gear volumes. This simulation tool could accurately predict the dynamic pressure and the force acting on the gears. An integrated FEM/BEM approach was used to calculate the pump’s acoustic behaviour. Eventually, the model was able to accurately predict the noise for each domain of external gear pumps (fluid, structural, and air). Miccoli and Hamiche (2019) approaches used FEM vibroacoustic simulations: the gear pump structural dynamic response to acceleration spectra was acquired on the pump casing and used as excitation boundary conditions with fluid-structure interaction coupling to calculate the radiated sound power.
However, at present the authors have no information about scientific research aimed at predicting the fluid-induced vibrations and noise radiation of a gear pump using a 3D-CFD model in combination with a FEM-based vibroacoustic model.
In this paper, such a CFD/FEM approach was developed and tested to predict the sound generated by an external gear pump during its working cycle. Three sub-models have been linked together: a 3D CFD sub-model to evaluate the pump inner pressure distribution, a structural FEM sub-model for the computation of the pump structural displacements, and finally, a FEM vibroacoustic sub-model for the noise evaluation.
2 Gear pump geometry
In this study, a commercial 2SP080 gear pump model from the manufacturing company Galtech was used. This unit operates from 500 rpm to 3500 rpm, with a pressure of up to 300 bar, a displacement of 8.5 cm3, and 12 teeth working under dual flank conditions (zero backlash). The pump body is made of aluminium, and consists of three main components (flange, main pump casing, and end cover). Pressure-compensated lateral bushings are present to enhance the lateral sealing of the tooth space volumes (Figure 1).
Pump lateral bushes and linked leakage have been eliminated in the pump 3D CAD model as a geometrical simplification in order to reduce the computational cost. The lateral simplification is followed by the implementation of the gap between the gear wheels and the housing. This leakage is created from chip removal during the breaking-in procedure and is inserted in the test case through a gap of 25 µm. In addition, the influence of wheel eccentricity and bearing block displacement are not considered.
It is worth mentioning that in-between the gear wheels a gap of 13 µm is inserted to create a numerical leakage. This exemplification allows us to reduce the computational cost for the contact simulation by introducing an error in the flow rate, but without affecting the pressure ripples.
3 Experimental set-up
Two different test rigs were used in this work, the first one to obtain the output flow rate and the second one to measure the gear pump noise.
An open hydraulic circuit with a similar configuration as in SAE J745 is used for the first test rig. The bench is powered by a 75-kW diesel engine, whereas an electronic system acquires and generates the command signals. A solenoid valve captures the flow rate and generates the load pressure.
The pump was tested at 1500 rpm and 50 bar with ISO VG 46 lubrication oil as the working fluid. The output flow rate for the acquisition time is reported in Figure 2, and the average value calculated is 12.7 l/min (Table 2).
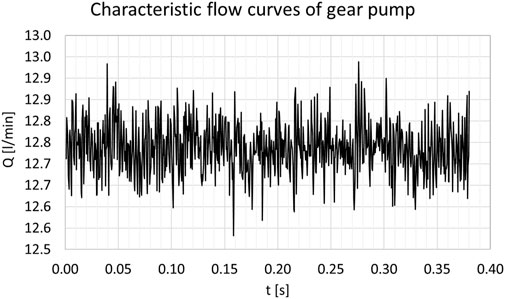
FIGURE 2. Experimental trend of the flow rate at the pump outlet at 1500 rpm and 50 bar.

TABLE 2. Pump configurations for flow rate measurement.
For a matter of computational results validation, the sound power spectra of the tested pump were experimentally acquired on a test rig complying with the requirements of ISO, 1996 16902-1 by sound power measurements as seen on the left side in Figure 3. The measurements were performed according to the scanning method described in ISO, 2002 9614-2 so that a grade 2 of accuracy was reached. On the right side in Figure 3 the 1/3-octave band sound power spectra obtained by sound power measurements at two pump operating conditions are shown within the range 200-5000 Hz.
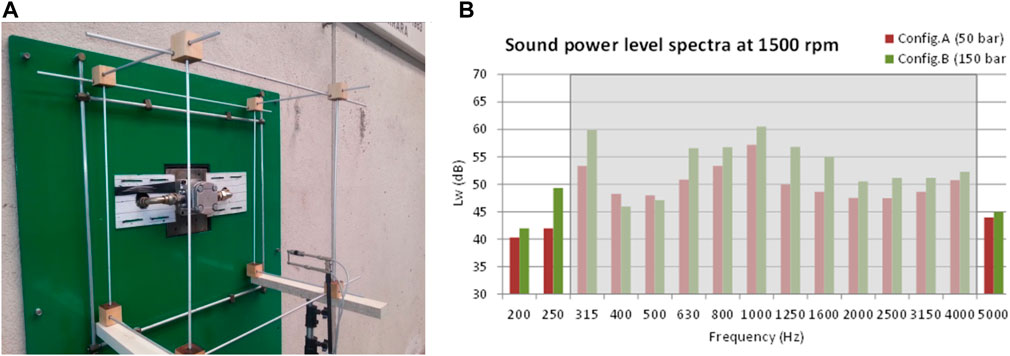
FIGURE 3. Experimental sound power spectra–Measurement test rig (A), and results obtained at two pump operating conditions (B).
Three different pump operating conditions were tested, as listed in Table 3.
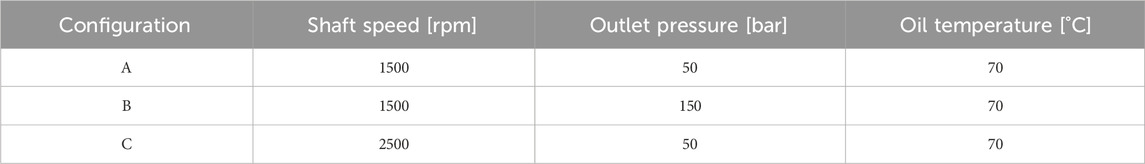
TABLE 3. Pump configurations for sound power measurement.
4 Computational model
The CFD-FEM approach developed by the authors (Morselli et al., 2021) consists of the following three steps: computation of the external gear pump inner pressure distribution by CFD analysis, coupling with the pump structural model and structural vibrations computation, coupling to the surrounding air, and vibro-acoustics results evaluation (Figure 4).
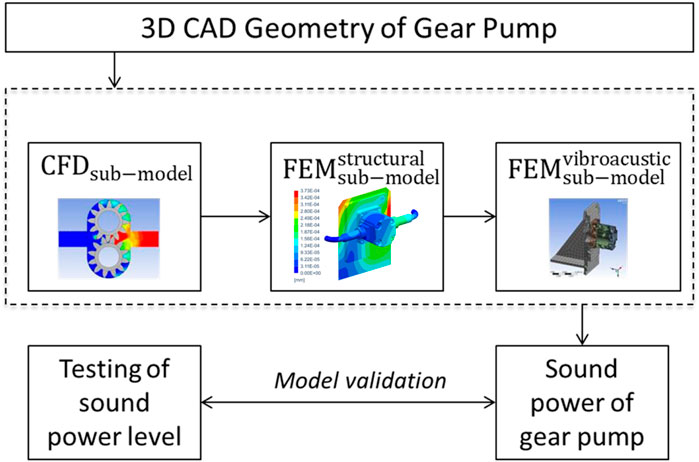
FIGURE 4. Complete model development.
The whole computation procedure workflow uses three commercial codes: Ansys Icem CFD 19.2 (Ansys, 2019a), Ansys Fluent 19.2 (Ansys, 2019b) and Siemens Simcenter 3D (Siemens, 2023). The procedure described in this paper provides an alternative numerical approach with a fully integrated gear pump simulation, ranging from the geometry preparation up to the vibroacoustic solution passing through the computational fluid dynamic and structural simulations. The following paragraphs present the geometry preparation, the construction of the CFD model, the extrapolation of the data for the structural FEM model, and, finally, the vibroacoustic solution.
4.1 Governing equations
The CFD simulation is based on the Reynolds-averaged Navier-Stokes equations resolved on the finite volume method (Johnson, 2016). The continuity (Eq. 1) and momentum equations (Eq. 2) are presented for an incompressible flow:
where
To obtain the loads from the CFD simulation a load recipe is used in Simcenter 3D. It uses the CGNS files from the CFD simulation as input to map the transient data of the CFD mesh to the FEM mesh. For this purpose, the CFD mesh and the pressure field or other variables of the flow can be derived from the CGNS files in Simcenter 3D (Siemens, 2023).
For the vibroacoustic response, we consider the propagation of harmonic, linear sound waves in a uniform, quiescent medium within a bounded domain Ω. Throughout this paper, an implicit time dependence e+iωt is assumed, where ω is the angular frequency. The complex amplitude u of the acoustic pressure is governed by the Helmholtz equation (Eq. 3):
where k = ω/c is the acoustic wavenumber (with c is the sound speed) and s is an arbitrary volume source term.
4.2 CFD sub-model
4.2.1 Fluid domain
The 3D CAD geometry of the displacement gear pump was used as input to generate the fluid domain through Boolean subtraction. The internal volume was then isolated and used for the CFD analysis. It is composed of a gear region and suction/discharge regions, which correspond to a rotating volume and a stationary volume, respectively. The interface between the rotor (rotating fluid domain) and stator (stationary fluid domain) regions allows the continuity of the flow. Note that the inlet and outlet ducts were elongated in order to stabilize the numerical simulations (Figure 5).
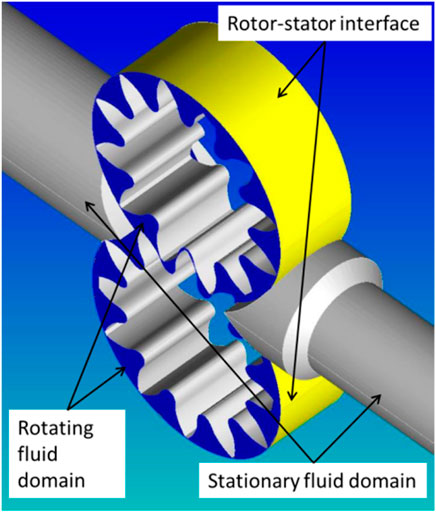
FIGURE 5. Simulated CFD fluid domain.
4.2.2 Numerical grid
Two unstructured tetrahedral grids were generated for the stationary and rotating volumes. The stationary domain is composed of 3.5 million tetrahedral elements. For the rotating volume, near the moving gear, a moving mesh approach is necessary. The volume between the teeth of the contact gears changes rapidly and requires the implementation of a deforming mesh.
The rotating volume mesh is generated starting from triangular elements at the surface and through their extrusion along the normal direction (Figure 6). An iterative process allows to adjust the mesh at each time step, according to the procedure shown in Figure 7 and presented in Morselli and Ferrari (2019).
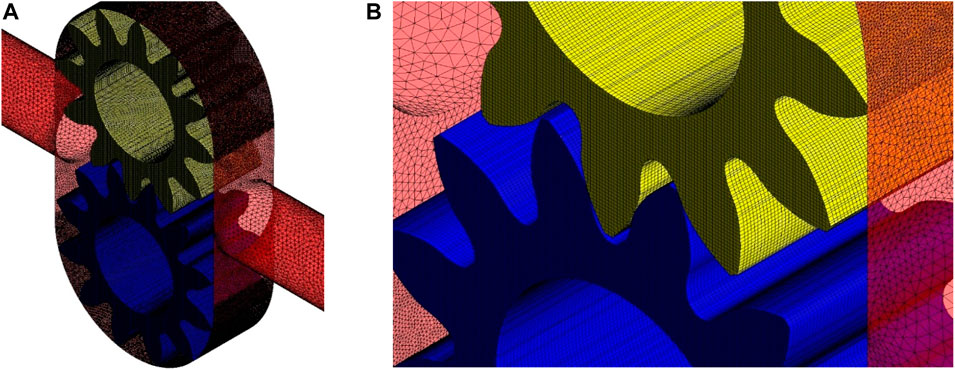
FIGURE 6. Mesh of the CFD fluid domain (A), and detail of the mesh in gears contact region (B).

FIGURE 7. CFD sub-model flow chart, with the two iterative processes for remeshing.
Regarding the meshing strategy, for each discrete movement of the gears the grid is updated. Two algorithms are applied to smoothen and mesh the rapidly changing fluid domain. In particular, for each time step (
where
Regarding the aforementioned remeshing algorithm, a 2.5D mesh motion technique is applied, which, on the extruded 3D geometry, meshes again the two-dimensional triangular surface and extends the modification into the whole volume. The faces on a deforming boundary are identified for remeshing based on face skewness and minimum/maximum length scale.
Thanks to the dynamic mesh algorithms, for each time step, the mesh is updated while maintaining a characteristic length scale of 0.1 mm and a maximum of 2 million elements.
4.2.3 Numerical setup
The following boundary conditions are applied to the CFD mesh: a total pressure at both the inlet and outlet with normal direction and medium intensity of turbulence. The latter allows to facilitate the convergence. In Table 4 a summary of the numerical setup is listed.
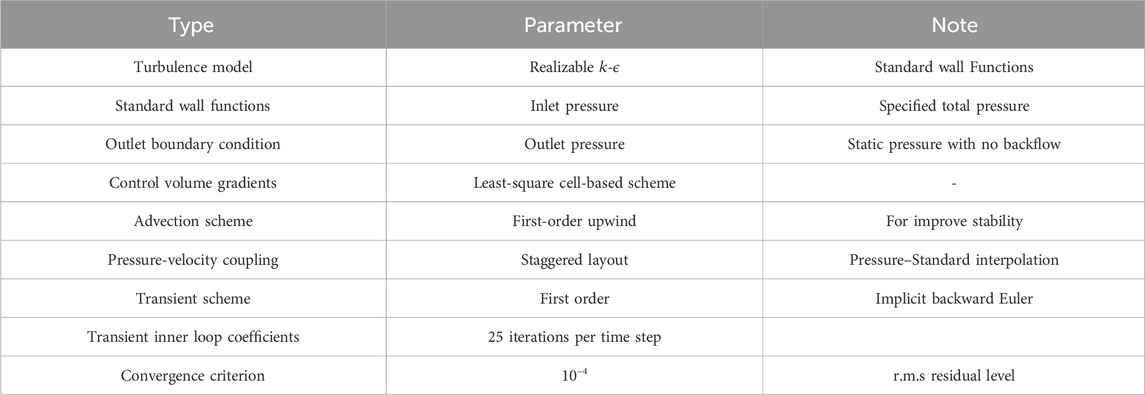
TABLE 4. Numerical setup.
The CFD governing equations are then solved through a Green-Gauss finite volume method with a cell-centered formulation and a pressure-based coupled algorithm. As for the convective term, a first-order upwind interpolation scheme is used. This approach allows us to solve the coupled system of equations (continuity and momentum), as defined above in Eq. 1, 2. The realizable
In addition, the PREssure STaggering Option (PRESTO) technique was chosen since it has been reported to give better results for high pressure and velocity gradients.
Regarding time stepping, it must be small enough to capture the relevant time scales of the flow, but at the same time, the number of time steps should be limited to constrain the computational effort. According to these considerations, a time step of 10−3 s was used.
In terms of the convergence criterion for the iterative solver, the target residual value is set to 10−4. With these settings for the transient simulations, the global imbalances are normally kept below ±2%.
4.3 Sensitivity and uncertainty analysis
Grid independence analysis is always advisable when accurate results are required. Usually, several grids featuring different numbers of points and topologies are iteratively generated and tested towards a target performance value. The results obtained by this methodology show better convergence and lower uncertainty.
The grid sensitivity uncertainty quantification of the gear pump considered in this paper is reported in Morselli et al. (2019). The comparison between experimental and numerical results, united with the widely investigated Richardson Extrapolation method for the discretization error estimation (Celik et al., 2008), led to an accurate sensitivity analysis of the clearances. To summarise, four meshes of different characteristic sizes were analysed, each of which was generated by varying the distance between the driven and drive gears. The simulated cases are reported in Figure 8, with the following gear gap values: 6, 13, and 23 µm. The characteristic length scale of the mesh was varied from 0.0125 mm to 0.2 mm. As reported in Figure 9, it can be observed that increasing the gap between the gears slightly decreases the outflow rate, except for the coarsest mesh size of 0.2 mm which shows a significant deviation of the flow rate with a gap of 6 µm. Moreover, below a length scale of 0.1 mm the outlet flow rate is almost constant.
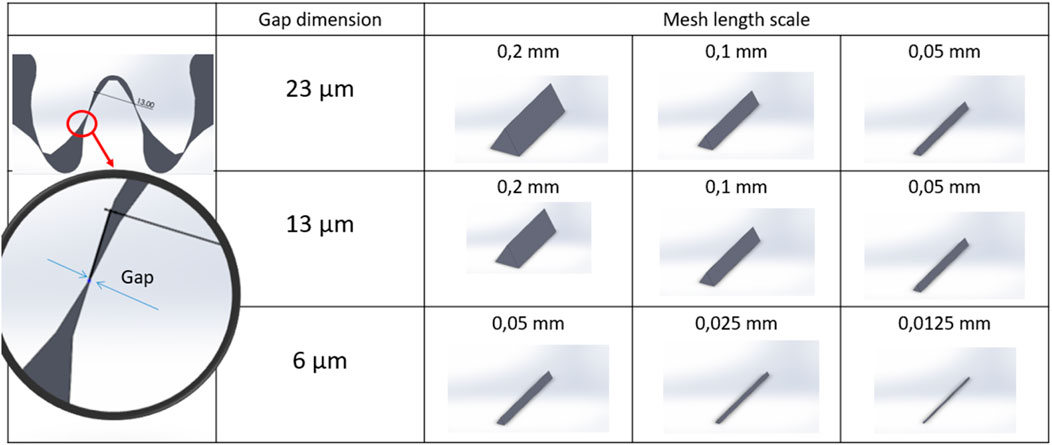
FIGURE 8. Simulated cases vs. gear gap size.
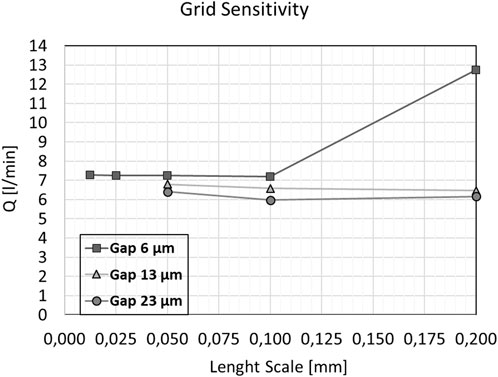
FIGURE 9. Outlet flow rate vs. gear gap size.
Therefore, from the work of Morselli et al. (2019), it can be considered that the numerical accuracy of the model is acceptable with a gear gap of 13 μm and a mesh length scale of 0.1 mm.
4.4 FEM structural sub-model
Following the CFD calculation process, the fluid-dynamic analysis results are coupled with the gear pump structural FEM model to evaluate the structural vibrations of the housing. At first, the CAD geometry is adjusted for the structural simulation: starting from the 3D model supplied by Galtech, the fluid domain previously utilized for the CFD computation, is subtracted from the structural part. A characteristic mesh size of 1 mm is used for the internal surface in direct contact with the gear geometry on which the pressure data is obtained from the CFD computation, whereas a size of 5 mm is applied on the remaining surfaces. A total of 217734 nodes and 1349460 tetrahedral elements compose the structural mesh. The material properties of steel and aluminium are applied to the different parts of the structural mesh, and fixed support boundary conditions constrain the gear pump housing being fixed to the wall.
The pressure data on the internal surface of the gear pump, obtained from the CFD analysis, is then used as loading onto the structural mesh. A specificity of the analysis lies in the changing positions of the nodes inside the moving fluid domain at every time step. Therefore, a numerical interpolation of the loads from the moving mesh to the fixed structural mesh is performed at each time step within the structural analysis.
4.5 FEM vibro-acoustic sub-model
Finally, the vibroacoustic analysis is performed by using the results of the structural simulation to calculate the noise emitted by the vibrating gear pump housing, hence completing the fully integrated approach.
The vibroacoustic FEM model is composed of the structural mesh coupled with a 3D acoustic FEM mesh which contains 6479 nodes and 25248 linear tetrahedral elements (see Miccoli and Hamiche, 2019, for details). This acoustic mesh is suited for a maximum frequency of 3000 Hz, following the rule of two elements per acoustic wavelength (characteristic mesh size of 50 mm): this rule can be relaxed because of the usage of a high-order FEM approach with adaptive order assignment (FEMAO—Finite Element Method with Adaptive Order). As explained by Bériot et al. (2016) FEMAO relies on high-order shape functions to describe the acoustic field, which allows coarsening of the acoustic mesh. The polynomial orders of the hierarchical Lobatto shape functions are then automatically assigned by the solver in each element, based on a given target accuracy, the solving frequency, the local speed of sound, and the element size. As a result, the computational cost is highly reduced, both in terms of calculation time and required memory, with respect to a classical FEM approach. In addition, in order to precisely compute the solution within the computational domain, a non-reflective boundary condition is applied at the exterior surface of the acoustic mesh using an enhanced Perfectly Matched Layer (PML) technique called AML (Automatically Matched Layer). The AML approach (Bériot, 2013) allows to automatically extrude extra layers of elements from the exterior envelope of the acoustic mesh, and a coordinate change is applied in the layer in order to turn the propagative waves into evanescent waves which reach the end of the layer with nearly-zero amplitude. This prevents spurious reflections from reflecting back into the computational domain and polluting the solution.
In addition, full reflective boundary conditions are applied to the surfaces representing the wall and the ground. The structural vibrations from the previous analysis are then coupled with the acoustic model to compute the acoustic pressure at microphones in the vicinity of the gear pump, as shown in Figure 10.
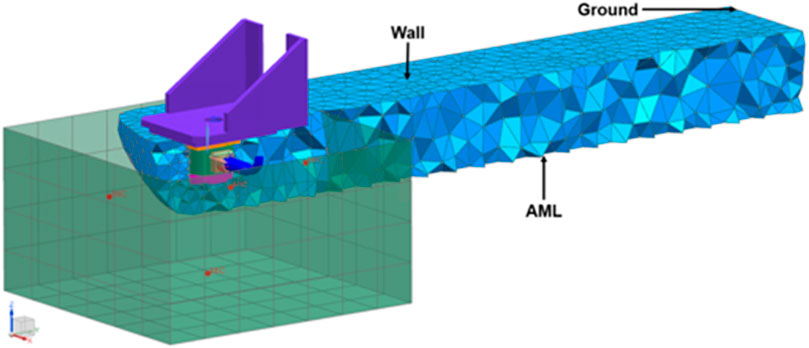
FIGURE 10. Gear pump vibroacoustic model with the acoustic mesh (blue) surrounding the structural mesh, and microphones (translucent green and red dots).
5 Intermediate results
The flow rate in gear pumps is not constant but has a pulsating effect. The reason is that the volume that generates the flow rate, which is the volume between the contact teeth, varies following the wheels’ motion between a minimum and a maximum which corresponds to a minimum and maximum flow rate at the outlet gear pump. Thanks to the CFD simulation it is possible to obtain the trend of the flow rate at the gear pump outlet. This trend is shown in Figure 11 as a function of the simulated time. Green circles on the blue curve mark the instants in time at which the positions of the gears are highlighted in Figure 12. The flow rate trend shows relative maximum and minimum. This is in accordance with the real trend of the outlet flow rate that is fluctuating.
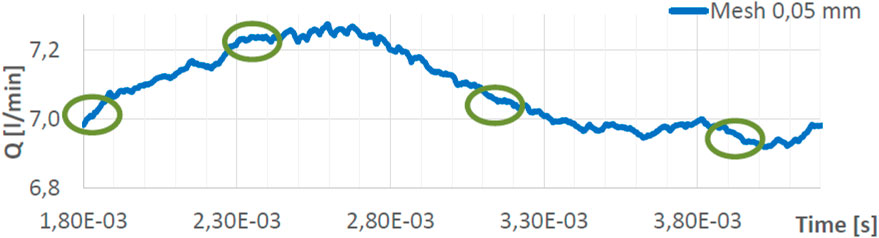
FIGURE 11. Flow rate trend at the gear pump outlet.
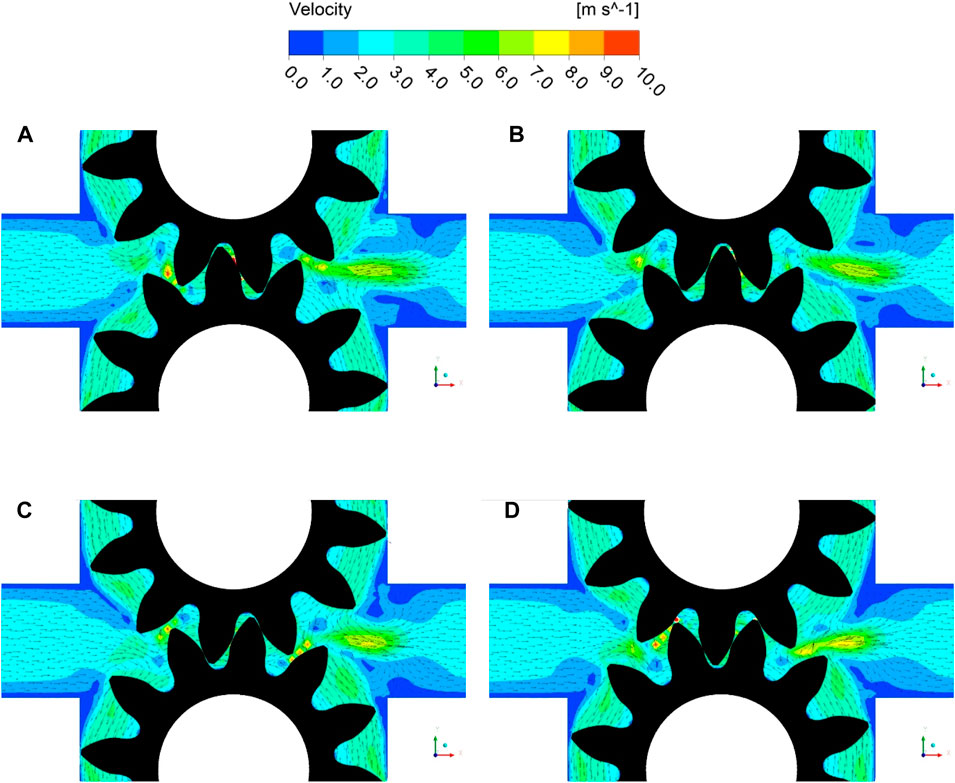
FIGURE 12. Flow rate trend vs. gear pump teeth meshing.
In Figure 12, the velocity gradient in a toothed vane is also visible: the fluid velocity is about 3 m/s and increases up to 8–9 m/s before the meshing of the teeth. The vectors indicate the direction of the flow, which moves in accordance with the movement of the gear. The maximum velocity is observed in narrow passages generated by the teeth movement. In accordance with the continuity equation, the reduction of the passage section must correspond to an increase in flow speed.
Finally, the velocity streamlines are shown in Figure 13. The vortices at the output of the gears are shown. At the simulated volumetric flow rate, it can be observed that the diameter of the contracted vein is about half of the outlet diameter. The flow vortex generated by the interaction between the flow rotation due to the gears’ motion and the longitudinal inlet-outlet direction is also visible.
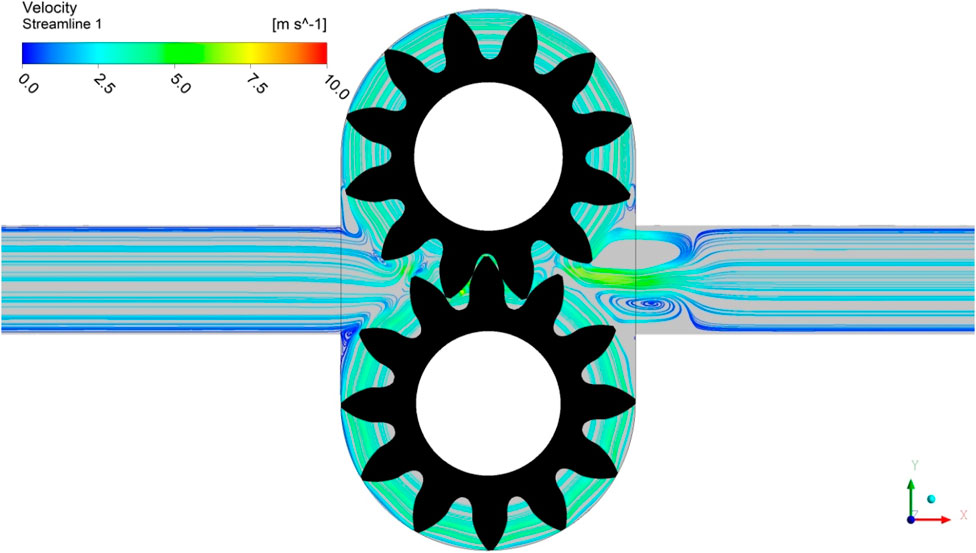
FIGURE 13. Velocity streamline.
Then, the pressure distribution at a given time step is represented in Figure 14. This picture represents the fluid pressure acting on the internal walls of the gear pump. The pressure reaches 5 MPa on the outlet duct, while the minimum and maximum pressure are reached between the gears.
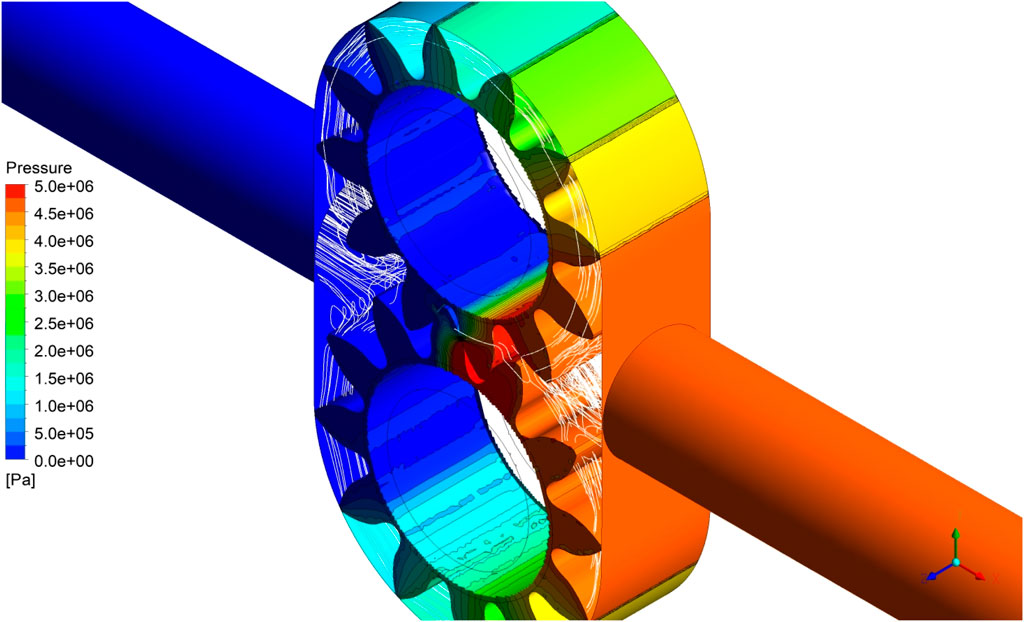
FIGURE 14. Pressure distribution as imported from the CFD results file.
Figure 15 displays the whole pump structural displacement computed with the FEM sub-model at a given time step. The structural deformation is proportional to the pressure increase. In fact, in the intake region, the deformation is low. On the contrary, in the discharge region, the deformation reaches the maximum value.
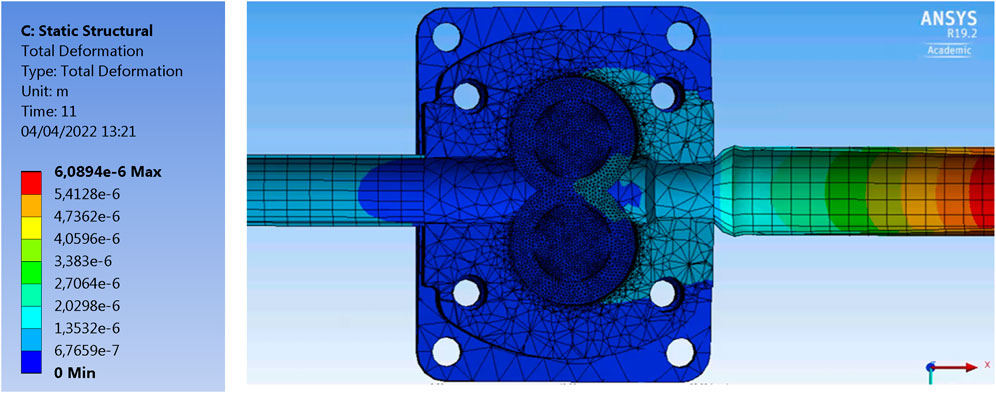
FIGURE 15. Structural displacement at a given time step (
6 Validation with experiments
6.1 Fluid dynamics validation
The validation of the CFD model was done by comparing the experimental curves measured on the test bench with the simulated curves. The comparison was made on the flow rate variable, at the gear pump velocity of 1500 rpm and the pressure of 50 bar. The result is reported in Figure 16.
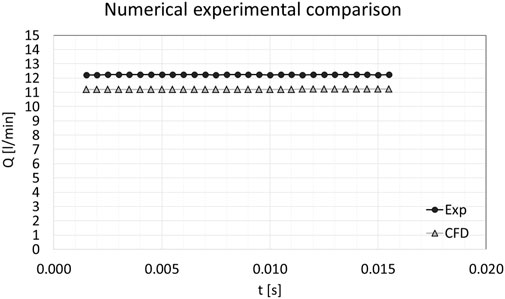
FIGURE 16. Flow rate evolution in time. Numerical/experimental comparison.
6.2 Vibro-acoustic validation
For the validation of the vibroacoustic simulation, sound power calculations based on sound intensity measurements, as well as sound pressure measurements around the pump casing were performed. The sound power spectra of the tested pump were experimentally acquired on a test rig enclosing the pump and complying with the requirements of ISO 16902-1 by sound power measurements (Figure 3 above).
The comparisons between the numerical and experimental results in Miccoli and Hamiche (2019) aimed at confirming that a hybrid approach offers a good compromise between noise prediction accuracy and reduction of experimental modelling requirements: in that paper, the vibrations from measurements at some key locations on the gear pump were used as excitation onto the vibroacoustic model in Simcenter 3D.
Reliable results were found, as per the contour plots of the structural displacements on the surface of the pump and the acoustic pressure on the surrounding microphones, at 1001 Hz (see Figure 17), proving the validity of this strategy.
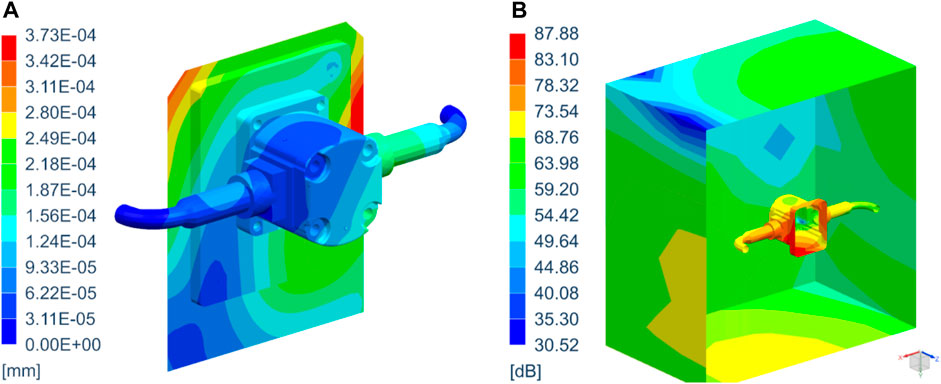
FIGURE 17. Contour plots of the structural displacements (A) and of the acoustic pressure (B) at 1001 Hz.
Moreover, Figure 18 displays the partial sound power difference between the simulation and test for each microphone surface, and for the total microphone surfaces. The good agreement demonstrates the applicability of the fully integrated methodology with deviations lower than 2 dB.
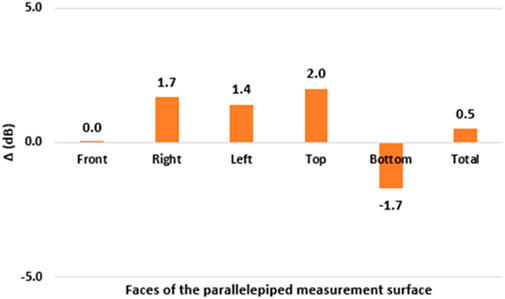
FIGURE 18. Partial and total sound power level differences. Numerical/experimental comparison.
One step further with respect to Miccoli and Hamiche (2019), the authors applied in this paper a full simulation approach to the gear pump case using the resulting displacement data obtained from the CFD analysis and FEM structural sub-model instead of the experimentally acquired acceleration data. As described in Figure 4, the model is completely integrated.
A comparison of the structural displacements on the envelope of the gear pump housing is shown in Figure 19, for the hybrid experimental/numerical approach (left) and the fully integrated numerical approach (right).
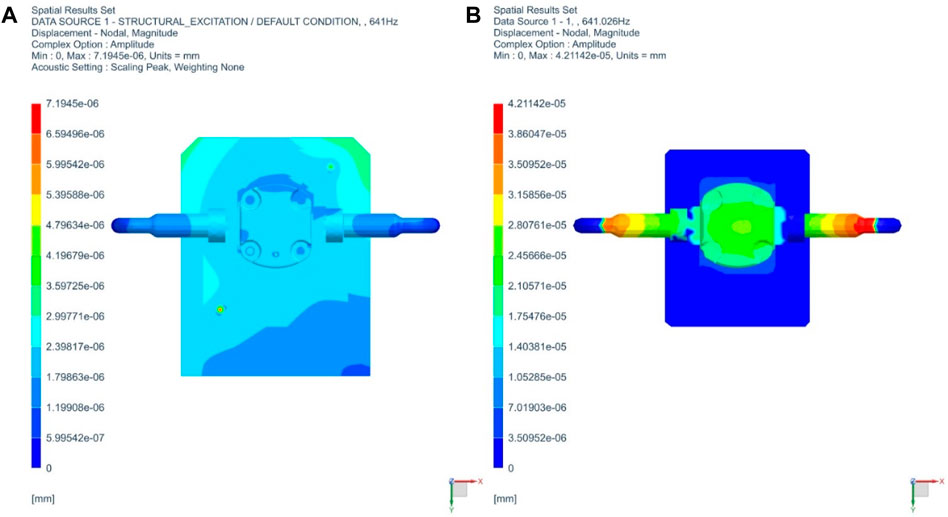
FIGURE 19. Gear pump external case displacement: hybrid experimental/numerical approach from Miccoli and Hamiche (2019) (left), and fully integrated numerical approach (right).
In addition, Figure 20 shows the acoustic power radiated through the top surface in front of the gear pump.
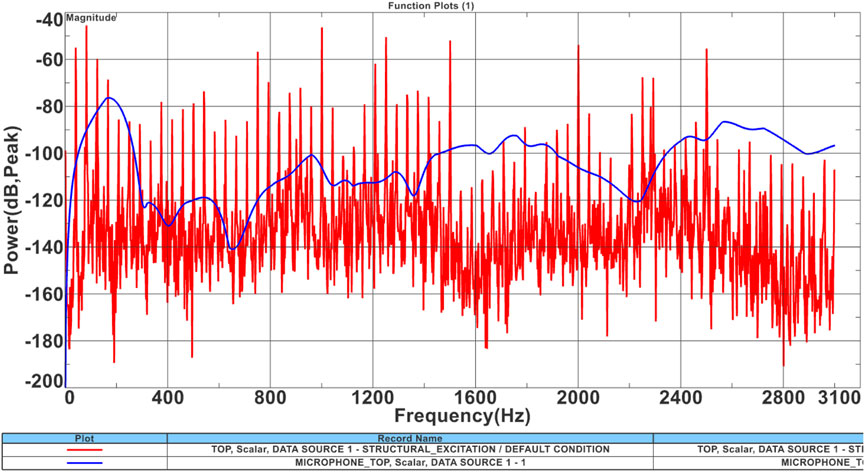
FIGURE 20. Simulated sound power. Numerical/experimental comparison, as presented in Miccoli and Hamiche (2019) (red) and in the model described in this paper (blue).
At first glance, the sound power trend (in blue) must be considered not yet satisfying. However, the curve is approaching the benchmark obtained by Miccoli and Hamiche (2019) (red line) and shows that this proof of concept can be further extended with a more accurate campaign of simulations. In fact, the results obtained here are derived from a limited set of data: the structural vibrations used in the vibroacoustic model were calculated on a reduced time range and for a limited number of time steps, de facto hindering the quality of the subsequent computations. As part of the next study, computing an extended set of structural results should help in improving the quality of the acoustic solution.
7 Conclusion and future perspectives
This paper describes a numerical model able to simulate the gear pump characteristics at different levels including the flow, structural and vibroacoustic behaviours. The fluid dynamics pressure fields calculated on the internal walls of the gear pump (CFD sub-model) were used as loads for the structural simulation (FEM sub-model), and the structural deformation was then applied as an input in the vibroacoustic simulation. It is then possible to obtain the flow field at each time step, for each relative position of the gears, the structural behaviour of the gear pump housing, and the sound distribution, as well as the radiated power.
The connection between the different sub-models can be considered a critical aspect, in particular due to the different scales of the distinct physical phenomena. In fact, for the CFD domain, in order to visualize the gradient of pressure, few in-meshing cycles are sufficient. On the contrary, since the vibro-acoustic simulation is run in the frequency domain, a long enough time signal is necessary in order to obtain a fine-enough frequency resolution of the vibroacoustic response. The difficulties connected to the time-scale problem anyway led to a link between the CFD-FEM structural sub-models and the FEM vibroacoustic model.
Other key elements to consider make the complete simulation of gear pumps a challenge for researchers. For instance: the point of contact between the teeth, the variation of the volumes between the gears, the distance between teeth and housing which is generally unknown, the eccentricity of the gears during the operation, and the deformations at high operating pressures.
Some multi-domain models that take these uncertainties into account have been developed but use analytical models or lumped parameters for the flow. Other researchers have focused on very accurate 3D CFD models but simulating only the fluid domain. This work can be considered a step further, with the combination, in an integrated 3D model, of the three major physical phenomena: fluid dynamics, structure, and acoustics.
Future works are scheduled or in progress to improve the fidelity of the proposed model. For instance, an accurate clearance reduction will be applied to the CFD part in order to reduce deviation from the experimental data. Also, the completion of the structural simulation with an extended time range for the results is planned to increase the accuracy of the acoustic results in the frequency domain.
Another path for improvement regards the consideration of the varying fluid temperature in the hydraulic circuits. In the current work, a constant temperature was applied, neglecting thus these effects: when the fluid temperature increases, the viscosity decreases, less energy is absorbed by the pump, and the volumetric losses increase. The emitted noise is therefore also impacted.
Data availability statement
The raw data supporting the conclusion of this article will be made available by the authors, without undue reservation.
Author contributions
CF: Methodology, Supervision, Writing–review and editing. SM: Investigation, Software, Writing–original draft. GM: Conceptualization, Resources, Writing–review and editing. KH: Formal Analysis, Software, Validation, Writing–review and editing.
Funding
The author(s) declare that no financial support was received for the research, authorship, and/or publication of this article.
Conflict of interest
Author KH was employed by Siemens Digital Industries Software.
The remaining authors declare that the research was conducted in the absence of any commercial or financial relationships that could be construed as a potential conflict of interest.
Publisher’s note
All claims expressed in this article are solely those of the authors and do not necessarily represent those of their affiliated organizations, or those of the publisher, the editors and the reviewers. Any product that may be evaluated in this article, or claim that may be made by its manufacturer, is not guaranteed or endorsed by the publisher.
References
Bériot, H. (2013). The Automatically Matched Layer method for efficient exterior acoustics radiation modelling. Intern. Siemens Commun.
Bériot, H., Prinn, A., and Gabard, G. (2016). Efficient implementation of high-order finite elements for Helmholtz Problems. Int. J. Numer. Methods Eng. 106 (3), 213–240. doi:10.1002/nme.5172
Carletti, E., Miccoli, G., Pedrielli, F., and Parise, G. (2016). Vibroacoustic measurements and simulations applied to external gear pumps: an integrated simplified approach. Archives Acoust. 41 (2), 285–296. doi:10.1515/aoa-2016-0028
Casoli, P., Vacca, A., and Berta, G. L. (2008). “Optimization of relevant design parameters of external gear pumps,” in Proceedings of the 7th JFPS International Symposium on Fluid Power, Japan, September 15-18, 2008 (Toyama), 277–282. 15–18 September.
Castilla, R., Gamez-Montero, P. J., Erturk, N., Vernet, A., Coussirat, M., and Codina, E. (2010). Numerical simulation of turbulent flow in the suction chamber of a gear pump using deforming mesh and mesh replacement. Int. J. Mech. Sci. 52, 1334–1342. doi:10.1016/j.ijmecsci.2010.06.009
Celik, I. B., Ghia, U., Roache, P. J., Freitas, C. J., and Raad, P. E. (2008). Procedure for estimation and reporting of uncertainty due to discretization in CFD applications. ASME J. Fluids Eng. 130 (7). doi:10.1115/1.2960953
Concli, F., et al. (2017). CFD simulation of power losses and lubricant flows in gearboxes. Columbus, Ohio, USA: American Gear Manufacturers Association Fall Technical Meeting, 2–14.
Frosina, E., Senatore, A., and Rogosi, M. (2017). Study of a high-pressure external gear pump with a computational fluid dynamic modeling approach. Energies 10, 1113. doi:10.3390/en10081113
Gorla, C., et al. (2014). A CFD analysis of the oil squeezing power losses of a gear pair. Int. J. Comput. Methods Exp. Meas. 2 (2), 157–167. doi:10.2495/CMEM-V2-N2-157-167
Houzeaux, G., and Codina, R. (2007).A finite element method for the solution of rotary pumps, Comput. Fluids, 36, 667–679. doi:10.1016/j.compfluid.2006.02.005
ISO (1996). Acoustics – determination of sound power levels of noise sources using sound intensity –Part 2: measurement by scanning.
ISO (2002). Hydraulic fluid power – test code for the determination of sound power levels of pumps using sound intensity techniques: Engineering method – Part 1: pumps.
Ivantysyn, J., and Ivantysynova, M. (2003). Hydrostatic pumps and motors. New Delhi, India: Tech Books Int.
Maccioni, L., and Concli, F. (2023). Computational fluid dynamics applied to lubricated mechanical components: review of the approaches to simulate gears, bearings, and pumps. Appl. Sci. Switz. 10 (24), 8810–8829. art. no. 8810. doi:10.3390/app10248810
Mancò, S., and Nervegna, N. (1989). “Simulation of an external gear pump and experimental verification,” in Proceedings of the JHPS International Symposium on Fluid Power, Tokyo, Japan, December 05, 2011 (IEEE), 13.
Mastrone, M. N., and Concli, F. CFD simulations of gearboxes: implementation of a mesh clustering algorithm for efficient simulations of complex system’s architectures (2021) Int. J. Mech. Mater. Eng., 16 (1, art. n. 12. doi:10.1186/s40712-021-00134-6
Miccoli, G., Carletti, E., Pedrielli, F., and Parise, G. (2016). Simplified methodology for pump acoustic fiekd analysis: the effect of different excitation boundary conditions. Hamburg: Proceeding Internoise Congress.
Miccoli, G., and Hamiche, K. (2019). Efficient finite element simulations to compute gear pump noise from vibrational experimental measurements, Proceedings of the 26th International Congress on Sound and Vibrations. Montreal: Canada, 7–11.
Morselli, S., and Ferrari, C. (2019). Computational fluid dynamic model of a gear pump leakages by using a dynamic mesh, 35th international CAE conference and exhibition. Italy: Vicenza, 28–29.
Morselli, S., Ferrari, C., Beccati, N., and Marani, P. (2019). Sensitivity analysis on a CFD model for prediction of a gear pump leakages. Workshop Front. Uncertain. Quantification Fluid Dyn. Pisa, Italy 11.
Morselli, S., Hamiche, K., Ferrari, C., and Miccoli, G. (2021). “Noise prediction of external gear pumps via multiphysics aero-fluid-structural simulation,” in Proceedings of the 27th international congress on sound and vibrations (USA: ICSV), 11–15.
Mucchi, E., Rivola, A., and Dalpiaz, G. (2014). Modelling dynamic behaviour and noise generation in gear pumps: procedure and validation. Appl. Acoust. 77, 99–111. doi:10.1016/j.apacoust.2013.10.007
Mucchi, G., and Dalpiaz, G. (2012). “Numerical vibro-acoustic analysis of gear pumps for automotive applications,” in Proceedings of the 25th International Conference on Noise and Vibration engineering, Belgium, 17–19 September 2012 (Leuven).
Opperwall, T., and Vacca, A. (2014). “Modeling noise sources and propagation in displacement machines and hydraulic lines,” in Proceedings of the 9th JFPS International Symposium on Fluid Power, Matsue, Japan, 28–31 October 2014 (Shimane).
Ozsoy, M., and Kurnaz, C. (2017). An optimization study of a hydraulic gear pump cover with finite element method. Acta Phys. Pol. A 132 (No. 3-II), 944–948. doi:10.12693/aphyspola.132.944
Rundo, M., Models for flow rate simulation in gear pumps: a review, Energies 2017 Vol. 10, 1261. doi:10.3390/en10091261
Shih, T.-H., Liou, W. W., Shabbir, A., Yang, Z., and Zhuj, H. (1995). A new k-ϵ eddy viscosity model for high Reynolds number turbulent flows. Comput. Fluids 24 (3), 227–238. doi:10.1016/0045-7930(94)00032-t
Jędraszczyk, P., and Fiebig, W. (2017). CFD model of an external gear pump. Lect. Notes Mech. Eng., 221–231. doi:10.1007/978-3-319-50938-9_23
Tang, C., Wang, Y. S., Gao, J. H., and Guo, H. (2014). Fluid-sound coupling simulation and experimental validation for noise characteristics of a variable displacement external gear pump. Noise Control Eng. J. 62, 123–131. doi:10.3397/1/376212
Wang, S., Sakurai, H., and Kasarekar, A. (2011). The optimal design in external gear pumps and motors. IEEE/ASME Trans. Mechatronics 16 (No 5), 945–952. doi:10.1109/TMECH.2010.2058860
Woo, S., Opperwall, T., Vacca, A., and Rigosi, M., Modeling noise sources and propagation in external gear pumps, Energies 2017, 10(7), 1068. doi:10.3390/en10071068
Keywords: CFD, FEM, vibro-acoustics, simulation, gear pumps, remeshing, sound power, multi-domain simulation
Citation: Ferrari C, Morselli S, Miccoli G and Hamiche K (2024) Integrated CFD-FEM approach for external gear pump vibroacoustic field prediction. Front. Mech. Eng 10:1298260. doi: 10.3389/fmech.2024.1298260
Received: 21 September 2023; Accepted: 17 January 2024;
Published: 07 March 2024.
Edited by:
Seyyed Hossein Hosseini, University of Ilam, IranReviewed by:
Franco Concli, Free University of Bozen-Bolzano, ItalyMahmood Reza Rahimi, Yasouj University, Iran
Copyright © 2024 Ferrari, Morselli, Miccoli and Hamiche. This is an open-access article distributed under the terms of the Creative Commons Attribution License (CC BY). The use, distribution or reproduction in other forums is permitted, provided the original author(s) and the copyright owner(s) are credited and that the original publication in this journal is cited, in accordance with accepted academic practice. No use, distribution or reproduction is permitted which does not comply with these terms.
*Correspondence: Cristian Ferrari, cristian.ferrari@stems.cnr.it