Automatic rolling bearings fault classification: a case study at varying speed conditions
 Nguyen Trong Du
 Pham Thanh Trung
 Nguyen Huu Cuong
 - School of Mechanical Engineering, Hanoi University of Science and Technology, Hanoi, Vietnam
Rolling bearings always operate under variable speed conditions, which poses a challenge for researchers in identifying and classifying bearing faults. In contrast to the stationary speed condition, the Fault Characteristic Frequency (FCF) under variable speed conditions exhibits a variable value that depends on the instantaneous shaft rotational speed (ISRS). The representation of the FCFs in the frequency domain reveals overlapping patterns among them. To solve the mentioned problem, a novel tool is proposed and established by mixing the two methods: The Fourier-based SynchroSqueezing transform (FSST) and Principal Component Analysis (PCA). By illustrating the envelope signal in time-frequency distribution using FSST, the FCF is highlighted in each ISRS value. Finally, this time-frequency distribution is used as input of PCA to classify rolling bearings. This method successfully diagnosed both inner race fault and outer race fault of rolling bearings.
1 Introduction
The rolling bearing plays an important role as a fundamental component within mechanical systems, making detecting faults in rolling bearings an essential objective in technical vibration diagnosis (Malla and Panigrahi, 2019). Under stable rotation speed conditions, vibration signal analysis can easily capture bearing fault characteristic frequencies. However, rolling bearings usually operate under variable rotational speed, challenging detection faults. When illustrating the signal in the envelope domain, the impulse frequencies vary with survey time in the case of varying rotational speed. Thus, applying the traditional envelope analysis method at constant rotational speed will bring false diagnosis results.
Recently, rolling bearing fault diagnostics under non-stationary conditions has become a key topic with researchers. Most popular methods remove the effect of non-stationary conditions by using order tracking. Dien and Du, 2020 used generalized demodulation to separate envelope orders and computed order tracking to detect the rolling bearing fault. Wang et al., 2014 removed the smearing effect of varying speed to present fault characteristic frequency order and then used envelope order tracking to diagnose the rolling bearing fault. However, these methods required assistant devices such as a tachometer or encoder (Di Lorenzo et al., 2017; Randall, 2017). It will increase the measurement cost and make it difficult to install.
The time-frequency representation (TFR) can identify the signal frequency components and disclose their time-varying characteristic (Zhang, 2019). This advantageous capability makes it particularly suitable for diagnosing rolling bearings under non-stationary conditions. There are several methods of converting a signal into TFR, such as continuous wavelet transform (CWT) (Kamiel et al., 2020), Short-time Fourier transform (Xu et al., 2020), and The Fourier-based Synchrosqueezing Transform (Ke et al., 2021). Among those methods, FSST provides more accurate frequency curves in both the time and frequency domains than STFT and CWT. Less important frequency components will be filtered out by FSST with appropriate window parameters, keeping main frequencies. In addition, FSST maintains the consistency and interpretability of Fourier analysis, making it easy to relate the results to the fundamental frequency components of the signal. By extracting the features of rolling bearing vibration, it becomes possible to obtain an intuitive representation of FCF over survey time.
When vibration signals are converted to TFR, general indicators can be calculated to extract feature value s (Shukla et al., 2015) in each frequency component. Calculating indicators following the time axis of TFR avoids the frequency overlapping effect of varying rotation speed. However, not all indicators are useful as input to an automatic classification model. If all indicators are the input, the classification results can be low accuracy and waste computing sources. So, Principal Component Analysis converts high-dimensional general indicators to a lower-dimensional feature vector while preserving the most important information. Thus, this work proposes a method based on time-frequency analysis using FSST and PCA to automatically classify rolling bearing faults under time-varying speeds with three classifications—normal, inner, and outer fault. The contributions of the proposed approach are as follows:
(1) In industry, rolling bearings do not operate independently but often function in conjunction with other components, resulting in various sources of noise signals. Hence, it is necessary to employ noise filtering methods for the rolling bearing signal. Tunable Q-factor Wavelet Transform (TQWT) can decompose signals into different frequency components, so the effect of random frequencies can be exactly removed.
(2) The FSST is more accurate than CWT or STFT in representing instantaneous frequencies in case of variable rotation speed. The FSST clarifies the overlapped frequency components. The frequency lines are precisely compressed, which reduces noise frequency components to obtain reliable calculating results.
(3) Finding feature values of a signal that can be clustered clearly on a graph helps minimize misclassification in automatic classification results. Calculating the PCA of GIs for each frequency component is an effective feature extraction from TFR in separating data into clusters.
(4) With varying rotational speeds, classifying solely through deep learning is impossible. The proposed method has proved its effectiveness with an appropriate feature extraction, resulting in low computational cost and high accuracy, making it suitable for low-profile devices.
The remainder of this paper is structured as follows: Section 2 mentions the background theory of FSST and PCA, then details the processing scheme of this proposed method. Next, Section 3 demonstrates the experiment test, and the conclusion is given in the last section.
2 Principle of the proposed method
2.1 Clarifying varying rotation speed effect
2.1.1 Noise filter
Acquired signals often contain background noise from environments. TQWT has effectively denoised bearing vibration signals (Du et al., 2022). Figure 1 shows the TQWT flowchart. As Figure 1 shows, the TQWT method decomposes a signal into sub-signals, removes random frequencies in the sub-signals, and finally reconstructs the pure vibration signal. Separating small components makes identifying periodic and non-periodic components easier over time. From there, the circulatory component caused by machine parts, including rolling bearings, can be retained.
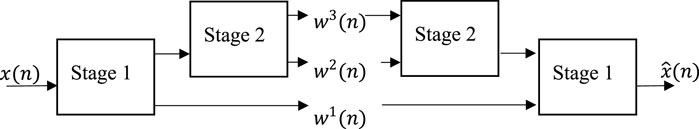
Figure 1. The TQWT flowchart.
2.1.2 Envelope spectrum analysis
Analyzing the envelope spectrum is an essential step in rolling bearing signal processing. The envelope of a vibration signal provides the capability to identify the causes of vibration or to recognize the parameters of a vibration system, such as meshing frequency and fault characteristic frequency (Wang et al., 2018). The envelope signal reflects crucial information regarding the amplitude of the oscillations and any abnormal events occurring during the operation of the machine. The technique of transforming the signal envelope is based on the Hilbert Transform in the time domain.
2.1.3 The Fourier-based Synchrosqueezing tranform
The FSST method was first introduced by Gaurav Thakur and colleagues in 2013 (Thakur et al., 2013). This technique has become popular and is used in many application areas, such as audio signal processing, image processing, and biological signal analysis. The FSST method performs a standard Fourier Transform on the signal to determine its frequency content. However, instead of simply representing frequency content as a function of time, FSST uses a nonlinear compression operation to emphasize time-frequency contours in the signal. This compression operation is performed by multiplying the Fourier coefficients by a window function chosen to match the local instantaneous frequency of the signal. Compression results in a new set of coefficients more closely related to the original signal structure. FSST then takes the inverse Fourier Transform of the compressed coefficients to obtain a time-frequency representation of the signal that emphasizes its important features. Compared with other time-frequency analysis techniques, FSST has many advantages. It can capture the time-varying behavior of a signal with high accuracy, even when the signal is unstable or nonlinear. It can also separate overlapping frequency components in the signal that would be difficult to distinguish using other methods.
The key point of the FSST method is to represent the “fuzzy” STFT of f using the instantaneous rotating frequency at time t and the frequency η (Pham and Meignen, 2017) as Eq. (1) and Eq. (2) below:
where
2.2 Feature values
2.2.1 Evaluate statistical feature
General indicators (GI) represented in Table 1, such as root mean square (RMS), standard deviation (STD), and Crest Factor (CF), are commonly used in signal processing and data analysis to quantitatively describe various characteristics of a signal. Because TFR contains time domain signals in each frequency component, GI can be calculated regardless of varying speed. These indicators are calculated as follows:
Table 1. General indicator formula.
2.2.2 Principal component analysis
Principal Component Analysis is a multivariate data analysis method aimed at reducing the dimensionality of the problem at hand. Its primary objective is to identify linear relationships among variables that capture the overall patterns of data variations (Zhao et al., 2019). Mathematically, the orthogonal decomposition of data variations is the signal’s feature components. PCA is a linear transformation that converts original data into a reduced set of explanatory variables called principal components. These principal components are uncorrelated with each other and can replace a large number of correlated explanatory variables. The brief algorithm for PCA is outlined as Eqs 3–8 below (Jafarian et al., 2016):
1. Selecting data to compute matrix.
2. Finding characteristic values and characteristic vectors.
where
3. Reducing matrix dimensions of characteristic vectors.
4. Computing data related to the main system coordinate.
5. Calculating the different amounts of data related to the main coordinate at every moment.
6. Computing the remaining amount in every moment.
2.3 The proposed flowchart
Combining these methods, the data is processed according to the flowchart in Figure 2. The proposed method is PCA of general indicators of FSST. Feature values of the signal are extracted step by step. First, the signal is converted into TQWT formation to reduce the noise in the frequency spectrum. Then, the FSST method is employed to obtain the time-frequency distribution (TFD) of rolling bearing operated in varying rotating speed conditions over time. From the TFD, the bearing’s conditions are verified based on the fault characteristic frequencies. The next step calculates the GI in the time domain to evaluate each frequency component. The PCA of general indicators is the feature values of the signal, which are inputs of automatic classifier models. Finally, the input is trained by six classifier models to verify the type of bearing fault and evaluate the effectiveness of the models.
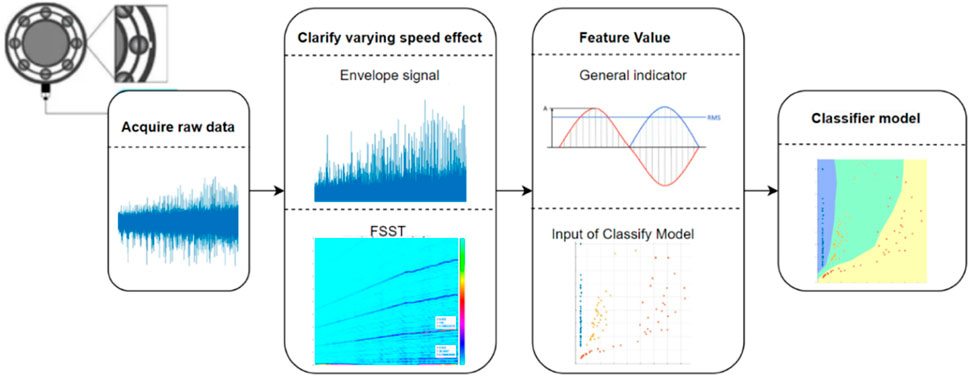
Figure 2. The proposed method in flowchart.
3 Experiment evaluations
3.1 Effectiveness of the feature extraction method
An experiment test rig is performed at the Fault Diagnostic Laboratory, Hanoi University of Science and Technology (HUST), to demonstrate the proposed method effectively. The experimental setup is depicted in Figure 3. A three-phase motor drives the rotating shaft, and an AC drive controls to change the shaft rotational speed. A magnetic brake is connected to the remaining part of the shaft to create a load during the investigation process. Two ER16 rolling bearings are attached to the rotating shaft. The rolling bearing on the right is a normal bearing without any faults, while the other rolling bearing is the one under investigation, where rolling bearing faults are replaced at this position. Investigation bearings are “normal,” “inner race fault,” and “outer race fault.” The Endevco 2228C accelerometer is mounted in the housing of the investigated rolling bearing along the radial direction and stored at a sampling frequency of 20 kHz. The speed of the rotating shaft is driven from 13 Hz to 24.4 Hz in 10 s, and the load level of the magnetic brake is 5 Nm. 10 signal samples are acquired for each fault type. The acquired signals are filtered by a bandpass band in a measurement device and pre-processed by TQWT to obtain original signals. The parameters of the rolling bearing are provided in Table 2.
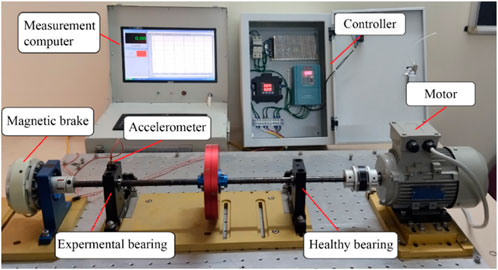
Figure 3. Experimental setup.

Table 2. Experimental bearing parameter.
The faulty rolling bearing exhibits inner and outer race faults, and the fault characteristic frequencies for each type of fault are determined as follows by Eq. (9) and Eq. (10):
Detecting and diagnosing rolling bearing faults involves analyzing the FCF. Each fault category corresponds to its unique FCF, directly related to the operational rotational frequency. The coefficient determining the FCF is based on the bearing’s structural parameters. The FCF of the Inner Race (FCFI) can be calculated by multiplying the FCF coefficient, FCFI = 5.43 fr, with the shaft’s rotational frequency (fr), and the FCF of the Outer Race (FCFO) can be expressed as FCFO = 3.57 fr.
First, the raw signals are converted into envelope signals and then FSST. Figures 4A,B, respectively illustrate the envelope spectrum and TFR of rolling bearing with fault. The effect of varying frequency blurs the envelopes. It is impossible to detect the shaft frequency and the FCF directly. Converting the envelope spectrum into TFR separates the effect of varying frequency to the time domain. The FCF with high amplitude is highlighted in the TFR. The inner race fault can be manually detected with FCFI = 133/24.4 = 5.45 fr.
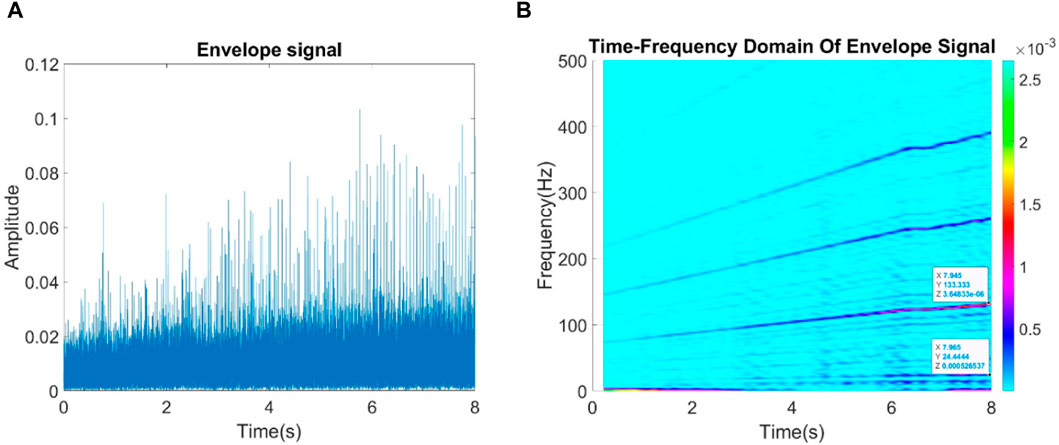
Figure 4. Processing envelope signal by: (A) Envelope spectrum; (B) Time-Frequency representation.
With input data, which is applied to the FSST transform, the general indicators of TFR are calculated. Then, the PCA is executed to obtain feature values. Figure 5 represents the scatter plot of two principal components, and input data are concentrated into separate clusters, which create favorable conditions for the classification step.
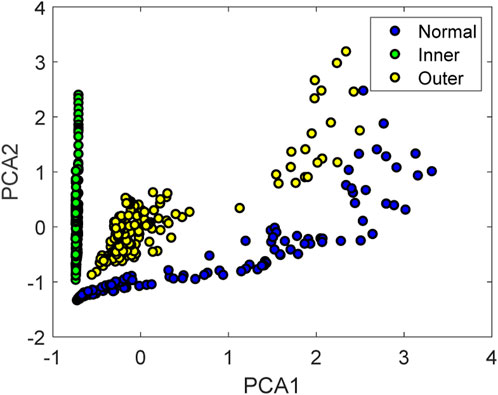
Figure 5. Scatter plot PCA of general indicators of FSST.
Table 3 compares six classifier models about accuracy and time training cost. These training sessions are implemented on the same computer with the same parameters: 4-fold cross-validation, learning rate 0.01, max epoch 20. Figure 6 shows that the Support Vector Machine (SVM) achieves the highest classification accuracy. However, the training time cost of the Nearest Neighbor Classifier (NNC) is twice as low as SVM with similar accuracy. Thus, the Nearest Neighbor Classifier is the most effective for automatically classifying bearing faults.
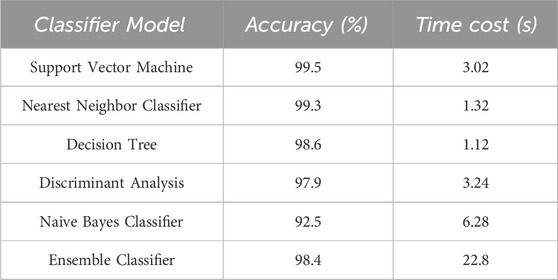
Table 3. Classifer models comparison in detail.
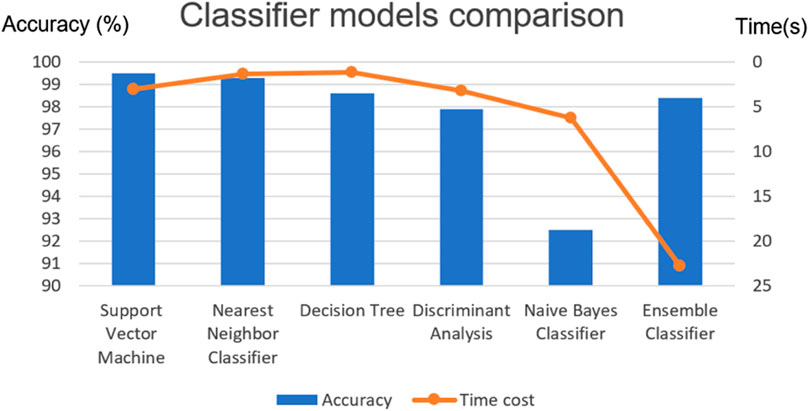
Figure 6. Box plot of classifier models comparison.
After classifying roller bearing faults by NNC, the color map in Figure 7 visually distinguishes between different fault regions. As a result, the model successfully built boundaries to classify three fault types of bearing. The obtained classification result demonstrates the effectiveness of time-frequency distribution in detecting rolling bearing faults under varying rotation speed conditions.
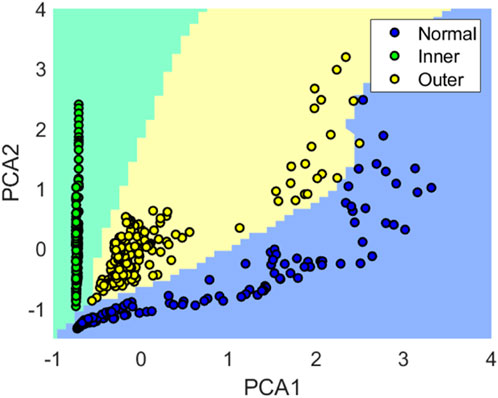
Figure 7. Classify the result of NNC.
Figure 8 shows the confusion matrix, the results of which are classified by NNC. The confusion matrix points out that two fault types, “normal” and “outer race fault,” are confused, which is caused by the varying rotation speed effect. The matrix also indicates that “inner race faults” are significant and easily detectable.
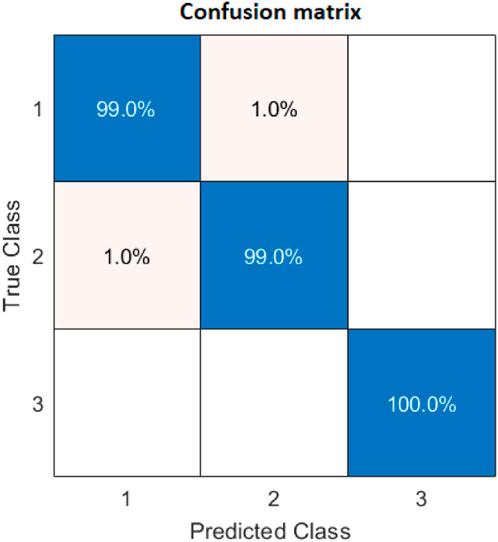
Figure 8. Confusion matrix of NNC results.
3.2 Comparisons with deep learning models
To demonstrate the advancement of the proposed model for fault diagnosis in variable speed conditions of bearings, Convolution Neural Networks are added for comparison: Transfer Learning ResNet-50 (Wen et al., 2020). While the proposed method focuses on feature extraction, the transfer learning method focuses on automatically learning features. The main idea of transfer learning is converting a time domain signal into a gray image, then training by ResNet-50. To ensure the fairness of the comparison experiments, all the models are executed from raw signals to classified results with the same input parameters. 20% of 180 data is split for validation dataset. All the models use the same dataset stop training at an accuracy of 90%. Table 4 compares two classification methods in detail. This table proves that feature extraction is essential for an effective classification method. In addition, the training accuracy of transfer learning can not reach 60% because of the varying speed effect in the raw data.
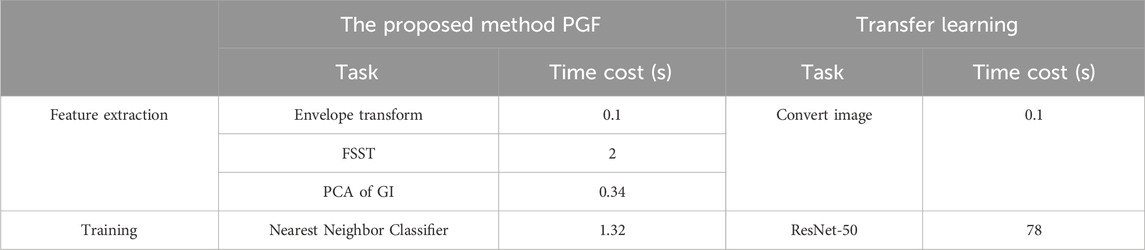
Table 4. Classification method comparison.
4 Conclusion
Early detecting faults can significantly reduce maintenance time and cost for rotating machines. The authors presented an automatic method for classifying rolling element bearing faults under varying rotational speeds. The feature values of the rolling bearing vibration signal are extracted by calculating the PCA of general indicators of TFR of the envelope signal. The classification results achieved an accuracy of 99.5% with three classifications: normal, inner race fault, and outer race fault. It can be said that the proposed feature extraction has successfully created an effective tool for classifying faults in rolling element bearings. This application can potentially decrease the dependency on experts in the diagnosis process. Moreover, it enables online diagnosis, where vibration signal data is collected from many remote power plants.
However, if the bearing rapidly changes speed, the general indicator of each fault type is not separate from each other, making classifying less accurate. Although splitting signals into small signals with only increased or decreased speed can solve the rapid change, TFR cannot represent signals with high resolution. So, the rapid change speed requires more research in the future.
Data availability statement
The original contributions presented in the study are included in the article/Supplementary material, further inquiries can be directed to the corresponding author.
Author contributions
NTD: Conceptualization, Formal Analysis, Investigation, Methodology, Software, Writing–original draft, Writing–review and editing, Supervision, Validation. PTT: Conceptualization, Data curation, Formal Analysis, Investigation, Methodology, Resources, Software, Writing–original draft. NHC: Conceptualization, Investigation, Software, Visualization, Writing–original draft, Data curation. NPD: Data curation, Funding acquisition, Methodology, Project administration, Resources, Supervision, Validation, Visualization, Writing–review and editing.
Funding
The author(s) declare that no financial support was received for the research, authorship, and/or publication of this article.
Acknowledgments
We would like to acknowledge the support and assistance provided by research topics T2022-PC-027 of Hanoi University of Science and Technology.
Conflict of interest
The authors declare that the research was conducted in the absence of any commercial or financial relationships that could be construed as a potential conflict of interest.
Publisher’s note
All claims expressed in this article are solely those of the authors and do not necessarily represent those of their affiliated organizations, or those of the publisher, the editors and the reviewers. Any product that may be evaluated in this article, or claim that may be made by its manufacturer, is not guaranteed or endorsed by the publisher.
References
Dien, N. P., and Du, N. T. (2020). “Fault detection for rotating machines in non-stationary operations using order tracking and cepstrum,” in Advances in engineering research and application: proceedings of the international conference on engineering research and applications, ICERA 2019 (Berlin, Germany: Springer), 349–356.
Di Lorenzo, E., Manzato, S., Peeters, B., Marulo, F., and Desmet, W. (2017). “Best practices for using order-based modal analysis for industrial applications,” in Topics in modal analysis and testing (Cham: Springer International Publishing), 69–84.
Du, N. T., Dien, N. P., and Cuong, N. H. (2022). “Detection Fault symptoms of rolling bearing based on enhancing collected transient vibration signals,” in The AUN/SEED-Net joint regional conference in transportation, energy, and mechanical manufacturing engineering (Singapore: Springer Nature Singapore), 373–384.
Jafarian, K., Darjani, M., and Honarkar, Z. (2016). “Vibration analysis for fault detection of automobile engine using PCA technique,” in 2016 4th International Conference on Control, Instrumentation, and Automation (ICCIA), Qazvin, Iran, January, 2016, 372–376. doi:10.1109/ICCIAutom.2016.7483191
Kamiel, B. P., Arianto, A., and Rahman, M. B. N. (2020). “Identification of gear faults in an industrial fan prototype using spectrum analysis and continuous wavelet transform,” in 2020 1st International Conference on Information Technology, Advanced Mechanical and Electrical Engineering (ICITAMEE), Yogyakarta, Indonesia, October, 2020 (IEEE), 303–308.
Ke, L., Zhang, Y., Yang, B., Luo, Z., and Liu, Z. J. N. (2021). Fault diagnosis with synchrosqueezing transform and optimized deep convolutional neural network: an application in modular multilevel converters. Neurocomputing 430, 24–33. doi:10.1016/j.neucom.2020.11.037
Malla, C., and Panigrahi, I. (2019). Review of condition monitoring of rolling element bearing using vibration analysis and other techniques. J. Vib. Eng. Technol. 7 (4), 407–414. doi:10.1007/s42417-019-00119-y
Pham, D. H., and Meignen, S. (2017). High-order synchrosqueezing transform for multicomponent signals analysis—with an application to gravitational-wave signal. IEEE Trans. Signal Process. 65 (12), 3168–3178. doi:10.1109/TSP.2017.2686355
Randall, R. B. (2017). A history of cepstrum analysis and its application to mechanical problems. Mech. Syst. Signal Process. 97, 3–19. doi:10.1016/j.ymssp.2016.12.026
Shukla, S., Yadav, R. N., Sharma, J., and Khare, S. (2015). “Analysis of statistical features for fault detection in ball bearing,” in 2015 IEEE International Conference on Computational Intelligence and Computing Research (ICCIC), Madurai, India, December, 2015.
Thakur, G., Brevdo, E., Fučkar, N. S., and Wu, H.-T. (2013). The Synchrosqueezing algorithm for time-varying spectral analysis: robustness properties and new paleoclimate applications. Signal Process. 93 (5), 1079–1094. doi:10.1016/j.sigpro.2012.11.029
Wang, T., Liang, M., Li, J., and Cheng, W. (2014). Rolling element bearing fault diagnosis via fault characteristic order (FCO) analysis. Mech. Syst. Signal Process. 45 (1), 139–153. doi:10.1016/j.ymssp.2013.11.011
Wang, Y., Liu, Z., Jiang, C., and Zhang, S. J. O. e. (2018). Motion induced phase error reduction using a Hilbert transform. Opt. Express 26 (26), 34224–34235. doi:10.1364/oe.26.034224
Wen, L., Li, X., and Gao, L. (2020). A transfer convolutional neural network for fault diagnosis based on ResNet-50. Neural Comput. Appl. 32 (10), 6111–6124. doi:10.1007/s00521-019-04097-w
Xu, L., Chatterton, S., Pennacchi, P., and Liu, C. J. S. (2020). A tacholess order tracking method based on inverse short time fourier transform and singular value decomposition for bearing fault diagnosis. Sensors (Basel) 20 (23), 6924. doi:10.3390/s20236924
Zhang, Z. J. E. S. P. (2019). Spectral and time-frequency analysis, in EEG signal processing and feature extraction (Berlin, Germany: Springer), 89–116.
Keywords: vibration, rolling bearing, fault diagnosis, Hilbert transform, short-time Fourier transform-based SynchroSqueezing transform, principal component analysis
Citation: Du NT, Trung PT, Cuong NH and Dien NP (2024) Automatic rolling bearings fault classification: a case study at varying speed conditions. Front. Mech. Eng 10:1341466. doi: 10.3389/fmech.2024.1341466
Received: 20 November 2023; Accepted: 15 March 2024;
Published: 02 April 2024.
Edited by:
Minh-Quang Tran, National Taiwan University of Science and Technology, TaiwanReviewed by:
Mahmoud Elsisi, National Kaohsiung University of Science and Technology, TaiwanBin Yang, Xi’an Jiaotong University, China
Copyright © 2024 Du, Trung, Cuong and Dien. This is an open-access article distributed under the terms of the Creative Commons Attribution License (CC BY). The use, distribution or reproduction in other forums is permitted, provided the original author(s) and the copyright owner(s) are credited and that the original publication in this journal is cited, in accordance with accepted academic practice. No use, distribution or reproduction is permitted which does not comply with these terms.
*Correspondence: Nguyen Trong Du, du.nguyentrong@hust.edu.vn