Innovative framework for effective service parts management in the automotive industry
 B. Sendhil Nathan1,2
  B. Veera Siva Reddy1*
  C. Chandrasekhara Sastry3*
  J. Krishnaiah4
  K. V. Eswaramoorthy5
- 1Research Scholar, Department of Mechanical Engineering, Indian Institute of Information Technology Design and Manufacturing Kurnool (IIITDMK), Kurnool, India
- 2Ford Motor Private Limited, Chennai, India
- 3Assistant Professor, Department of Mechanical Engineering, Indian Institute of Information Technology Design and Manufacturing Kurnool (IIITDMK), Kurnool, India
- 4Associate Professor, Department of Mechanical Engineering, Indian Institute of Information Technology Design and Manufacturing Kurnool (IIITDMK), Kurnool, India
- 5Assistant Professor, Department of Electronics and Communication Engineering, Indian Institute of Information Technology Design and Manufacturing Kurnool (IIITDMK), Kurnool, India
Effective service parts management and demand forecasting are crucial for optimizing operations in the automotive industry. However, existing literature lacks a comprehensive framework tailored to the specific context of the Thai automotive sector. This study addresses this gap by proposing a strategic approach to service parts management and demand forecasting in the Thai automotive industry. Drawing on a diverse set of methodologies, including classical time series models and advanced machine learning techniques, various forecasting models were assessed to identify the most effective approach for predicting service parts demand. Categorization of service parts based on demand criteria was conducted, and decision rules were developed to guide stocking strategies, balancing the need to minimize service disruptions with cost optimization. This analysis reveals substantial cost savings potential through strategic stocking guided by the developed decision rules. Furthermore, evaluation of the performance of different forecasting models recommends the adoption of Support Vector Regressor (SVR) as the most accurate model for forecasting service parts demand in this context. This research contributes to the automotive service industry by providing a nuanced framework for service parts management and demand forecasting, leading to cost-effective operations and enhanced service quality. The findings offer valuable insights for practitioners and policymakers seeking to improve efficiency and sustainability in the Thai automotive sector.
1 Introduction
1.1 Automotive service parts management
The automotive industry faces a critical challenge in managing service parts effectively. Beyond being a logistical puzzle, it stands as a strategic necessity (Kato and Manchidi, 2022). With vehicles becoming more complex and customer expectations reaching new heights, the seamless flow of service parts from manufacturers to end-users is paramount (Jiao et al., 2021). This paper meticulously navigates the complexities of service parts management and demand forecasting within the unique context of the Thai automotive industry. It introduces innovative strategies and methodologies aimed at reshaping manufacturers’ approaches to this critical operational facet.
Within the intricate dynamics of the automotive sector, maintaining optimal stock levels for service parts is a multifaceted challenge (Cardeal et al., 2023). Excessive inventory risks bloated holding costs and parts obsolescence, while insufficient stocking may lead to prolonged vehicle downtimes and reputational damage (Ding and Li, 2021). In the distinctive landscape of the Thai automotive industry, marked by unique market dynamics, consumer preferences, and intricate supply chain nuances, a nuanced and data-driven approach to service parts management becomes imperative (Aunyawong et al., 2020).
Figure 1 visually encapsulates the intricacies of the automotive supply chain, portraying the diverse stakeholders involved, ranging from manufacturers and suppliers to distributors, retailers, and end customers. This high-level overview underscores the interdependence of these entities, emphasizing the need for a holistic approach to service parts management that encompasses the entire supply chain ecosystem (Min et al., 2019). The figure serves as a prelude to an in-depth exploration of the proposed methodology, highlighting the importance of aligning service parts management strategies with broader supply chain dynamics.

Figure 1. A high-level overview of the various stakeholders in the supply chain.
At the heart of this paper lies a systematic methodology, integrating historical sales data, well-defined part classifications, and strategic decision rules. These components collectively forge a framework guiding stocking decisions for service parts. Tailored to address the unique challenges posed by the Thai automotive industry, the methodology furnishes manufacturers with a blueprint to navigate the intricacies of the market.
Traversing the ensuing sections, the paper delves into the intricacies of part classification, the formulation of stocking decision rules, and the application of data analysis techniques. The ultimate objective is to empower automotive manufacturers with insights that not only optimize costs and streamline supply chain operations but also elevate customer service and satisfaction. The findings and recommendations stemming from this methodology aspire to make a substantial contribution to the ongoing narrative of enhancing the efficiency and sustainability of the automotive industry in Thailand.
1.2 Literature review
The literature review explores recent research contributions related to quality management practices and their impact on various organizational outcomes. (Faraj et al., 2021). investigate the relationship between total quality management (TQM) and employee creative performance in the hotel industry, highlighting the mediating role of job embeddedness. (Sun et al., 2023). presents a mathematical model aimed at reducing delays in construction projects by considering quality management criteria under uncertainty conditions. Additionally, (Apornak et al., 2023), propose a model for new service development in healthcare units, integrating Kano, Quality Function Deployment (QFD), and mathematical programming techniques. (Mousavi et al., 2023). focus on improving supply chain network productivity through a robust optimization model under uncertainty. (Patwary et al., 2022). explores the influence of knowledge management practices on innovation performance in the hotel industry, emphasizing the mediating effects of organizational learning and creativity. Furthermore, (Vihari et al., 2022), examines the impact of soft Total Quality Management (TQM) practices on employee work role performance, considering innovative work behavior and initiative climate. (Khalili-Damghani et al., 2022). address resource allocation problems in data envelopment analysis, specifically focusing on simultaneous shared costs and common revenue. (Cheah et al., 2023). investigate the effect of quality management practices on academics’ innovative performance in Malaysian higher education institutions. Shin and (Shin and Perdue, 2022) explore the development of creative service ideas through hotel customer engagement, particularly focusing on empowerment and motivation processes. (Keramati et al., 2020). optimize nursing employees in a hospital emergency department using linear programming techniques. (Ghasemi et al., 2023). examines whether cost and quality management-oriented innovation can enhance patient satisfaction in medical tourist destinations. Overall, these studies contribute to a comprehensive understanding of the role of quality management practices in various organizational contexts and their implications for performance and innovation.
1.3 Research gap
In reviewing the existing literature, a notable gap emerges regarding the integration of service parts classification, stocking decision rules, and forecasting model performance evaluation within the context of the automotive industry, particularly in Thailand. While prior studies have explored individual aspects of service parts management or focused on specific industries, there remains a lack of comprehensive research that synthesizes these elements into a unified framework tailored to the automotive sector in Thailand. Our study bridges this gap by providing a holistic approach that incorporates demand-based categorization, strategic stocking decision rules, and rigorous evaluation of forecasting models. By addressing this gap, our research not only contributes to the theoretical understanding of service parts management but also offers practical insights that can inform decision-making and improve operational efficiency in the automotive service industry.
2 Materials and methods
2.1 Data collection and pre-processing
The data utilised in this study pertains to the automotive service parts sector in Thailand. The data set encompasses detailed information on part counts, new model parts, sales records, lead times, and vehicle volumes. Specifically, the data encompasses 9 months of sales data from January 2022 to September 2022, and forecasts for October 2022 to February 2023. For the purposes of this research, the domestic market sales data, excluding export transactions, were analysed, as these were deemed most pertinent.
The initial data set was subjected to a comprehensive cleansing process to ensure its suitability for analysis. Records reflecting negative stock levels were excluded, and any missing values were replaced with zeros. In addition, parts that could be categorized as Periodic Maintenance Service Parts and Accessories were excluded from the data set to focus solely on core service parts. The final data set was set at 1806 Service Parts under six different commodity groups like Accessories, Collision, Light Repair, Maintenance, Powertrain and Others as shown in Table 1. The data is a live data of an automotive parts distributor operating globally.
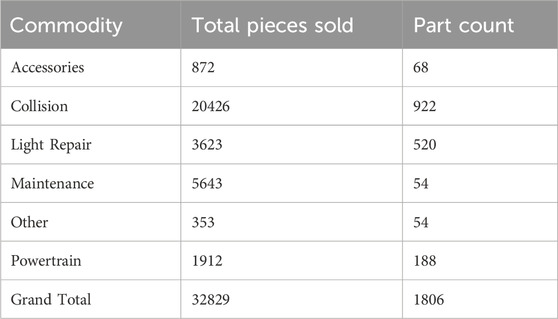
Table 1. Description of the data set used in the study, including the total counts for different commodity categories.
2.2 Data categorization
A demand based and order frequency-based classification was introduced. In alignment with the newly established demand criteria rules, the parts were categorized into various categories as per Table 2.
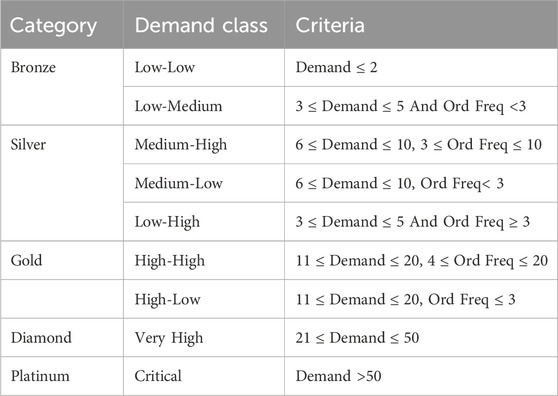
Table 2. Categorization rules based on demand criteria and order frequency.
In Table 3, we observe the number of service parts falling within each demand category and their corresponding percentages. It becomes evident that the majority of service parts are distributed across the slow to medium moving categories “Silver” and “Bronze”, with 29.3% and 44.7% representation, respectively. Notably, the “Platinum” category contains a comparatively smaller share at 7.1%, while the “Diamond” and “Gold” categories are at 9.1% and 9.7%, respectively. The total number of service parts considered for this analysis is 1806.

Table 3. Demand categorization including counts and percentages.
This distribution has significant implications for strategic decision-making. The differentiation between these categories allows for tailored resource allocation and focus. High-demand service parts categorized as “Platinum” and “Diamond” are prime candidates for heightened inventory management efforts, ensuring their availability to minimize service disruptions. On the other hand, the “Bronze” category, comprising low-demand parts, offers opportunities for alternative, cost-effective solutions.
2.3 Decision rules for stocking
In the intricate landscape of service parts management, the decision on which parts to stock involves a judicious evaluation of various factors. The criteria for stocking service parts are not arbitrary; instead, they are meticulously derived from key parameters such as purchase cost (CST), annual demand (Q), and backorder cost (B). These factors play a crucial role in the development of a structured and efficient decision-making framework (Yang et al., 2021).
2.3.1 Decision rules formulation
The decision to stock or not to stock is determined based on a rule that compares the Inventory Holding Cost and the Backorder Cost which is the cost associated with no stock on hand.
The computation of holding cost is a challenge. In consultation with the finance department, it was determined that a 15% holding cost rate shall be applied for Thailand market. The inventory holding costs would be 15% of Purchase Cost (CST).
Inventory Holding Cost = 0.15 x CST.
The total backorder cost is another challenging parameter to estimate. The following variables are considered.
a) Loaner car cost—1200 THB per car per day
b) Air Freight cost if part is from an overseas source—8% of Purchase Cost (CST). For local source, freight cost is ignored.
c) Overheads—1% of Purchase Cost (this includes the additional efforts by various stakeholders to get the part when we are backordered)
d) Lead Time L in days to receive the part from source. The assumption is source holds stock on hand and can dispatch right away.
Backorder Cost B = 1200 x L + 0.08 x CST +0.01 x CST.
Simplifying, B = 1200 x L + 0.09 CST if overseas source.
Else B = 1200 x L + 0.01 CST if local source.
The decision to stock service parts is contingent on a set of indices, each carefully formulated to capture specific aspects of the stocking decision:
• Cost Index (CSTi): This index (CSTi) is calculated using the formula CSTi = - log2(CST/3000). It quantifies the cost efficiency of stocking a particular service part, considering the purchase cost.
• Demand Index (Qi): The demand index (Qi) is formulated as Qi = - log2 (Q/10), where Q represents the annual demand for a service part. This index provides insights into the demand dynamics, emphasizing the significance of considering the annual demand in the decision-making process.
• Backorder Index (Bi): The backorder index (Bi) is determined by the formula Bi = log2(B/18000), with B representing the backorder cost. This index focuses on the cost implications associated with potential backorders, contributing a crucial dimension to the decision rules.
The decision rule is framed as: Stock the part if.
Inventory holding cost < Backorder Cost
By applying log, the rule can be reduced to a summation. A final simplified rule is obtained by defining pre-defined ranges. Above indices are associated to each range.
The index values for the decision rule are as per Table 4, Table 5, Table 6.
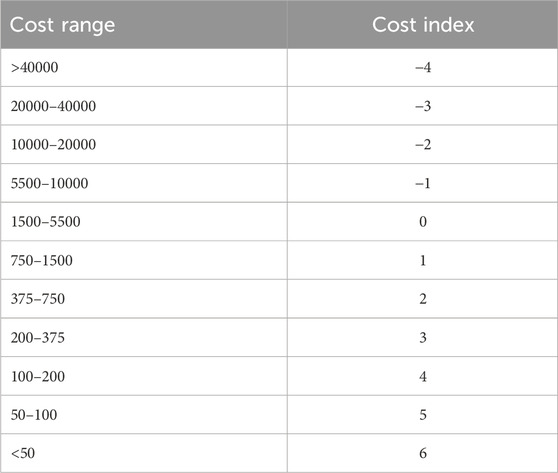
Table 4. Cost.
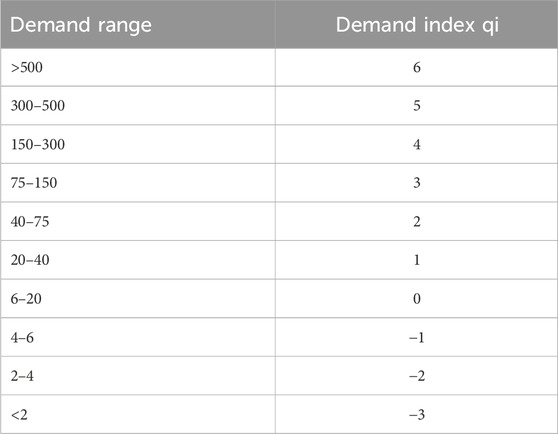
Table 5. Demand.
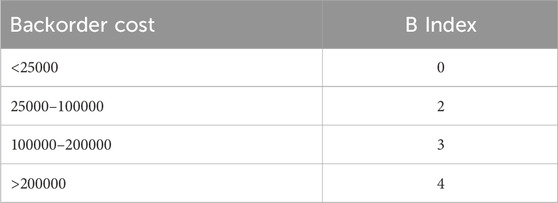
Table 6. Backorder cost.
To provide a comprehensive overview of the decision rules, Table 7 outlines the decision rules applied to determine whether specific service parts should be stocked or not. The formulation of these decision rules involved a meticulous consideration of various factors, including Lead Time (LT), Purchase Cost (CST), Classification Criteria, and Backorder Cost. The objective was to establish a systematic approach that optimally balances the costs associated with stocking and the potential backorder expenses.
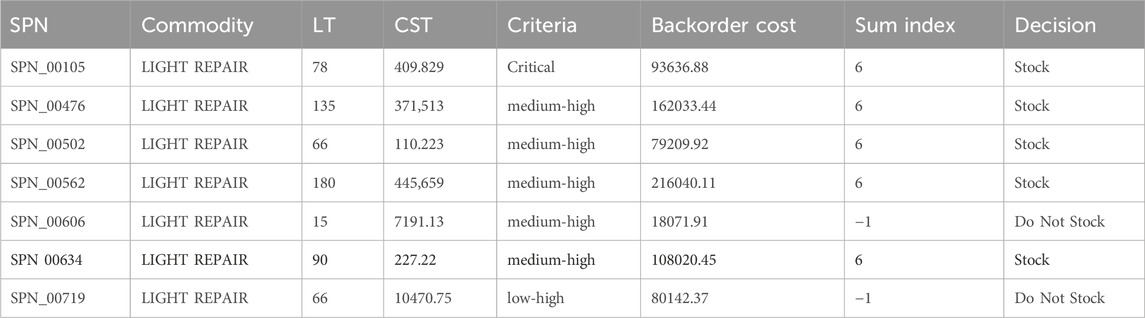
Table 7. Decision rules for stocking service parts.
Table 7 outlines a few samples where the Sum Index is <0. Parts with high cost, low to medium demand criteria combined with lower lead time fall under the Do not stock category. The table presents specific decision rules for individual service parts, including information such as Service Part Number (SPN), Commodity, Lead Time (LT), Purchase Cost (CST), criteria, Backorder Cost, and the final decision (Stock or Do Not Stock). The columns provide detailed information on key parameters:
• Index: An index assigned to each service part for reference in the decision-making process.
• Decision: Indicates whether the service part should be stocked or not based on the decision rules.
• LT (Lead Time): The time it takes for the delivery of the service part after placing an order.
• CST (Purchase Cost): The cost associated with acquiring the service part.
• Criteria: The classification criteria used in the decision-making process, such as “Critical,” “low-high,” or “medium-high.”
• Backorder Cost: The cost incurred if the service part is not stocked and needs to be backordered.
• Sum: A cumulative value derived from specific calculations, providing an overall assessment of the decision-making criteria.
The decision rules were derived through a combination of historical data analysis and strategic considerations to ensure the efficient allocation of resources and minimize costs. The “Decision” column reflects the outcome of this comprehensive evaluation, guiding the stocking strategy for each service part. The “Sum” column serves as a consolidated indicator, aggregating relevant criteria for a holistic decision-making perspective. This table serves as a valuable reference for understanding the nuanced decision-making process involved in optimizing service parts management within the automotive industry.
2.3.2 Visualisation
To enhance the clarity of the decision-making process, a visual representation in the form of a diagram or flowchart has been incorporated in Figure 2. This visualisation serves as a guide, illustrating the sequential steps involved in determining whether a service part should be stocked or not. It encapsulates the logic and criteria embedded in the decision rules, providing a comprehensive overview of the stocking process. The flowchart (Figure 2) visually represents the decision-making process for stocking service parts. It likely outlines the steps involved in evaluating different criteria and making the final decision on whether to stock a particular service part or not.
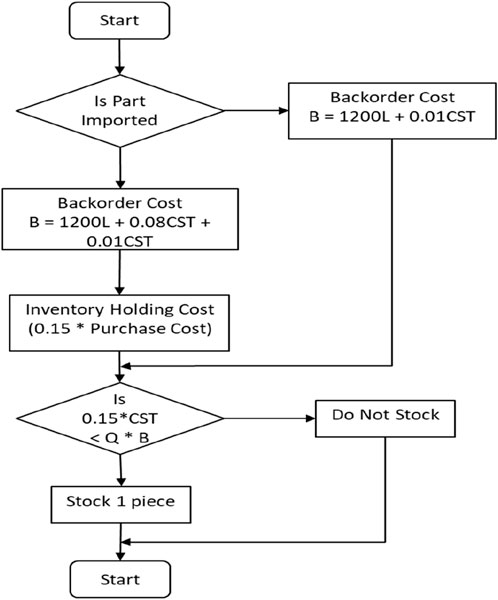
Figure 2. Decision-making process for stocking service parts.
This visualisation not only aids in understanding the intricate decision rules but also serves as a valuable reference for stakeholders involved in service parts management. It streamlines the decision-making process, making it more transparent and accessible for effective implementation (Yang et al., 2021). The subsequent sections will delve into the specifics of these decision rules, providing a deeper insight into how each criterion contributes to the overall stocking strategy.
2.4 Forecasting models
In the pursuit of identifying an effective forecasting model for service parts demand, a diverse set of approaches was explored. This section outlines the application of various models, ranging from classical time series methods to advanced machine learning techniques.
2.4.1 Model selection and implementation
The selection of forecasting models involved a comprehensive consideration of different approaches. Classical time series models, including Moving Average (MA), Weighted Moving Average (WMA), and Exponential Smoothing, were among the initial methodologies applied (Alex and Rahmawati, 2023). These traditional models provided a baseline for comparison against more sophisticated techniques (ArunKumar et al., 2021).
In addition to classical methods, machine learning models were introduced to harness the power of data-driven insights. Support Vector Regressor (SVR) (Huang et al., 2022) with Long Short-Term Memory (LSTM) (Weng et al., 2020) networks, known for their ability to capture complex patterns, were employed for demand forecasting. To ensure a comprehensive evaluation, Prophet, Auto ARIMA and Histogram-based Gradient Boosting Regressor models were also incorporated.
2.4.2 Performance evaluation
Quantifying the performance of each forecasting model is critical for selecting the most reliable approach. The evaluation criteria primarily revolved around the Mean Absolute Percentage Error (MAPE) (Kilimci et al., 2019). This metric provides a measure of the accuracy of each model by assessing the percentage difference between predicted and actual values.
Table 8, summarizes the results obtained from the application of different forecasting models, presenting their respective Mean Absolute Percentage Error (MAPE). This table serves as a quick reference to compare the performance of each model, with lower MAPE values indicating higher accuracy. MAPE is arrived by calculating the average of absolute errors (difference of Actual value and Forecast value) divided by actual value. Formula is as below:
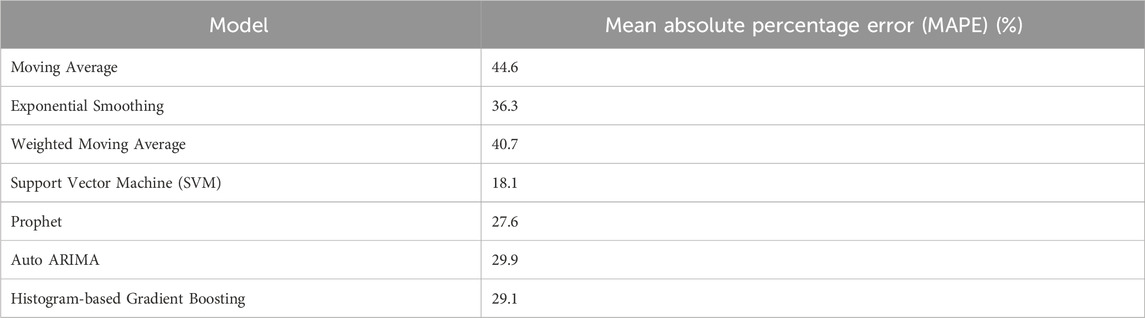
Table 8. Results from applying different forecasting models, for service part demand.
A—Actual Value.
F—Forecast as per respective model.
N—Total number of observations.
The subsequent analysis and decision-making will be guided by these initial insights, aiming to identify the most effective forecasting model for service parts demand.
3 Results and discussion
3.1 Service parts classification based on demand criteria
3.1.1 Demand-based categories
In line with the proposed criteria, the service parts were successfully categorized into five distinct groups: “Platinum,” “Diamond,” “Gold,” “Silver,” and “Bronze.” The Distribution of parts across these categories along with demand class is presented in Table 9. This classification provides a structured foundation for making informed decisions about stocking service parts.
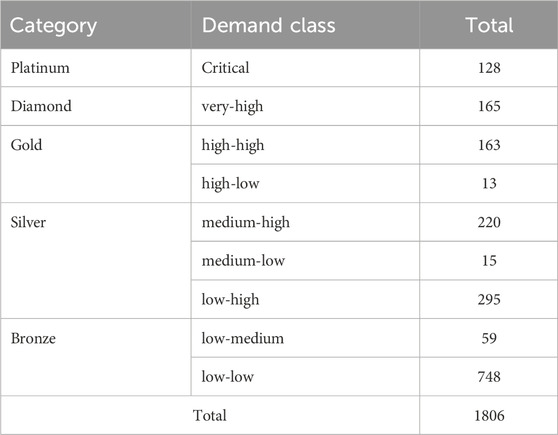
Table 9. Distribution of service parts based on demand categories and class.
Figure 3 illustrates a histogram plot providing insights into the distribution of service parts based on demand class. The x-axis represents the criteria, while the y-axis indicates the number of service parts. Notably, this plot highlights a significant number of parts with low demand, with approximately 75% of service parts recording sales of fewer than five pieces in the initial 8 months post-launch. This observation is crucial for understanding the demand life cycle of service parts, emphasizing the challenges posed by overestimating demand in the initial phase. By depicting the distribution of demand across various categories, this representation aids in devising optimal stocking strategies.
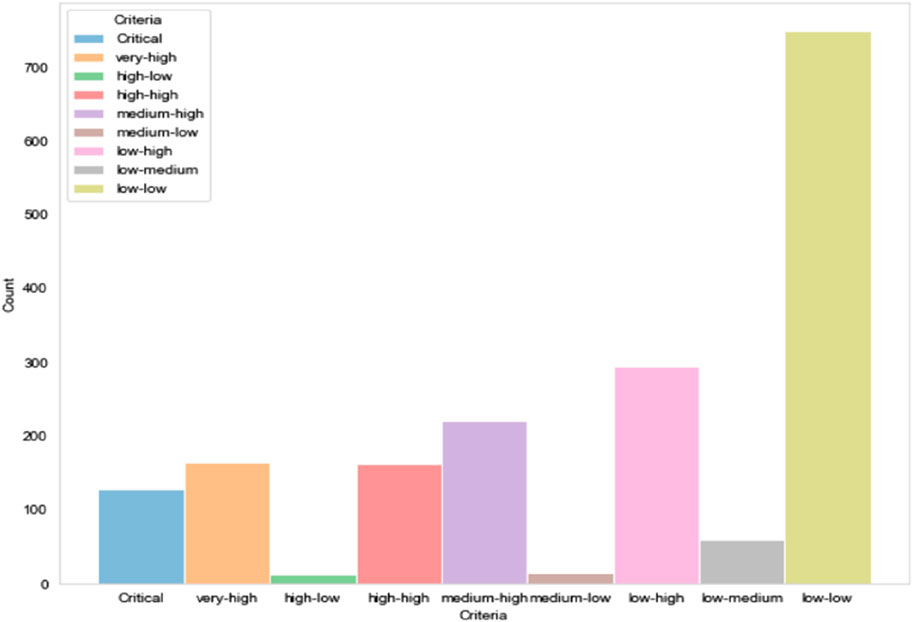
Figure 3. Histogram plot on demand criteria.
Figure 4 presents a violin plot focusing on the distribution of service parts across various part systems. The x-axis distinguishes different part systems, while the y-axis indicates the density of parts in each system. This plot reveals the presence of outliers in three distinct systems: Instrument Panel and Console, Powertrain, and Underbody Metal. While the inclusion of Periodic Maintenance Service parts might explain outliers in the Powertrain category, outliers in the Instrument Panel and Console and Underbody Metal categories warrant further investigation. Identifying these outliers within part systems is crucial for optimizing stocking decisions and resource allocation, ensuring efficient stocking of the right parts.
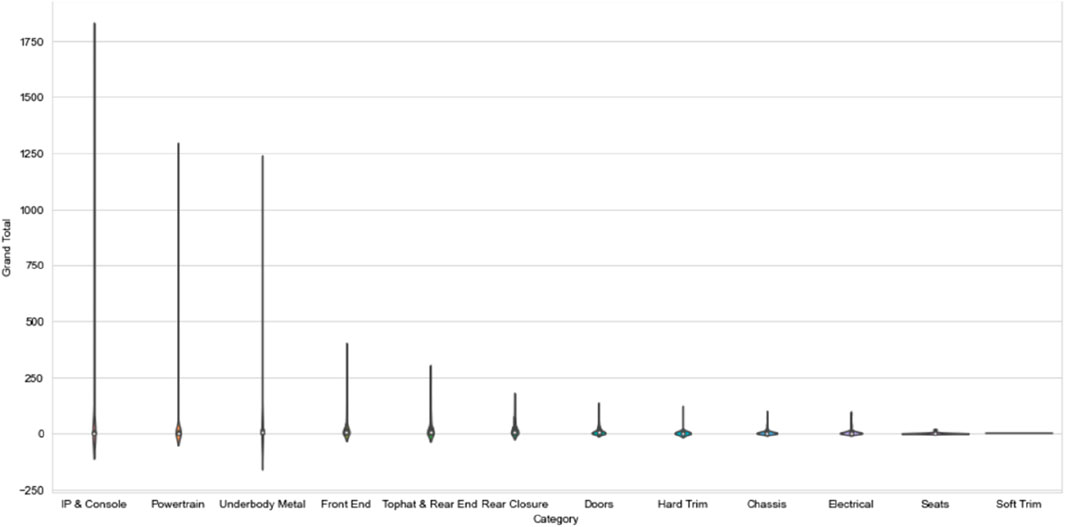
Figure 4. Violin plot on part system.
3.1.2 Implications of categorization
The categorization of service parts based on demand criteria has several notable implications (Chandriah and Naraganahalli, 2021). Notably, it allows for a more strategic allocation of resources. The “Platinum” and “Diamond” categories, representing high-demand parts, warrant a more significant focus on inventory management. In contrast, the “Bronze” category, with low-demand parts, opens opportunities for alternative solutions. The strategic implications of this classification are discussed in Section 3.2.
3.2 Stocking decision rules and outcomes
3.2.1 Decision rule application
Applying the decision rules established in Section 3.1, the study determined whether to stock each service part based on the calculated indices. The outcomes are presented in Table 10. A significant number of parts were identified as candidates for stocking, aligning with the management’s objective to stock at least one piece of every part (Agrawal and Deshpande, 2022). Notably, this aligns with the aim of minimizing service disruptions. The outcomes are summarized in Table 3.1.
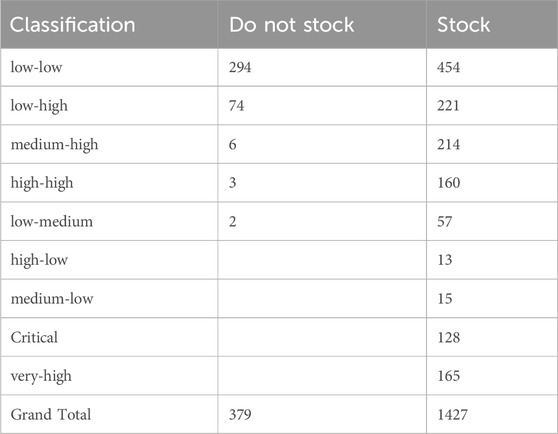
Table 10. Decision rule outcomes.
3.2.2 Exceptions and contingency solutions
Intriguingly, a set of exceptions and contingency solutions was introduced. Based on factors such as classification criteria and lead times, exceptions were recommended for certain parts that initially fell into the stocking category. Similarly, contingency solutions focused on minimizing costs by addressing parts with high lead times and low demand. These strategies introduce a level of flexibility into the decision-making process, ensuring the optimal allocation of resources.
3.3 Cost impact assessment
A fundamental aspect of this research involved quantifying the economic impact of the proposed stocking strategy (Muniz et al., 2021). By comparing the cost of stocking all parts to the cost associated with the newly developed equation, significant cost savings were identified. The results indicate that strategic stocking, as per the decision rules, could potentially save the organisation a substantial amount of capital. This cost assessment is elaborated upon in Section 3.4.
Figure 5 provides an insightful depiction of the demand distribution for service parts categorized under “Accident Repair.” This category is integral to the automotive service industry as it includes parts required for collision and accident-related repairs. The figure showcases demand trends for accident repair parts, offering a visual representation of the initial phase of demand, often characterized by a surge in requests. This figure emphasizes the importance of making efficient stocking decisions for accident repair parts to ensure that collision repair shops and service centres have quick access to these critical components during periods of increased demand.
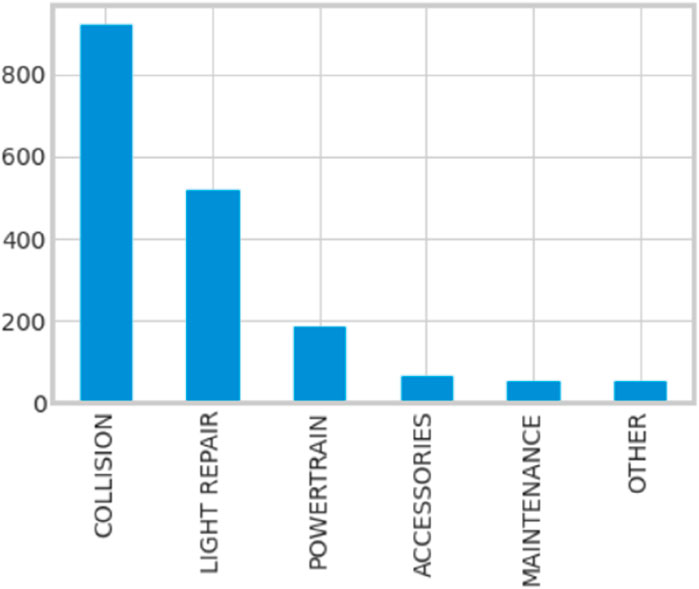
Figure 5. Demand distribution of accident repair parts.
3.4 Comparison and recommendations
In the evaluation of forecasting models, the Mean Absolute Percentage Error (MAPE) served as a crucial metric for assessing performance. Each model’s accuracy was gauged in percentages, offering a clear picture of their effectiveness in capturing the intricate demand patterns of service parts.
MA emerged with a MAPE of 44.6%, indicating its limitations in accurately predicting dynamic demand variations. Exponential Smoothing surpassed MA with a MAPE of 36.3%, showcasing improved adaptability to fluctuating demand. WMA positioned itself as a viable alternative, displaying a performance level between MA and Exponential Smoothing, with a MAPE of 40.7%.
The SVM exhibited a significant leap in performance, achieving a MAPE of 18.1%. This demonstrated SVM’s capacity to comprehend complex demand patterns, offering enhanced forecasting accuracy. Prophet, a classical time series model, delivered a competitive performance with a MAPE of 27.6%, showcasing reliability in capturing predictable demand trends.
Auto ARIMA, with a MAPE of 29.9%, positioned itself as a robust model, particularly when compared to simpler methods like MA and WMA. The Histogram-based Gradient Boosting model demonstrated effectiveness with a MAPE of 29.1%, striking a balance between simplicity and accuracy.
When assessing attenuation, which reflects the reduction in forecasting error achieved by using a more sophisticated model compared to a simpler one, notable trends emerged. SVM exhibited substantial attenuation compared to MA, emphasizing its superiority in capturing complex demand patterns (Shahriar et al., 2021). Prophet showcased attenuation concerning Exponential Smoothing, highlighting its ability to enhance accuracy in scenarios with more predictable demand. Auto ARIMA displayed attenuation compared to WMA, underscoring its superior performance in forecasting service parts demand. These nuanced insights into model performance allow organisations to make informed decisions based on the specific characteristics of their service parts demand patterns.
The study conducted a comprehensive comparison of different forecasting models, including classical time series models, machine learning techniques, and advanced deep learning models. The results highlighted the supremacy of certain models in specific contexts. Notably, SVR emerged as the best-performing model in terms of accuracy (Amirvaresi and Parastar, 2021). This model, however, showed a slight performance drop when applied to erratic demand patterns. Recommendations encompass various aspects, such as parts classification, focus on specific categories (“Platinum,” “Diamond,” “Gold”), and utilisation of the best-performing forecasting model for each specific criterion. Moreover, the research suggests a dynamic approach to stocking based on monthly demand increments correlated with vehicle sales volumes.
3.5 Limitations and future prospects
While the current study leveraged a data set spanning a commendable 9-month period, it is important to acknowledge the potential for future enhancements in data availability and historical coverage. The depth of historical data represents a critical factor in refining forecasting accuracy, particularly for parts characterized by sporadic or evolving demand patterns. Expanding the historical scope beyond the current timeframe could yield valuable insights and contribute to a more robust forecasting model. A more extensive data set, encompassing a more prolonged historical period, holds the potential to enhance the precision and reliability of forecasts, offering a comprehensive understanding of demand dynamics over an extended timeframe. This proactive approach to data expansion could further fortify the research outcomes and provide a more comprehensive foundation for strategic decision-making in service parts management. Additionally, future research could explore ensembling approaches and investigate advanced models not covered in this study, potentially offering enhanced forecasting capabilities.
3.6 Industry-wide adoption
The findings of this study hold significance for the broader automotive service industry. The systematic categorization of service parts based on demand criteria and the implementation of efficient stocking rules can be readily applied across the sector, leading to more cost-effective operations and improved service quality.
4 Discussions
In this section, the implications of the study’s findings for service parts management strategies, inventory optimization, cost-saving measures, and overall operational efficiency in the automotive industry are elaborated upon.
The optimized service parts classification framework offers a nuanced approach for strategic decision-making, enabling organizations to allocate resources based on the demand characteristics of each category. By categorizing service parts according to demand criteria, we can prioritize resources effectively, ensuring that high-demand parts receive appropriate attention while exploring alternative solutions for low-demand parts.
The robust stocking decision rules established in the study strike a balance between minimizing service disruptions and optimizing costs. Through careful application, we can stock the right parts in the right quantities, minimizing stockouts while avoiding unnecessary capital tied up in overstocking. Additionally, the introduction of exceptions and contingency solutions provides flexibility in decision-making, enabling us to adapt to changing circumstances effectively.
The cost impact assessment reveals significant potential for cost savings through strategic stocking guided by the decision rules. By comparing the cost of stocking all parts to that associated with the newly developed equation, we can identify opportunities for substantial capital savings, redirecting resources towards other strategic initiatives.
Furthermore, the comparative analysis of forecasting models underscores the importance of selecting the right model for specific contexts. SVM emerges as the most accurate model in the study, offering enhanced forecasting accuracy and improved demand forecasting capabilities. Leveraging advanced forecasting models like SVM can empower us to make informed inventory management decisions, ultimately enhancing customer service and operational efficiency.
Overall, the implications of the findings extend beyond our organization to the broader automotive service industry. By adopting the proposed framework and recommendations, organizations can optimize their service parts management practices, drive efficiency gains, and gain a competitive edge in the market. This industry-wide opportunity for cost-effective operations and heightened service quality underscores the relevance and applicability of the findings in real-world automotive service settings.
5 Conclusion
The exploration into service parts management and demand forecasting within the context of the Thai automotive industry has provided valuable insights and strategic recommendations. The following key conclusions encapsulate the findings of this research:
1) Optimized Service Parts Classification: The demand-based categorization provides a nuanced framework for strategic decision-making, allowing tailored resource allocation based on the demand characteristics of each category.
2) Robust Stocking Decision Rules: Meticulously derived decision rules achieve a balance between minimizing service disruptions and optimizing costs, with exceptions and contingency solutions introducing flexibility into the decision-making process.
3) Substantial Cost Savings through Strategic Stocking: The cost impact assessment indicates that strategic stocking, guided by the decision rules, has the potential to yield significant cost savings.
4) Model Performance and Recommendations: The comparative analysis of forecasting models emphasizes the importance of selecting the right model for specific contexts, with SVR identified as the most accurate model.
5) Attenuation and Comparison Insights: Attenuation analysis reveals the reduction in forecasting error achieved by using more sophisticated models compared to simpler ones. SVM exhibits substantial attenuation, emphasizing its superiority in capturing complex demand patterns. Recommendations advocate for leveraging the strengths of different models and dynamically adapting stocking strategies based on monthly demand increments.
6) Implications for the Automotive Service Industry: The study’s implications extend beyond individual organisations to the broader automotive service industry, presenting an industry-wide opportunity for cost-effective operations and heightened service quality.
Overall, this research offers a comprehensive framework for navigating the intricate landscape of service parts management in the Thai automotive industry. The tailored methodology, supported by insightful data analysis and visualisation, provides a roadmap for optimizing stocking strategies and enhancing overall operational efficiency. The findings and recommendations presented in this study aim to contribute to the ongoing narrative of improving the efficiency and sustainability of the automotive industry in Thailand.
Data availability statement
The raw data supporting the conclusion of this article will be made available by the authors, without undue reservation.
Author contributions
BN: Funding acquisition, Project administration, Validation, Writing–original draft, Writing–review and editing. BS: Conceptualization, Data curation, Methodology, Validation, Writing–original draft, Writing–review and editing. CS: Funding acquisition, Resources, Supervision, Writing–original draft, Writing–review and editing. JK: Formal Analysis, Project administration, Supervision, Writing–original draft, Writing–review and editing. KVE: Writing – review and editing, validation, visualization
Funding
The author(s) declare that no financial support was received for the research, authorship, and/or publication of this article.
Conflict of interest
Author BN was employed by Ford Motor Private Limited.
The remaining authors declare that the research was conducted in the absence of any commercial or financial relationships that could be construed as a potential conflict of interest.
Publisher’s note
All claims expressed in this article are solely those of the authors and do not necessarily represent those of their affiliated organizations, or those of the publisher, the editors and the reviewers. Any product that may be evaluated in this article, or claim that may be made by its manufacturer, is not guaranteed or endorsed by the publisher.
References
Agrawal, N., and Deshpande, V. (2022). Service parts management: theoretical foundations, practice, and opportunities. Creating Values Operations Anal. A Tribute Contributions Professor Morris Cohen, 133–167. doi:10.1007/978-3-031-08871-1_8
Alex, M. A. H., and Rahmawati, N. (2023). Application of the single moving average, weighted moving average and exponential smoothing methods for forecasting demand at boy delivery. Tibuana 6 (1), 32–37. doi:10.36456/tibuana.6.1.6442.32-37
Amirvaresi, A., and Parastar, H. (2021). External parameter orthogonalization-support vector machine for processing of attenuated total reflectance-mid-infrared spectra: a solution for saffron authenticity problem. Anal. Chim. Acta 1154, 338308. doi:10.1016/j.aca.2021.338308
Apornak, A., Raissi, S., Keramati, A., and Khalili-Damghani, K. (2023). Modelling new service development using Kano, QFD and mathematical programming in an emergency department healthcare unit. Int. J. Process Manag. Benchmarking 13 (1), 1–18. doi:10.1504/ijpmb.2020.10030926
ArunKumar, K. E., Kalaga, D. V., Kumar, C. M. S., Chilkoor, G., Kawaji, M., and Brenza, T. M. (2021). Forecasting the dynamics of cumulative COVID-19 cases (confirmed, recovered and deaths) for top-16 countries using statistical machine learning models: auto-Regressive Integrated Moving Average (ARIMA) and Seasonal Auto-Regressive Integrated Moving Average (SARIMA). Appl. soft Comput. 103, 107161. doi:10.1016/j.asoc.2021.107161
Aunyawong, W., Wararatchai, P., and Hotrawaisaya, C. (2020). The influence of supply chain integration on supply chain performance of auto-parts manufacturers in Thailand: a mediation approach. Int. J. Supply Chain Manag. 9 (3), 578–590. doi:10.59160/ijscm.v9i3.4958
Cardeal, G., Leite, M., and Ribeiro, I. (2023). Decision-support model to select spare parts suitable for additive manufacturing. Comput. Industry 144, 103798. doi:10.1016/j.compind.2022.103798
Chandriah, K. K., and Naraganahalli, R. V. (2021). RNN/LSTM with modified Adam optimizer in deep learning approach for automobile spare parts demand forecasting. Multimedia Tools Appl. 80 (17), 26145–26159. doi:10.1007/s11042-021-10913-0
Cheah, L. F., Cheng, M. Y., and Hen, K. W. (2023). The effect of quality management practices on academics’ innovative performance in Malaysian higher education institutions. Stud. High. Educ. 48 (4), 643–656. doi:10.1080/03075079.2022.2160702
Ding, S., and Li, R. (2021). Forecasting the sales and stock of electric vehicles using a novel self-adaptive optimized grey model. Eng. Appl. Artif. Intell. 100, 104148. doi:10.1016/j.engappai.2020.104148
Faraj, K. M., Faeq, D. K., Abdulla, D. F., Ali, B. J., and Sadq, Z. M. (2021). Total quality management and hotel employee creative performance: the mediation role of job embeddedment. J. Contemp. Issues Bus. Gov. 27 (1), 3838–3855. doi:10.47750/cibg.2021.27
Ghasemi, M., Sahranavard, S. A., Alola, U. V., and Hassanpoor, E. (2023). Can cost and quality management-oriented innovation enhance patient satisfaction in medical tourist destination? J. Qual. Assur. Hosp. Tour. 24 (6), 806–835. doi:10.1080/1528008X.2022.2089438
Huang, J., Algahtani, M., and Kaewunruen, S. (2022). Energy forecasting in a public building: a benchmarking analysis on long short-term memory (LSTM), support vector regression (SVR), and extreme gradient boosting (XGBoost) networks. Appl. Sci. 12 (19), 9788. doi:10.3390/app12199788
Jiao, R., Commuri, S., Panchal, J., Milisavljevic-Syed, J., Allen, J. K., Mistree, F., et al. (2021). Design engineering in the age of industry 4.0. J. Mech. Des. 143 (7), 070801. doi:10.1115/1.4051041
Kato, A. I., and Manchidi, N. M. (2022). Impact of supply chain management strategies on firms’ sustainable performance: a case of an emerging economy. Entrepreneursh. Sustain. Issues 10 (2), 93–114. doi:10.9770/jesi.2022.10.2(6)
Keramati, A., Damghani, K. K., Apornak, A., and Raissi, S. (2020). Optimization nursing employees in a hospital emergency department by using linear programming. Int. J. Manag. Concepts Philosophy 1 (1), 1. doi:10.1504/IJMCP.2020.10032114
Khalili-Damghani, K., Noorzadeh, F., and Apornak, A. (2022). Resource allocation problems in data envelopment analysis with simultaneous shared costs and common revenue. Int. J. Data Envelopment Analysis 10 (2), 1–12. doi:10.30495/ijdea.2022.66147.1153
Kilimci, Z. H., Akyuz, A. O., Uysal, M., Akyokus, S., Uysal, M. O., Atak Bulbul, B., et al. (2019). An improved demand forecasting model using deep learning approach and proposed decision integration strategy for supply chain. Complexity 2019, 1–15. doi:10.1155/2019/9067367
Min, S., Zacharia, Z. G., and Smith, C. D. (2019). Defining supply chain management: in the past, present, and future. J. Bus. Logist. 40 (1), 44–55. doi:10.1111/jbl.12201
Mousavi, S. F., Apornak, A., and Pourhassan, M. (2023). Robust optimization model to improve supply chain network productivity under uncertainty. J. Appl. Res. industrial Eng. 10 (2), 273–285. doi:10.22105/jarie.2022.316357.1402
Muniz, L. R., Conceição, S. V., Rodrigues, L. F., de Freitas Almeida, J. F., and Affonso, T. B. (2021). Spare parts inventory management: a new hybrid approach. Int. J. Logist. Manag. 32 (1), 40–67. doi:10.1108/IJLM-12-2019-0361
Patwary, A. K., Alwi, M. K., Rehman, S. U., Rabiul, M. K., Babatunde, A. Y., and Alam, M. M. D. (2022). Knowledge management practices on innovation performance in the hotel industry: mediated by organizational learning and organizational creativity. Glob. Knowl. Mem. Commun., doi:10.1108/GKMC-05-2022-0104
Shahriar, S. A., Kayes, I., Hasan, K., Hasan, M., Islam, R., Awang, N. R., et al. (2021). Potential of ARIMA-ANN, ARIMA-SVM, DT and CatBoost for atmospheric PM2. 5 forecasting in Bangladesh. Atmosphere 12 (1), 100. doi:10.3390/atmos12010100
Shin, H., and Perdue, R. R. (2022). Developing creative service ideas through hotel customer engagement for open innovation: focused on empowerment and motivation processes. Int. J. Hosp. Manag. 100, 103077. doi:10.1016/j.ijhm.2021.103077
Sun, J., Apornak, A., and Ma, G. (2023). Presenting a mathematical model for reduction of delays in construction projects considering quality management criteria in uncertainty conditions. J. Eng. Res., doi:10.1016/j.jer.2023.08.021
Vihari, N. S., Yadav, M., and Panda, T. K. (2022). Impact of soft TQM practices on employee work role performance: role of innovative work behaviour and initiative climate. TQM J. 34 (1), 160–177. doi:10.1108/TQM-03-2021-0092
Weng, T., Liu, W., and Xiao, J. (2020). Supply chain sales forecasting based on lightGBM and LSTM combination model. Industrial Manag. Data Syst. 120 (2), 265–279. doi:10.1108/IMDS-03-2019-0170
Keywords: Ma, WMA, exponential smoothing, SVM, prophet, ARIMA, histogrambased gradient boosting regressor, SVR
Citation: Nathan BS, Siva Reddy BV, Sastry CC, Krishnaiah J and Eswaramoorthy KV (2024) Innovative framework for effective service parts management in the automotive industry. Front. Mech. Eng 10:1361688. doi: 10.3389/fmech.2024.1361688
Received: 26 December 2023; Accepted: 25 March 2024;
Published: 11 April 2024.
Edited by:
Georgios Mavropoulos, School of Pedagogical and Technological Education, GreeceReviewed by:
Andrea Denger, Anstalt für Verbrennungskraftmaschinen List, AustriaArash Apornak, University of Tehran, Iran
Copyright © 2024 Nathan, Siva Reddy, Sastry, Krishnaiah and Eswaramoorthy. This is an open-access article distributed under the terms of the Creative Commons Attribution License (CC BY). The use, distribution or reproduction in other forums is permitted, provided the original author(s) and the copyright owner(s) are credited and that the original publication in this journal is cited, in accordance with accepted academic practice. No use, distribution or reproduction is permitted which does not comply with these terms.
*Correspondence: B. Veera Siva Reddy, sivareddy.bobbili@gmail.com; C. Chandrasekhara Sastry, chandrasekhar@iiitk.ac.in