Influence of incubation period on membrane patch color for insoluble contaminant measurement in degraded hydraulic oils
 Stepan Pravda
 David Sedenka
 - Department of Machine and Industrial Design, Faculty of Mechanical Engineering, VSB–Technical University of Ostrava, Ostrava, Czechia
Insoluble contaminants and varnish, resulting from oil degradation byproducts and sometimes depleted additive molecules, are initiated primarily due to thermal stress on the oil. This poses significant challenges in tribology, particularly for the lubrication systems of modern complex machinery, leading to severe debilitating effects such as loss of operating clearances and impaired heat transfer. Addressing varnish buildup is crucial, and timely oil analysis emerges as a valuable tool, offering essential insights into the oil degradation level and the potential presence of insoluble contaminants. Among the various laboratory testing methods available to assess varnish potential, colorimetric analysis, specifically Membrane Patch Colorimetry (MPC), is widely applied owing to its efficiency and cost-effectiveness. This study extends the application of MPC test principles, commonly utilized for turbine oils, to measure insoluble contaminants generated by degraded hydraulic fluids. Adhering to the ASTM D7843-21 standard, which stipulates the precision of this testing method for turbine oils is contingent upon the sample’s incubation period, our investigation focuses on exploring modifications to the standard 72-hour incubation period. We aim to assess the viability of shortening or extending this duration for conducting MPC tests on used hydraulic fluids, thereby potentially enhancing the precision and relevance of MPC tests in hydraulic fluid analysis.
1 Introduction
Hydraulic systems are a series of fluid-powered components that generate, control, and transmit mechanical energy. They find wide-ranging applications in industries like aerospace, automobiles, power plants, and industrial manufacturing. One of the primary and inherent components of every hydraulic system is hydraulic fluid or hydraulic oil. This fluid not only transmits power between components but also provides lubrication for friction reduction, along with protection against cavitation and corrosion The properties of hydraulic oil have a significant impact on the overall performance of the hydraulic circuit. Parameters such as viscosity, temperature range, and pressure rating are crucial considerations, varying based on the specific machine application. Another utmost important parameter of every hydraulic oil, demanding careful monitoring, is cleanliness during operation. Deterioration or wear of the circuit’s sealing surfaces can permit internal and external fluid leakage, causing contamination and leading to serious implications for the machine’s operational safety and service life. Multiple laboratory testing methods exist to measure overall contamination in in-service hydraulic fluids (Leslie, R., 2020).
The first testing method established in 1964 to categorize contamination classes in aircraft hydraulic components is referred to as NAS 1638. It characterizes oil cleanliness using a coding system with differential counts, indicating the maximum allowable quantities within a 100 mL oil sample. This approach is now more often replaced by the ISO 4406 standard, which employs cumulative counts and is generally deemed to offer a more comprehensive representation. It must be noted that both methods mentioned are incapable of detecting particles smaller than 5 µm. As a result, they are unable to identify varnish or oxidation products, which can be equally harmful to hydraulic and turbine oils as larger metal particles and other contaminants (Sasaki, A., 2006; Comparison NAS/ISO, 2020).
The laboratory testing method used to determine the concentration of insoluble contaminants in in-service oils using MPC is detailed in the ASTM D7843-21 standard (ASTM D7843-21, 2021). However, this standard is only applicable for in-service turbine oils. Regarding measurement of insoluble contaminants in hydraulic fluids, the only relevant standard is ASTM D4898-16. This standard uses gravimetric analysis, where contaminated oil is filtered using a membrane filter disc to measure the overall weight of contaminants (ASTM D4898-16, 2016).
This study applies testing method described in ASTM D7843-21, which according to ASTM can be applied for measurement of lubricant generated insoluble color bodies in in-service turbine oils for testing varnish concentration in in-service hydraulic oil samples taken from rubber vulcanizing press machines. These samples were not chosen by coincidence, but as a representative example of a machine with hydraulic components that are exposed to a wide operating temperature range. To contextualize this study in relation to previous research, we would like to reference the article titled “Influence of Solvents, Oil Temperature, and Incubation Period on Membrane Patch Colorimetry” (Kon, T., 2018). Within this research, one of the examined parameters is the impact of the incubation period on turbine oil samples. In essence, the findings of this study demonstrated that turbine oil samples subjected to an extended incubation period exhibited a deeper coloration. Consequently, the extension of the sample incubation period has the potential to influence the accuracy of MPC measurements.
1.1 Heat transfer between hydraulic components in rubber vulcanizing presses
Rubber vulcanization is the process of chemically cross-linking rubber molecules using organic or inorganic substances, achieved through heat and pressure. This process enhances the mechanical strength of the final rubber product. In various rubber manufacturing processes, particularly for road vehicle tires, specialized vulcanizing presses, in combination with vulcanizing agents, generate the required heat and pressure. Initially, elemental sulfur was used as the vulcanization agent, with curing times exceeding 5 h per vulcanization process. While contemporary vulcanizing machines still employ sulfur as an agent, the incorporation of accelerators has significantly reduced curing times to as little as 1–3 min (A.Y. Coran, 2013). Vulcanizing machines are generally operated using two-way hydraulic cylinders parallelly driven by a hydraulic pump that creates pressure and a heating plate to crate sufficient heat (see Figure 1.).
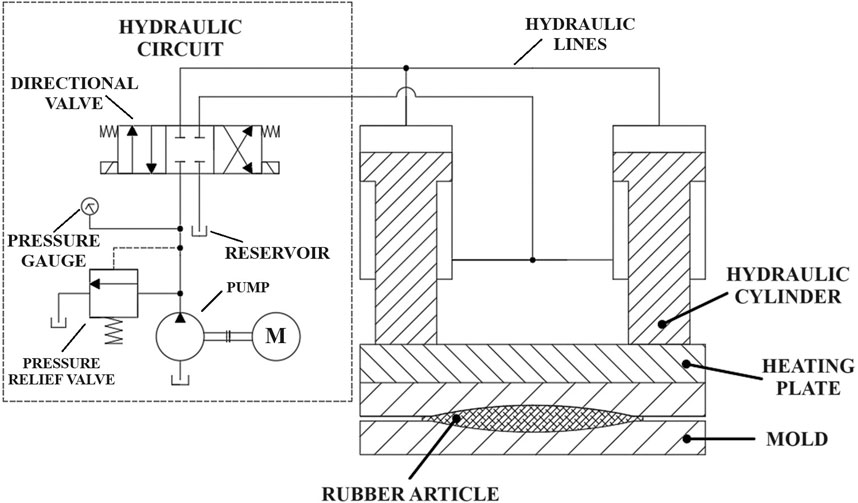
FIGURE 1. Diagram of the rubber vulcanizing press.
In the rubber vulcanization process, a natural rubber product is positioned within a mold attached to a heating plate. The heating plate is heated to an operational temperature ranging from 140°C to 160°C, while concurrently exerting pressure on the rubber product within the mold. This juncture also serves as a heat transfer point, occurring not only between the heating plate and the mold but also involving the heating plate and the hydraulic piston rod. The primary source of oil oxidation can be pinpointed here: when the piston rods of hydraulic cylinders heat up, this in turn impacts the hydraulic fluid contained within them.
1.2 Oil oxidation
Base oil slow oxidation is a chemical process of oil degradation in which the oil’s long chains of hydrocarbon molecules lose hydrogen molecules and gain oxygen molecules through a series of organic reactions. This progression occurs through a series of organic reactions. While antioxidants are typically included in the formulation of synthetic hydraulic fluids, their efficacy diminishes over time due to oil contamination by byproducts that function as free radicals in the oil oxidation processes. Various methods have been developed for oxidation stability testing. For example, ASTM D2272 employs a rotating pressure vessel, while ASTM D4310 measures oil oxidation stability and sludge formation by tracking the acid number of oil samples (Leslie, R., 2020; Lubricant Oxidation, 2000).
As oil oxidation is the primary source of insoluble contaminants, also known as varnish, it is essential to comprehend the process involved. Basically, all lubricant based oils can be classified as organic compounds because they primarily consist of long chains of hydrocarbon molecules. These chains of molecules consist of hydrogen and carbon atoms in nearly infinite number of variations. Each atom is linked to another with a bond. The bonded structure of atoms is referred to as a compound. Usually, the oxidation happens at the end of the chain, but it can occur in the middle as well, creating two carboxylic acids as a product (Lubricant Oxidation, 2000). The oxidation process can be described chemically using R which represents undefined chain of hydrocarbon molecules (see Table 1).
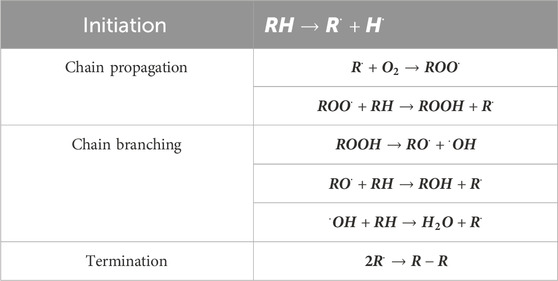
TABLE 1. Oil oxidation process.
The most significant effect of oxidation in lubricants happens when a single chain is broken down into two chains. By breaking down the chain, oil molecules start to fail at carrying the load between two moving parts therefore it significantly debilitates the lubricating process itself. A further concern emerges as new compounds, characterized by elevated molecular weights, develop through polymerization processes. These compounds contribute to the creation of soluble and insoluble contaminants, recognized as varnish and sludge (Lubricant Oxidation, 2000).
1.3 Insoluble contaminant (varnish)
As mentioned varnish can take on both soluble and insoluble forms. Similar to sludge or lacquer, insoluble varnish is a thin, hard, lustrous deposit primarily composed of organic residues. Lubricants possess limited capacities to dissolve varnish at specific temperatures. When the solvency capacity for soluble varnish is reached, the solutions become saturated. At this saturation point, a lubricating oil is unable to dissolve any additional varnish. The equilibrium point between the levels of soluble and insoluble varnish is influenced by factors such as temperature, molecular polarity, and contamination levels. Metals exhibit greater polarity compared to the base stocks of lubricants, causing polar varnish precursors to adhere to the metal and create deposits. Insoluble varnish acts as a sticky layer adhering to metal surfaces, capturing solid particles like dirt and wear particles within the deposit. These hard particles then induce abrasive wear and act as catalysts for oil oxidation (Hong, S.-H., 2023).
Insoluble contaminants and varnish build-up create a challenging problem for oil manufactures as well as maintenance workers and oil laboratory technicians. In case of hydraulic circuits, they can form layers of polymers in small cavities, valves and filters which are very difficult to dissolve and can have a devastating impact on lubricating properties of hydraulic fluids, as well as on operation reliability of the hydraulic circuit itself.
1.4 Hydraulic oil condition monitoring
In modern hydraulic systems, fire-resistant fluids are frequently employed, often based on phosphate esters. In such instances, insoluble contaminants tend to yield brown or black (soot) colored insoluble bodies (ASTM D4898-16, 2016). These can be detected through MPC–Membrane Patch Colorimetry. The procedure for MPC measurement methodology is detailed in the subsequent section.
Before proceeding with further investigation into insoluble contaminants, it is essential to acknowledge that hydraulic circuits and the fluids circulating within them are subject to several issues beyond oil oxidation alone. An optimal strategy for monitoring the condition of hydraulic circuits involves employing multiparametric diagnostics. This approach integrates modern diagnostic methods that offer valuable insights into the machinery’s overall health and operating condition (Opocenska, H, 2017).
Another contemporary method widely utilized for oil condition monitoring is online monitoring through integrated sensors. Employing lubricant sensors entails measuring diverse properties of the lubricant, such as viscosity, density, water content, and more. The most versatile choice for online monitoring is a viscosity measurement sensor, often paired with a wear particle sensor. This form of monitoring offers valuable insights into the condition of the lubricating oil, helping prevent damage or failure in hydraulic systems. Notably, nearly 70% of all hydraulic system failures stem from contamination and degradation of hydraulic oil. Machine operators frequently incorporate machine learning and artificial intelligence methodologies into their condition monitoring practices [Hong, S.-H., 2022; Stojanović, B., 2017).
The concentration of varnish in hydraulic oils can be determined through the utilization of oil property sensors like TE FPS 2000. As lubricant becomes contaminated with varnish, a significant rise in the dielectric constant occurs. Experimental testing of varnish concentration in hydraulic fluid was performed by Hong, S.-H., & Jeon, H.-G. in their study titled “Monitoring the Conditions of Hydraulic Oil with Integrated Oil Sensors in Construction Equipment” (Hong, S.-H., 2022).
2 Materials and methods
Validation of the proposed insoluble contaminant testing method using colorimetry was conducted by laboratory workers from the Department of Machine and Industrial Design, Faculty of Mechanical Engineering, VSB–Technical University of Ostrava.
First, an undisclosed local company specializing in the production of rubber products (mostly vehicle tires) was addressed. This manufacturer had been struggling with persistent issues concerning their hydraulic vulcanizing presses. They encountered the challenges detailed in the previous section, wherein the hydraulic oil within the circuits of hydraulic presses underwent rapid degradation due to oxidation, consequently triggering varnish development. This, in turn, led to the need for more frequent oil replacements and repeated cleaning process of hydraulic components affected by insoluble contaminants. The manufacturer utilizes various types of rubber vulcanizing presses, primarily selected based on the tire size and other properties of the rubber product. The most frequently used vulcanizing press, from which we collected oil samples, is referred to as the VL 65. This press is manufactured and supplied by the local company. It is crucial to underscore that the condition of the oil obtained from these presses should not be linked to the construction of the machine. Therefore, the manufacturer of the press is not mentioned in this research.
2.1 Sampling and preparation
Our laboratory workers obtained in total 7 hydraulic oil samples of standard ISO VG 46 hydraulic oil from 5 hydraulic circuits of vulcanizing presses using ASTM D4057-22 sampling practice–Standard Practice for Manual Sampling of Petroleum and Petroleum Products. Each group of samples represents the same type of hydraulic oil but with varying ages and degradation states, reflecting the differences in usage frequency among vulcanizing presses in the manufacturing process. These samples were divided into five groups, each representing varying levels of varnish concentration.
To prevent UV light exposure, which can heighten deposit formation in oil samples, specialized containers were employed, shielding from both indoor and outdoor sources. Each sample contained about 150 mL of in-service hydraulic oil. According to this standard, each sample should hold at least 60 mL of the material to be tested (ASTM D4057-22, 2022).
After the sampling procedure, all samples were transported to the Laboratory of Technical Diagnostics at VSB–Technical University of Ostrava and placed into a laboratory oven. According to ASTM D7843-21, the samples should be exposed to a temperature of 65°C for a span of 24 h. After this heating procedure, the samples need to be shielded from UV light for an incubation period ranging from 68 to 72 h (ASTM D7843-21, 2021; ASTM D4057-22, 2022). Here we focus the main part our research: investigating whether this period can be either shortened or extended to receive more valid test outcomes. By standard it was stated that samples analyzed prior to this aging period may produce fewer color bodies resulting in lower value of trend analysis [4], therefore gaining inaccurate results from this test.
2.2 Measurement methodology
As stated before, the measurement methodology is derived from ASTM D7843-21 standard, first after the sampling procedure we proceeded to the heating and incubation procedures.
2.2.1 Sample heating and incubation
Using manual practice (ASTM D4057) or automatic practice (ASTM D4177), 7 representative samples of approximately 150 mL of the hydraulic fluid were obtained from the hydraulic circuit tank. Each sample was heated to 65°C for 24 h simultaneously and then stored away from UV light at a temperature between 15°C and 25°C, in an enclosed cabin. Each sample was removed from the cabin after its incubation period was performed:
• 0 h
• 12 h
• 24 h
• 48 h
• 72 h
• 96 h
• 120 h
The selection of incubation periods was informed by prior experience in conducting MPC testing, given that samples with an incubation period exceeding 120 h generally exhibit no significant change in discoloration. It’s important to note that the extension or reduction of the incubation period should always be reported in testing documentation as a deviation of Standard’s methodology.
2.2.2 Sample preparation
• Recorded the date and time at the beginning of the test.
• Achieved uniform resuspension of insoluble contaminants in the sample by vigorous mixing for at least 15 s; post-mixing, no visible sediment should be present at the bottom of the sampling bottle or adhered to its walls.
• Transferred 50 mL of the sample into a clean beaker and added 50 mL of petroleum ether, followed by mixing and stirring for approximately 30 s.
• After completing the heating, incubation, and preparation procedures, all samples were filtered through a 47 mm, 0.45 μm membrane filter using a filtration vacuum apparatus (see Figure 2) (ASTM D7843-21, 2021).

FIGURE 2. Diagram of the filtration apparatus.
2.2.3 Sample filtration
• Using forceps, positioned the filter in the center of the filter holder and securely clamped the filter funnel in place.
• Applied a vacuum of approximately 76 kPa, ensuring the vacuum was achieved and maintained.
• Carefully poured the sample into the filter funnel within 2 min of initial mixing. • Rinsed the beaker twice with a minimum of 35 mL of clean petroleum ether.
• Carefully washed any adhering insoluble material from the funnel wall.
• After allowing the filtrate to flow through completely, cautiously removed the clamp and funnel, washing the filter edges gently with petroleum ether from the wash bottle.
• Released the vacuum with carefully, removed the clamp and filter holder.
• Extracted the filter from the filter holder using forceps and transferred it into a clean, dry petri-dish.
• Dried the filter by placing it in a Ecocell 22 laboratory oven until completely dry (approximately around 3 h) (ASTM D7843-21, 2021).
The final part of this laboratory test determinates color of the membrane patch using 3NH NR 200 precision colorimeter. Any type of standardized precision colorimeter can be used for this task if it provides results in CIELAB color space.
CIELAB color space or CIE L*a*b* is a 3D color space that allows accurate measurement and comparison of all perceivable colors using three color values. It was developed by International Commission on Illumination (CIE) in 1976 with intend of improving Munsell color system and creating a new standard for color communication (What Is CIELAB, 2023). CIELAB color space is produced by plotting in rectangular coordinates three quantities–L*, a*, b*, calculated Eqs 1–3.
Values Xn, Yn, and Zn define the color of the normally white object-color stimulus, in case of MPC colorimetry, it is a color of a new, clean, and dry membrane patch using Eq. 4. Very significant role plays the ΔE* or ΔE*ab MPC value that shows poor oil condition therefore shows the increasing concentration of both varnish and soot (ASTM D7843-21, 2021). The total difference ΔE*ab between two colors is calculated using Eq. 5. Usually, this value is used to describe aging process of oil by comparing a color of a new unused oil and oil degraded by varnish. In our case, we compare the colors of multiple used oil samples to assess accuracy, based on the sample incubation period (ASTM D7843-21, 2021).
The total difference Δ(a*+b*) is utilized to differentiate amber-brown patches (colored by varnish) from black patches displaying a high ΔE value due to soot or high-temperature breakdown products [4]. The MPC value Δ(a*+b*) is computed using Eq. 6 (ASTM D7843-21, 2021),
In addition to the MPC test, a prevailing practice in measuring varnish concentration in oils involves recording MPC patch weight or conducting a gravimetric analysis as per ASTM D4898–16. However, our emphasis in this study is solely on MPC analysis and its precision contingent upon the incubation period of hydraulic oil samples.
3 Results
Using measurement methodology described in Section 2.2, we analyzed 5 groups each with 7 hydraulic oil samples of a standard HM 46 (ISO VG46, DIN 51524) obtained from 5 hydraulic circuits of rubber vulcanizing presses. After the sampling procedure, all samples were provided with a description and a number, for, e.g., Group 1, Sample 4, and stored in a dark, dust free cabin away from UV light sources in appropriate containers. Samples were heated in a laboratory oven for approximately 24 h at 65°C. After the heating procedure described in Section 2.2.1–Sample heating and incubation, samples were placed back into the cabin, then sample from each group was removed from the cabin and proceeded to a sample preparation process after certain incubation period was achieved (12 h, 24 h, 48 h, 72 h, 96 h, 120 h). Then each sample was prepared as described in –Section 2.2.2–Sample preparation and filtrated as described in –Section 2.2.3–Sample filtration. As a result of this filtration process, we received 35 varnish-colored patches that were used to measure MPC values using 3NH NR 200 precision colorimeter.
Prior to assessing L*, a*, and b*, we conducted colorimeter calibration using a new, dry patch. This procedure yielded blank L*, a*, and b* values, which were then utilized for calculating all delta values.
In the following five sections, we examine the results of each patch group based on MPC values showcased in dedicated tables. Each table corresponds to a specific sample group, aiding in clear and focused analysis. The primary row in these tables serves as a reference point, presenting values obtained from the blank filter prior to subsequent measurements. Within each table, subsequent rows display measured L*, a*, and b* values for individual patches in the first two columns. Following these, subsequent columns illustrate the delta (∆) values: ∆L*, ∆a*, and ∆b*. The last two columns in each table present calculated MPC values: ∆E* and ∆(a*+b*). To complement these tables, accompanying Figures depict images of all patches post-filtration process. Each Figure integrates a scatter plot with values fitted using a linear regression line, providing a visual representation of data distribution and trend.
In result evaluation of each patch group, we look at these MPC values. Usually when evaluating varnish potential in oils, laboratories measure and trend only ∆E* value, which doesn’t fully describe oil varnish potential. As per ASTM D7843-21 standard we also evaluate contribution of ∆(a*+b*). Combination of these two MPC parameters better describes operating oil condition not only for varnish potential but for the presence of soot as well. Generally, when evaluating ∆E* value, samples can be divided into 4 categories (WHITE PAPER MPC, 2016):
• GOOD: <15
• MONITOR: 15–25
• ABNORMAL: 25–35
• CRITICAL: >35
As a comparative tool to assess the variation among individual patch groups, we computed the average deviation for both ∆E* and ∆(a*+b*) values (see Eqs 7, 8). A smaller value of the average deviation indicates a reduced influence of the incubation period on the given group of samples.
3.1 Patch group 1
The first group of patches represents oil samples with critical varnish potential. In this case it was strongly recommended to replace the hydraulic oil and promptly flush the hydraulic circuit. These actions have been advised to the machine operator as immediate measures. Concerning the results, the ∆E* value varies from 44.46 to 61.71, with average deviation of 4.17. The ∆(a*+b*). Value ranges from 35.61 to 48.48, with average deviation of 2.43. To facilitate a comprehensive comparison of the MPC values associated with the initial patch group, Table 2 provides the relevant data.
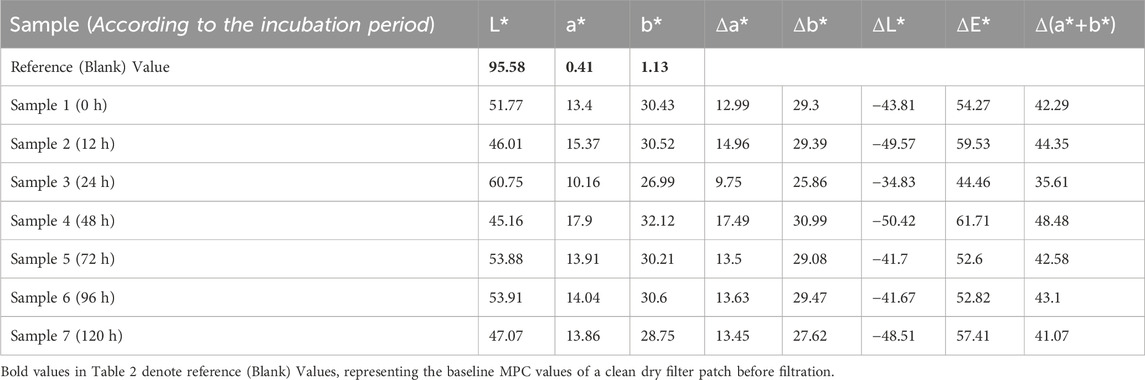
TABLE 2. MPC results of patch Group 1.
When reviewing Figure 3 and the images depicting all patches post-filtration process, the inconsistency in color graduation among individual patches becomes evident. This lack of uniformity aligns with the marginal increase observed in the linear regression line integrated into the scatter plot.
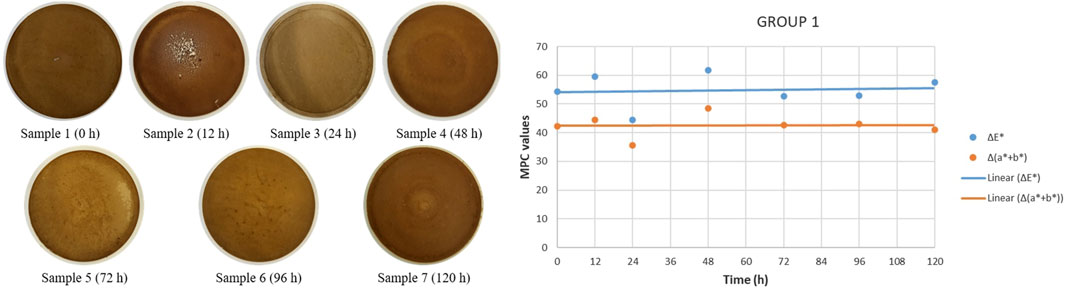
FIGURE 3. Patch group 1.
3.2 Patch group 2
The second group of samples exhibits a notably lower varnish concentration compared to the first group. The MPC values do not exceed 21 for both ΔE* and Δ(a*+b*), indicating elevated but manageable results (refer to Table 3). It is advisable to closely monitor the machine, and a reevaluation of the MPC test is recommended to validate the obtained measurements. If the concentration surpasses ΔE* of 35, immediate oil replacement is necessary. Notably, the average deviation values are considerably lower than those of the previous group, measuring at 1.57 for ∆E* and 1.2 for Δ(a*+b*). See Figure 4 for a graphical representation illustrating the trends observed in the varnish concentration levels across these samples. Although the spread of values is considerably lower in this case, the trend indicated by the linear regression line shows a slight decrease. Notably, no significant correlation between the incubation period and patch color is discernible in this instance.
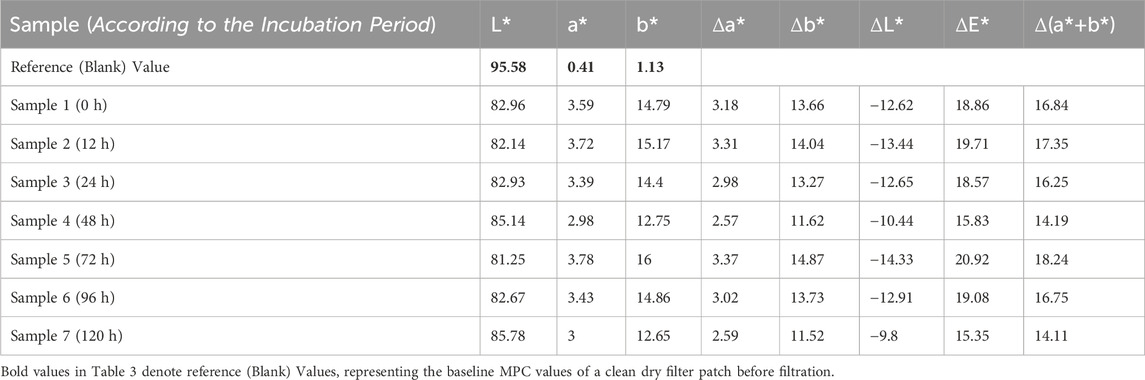
TABLE 3. MPC results of patch Group 2.
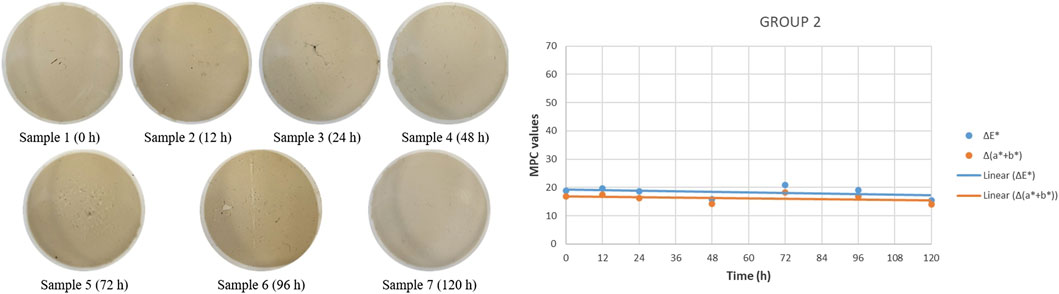
FIGURE 4. Patch group 2.
3.3 Patch group 3
Another set of samples exhibits an abnormal, though not critically high, concentration of varnish. The ΔE* values range between 20.28 and 38.38, while the Δ(a*+b*) values similarly show an increase from 18.05 to 30.4 (refer to Table 4). Notably, the linear regression line exhibits a conspicuous increasing trend, aligning evidently with the values presented in the table and corresponding patch images (see Figure 5). These observations strongly suggest that prolonging the incubation period with this sample group significantly amplifies the varnish potential. However, it’s worth noting that this assertion is not entirely supported by the average deviation, recording the highest figures thus far–5.39 for the ΔE* values and 4.22 for the Δ(a*+b*).
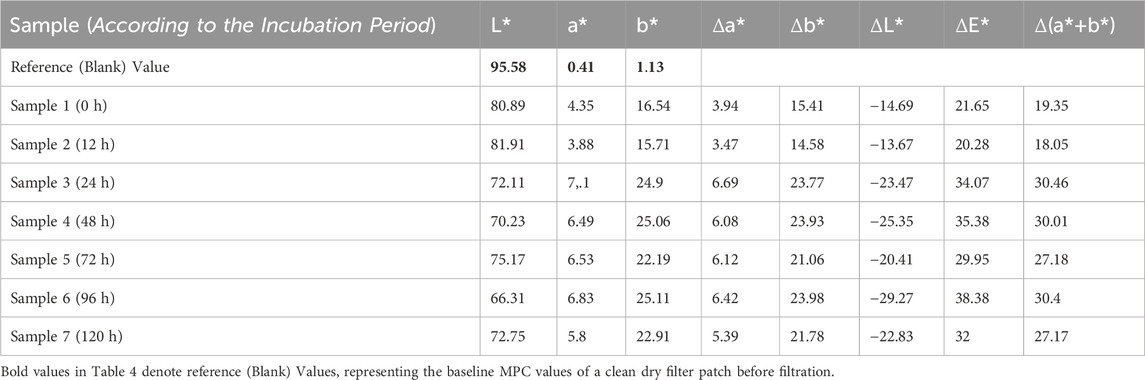
TABLE 4. MPC results of patch Group 3.
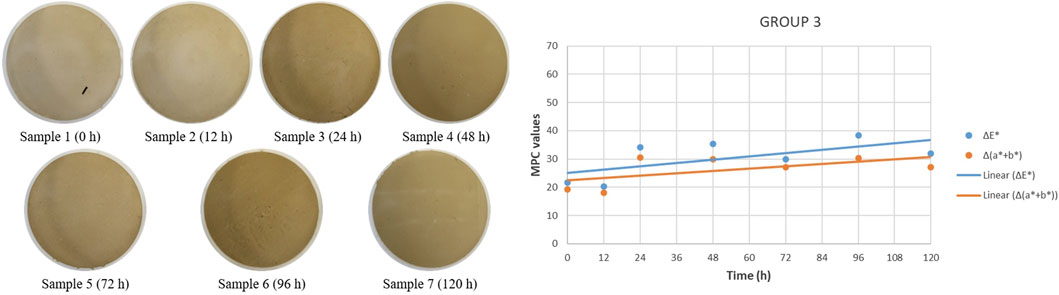
FIGURE 5. Patch group 3.
3.4 Patch group 4
The fourth group of samples displays a similar increasing trend to the third group (see Figure 6), although the MPC values more closely resemble those of the first group. Specifically, ΔE* reaches approximately 50, while Δ(a*+b*) averages around 26 (refer to Table 5). Additionally, this group exhibits an average deviation of 2.94 for ΔE* and 2.41 for Δ(a*+b*). Similar to the first group, the MPC values observed in this set indicate critical varnish concentrations, prompting immediate notification to the machine operator.
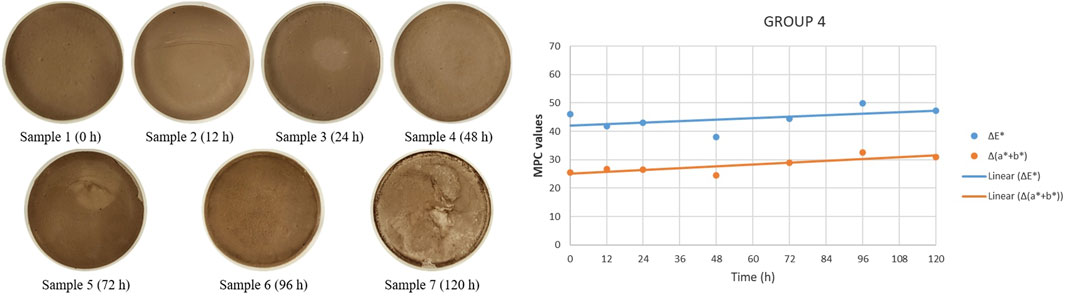
FIGURE 6. Patch group 4.
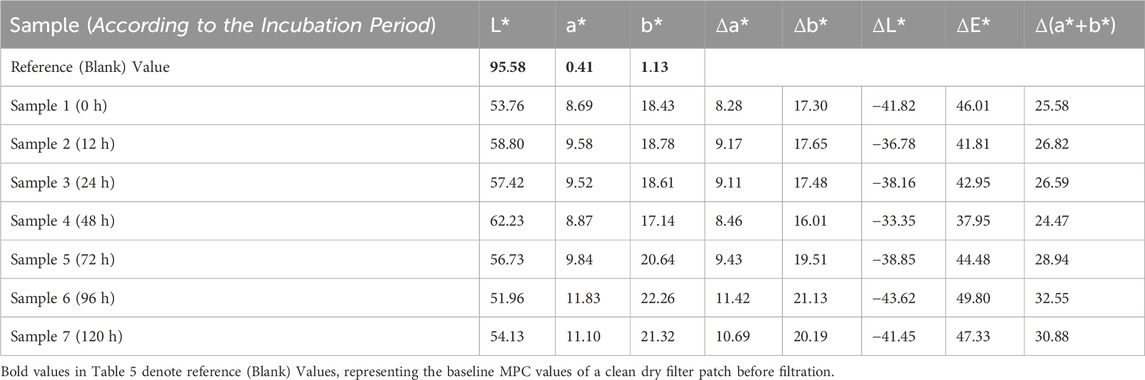
TABLE 5. MPC results of patch Group 4.
3.5 Patch group 5
The last group showcases results akin to the first, third, and fourth groups, indicating a slightly increasing trend alongside lower yet still abnormal MPC values (refer to Figure 7; Table 6), denoting critical levels. Noteworthy about this group is its distinctive feature of exhibiting the lowest average deviation among all groups, measuring at 1.37 for ΔE* and 0.87 for Δ(a*+b*).
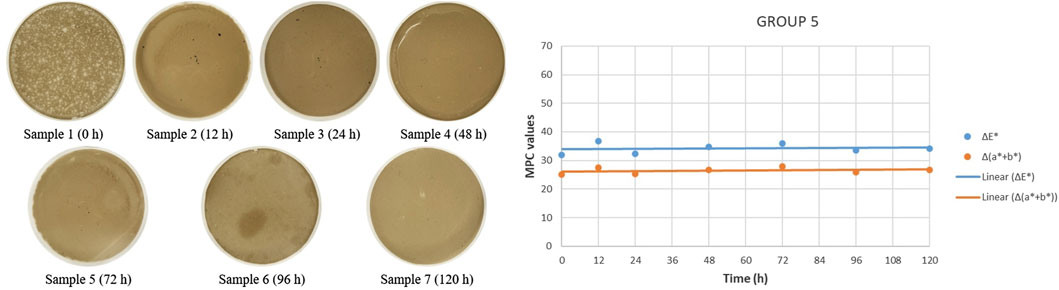
FIGURE 7. Patch group 5.
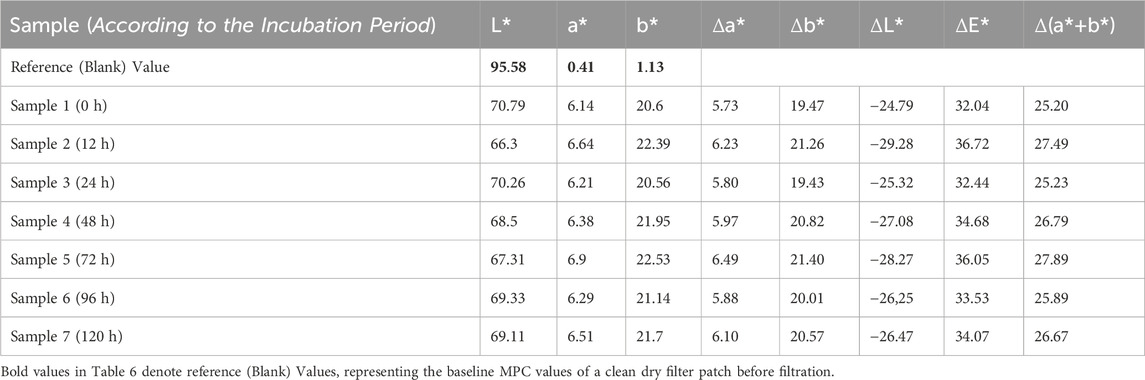
TABLE 6. MPC results of patch Group 5.
4 Conclusion
In this research paper, we validated the effect of sample incubation period on membrane patch color for insoluble contaminant measurement in degraded hydraulic oils. We performed and documented this experiment using 5 groups of oil samples (each with 7 different incubation periods) from hydraulic circuits obtained from 5 different rubber vulcanizing presses. Each group of samples provided us with 7 varnish-colored filter patches. We measured MPC values on these patches using a precision colorimeter and then statistically evaluated the results. Our analysis revealed that each group exhibited slightly different varnish concentrations, showcasing varying levels of varnish potential.
• Group 1 demonstrated critical varnish potential, prompting immediate action of oil replacement and circuit flushing. This was substantiated by significantly elevated ∆E* and ∆(a*+b*) values, emphasizing the urgency in maintenance.
• In contrast, Group 2 exhibited lower but still noteworthy varnish levels, advising careful monitoring and possible reevaluation of the hydraulic system. The absence of substantial correlation between incubation period and color variation in Group 2 suggests an independent influence on varnish development.
• Groups 3 and 4 showcased increasing trends in varnish potential, notably correlating with prolonged incubation periods. While Group 3 indicated a notable rise in varnish potential, the strength of this association wasn't fully supported by higher average deviation values, implying some variability within the data. Group 4, although exhibiting a similar trend, displayed MPC values closer to critical levels, warranting immediate attention and notification to the machine operator.
• Group 5, akin to the first, third, and fourth groups, showed an escalating varnish trend, signaling critical levels. Despite this, the distinguishing factor was its significantly lower average deviation compared to other groups, suggesting a more consistent behavior within this sample set.
It is important to highlight that while this research presents findings from conducted experiments, numerous additional experiments with various types of hydraulic oils were conducted. Regrettably, some of these experiments cannot be published due to issues such as missing time-period data for certain patches, resulting from malfunctions in the filtration apparatus or the filtration process itself. In summary, our extensive experimentation involving varnish potential testing and incubation period modifications with degraded and highly degraded hydraulic oils revealed a challenge in obtaining consistent results. The behavior of these degraded samples during filtration proved highly unpredictable. Varnish build-up led to rapid clogging of patches, causing uneven filtration processes and irregular patch coloring. A critical observation drawn from our research is that highly degraded oil samples do not necessarily require extended incubation periods of 72 h or longer, as this duration showcased negligible impact on varnish potential testing. Consequently, our findings differ from experiments conducted on new, undegraded oil samples, thus highlighting the variance in outcomes between degraded and pristine oil samples (Kon, T., 2018).
In conclusion, the results derived from our research revealed a deviation from our initial expectations regarding the impact of longer incubation periods. Contrary to our assumptions, the study demonstrated that the incubation period can be effectively shortened to less than 72 h without compromising measurement accuracy, particularly in hydraulic oils that are visually degraded (Milojević, S, 2015).
While contemporary methods, such as online monitoring and the use of nano-particle additives (Bukvić, M., 2023), have advanced machinery lubrication practices and mitigated numerous oil degradation processes, it remains paramount to emphasize the pivotal role of regular oil analysis and meticulous MPC varnish testing in safeguarding the operational reliability of hydraulic machinery. Integrating regular and proactive oil analysis, particularly incorporating MPC varnish testing, into maintenance protocols is essential to mitigate potential risks associated with varnish accumulation and ensure sustained operational performance. We recognize substantial potential in mitigating varnish formation through precise and timely analysis in hydraulic fluids. Our upcoming research will harness innovative approaches, incorporating fuzzy logic and neural networks, to devise effective solutions for modern lubrication systems Nasser, 2015, Sasaki et al., 2013.
Data availability statement
The raw data supporting the conclusion of this article will be made available by the authors, without undue reservation.
Author contributions
SP: Conceptualization, Data curation, Formal Analysis, Investigation, Methodology, Project administration, Supervision, Visualization, Writing–original draft, Writing–review and editing. DS: Data curation, Formal Analysis, Methodology, Project administration, Resources, Visualization, Writing–review and editing. JB: Formal Analysis, Project administration, Supervision, Writing–review and editing. LH: Conceptualization, Funding acquisition, Resources, Validation, Visualization, Writing–review and editing.
Funding
The author(s) declare financial support was received for the research, authorship, and/or publication of this article. This work has been supported by the Ministry of Education, Youth and Sports of the Czech Republic from the Specific Research Project SP 2023/003 (SV3403351) and the Specific Research Project SP 2024/001.
Conflict of interest
The authors declare that the research was conducted in the absence of any commercial or financial relationships that could be construed as a potential conflict of interest.
Publisher’s note
All claims expressed in this article are solely those of the authors and do not necessarily represent those of their affiliated organizations, or those of the publisher, the editors and the reviewers. Any product that may be evaluated in this article, or claim that may be made by its manufacturer, is not guaranteed or endorsed by the publisher.
References
ASTM D4057-22. Standard practice for manual sampling of petroleum and petroleum products. Am. Soc. Test. Mater. 06, 2022.
ASTM D4898-16 (2016). Standard test method for insoluble contamination of hydraulic fluids by gravimetric analysis. Am. Soc. Test. Mater. 12.
ASTM D7843-21. Standard test method for measurement of lubricant generated insoluble color bodies in in-service turbine oils using membrane patch colorimetry. Am. Soc. Test. Mater. 04, 2021.
Bukvić, M., Gajević, S., Skulić, A., Savić, S., Ašonja, A., and Stojanović, B. (2023). Tribological application of nanocomposite additives in industrial oils. Lubricants 12, 6. MDPI AG. doi:10.3390/lubricants12010006
Comparison Nas/Iso, [online]. 2020. Swift Filters, Inc. Available from: (2020). https://www.swift-jbinternational.com/comparison-NAS-ISO-cleanliness-codes.php.
Hong, S.-H., and Jang, E. K. (2023). Varnish Formation and removal in lubrication systems: a review. Materials 16 (10), 3737. MDPI AG. doi:10.3390/ma16103737
Hong, S.-H., and Jeon, H.-G. (2022). Monitoring the conditions of hydraulic oil with integrated oil sensors in construction equipment. Lubricants 10, 278. MDPI AG. doi:10.3390/lubricants10110278
Kon, T., Honda, T., and Sasaki, A. (2018). Influence of Solvents, oil temperature, and Incubation Period on membrane patch color, Tribol. Online 13. Japanese Society of Tribologists, 225–231. doi:10.2474/trol.13.225
Leslie, R. (2020). Rudnick synthetics, mineral oils, and bio-based lubricants chemistry and Technology. Boa Raton, FL, USA: CRC Press.
Lubricant Oxidation Analysis and Control, (2000). Machinery lubrication [online]. Available from: https://www.machinerylubrication.com/Read/14/lubricant-oxidation.
Milojević, S., Pešić, R., and Taranović, D. (2015). Tribological principles of constructing the reciprocating machines. Tribol. Industry. 37, 13–19.
Nasser, R. M. (2015). The behavior of some acrylate copolymers as lubricating oil additives. Germany: OmniScriptum GmbH & Co.KG. doi:10.13140/2.1.3170.0808
Opocenska, H., Nahodil, P., and Hammer, M. (2017).Use of multiparametric diagnostics in predictive maintenance, MM Sci. J. MM Publishing, 2090–2093. s.r.o. 317–322. doi:10.17973/mmsj.2017_12_201792
Sasaki, A. (2006). Contaminants in used oils and their problems. In proceedings of the institution of mechanical engineers, Part J J. Eng. Tribol., 220. SAGE Publications, 471–478. doi:10.1243/135065005x33955
Sasaki, A., Aoyama, H., Honda, T., Iwai, Y., and Yong, C. K. (2013).A study of the colors of contamination in used oils, Tribol. Trans., 57. Informa UK Limited, 1–10. doi:10.1080/10402004.2013.793782
Stojanović, B., Radosavljević, S., Veličković, S., Miladinović, S., and Bukvić, M. (2017). “The influence of lubricant viscosity on the efficiency of worm gear reducer,” in 8th International Scientific Conference Research and development of mechanical elements and systems (IRMES), Paris, France 7–9.
What Is Cielab Color Space?, (2023). HunterLab [online]. 2023. Available from: https://www.hunterlab.com/blog/what-is-cielab-color-space/.
White Paper Mpc, (2016). ASTM D 7843 varnish potential testing. ASTM D7843) [online]. 2016. Available from: https://proactivereliability.com/wp-content/uploads/2017/10/mpc-varnish-potential-testing-white-paper2.pdf.
Keywords: varnish, insoluble contaminants, degradation, oxidation, colorimetry, hydraulics
Citation: Pravda S, Sedenka D, Blata J and Hrabovsky L (2024) Influence of incubation period on membrane patch color for insoluble contaminant measurement in degraded hydraulic oils. Front. Mech. Eng 10:1366543. doi: 10.3389/fmech.2024.1366543
Received: 06 January 2024; Accepted: 15 February 2024;
Published: 15 March 2024.
Edited by:
Alessandro Ruggiero, University of Salerno, ItalyReviewed by:
Milan Bukvic, University of Kragujevac, SerbiaGuo Xiang, Technion Israel Institute of Technology, Israel
Copyright © 2024 Pravda, Sedenka, Blata and Hrabovsky. This is an open-access article distributed under the terms of the Creative Commons Attribution License (CC BY). The use, distribution or reproduction in other forums is permitted, provided the original author(s) and the copyright owner(s) are credited and that the original publication in this journal is cited, in accordance with accepted academic practice. No use, distribution or reproduction is permitted which does not comply with these terms.
*Correspondence: Stepan Pravda, stepan.pravda@vsb.cz