Monitoring Patient Response to Pembrolizumab With Peripheral Blood Exhaustion Marker Profiles
 Moira Graves1
  Giovana CelliMarchett2 Belinda van Zyl1 Denise Tang3 Ricardo E. Vilain1,4
  Andre van der Westhuizen1,2
  Nikola A. Bowden1*
- 1School of Medicine and Public Health, Hunter Medical Research Institute, University of Newcastle, Newcastle, NSW, Australia
- 2Department of Medical Oncology, Calvary Mater Hospital, Newcastle, NSW, Australia
- 3School of Biomedical Science and Pharmacy, University of Newcastle, Newcastle, NSW, Australia
- 4Department of Anatomical Pathology, Pathology NSW, Newcastle, NSW, Australia
Exhausted T cells are effector T cells that are silenced due to continuous T cell receptor (TCR) stimulation from persistent antigens. Characteristics of exhaustion include the increased expression of multiple inhibitory receptors such as programme death-1[PD-1], lymphocyte activation gene 3 [LAG-3], T cell Ig and mucin domain [TIM-3], the loss of effector cytokine secretion and altered transcriptional profile. The PD-1/PD-L1 interaction induces functional exhaustion of tumor-reactive cytotoxic T cells and interferes with anti-tumor T cell immunity. T cell exhaustion has been observed in metastatic melanoma patients where the exhaustion of tumor specific T cells suggests that tumor clearance has been impeded and contributed to tumor immune escape. Checkpoint immunotherapies are antibodies designed to block the interaction between the inhibitory receptors expressed on T cells and their respective ligands. Therapies such as anti-PD-1 (Pembrolizumab and Nivolumab) block these inhibitory receptors and are associated with a significant improvement in overall survival and progression free survival. However, only 20–40% of metastatic melanoma patients experience long-term benefit. In a cohort of 16 metastatic melanoma patients receiving pembrolizumab, blood was serially collected before each infusion (mean 8.3; range 1–12 cycles). The presence of inhibitory markers LAG-3, TIM-3, and PD-1 on the surface of T cells was examined and assessed in relation to patient response to identify if inhibitory markers can be used to differentiate responders from non-responders for Pembrolizumab. We confirmed that across a range of cycles (range 1–26) of pembrolizumab, PD-1 expression was significantly higher on CD4+ T cells from non-responders compared to responders and TIM-3 expressed on the surface of CD8+ T cells was significantly higher in non-responders compared to responders. This longitudinal data confirms previous studies that assessed single timepoints. This study provides preliminary evidence that PD-1 and TIM-3 may be predictive of non-responders when assessed over multiple treatment cycles.
Background
Antibodies to cytotoxic T-lymphocyte-associated protein 4 (CTLA-4), programme death ligand 1(PD-L1), and programme death 1 (PD-1) have been approved for treatment of metastatic melanoma (1–4).
T cell exhaustion is a process in which there is increased expression of inhibitory molecules, reduced cytokine production, an altered transcriptional programme, metabolic changes and failure to persist long term (5). T cell exhaustion can be viewed as both a mechanism to promote peripheral tolerance and a contributor to cancer. It can dampen the responsiveness of T cells resulting in autoimmunity and establishment host-tumor stalemate. Checkpoint blockade targeting inhibitory receptor pathways (eg PD-1) can reinvigorate exhausted T cells (TEX cells) (6), providing considerable benefits for cancer patients (7, 8). However, recent studies have demonstrated that checkpoint blockade alone does not necessarily improve the durability of “reinvigorated” TEX cells (9). These observations are consistent with the lack of long-term clinical benefits in a proportion of patients upon administration of checkpoint inhibitor blockade (10, 11). Moreover, prolonged chronic infection leads to progressive depletion of TEX cell population (12) and the response to PD-1 blockade also declines over time (13), indicating a poor ability to sustain TEX cell responses. Investigating changes in expression of surface exhaustion markers may indicate in advance if a patient is no longer sustaining a TEX cell response to immune checkpoint inhibitor immunotherapy.
Exhaustion Markers
TEX cells are induced when there is chronic antigen stimulation such as viral antigens or tumor antigens. The resultant cells express multiple inhibitory receptors including PD-1, CTLA-4, Tim-3, and LAG-3.
PD-1 is a member of the B7-CD28 family and is expressed on myeloid derived cells, B cells and T cells (14). It has two ligands –PD-L1 (expressed on a diverse selection of cells including leucocytes, parenchymal cells and tumor cells) and PD-L2 (expressed by dendritic cells and macrophages). The PD-1 receptor on T cells binds the PD-L1 on the antigen presenting cells (APC) and inhibits the pro-inflammatory scenarios such as T cell proliferation and cytokine production (15). Adaptive resistance to PD-1 monotherapy has been associated with the upregulation of other checkpoint inhibitors (16).
T cell immunoglobulin and mucin domain 3 (TIM-3) is an immunoglobulin (Ig) and mucin domain family cell surface molecule. It was originally found on CD4 helper 1 (Th1) and CD8 T cells and is now known to be expressed on regulatory T (Treg) cells, monocytes, macrophages, natural killer (NK) cells, mast cells and dendritic cells (DC). Tim-3 has been designated as an immune checkpoint and exhaustion marker, but recent evidence shows both positive and inhibitory functions (17, 18). Tim-3 has often being co-expressed with other checkpoint inhibitors in T cell exhaustion in tumors in humans (19). In melanoma, the upregulation of Tim-3 along with PD-1 shows a distinctive highly non-responsive population of CD8 T cells (20). Tim-3 is an attractive target for monitoring immunotherapy response as it is an exhaustion marker in both tumors and chronic infections. Studies in mice have shown long term protection when Tim-3 monoclonal antibody was combined with agonist antibodies against the co-stimulatory molecules on CD137 on T cells (21).
Lymphocyte-activation gene 3 (Lag-3) is a cell surface molecule expressed on the surface of activated T cells, NK cells, B cells, and plasmacytoid DC. It has been shown to bind to major histocompatiblity complex (MHC) class II molecules at a site distinct from CD4 and with higher affinity (22). In mice studies, Lag-3 is important for the suppression function of Tregs (23, 24). The co-expression of Lag-3 and PD-1 on exhausted T cells or Tregs correlates with a greater state of effector T cell exhaustion and suppressive function of Tregs (25, 26). Soluble Lag-3 has been detected in the plasma of cancer patients and correlated with higher overall survival and disease free survival rates (27). Clinical trials are now underway to examine the effect of using a Lag-3 mAb (BMS-986016) in cancer patients either as a single agent or in combination with PD-1 blockade (Clinical Trials.gov: NCT02061761, NCT01968109).
The aim of this study was to determine PD-1, Tim-3, and Lag-3 expression on T cell subsets across a prolonged timecourse from patients receiving the anti-PD1 therapy pembrolizumab. Response to the anti-PD1 immunotherapy pembrolizumab was recorded and PD-1, Tim-3 and Lag-3 expression for responders was compared to non-responders.
Methods
Cohort
Patients receiving anti-PD1 monotherapy (Pembrolizumab) within the Department of Medical Oncology, Calvary Mater Hospital, Newcastle, Australia were approached to participate in the study. The protocol was approved by the Hunter New England Human Research Ethics Committee (Ethics approval: 14/12/10/4.02). In accordance with the Australian National Statement on Ethical Conduct in Human Research (2007), all subjects gave written informed consent in accordance with the Declaration of Helsinki. A total of 16 patients; 5 females and 11 males, aged from 48 to 80 years gave fully informed, signed consent to participate in the study. The number of cycles of Pembrolizumab received per patient at the start of the serial blood collections ranged from 1 to 26 cycles, with a mean cycle number of 11.4 ± 9.0 (Table 1). Clinical characteristics including age of diagnosis, BRAF mutation status, duration of BRAF/MRK inhibitor treatment, baseline LDH, burden of disease and age at commencement of pembrolizumab was also collated (Table 1). Patients were considered responders if at the time of their last blood collection disease progression defined by iRECIST (28) had not occurred. Non-responders were patients with disease progression confirmed by iRECIST (28), blood collection for non-responders ceased with discontinuation of pembrolizumab. Two study participants had clinically controlled auto-immune diseases (Graves' disease and Sjogren Disease) which was considered in statistical analysis to account for the influence of this on the expression of exhaustion markers.
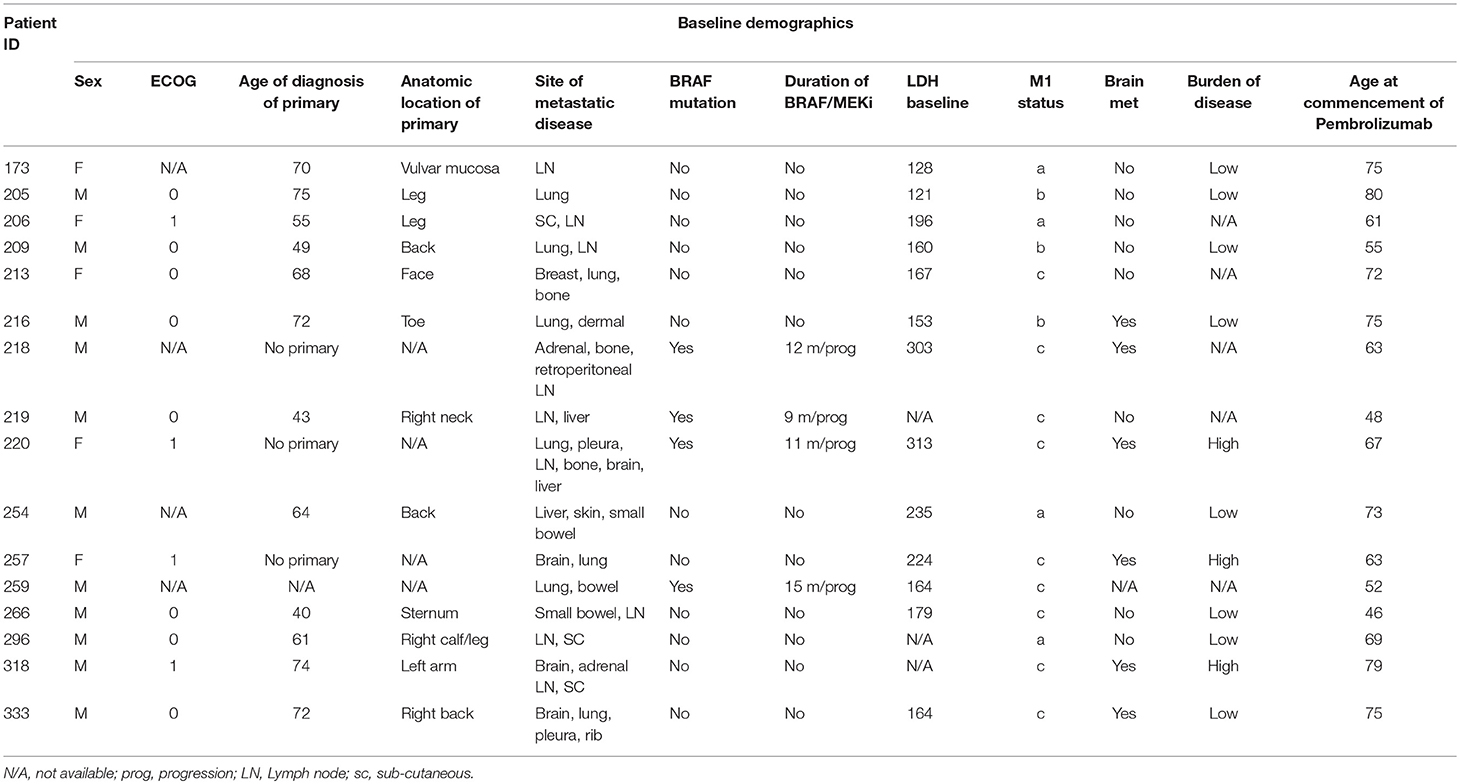
Table 1. Cohort baseline clinical characteristics.
Whole blood was collected before each infusion of Pembrolizumab for up to 12 cycles (mean 8.3; range 1–12) or until disease progression. Whole blood was separated into peripheral blood mononuclear cells (PBMCs) and plasma and stored at −80°C.
Flow Cytometry
PBMC samples were thawed rapidly, washed in RPMI media, rested for 1 h at 37°C and washed twice more in RPMI. The cells were resuspended at a concentration of 1–10 × 106 cells/mL, and 1uL of BD Horizon Fixable Viability stain 575V was added and incubated at room temperature for 15 min. Samples were washed twice with BD Pharmingen Stain Buffer. The following targets were co-stained: Hu CD3 BUV737 UCHT1, Hu CD4 BUV496 SK3, Hu CD8 APC-H7 SK1, Hu CD279(PD-1) BB515 EH12.1, Hu TIM-3(CD366) Alexa 647 7D3, Hu LAG-3(CD223) APC-R700 T47-530 was added to each sample and incubated for 30 min at 2–8oC. The samples were washed twice with stain buffer. After final wash, 350 uL of stain buffer was added to each sample and data acquired on a Fortessa X20 (BD Biosciences). Each sample was analyzed in duplicate, non-consecutively.
Gated T-cells (CD3+, live, single cell, lymphocytes) were gated as CD4+ or CD8+ and further divided by presence of PD-1, LAG3, or TIM3. Co-expression of the 3 exhaustion markers was assessed but no further analysis was conducted due to very low percentage of cells positive for 2 or more exhaustion markers. Student's 2-tailed t-test was used to compare the mean of each group and one way ANOVA was performed with multiple comparison (Bonferroni) testing between the individual timepoints for each group in our cohort. Statistical analysis was performed on data using FlowJo v12, SPSS V25 and R.
Results
Sixteen metastatic melanoma patients receiving Pembrolizumab monotherapy participated in this study; 31.3% female and 68.8% male. Five patients ceased treatment due to disease progression (31.3%) during the study. Four patients (25%) were BRAF V600E positive and had received previous BRAF/MEK inhibitor treatment, on which they had progressed before commencing Pembrolizumab (Table 2). Of the 5 patients that progressed on pembrolizumab monotherapy; 2 patients died and 3 patients were enrolled in new clinical trials. There was no significant difference in age at diagnosis (p = 0.60) or age when commenced on pembrolizumab (p = 0.61) between the responders and non-responders. BRAF mutation status and disease burden (where known) did not correlate with response. There was not a significant difference in PD-1, TIM3, or LAG3 on CD4+ or CD8+ T cells in patients with a BRAF mutation compared to those without.
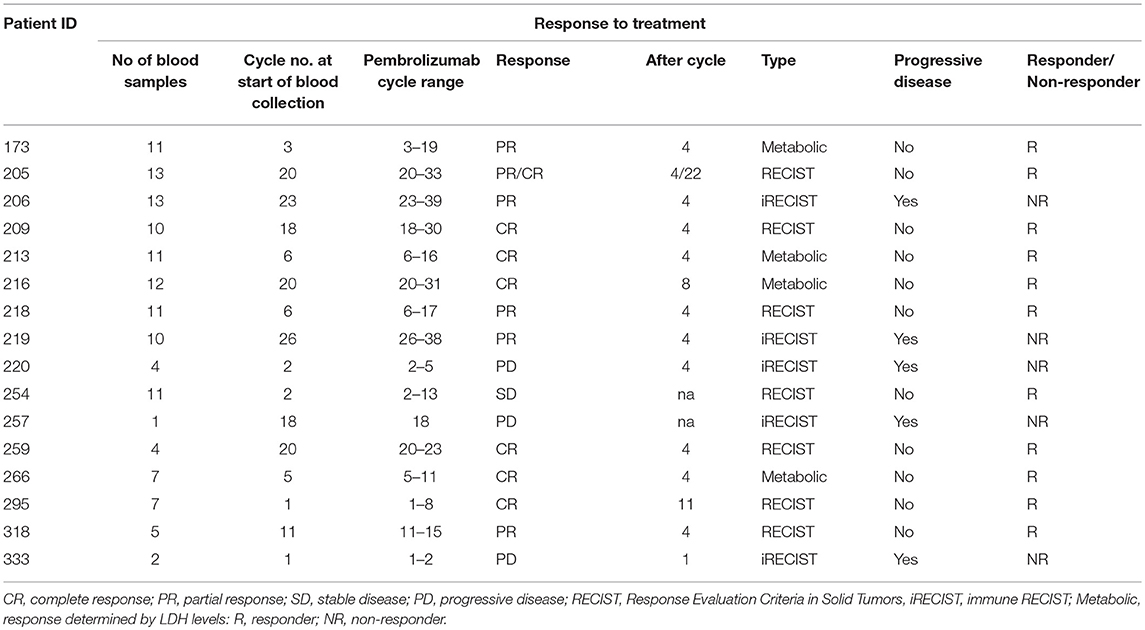
Table 2. Cohort response to pembrolizumab.
PD-1
There was a significantly higher frequency of PD-1 on the surface of CD4+ T cells of the non-responders when compared to the responder cohort (3.3 and 1.4% respectively, p = 0.009) (Figure 1A). Examining the average frequency of the PD-1 on the surface of CD8+ T cells in the groups, there was no significant difference between non-responders and responders (p = 0.11) (Figure 1B).
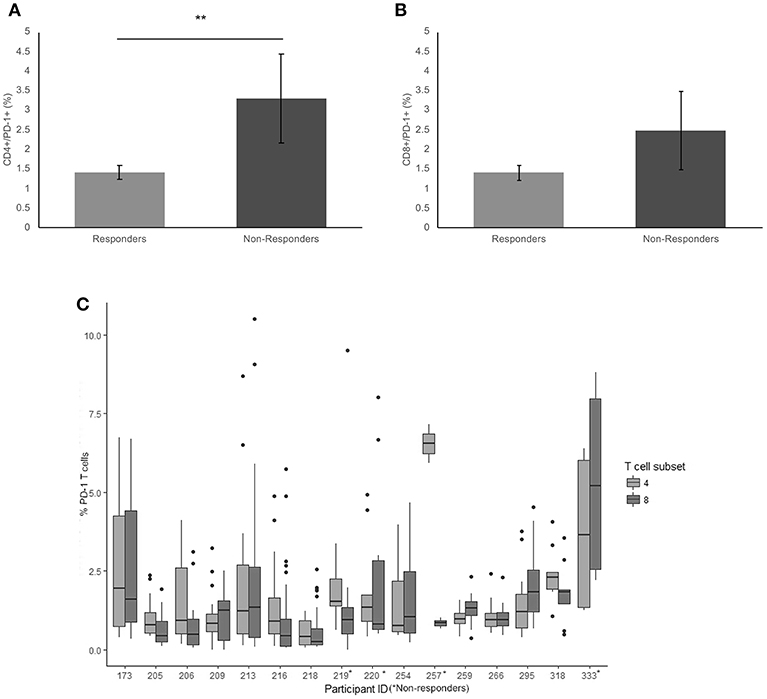
Figure 1. Frequency of PD-1 expressionon CD4+ and CD8+ T cells. (A) The mean percentage of CD4+ T cells expressing PD-1 in non-responders responders to pembrolizumab (B) The mean percentage of CD8+ T cells expressing PD-1 in non-responders responders to pembrolizumab (C) Boxplot of mean frequency of PD-1 on CD4+ and CD8+ T cells per patient per cycle. **p < 0.01.
PD-1 was detected in all patients on both CD4+ and CD8+ T cells (Figure 1C). The percentage and mean fluorescence intensity (MFI) of CD4+ and CD8+ T cells that were positive for PD-1 show large variability (Figure 1C and Supplementary Figure 1). and one way ANOVA with multiple comparison (Bonferroni) testing between the groups confirmed that there was a significant difference between the frequency of PD-1 on the surface of CD4+ T cells of the non-responders when compared to the responder cohort (p = 0.050) when corrected for age of diagnosis, age at commencement of pembrolizumab and number of cycles received. There was no significant difference between responders and non-responders for the frequency of the PD-1 on the surface of CD8+ T cells in individuals. The MFI was not significantly different between responders and non-responders but did show a trend toward the same difference between responders and non-responders.
TIM-3
There was a significant difference in average frequency of TIM-3 on the surface of CD4+ T cells between responders and non-responders (p = 0.017) (Figure 2A). The average frequency of TIM-3 expressed on the surface of CD8+ T cells was also significantly higher in non-responders compared to responders (p = 0.023) (Figure 2B).
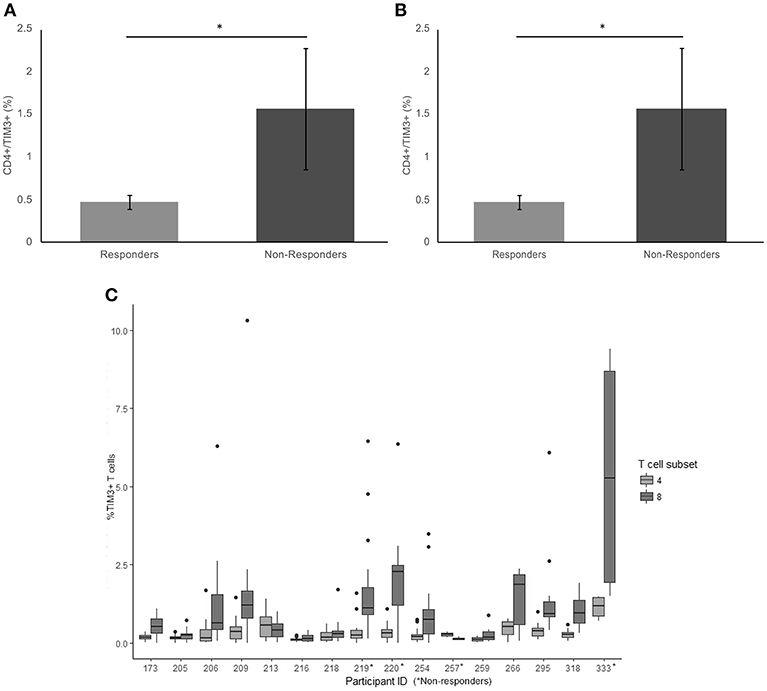
Figure 2. Frequency of TIM3 expression on CD4+ and CD8+ T cells. (A) The mean percentage of CD4+ T cells expressing TIM3 in non-responders responders to pembrolizumab (B) The mean percentage of CD8+ T cells expressing TIM3 in non-responders responders to pembrolizumab (C) Boxplot of mean frequency of TIM3 on CD4+ and CD8+ T cells per patient per cycle. *p < 0.05.
TIM-3 was detected at relatively low levels (< 2%, MFI < 80) on CD4+ T cells (Figure 2C and Supplementary Figure 2) in patients at every treatment cycle. Six patients had spiked increase of >5% TIM-3 positive CD8+ T cells, including 3 (75%) of the non-responders (Figure 2B). Statistical comparison between the groups controlling for age of diagnosis, age at commencement of pembrolizumab and number of cycles received confirmed that TIM-3 expressed on the surface of CD8+ T cells was significantly higher in non-responders compared to responders (p = 0.047). There was no significant difference between responders and non-responders (p = 0.120) in average frequency of TIM-3 on the surface of CD4+ T cells when taking age into consideration.
LAG-3
The average frequency for LAG-3 was very low (< 0.2% average expression across the cohort) There was no significant difference between non-responders and responder groups on CD4+ T cells (p = 0.18) (Figure 3A). The average frequency of LAG-3 on CD8+ T cells was also not significantly different between responders and non-responders (p = 0.124) (Figure 3B).
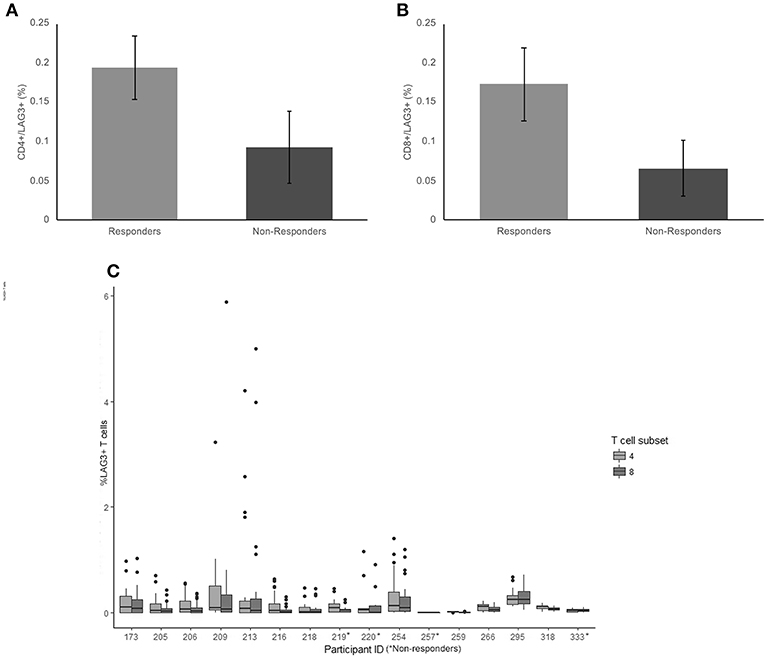
Figure 3. Frequency of LAG3 expression on CD4+ and CD8+ T cells. (A) The mean percentage of CD4+ T cells expressing LAG3 in non-responders responders to pembrolizumab (B) The mean percentage of CD8+ T cells expressing LAG3 in non-responders responders to pembrolizumab (C) Boxplot of mean frequency of LAG3 on CD4+ and CD8+ T cells per patient per cycle.
LAG-3 was the only marker to not be detected on CD4+ and CD8+ T cells at all cycles. Twelve of the 16 patients had no detectable or < 0.5% positive cells for at least 1 cycle of treatment (Figure 3C). The wide variation in frequency of LAG-3 expression was not related to any other clinical characteristic.
Discussion
Immune checkpoints are essential for the maintenance of immune self-tolerance. Tumor cells can hijack these immune-regulatory mechanisms allowing cancers to continue to grow and metastasize despite early responses to treatment. The manipulation of these pathways with immune checkpoint inhibitors has given cancers such as melanoma, new and successful treatment options, often with durable responses. Despite this progress, reliable real-time predictive biomarkers of response are still to be identified.
In this study, peripheral blood samples were collected longitudinally to assess the variation in PD-1, TIM-3, and LAG3 during successful treatment and when disease progression occurs. PD-1 was expressed more frequently on the CD4+ T cells of non-responders and TIM-3 was more frequently expressed on both CD4+ and CD8+ T cells of non-responders to Pembrolizumab. LAG-3 showed very low expression and no significant differences between non-responders and responders on either T-cell population.
A recent study by Huang et al. (29) involved a cohort of stage IV melanoma patients receiving pembrolizumab, that were previously treated with Ipilimumab (anti-CTLA-4). The cohort contained 29 patients with 11 responders and 18 non-responders. PBMCs were collected before commencing therapy and every 3 weeks for a total of 12 weeks. PD-1 expression levels were determined by direct staining of PD-1 bound pembrolizumab and TIM-3 and LAG3 expression was determined by commercial antibodies. The percentage of cells positive for PD-1 or TIM-3 expression was similar to the percentage reported here, but there was no significant difference in expression of either marker reported on CD4+ or CD8+ T cells from responders compared to non-responders. The use of the Hu CD279(PD-1) antibody to detect PD-1 in the current study may be responsible for the differing results. The later stages of treatment collected in the current study may also have contributed to the differing results for PD-1 and TIM-3 expression reported.
In another similar study, Krieg et al. (30) examined PBMCs from patients before commencement of pembrolizumab or nivolumab and after 12 weeks of treatment in 2 datasets of (n = 10 and n = 11). Significantly higher expression of PD-1 was seen on CD4+ T cells from responders in dataset 1 containing 5 responders and 5 non-responders. The difference was not seen in dataset 2. The presence of LAG3 or TIM-3 on the surface of T cells was not investigated. The single timepoint 12 weeks after commencing pembrolizumab, smaller cohort in dataset 1 and much higher percentage of CD4+ cells detected with expression of PD-1 (>10% in dataset 1 compared to < 5% in dataset 2 and the current study) may be the reason for the differing results to those reported herein and dataset 2 in the study by Krieg et al.
The results from direct labeling of pembrolizumb and commercial PD-1 antibody detection methods for quantifying PD-1 have differed between studies (29, 30) Zelba et al. (31) recently compared commercially available anti-PD-1 diagnostic antibodies and tested binding to the PD-1 receptor in the presence of the therapeutic antagonists pembrolizumab and nivolumab. The conclusion of the study was that commercial antibodies to the PD-1 receptor on T-cells do not reliably quantify PD-1 expression levels on PBMCs from patients treated with anti PD-1 antibodies. Interestingly, the only studies to report differences in PD-1 expression on PBMCs have used commercial antibodies to detect PD-1. We hypothesize that an increase in PD1 detection by commercial antibodies such as the BD biosciences Hu CD279(PD-1) MIH4 clone used in the current study may be indicative of an increase in “available” PD1 sites where pembrolizumab has not bound in non-responders. This result is preliminary and requires further investigation and confirmation in a larger cohort, but may be a potential biomarker for non-responders to pembrolizumab.
This is the first study of longitudinally collected blood samples (up to 12 collection timepoints) from patients receiving pembrolizuab. The novel feature of this approach was the analysis of PD-1, TIM3, and LAG-3 before and whilst disease progression was confirmed. It may be difficult to define robust predictive biomarkers for response to Pembrolizumab, given that that immune system is dynamic and there are interpersonal differences in expression between patients. In our study, there was a mixture of long-term responders and patients early in treatment. There was no difference in the age or burden of disease in the responders and non-responders in this study, therefore while these factors contributing to the higher PD-1 and TIM3 expression cannot be completely excluded there was no evidence of age or disease burden influencing the result in this study. Analysis of a validation cohort is required before a peripheral blood biomarker panel of several surface markers, including PD-1 and TIM-3, on a number of immune cell subtypes may be useful from blood samples collected over an extended period of treatment.
Ethics Statement
This study was carried out in accordance with the recommendations of the National statement on ethical conduct in human research, National Health and Medical Research Council, Australia with written informed consent from all subjects. All subjects gave written informed consent in accordance with the Declaration of Helsinki. The protocol was approved by the Hunter New England Human Research Ethics Committee.
Author Contributions
MG designed the study, collected, and analyzed data and wrote the manuscript. GC collated clinical information for the cohort. BvZ and DT processed blood samples and contributed to data collection. RV contributed to data analysis, interpretation of clinical information and the final version of the manuscript. AvdW recruited patients, contributed to design of the study, collation of clinical information and the final version of the manuscript. NB designed the study, contributed to data analysis and interpretation, and wrote the manuscript.
Funding
MG, NB and the study were supported by a Cancer Institute NSW Career Development Fellowship (14CDF117); BvZ and NB were supported by Vanessa McGuigan HMRI Fellowship and project grants. MG and the study was supported by the Maitland Cancer Appeal, NSW Australia. Patient blood samples were collected as part of the Hunter Cancer Biobank Sequential Blood Collection Project funded by the Cancer Institute NSW Hunter Cancer Research Alliance and NSW Pathology.
Conflict of Interest Statement
The authors declare that the research was conducted in the absence of any commercial or financial relationships that could be construed as a potential conflict of interest.
Supplementary Material
The Supplementary Material for this article can be found online at: https://www.frontiersin.org/articles/10.3389/fmed.2019.00113/full#supplementary-material
Supplementary Figure 1. Mean fluorescence intensity (MFI) of PD-1, expression on (a) CD4+ and (b) CD8+ T cells in individual non-responders to Pembrolizumab.
Supplementary Figure 2. Mean fluorescence intensity (MFI) of TIM3, expression on (a) CD4+ and (b) CD8+ T cells in individual non-responders to Pembrolizumab.
References
1. Hamid O, Robert C, Daud A, Hodi FS, Hwu JW, Kefford R, et al. Safety and tumor responses with Lambrolizumab (Anti–PD-1) in melanoma. N Engl J Med. (2013) 369:134–44. doi: 10.1056/NEJMoa1305133
2. Hodi FS, O'Day SJ, McDermott DF, Weber RW, Sosman JA, Haanen JB, et al. Improved survival with ipilimumab in patients with metastatic melanoma. N Engl J Med. (2010) 363:711–23. doi: 10.1056/NEJMoa1003466
3. Brahmer JR, Tykodi SS, Chow LQ, Hwu WJ, Topalian SL, Hwu P, et al. Safety and activity of anti-PD-L1 antibody in patients with advanced cancer. N Engl J Med. (2012) 366:2455–65. doi: 10.1056/NEJMoa1200694
4. Vanella V, Festino L, Strudel M, Simeone E, Grimaldi AM, Ascierto PA. PD-L1 inhibitors in the pipeline: promise and progress. Oncoimmunology. (2017) 7:e1365209. doi: 10.1080/2162402X.2017.1365209
5. Wherry EJ, Kurachi M. Molecular and cellular insights into T cell exhaustion. Nat Rev Immunol. (2015) 15:486–99. doi: 10.1038/nri3862
6. Barber DL, Wherry EJ, Masopust D, Zhu B, Allison JP, Sharpe AH, et al. Restoring function in exhausted CD8 T cells during chronic viral infection. Nature. (2006) 439:682–7. doi: 10.1038/nature04444
7. Brahmer JR, Drake CG, Wollner I, Powderly JD, Picus J, Sharfman WH, et al. Phase I study of single-agent anti-programmed death-1 (MDX-1106) in refractory solid tumors: safety, clinical activity, pharmacodynamics, and immunologic correlates. J Clin Oncol. (2010) 28:3167–75. doi: 10.1200/JCO.2009.26.7609
8. Topalian SL, Hodi FS, Brahmer JR, Gettinger SN, Smith DC, McDermott DF, et al. Safety, activity, and immune correlates of anti-PD-1 antibody in cancer. N Engl J Med. (2012) 366:2443–54. doi: 10.1056/NEJMoa1200690
9. Pauken KE, Sammons MA, Odorizzi PM, Manne S, Godec J, Khan O, et al. Epigenetic stability of exhausted T cells limits durability of reinvigoration by PD-1 blockade. Science. (2016) 354:1160–5. doi: 10.1126/science.aaf2807
10. Pauken KE, Wherry EJ. Overcoming T cell exhaustion in infection and cancer. Trends Immunol. (2015) 36:265–76. doi: 10.1016/j.it.2015.02.008
11. Sharma P, Allison JP. Immune checkpoint targeting in cancer therapy: toward combination strategies with curative potential. Cell. (2015) 161:205–14. doi: 10.1016/j.cell.2015.03.030
12. Paley MA, Kroy DC, Odorizzi PM, Johnnidis JB, Dolfi DV, Barnett BE, et al. Progenitor and terminal subsets of CD8+ T cells cooperate to contain chronic viral infection. Science. (2012) 338:1220–5. doi: 10.1126/science.1229620
13. Penaloza-MacMaster P, Provine NM, Blass E, Barouch DH. CD4 T cell depletion substantially augments the rescue potential of PD-L1 blockade for deeply exhausted CD8 T cells. J. Immunol. (2015) 195:1054–63. doi: 10.4049/jimmunol.1403237
14. Chen L. Co-inhibitory molecules of the B7-CD28 family in the control of T-cell immunity. Nat Rev Immunol. (2004) 4:336–47. doi: 10.1038/nri1349
15. Tseng SY, Otsuji M, Gorski K, Huang X, Slansky JE, Pai SI, et al. B7-DC, a new dendritic cell molecule with potent costimulatory properties for T cells. J Exp Med. (2001) 193:839–46. doi: 10.1084/jem.193.7.839
16. Koyama S, Akbay EA, Li YY, Herter-Sprie GS, Buczkowski KA, Richards WG, et al. Adaptive resistance to therapeutic PD-1 blockade is associated with upregulation of alternative immune checkpoints. Nat Commun. (2016) 7:10501. doi: 10.1038/ncomms10501
17. Ferris RL, Lu B, Kane LP. Too much of a good thing? Tim-3 and TCR signaling in T cell exhaustion. J Immunol. (2014) 193:1525–30. doi: 10.4049/jimmunol.1400557
18. Phong BL, Avery L, Sumpter TL, Gorman JV, Watkins SC, Colgan JD, et al. Tim-3 enhances FcepsilonRI-proximal signaling to modulate mast cell activation. J Exp Med. (2015) 212:2289–304. doi: 10.1084/jem.20150388
19. Zehn D, Wherry EJ. Immune memory and exhaustion: clinically relevant lessons from the LCMV model. Adv Exp Med Biol. (2015) 850:137–52. doi: 10.1007/978-3-319-15774-0_10
20. Fourcade J, Sun Z, Benallaoua M, Guillaume P, Luescher IF, Sander C, et al. Upregulation of Tim-3 and PD-1 expression is associated with tumor antigen-specific CD8+ T cell dysfunction in melanoma patients. J Exp Med. (2010) 207:2175–86. doi: 10.1084/jem.20100637
21. Guo Z, Cheng D, Xia Z, Luan M, Wu L, Wang G, et al. Combined TIM-3 blockade and CD137 activation affords the long-term protection in a murine model of ovarian cancer. J Transl Med. (2013) 11:215. doi: 10.1186/1479-5876-11-215
22. Huard B, Prigent P, Tournier M, Bruniquel D, Triebel F. CD4/major histocompatibility complex class II interaction analyzed with CD4- and lymphocyte activation gene-3 (LAG-3)-Ig fusion proteins. Eur J Immunol. (1995) 25:2718–21. doi: 10.1002/eji.1830250949
23. Huang CT, Workman CJ, Flies D, Pan X, Marson AL, Zhou G, et al. Role of LAG-3 in regulatory T cells. Immunity. (2004) 21:503–13. doi: 10.1016/j.immuni.2004.08.010
24. Okamura T, Fujio K, Shibuya M, Sumitomo S, Shoda H, Sakaguchi S, et al. CD4+CD25-LAG3+ regulatory T cells controlled by the transcription factor Egr-2. Proc Natl Acad Sci USA. (2009) 106:13974–9. doi: 10.1073/pnas.0906872106
25. Blackburn SD, Shin H, Haining WN, Zou T, Workman CJ, Polley A, et al. Coregulation of CD8+ T cell exhaustion by multiple inhibitory receptors during chronic viral infection. Nat Immunol. (2009) 10:29–37. doi: 10.1038/ni.1679
26. Woo SR, Turnis ME, Goldberg MV, Bankoti J, Selby M, Nirschl CJ, et al. Immune inhibitory molecules LAG-3 and PD-1 synergistically regulate T-cell function to promote tumoral immune escape. Cancer Res. (2012) 72:917–27. doi: 10.1158/0008-5472.CAN-11-1620
27. Triebel F, Hacene K, Pichon MF. A soluble lymphocyte activation gene-3 (sLAG-3) protein as a prognostic factor in human breast cancer expressing estrogen or progesterone receptors. Cancer Lett. (2006) 235:147–53. doi: 10.1016/j.canlet.2005.04.015
28. Seymour L, Bogaerts J, Perrone A, Ford R, Schwartz LH, Mandrekar S, et al. iRECIST: guidelines for response criteria for use in trials testing immunotherapeutics. Lancet Oncol. (2017) 18:e143–52. doi: 10.1016/S1470-2045(17)30074-8
29. Huang AC, Postow MA, Orlowski RJ, Mick R, Bengsch B, Manne S, et al. T-cell invigoration to tumour burden ratio associated with anti-PD-1 response. Nature. (2017) 545:60–5. doi: 10.1038/nature22079
30. Krieg C, Nowicka M, Guglietta S, Schindler S, Hartmann FJ, Weber LM, et al. High-dimensional single-cell analysis predicts response to anti-PD-1 immunotherapy. Nat Med. (2018) 24:144–53. doi: 10.1038/nm.4466
Keywords: melanoma, pembrolizumab, T cell exhaustion, PD-1, TIM-3, LAG-3
Citation: Graves M, CelliMarchett G, van Zyl B, Tang D, Vilain RE, van der Westhuizen A and Bowden NA (2019) Monitoring Patient Response to Pembrolizumab With Peripheral Blood Exhaustion Marker Profiles. Front. Med. 6:113. doi: 10.3389/fmed.2019.00113
Received: 03 September 2018; Accepted: 07 May 2019;
Published: 22 May 2019.
Edited by:
Jason Waithman, Telethon Kids Institute, AustraliaReviewed by:
Remco Van Doorn, Leiden University Medical Center, NetherlandsAleix Prat, Hospital Clínic de Barcelona, Spain
Copyright © 2019 Graves, CelliMarchett, van Zyl, Tang, Vilain, van der Westhuizen and Bowden. This is an open-access article distributed under the terms of the Creative Commons Attribution License (CC BY). The use, distribution or reproduction in other forums is permitted, provided the original author(s) and the copyright owner(s) are credited and that the original publication in this journal is cited, in accordance with accepted academic practice. No use, distribution or reproduction is permitted which does not comply with these terms.
*Correspondence: Nikola A. Bowden, nikola.bowden@newcastle.edu.au