Admission Systolic Blood Pressure and In-hospital Mortality in Acute Type A Aortic Dissection: A Retrospective Observational Study
 Guifang Yang
 Wen Peng1,2
  Yang Zhou
 Huaping He
 Xiaogao Pan
 Xiangping Chai
- 1Department of Emergency Medicine, The Second Xiangya Hospital, Central South University, Changsha, China
- 2Emergency Medicine and Difficult Diseases Institute, Central South University, Changsha, China
- 3Department of Cardiovascular Surgery, The Second Xiangya Hospital, Central South University, Changsha, China
Background: Evidence between admission systolic blood pressure (SBP) and in-hospital deaths in acute type A aortic dissection (AAD) patients is inadequate. Here, we examined the relationship between SBP and in-hospital deaths in AAD patients.
Methods: 703 AAD patients were enrolled from January 2014 to December 2018. The independent and dependent variables targeted were admission SBP and in-hospital deaths, respectively. Gender, age, body mass index (BMI), chronic renal insufficiency, smoking, hypertension, diabetes, laboratory indicators, and management were used as covariates.
Results: The 703 participants had a mean age of 50.48 ± 11.35. About 76.24% of the participants were male. After adjusting for confounders, there was a negative correlation between AAD patients' admission SBP and in-hospital deaths (OR = 0.88, 95%CI 0.80–0.96). Consequently, a non-linear relationship of point 120 (mmHg) was detected between admission SBP and in-hospital deaths for AAD patients. Confidence intervals and effect sizes of the right (SBP >120 mmHg) and left (SBP ≤ 120 mmHg) sides of the inflection point were 0.96 (0.85–1.09) and 0.67 (0.51–0.88), respectively. The change in the male population and non-diabetes people was more pronounced according to subgroup analysis.
Conclusions: Correlation between admission SBP and in-hospital mortality of AAD patients is non-linear. SBP negatively correlated with in-hospital mortality when ≤120 mmHg.
Introduction
Numerous studies have identified blood pressure as a key determinant of adverse events in cardiovascular disease patients (1, 2). Various studies have observed the J-curve phenomenon amid blood pressure serial levels and adverse cardiovascular events like in-hospital mortality (3, 4). Many observational studies show that admission systolic blood pressure (SBP) is associated with the risk of death in acute cardiovascular conditions like acute heart failure (5) and cardiogenic shock (6, 7). Additionally, admission SBP is integrated into most danger scoring models in patients with acute coronary syndromes (8). Conversely, in-hospital deaths in patients with acute type A aortic dissection (AAD) are unclear in relation to SBP at admission. Here, we examined the relationship between SBP admission levels and in-hospital mortality among unselected consecutive AAD patients after adjusting for potential confounding factors.
Methods And Participants
Study Design
This retrospective, observational study used baseline admission SBP as independent variable and all-cause in-hospital death as dependent variable.
Study Population
We non-selectively and consecutively collected data for all participants at the Second Xiangya Hospital of Central South University, Changsha, Hunan, China. Anonymous data were compiled from the electronic hospital medical record system. Ethical approval for the study was provided by the hospital's institutional review board. Informed consent was waived because the study was retrospective.
The study involves 703 in-patients treated at the hospital from January 2014 to December 2018. Diagnosis was mainly based on 2014 ESC guidelines on the treatment and diagnosis of aortic ailments. Any dissection that involved the ascending aorta with presentation within 14 days of symptom onset was defined as AAD. The diagnosis of AAD was confirmed by imaging like Computed tomography (CT) or Magnetic resonance imaging (MRI). Inclusion criteria were hospital admission for acute type A aortic dissection patients within ≤ 14 days after symptoms onset. The following were used as exclusion criteria: (1) unfinished blood pressure tests, (2) presence of intramural hematoma, which a haematoma develops in the media of the aortic wall in the absence of an false lumen and intimal tear. Intramural haematoma is diagnosed in the presence of a circular or crescent-shaped thickening of more than 5 mm of the aortic wall in the absence of detectable blood flow, (3) presence of symptoms for >14 days.
Variables
Admission SBP for all AAD participants was measured at baseline. In-hospital mortality was described as all-cause death during admission. Study covariates involved general information, demographic data, blood biochemistry, medical imaging examination and treatment variables that can affect admission SBP, or in-hospital mortality. Variables for the construction of the fully adjusted model were: (1) continuous variables (age, BMI, time to presentation, aortic diameter, triglyceride (TG), high-density lipoprotein (HDL), ejection fraction (EF), low-density lipoprotein (LDL), creatinine (Cr), total cholesterol (TC), and obtained at baseline), and (2) categorical variables (including smoking, gender, diabetes, Marfan syndrome, bicuspid aortic valve, hypertension, stroke, atherosclerosis, aortic regurgitation, chronic renal insufficiency (CRI), abdominal vessel involvement, arch vessel involvement, symptom, and management.
Missing Data Addressing
We performed multiple multivariable imputations to address missing data in order to maximize statistical power and minimize bias. The data analysis had no covariates with missing data. In addition, five imputed datasets with chained equations were created using MICE software package (9). Sensitivity analysis found no significant differences between the generated complete data and raw data. Thus, all multivariable analyses results based on the imputed datasets were combined with Rubin's rules.
Statistical Analysis
Continuous variables are shown as mean ± SD (normal distribution) or medium (25th, 75th) [skewed distribution]. Categorical variables are shown as percentage. Kruskal Wallis H test (skewed distribution), chi-squared test (categorical variables) or ANOVA (One way) were used to analyze normally distributed data, particularly variations between different admission systolic blood pressure groups (Quartile). To investigate whether admission systolic blood pressure correlated with in-hospital mortality in certain members, statistical analyses were done in three key steps. Step 1: Multivariate and univariate regression (linear) models engaged. Three additional models were constructed. A crude model without covariates adjustment was made. Model I was adjusted only for sociodemographic data. The second model was made by adding the covariates as shown in Table 1 to the first model. Step 2 addressed non-linearity in admission SBP and in-hospital mortality. Fitting of an additive-generalized model and penalized spline method (smooth curve) was done. In case any detection of non-linearity was observed, the point of inflection was calculated using a recursive algorithm and a linear two-piece regression constructed. This was done on the inflection point for both sides. For the likelihood log-ratio test, the best fit model was checked on the values of P. Step 3: a stratified linear regression model was used for subgroup analyses. First, continuous variable were changed to categorical variables as stated in the clinical quartile (cut point) and an interaction test was done. A test on the likelihood ratio followed the checks done on the modification of effect for those of indicators on the subgroup. A sensitivity study was used to confirm the stoutness of data analysis that converted admission SBP to a categorical variable and the trend's p value calculated. The aim was to detect the likelihood of non-linearity and to affirm SBP admission results as a continuous variable. Survival curves were constructed using Kaplan–Meier analysis and parallels with the test on log-rank. EmpowerStats (http://www.empowerstats.com, X&Y Inc Solutions, Boston, MA) and R (http://www.r-project.org) were used for statistical analyses. P = <0.05 (two-sided) was considered statistically significant.
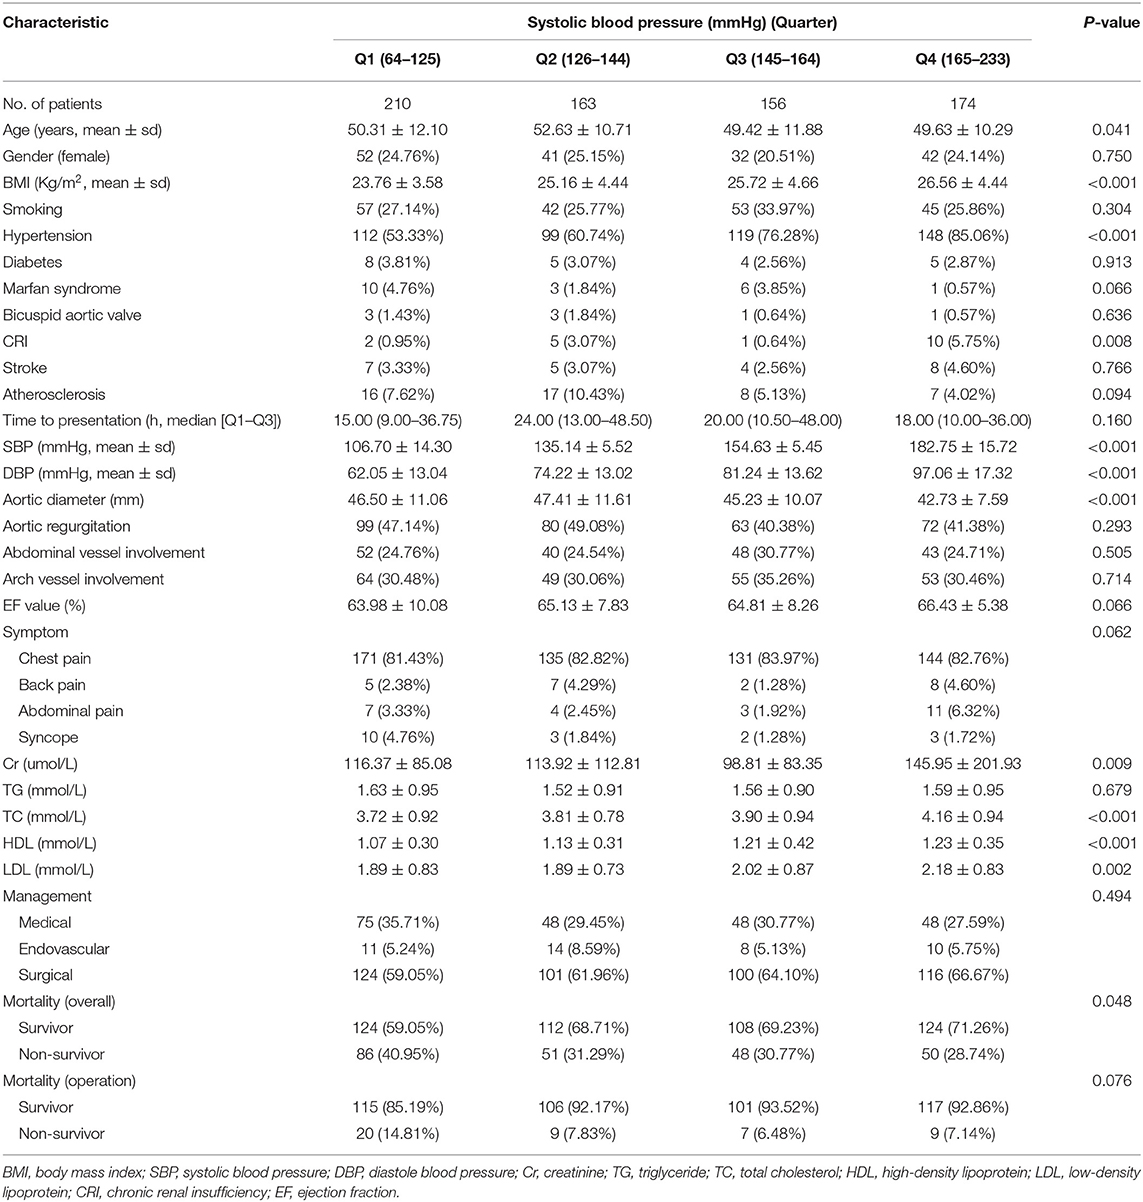
Table 1. Basline characteristics of the patients (N = 703).
Results
Characteristics of Selected Patients at Baseline
Based on exclusion and inclusion criteria, 703 participants were included (Figure 1). The baseline characteristics of these selected participants are shown in Table 1 in reference to the quartile admission SBP. The participant's average age was 50.48 ± 11.35 years and 76.24% of them were male. No statistically significant differences were observed for smoking, gender, Marfan syndrome, diabetes, bicuspid aortic valve, stroke, atherosclerosis, time to presentation, aortic regurgitation, abdominal vessel involvement, arch vessel involvement, EF value, symptom, TG, and management among different admission SBP clusters (all p values = >0.05). Contributors with the uppermost group of admission SBP (Q4) had higher values in BMI, DBP, Cr, TC, HDL, LDL, hypertension, and CRI relative to the other groups. Similar patterns were observed for age and aortic diameter in Q2 groups, and mortality in Q1 groups. Supplementary Tables 1, 2 show the causes of death in each quartile of operation (endovascular and surgical) patients and the rates of in-hospital complications for each quartile of medical management patients, respectively.
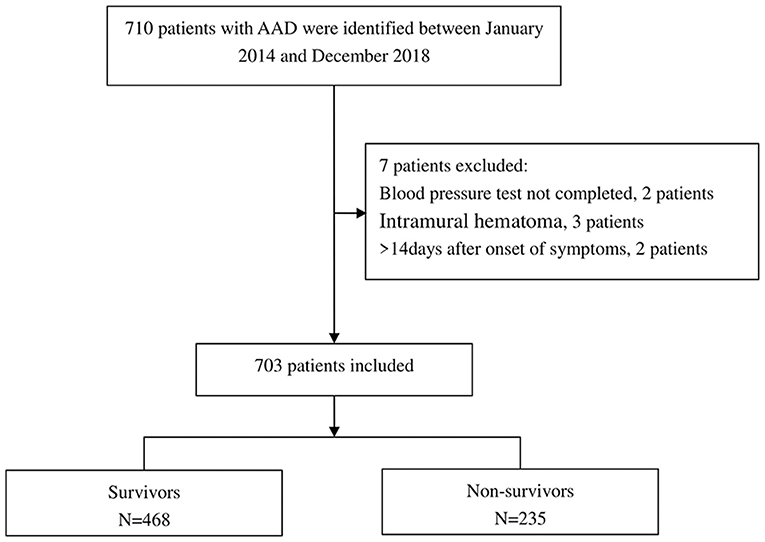
Figure 1. Flow chart of patient enrollment.
Univariate Analysis
Univariate analyses results (Table 2) revealed that gender (0.97, 0.67–1.40), BMI (1.00, 0.97–1.04), smoking (0.83, 0.58–1.18), hypertension (1.32, 0.94–1.86), diabetes (1.39, 0.59–3.31), mafan syndrome (1.34, 0.54–3.32), bicuspid aortic valve (0.66, 0.13–3.30), CRI (2.56, 0.99–6.56), stroke (2.04, 0.90–4.62), time to presentation (1.00, 0.99–1.00), aortic diameter (1.00, 0.99–1.02), aortic regurgitation (0.88, 0.64–1.21), abdominal vessel involvement (0.78, 0.54–1.13), arch vessel involvement (0.89, 0.63–1.25), EF value (0.99, 0.97–1.01), back pain (0.72, 0.28–1.87), abdominal pain (0.61, 0.24–1.54), syncope (1.22, 0.47–3.20), TG (1.16, 0.98–1.36), TC (1.04, 0.87–1.23), and LDL (0.83, 0.68–1.01) were not concomitant with the outcome variable. Additionally, SBP (0.91, 0.86–0.96), DBP (0.98, 0.97–0.99), HDL (0.50, 0.30–0.84), surgical (0.02, 0.01–0.03) and endovascular (0.01, 0.00–0.04) were negatively correlated with the outcome variable. Contrary to this, univariate analysis showed that age (1.02, 1.01–1.04), atherosclerosis (2.10, 1.17–3.79) and Cr (1.00, 1.00–1.00) correlated with the outcome variable.
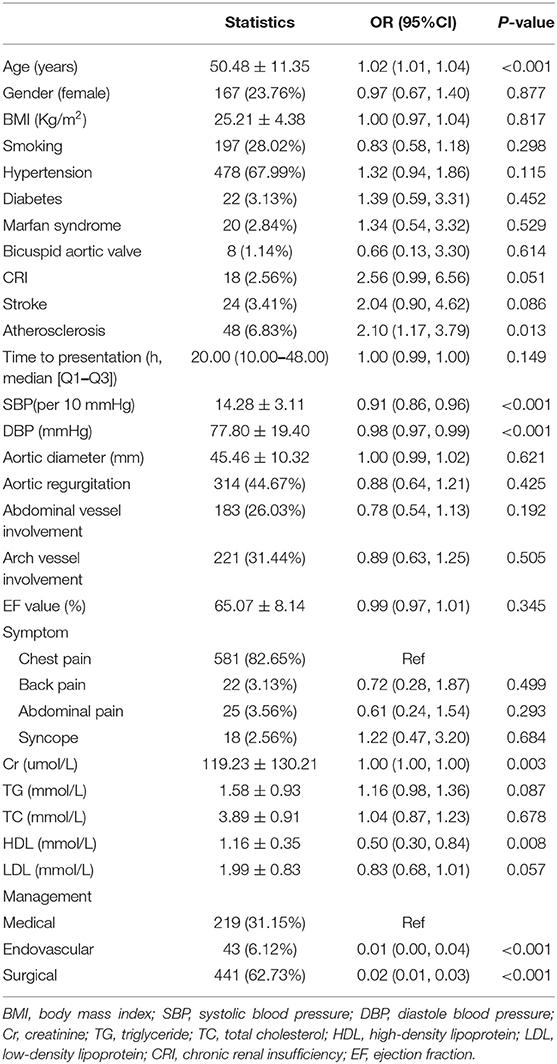
Table 2. Univariate analysis for in-hospital mortality.
Results of the Unadjusted and Adjusted Model
Three models were created in this experiment to examine the autonomous effects of admission SBP on in-hospital mortality after modifying for possible confounders. The effect values (OR) and 95% confidence intervals for these three equations are shown in Table 3. In the non-adjusted model (crude model), for every 10 mmHg rise in admission SBP, in-hospital death reduced by 9% (0.91, 95% CI 0.86–0.96). In the minimum-adjusted model (model I), admission SBP was greater by 10 mmHg and in-hospital mortality reduced by 9% (0.91, 95% CI 0.86–0.96). In the fully adjusted model (model II) (adjusted covariates are shown in Table 1, except DBP), for each additional 10 mmHg of admission SBP, in-hospital mortality reduced by 12% (0.88, 95% CI 0.80–0.96). We also converted admission SBP from a continuous variable to a categorical variable (Quartile). The P for trend of admission SBP with categorical variables in the fully adjusted model was constant with the result with admission SBP as a constant variable. However, when the admission SBP enters the fully-adjusted model as a categorical variable, the trend of the effective value in the different admission SBP group is non-equidistant. Based on this non-equidistant changes in effect size, there may be a non-linear relationship between in-hospital mortality and SBP admission.
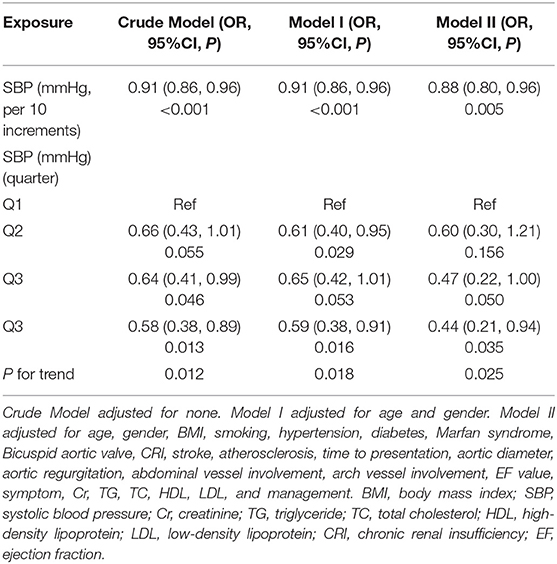
Table 3. Relationship between systolic blood pressure and in-hospital mortality in different models.
The Non-linearity Results Between In-hospital Mortality and Admission SBP
The current study examined the non-linear correlation between in-hospital mortality and admission SBP (Table 4, Figure 2). The smooth curve outcome revealed that the relationship between in-hospital mortality and admission SBP was non-linear (after amending for covariates presented in Table l excepted DBP). We fit the association between in-hospital mortality and admission SBP using linear regression model and two-piecewise linear regression model, respectively. The p-value for the log-likelihood ratio test was <0.05. This result indicates dual piecewise linear regression was more appropriate for fitting the association between admission SBP and in-hospital mortality since it perfectly represents association between admission SBP and in-hospital mortality. The premeditated inflection point was 120 (mmHg) through two-piecewise linear regression and recursive algorithm. On the left side of the inflection point (SBP ≤ 120 mmHg), effect size and 95% CI was 0.67 and 0.51–0.88, respectively (SBP per 10 increments). On the right side of the inflection point (SBP >120 mmHg), effect size and 95% CI was 0.96 0.85–1.09, correspondingly (SBP per 10 increments).
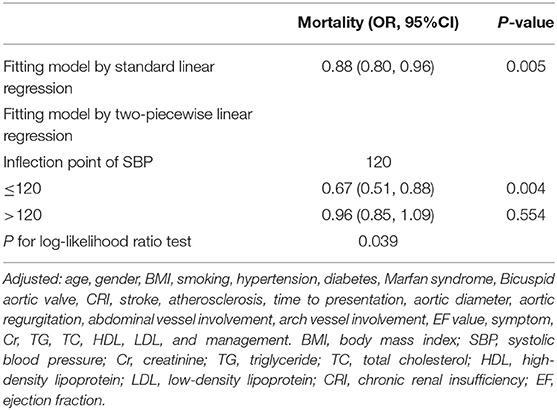
Table 4. The results of the two-piecewise linear model (SBP per 10 increments).
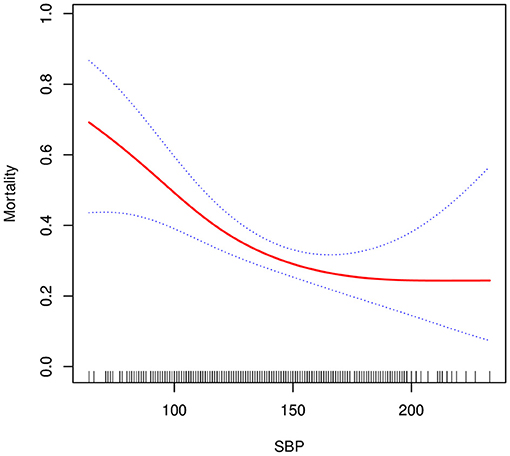
Figure 2. Association between systolic blood pressure and in-hospital mortality. A non-linear association between systolic blood pressure and in-hospital mortality was found (P = 0.009) in a generalized additive model (GAM). The solid red line represents the smooth curve fit between variables. Blue bands represent the 95% confidence interval from the fit. All adjusted for age, gender, BMI, smoking, hypertension, diabetes, Marfan syndrome, Bicuspid aortic valve, CRI, stroke, atherosclerosis, time to presentation, aortic diameter, aortic regurgitation, abdominal vessel involvement, arch vessel involvement, EF value, symptom, Cr, TG, TC, HDL, LDL, and management.
Subgroup Analysis
We used gender, age, smoking, BMI, hypertension, diabetes, Marfan syndrome, bicuspid aortic valve, CRI, stroke, atherosclerosis, time to presentation, aortic diameter, aortic regurgitation, abdominal vessel involvement, arch vessel involvement, EF value, symptom, and management as the stratification variables to detect the development of effect sizes in these variables (Table 5). We observed that the deviation in the male population is more pronounced (p for interaction = 0.036, 0.88 with male vs. 1.00 with female). A similar trend was observed in non-diabetics (p for interaction = 0.020, 0.90 with non-diabetics vs. 1.37 with diabetics).

Table 5. Results of subgroup analysis and interaction analysis (SBP per 10 increments).
Discussion
In the fully adjusted model, we found that admission SBP negatively correlated with in-hospital mortality after fine-tuning other covariates. The model-based effect sizes can be interpreted as that a 10 mmHg rise in admission SBP is associated with 12% lower odds of in-hospital mortality. We also found non-linearity between admission SBP and in-hospital mortality. On the left side of the inflection point (SBP ≤ 120 mmHg), risk of in-hospital deaths in AAD patients was condensed by 33% for each extra 10 mmHg of admission SBP. On the right side of the inflection point (SBP > 120 mmHg), this relationship could not be observed [0.96 (95%CI 0.85–1.09), p = 0.554]. Moreover, subgroup analysis identified a stronger association between admission SBP and in-hospital mortality in males and non-diabetics.
In hypertension patients, lowering blood pressure decreases risk of cardiovascular events and death (10, 11), but the best target blood pressure is uncertain (12, 13). Large, randomized trials did not find benefit when blood pressure targets were <140/90 mmHg (14, 15). Additionally, several post-hoc analyses have demonstrated that the advantage of lowering blood pressure treatment might even be reversed below a certain threshold, which is called non-linear or J-curve phenomenon (16, 17). A series of studies have associated blood pressure with in-hospital mortality of AAD patients (18, 19). However, they did not perform non-linearity and subgroup analyses. Although Bossone et al. (20) found the relationship between in-hospital mortality and SBP in AAD patients to be non-linear, they did not elaborate on this. Consequently, the impact of this study was the innovation of a J-shaped curve and threshold effect on the link between admission SBP and in-hospital deaths in AAD patients.
Subgroup analyses are very important for scientific studies (21). They help us to a better understanding of the independent relationship between the admission of in-hospital deaths and SBP for AAD patients. In this study, we used gender, age, smoking, hypertension, BMI, diabetes, bicuspid aortic valve, Marfan syndrome, CRI, stroke, atherosclerosis, time to presentation, aortic diameter, aortic regurgitation, abdominal vessel involvement, arch vessel involvement, EF value, symptom, and management as stratification variables, of which interactions were observed in male and non-diabetes patients.
The following are the clinical values of this experiment: (1) to the best of our knowledge, this is the first report of the threshold effect between SBP admission and in-hospital death in AAD patients, (2) our findings may guide future studies on models (diagnostic and predictive) of in-hospital death rates in AAD patients. However, the improvement of research results is needed for clinical treatment decisions.
There are certain strengths in this study. (1) Non-linearity is higher, offering room for exploration; (2) As a result of observational study, strict statistical adjustments were used to reduce residual confounders; (3) Target independent variables were handled equally as continuous and categorical variables. Such an approach can decrease contingency in data analysis and heighten the strength of results; (4) the effect modifier factor analysis improves data use and produces stable conclusions in diverse subgroups in this study.
This study has some limitations. First, our discoveries are based on a Chinese population, reducing the generalizability of our findings. Second, patients with little or high SBP may have died before getting to hospital, lowering the prevalence of sicker patients. Third, blood pressure pharmacologic management in AAD patients was done by physicians in accordance with recent guidelines but this was not protocol-driven. Our current data cannot prove whether this factor will affect patient outcomes. Lastly, pre-hospital medication and emotion were not available, which may affect blood pressure.
Conclusions
The relationship between admission SBP and in-hospital mortality is not linear. At ≤ 120 mmHg, SBP correlation to in-hospital mortality is negative.
Data Availability Statement
The datasets generated for this study are available on request to the corresponding author.
Ethics Statement
The studies involving human participants were reviewed and approved by the Second Xiangyang Hospital of Central South University. Written informed consent for participation was not required for this study in accordance with the national legislation and the institutional requirements.
Author Contributions
The manuscript writing and collection of patient information was done by GY. Data collection was done by WP, HH, XL, YZ, and XP. The patients' general indices were analyzed and interpreted by XC. The final manuscript was read and approved by all authors.
Funding
This study was supported by Key Research and Development Program of Hunan Province (2019SK2022), Hunan Health and Family Planning Commission Project (No. 20200063), and Key Project of Hunan Provincial Science and Technology Innovation (No. 2020SK1014-2).
Conflict of Interest
The authors declare that the research was conducted in the absence of any commercial or financial relationships that could be construed as a potential conflict of interest.
Acknowledgments
Editors appreciate the organization's staff members.
Supplementary Material
The Supplementary Material for this article can be found online at: https://www.frontiersin.org/articles/10.3389/fmed.2021.542212/full#supplementary-material
References
1. Mancia G, Schumacher H, Redon J, Verdecchia P, Schmieder R, Jennings G, et al. Blood pressure targets recommended by guidelines and incidence of cardiovascular and renal events in the Ongoing Telmisartan Alone and in Combination With Ramipril Global Endpoint Trial (ONTARGET). Circulation. (2011) 124:1727–36. doi: 10.1161/CIRCULATIONAHA.110.008870
2. Dawber TR, Moore FE, Mann GV II. Coronary heart disease in the Framingham study. Int J Epidemiol. (2015) 44:1767–80. doi: 10.1093/ije/dyv346
3. Franklin SS, Lopez VA, Wong ND, Mitchell GF, Larson MG, Vasan RS, et al. Single versus combined blood pressure components and risk for cardiovascular disease: the Framingham Heart Study. Circulation. (2009) 119:243–50. doi: 10.1161/CIRCULATIONAHA.108.797936
4. Dorresteijn JA, van der Graaf Y, Spiering W, Grobbee DE, Bots ML, Visseren FL, et al. Relation between blood pressure and vascular events and mortality in patients with manifest vascular disease: J-curve revisited. Hypertension. (2012) 59:14–21. doi: 10.1161/HYPERTENSIONAHA.111.179143
5. Bohm M, Young R, Jhund PS, Solomon SD, Gong J, Lefkowitz MP, et al. Systolic blood pressure, cardiovascular outcomes and efficacy and safety of sacubitril/valsartan (LCZ696) in patients with chronic heart failure and reduced ejection fraction: results from PARADIGM-HF. Eur Heart J. (2017) 38:1132–43. doi: 10.1093/eurheartj/ehw570
6. Messerli FH, Panjrath GS. The J-curve between blood pressure and coronary artery disease or essential hypertension: exactly how essential? J Am Coll Cardiol. (2009) 54:1827–34. doi: 10.1016/j.jacc.2009.05.073
7. Mehta RH, Califf RM, Yang Q, Pieper KS, White HD, Ohman EM, et al. Impact of initial heart rate and systolic blood pressure on relation of age and mortality among fibrinolytic-treated patients with acute ST-elevation myocardial infarction presenting with cardiogenic shock. AM J Cardiol. (2007) 99:793–6. doi: 10.1016/j.amjcard.2006.10.035
8. Eagle KA, Lim MJ, Dabbous OH, Pieper KS, Goldberg RJ, Van de Werf F, et al. A validated prediction model for all forms of acute coronary syndrome: estimating the risk of 6-month postdischarge death in an international registry. JAMA. (2004) 291:2727–33. doi: 10.1001/jama.291.22.2727
9. Bernhardt PW. Model validation and influence diagnostics for regression models with missing covariates. Stat Med. (2018) 37:1325–42. doi: 10.1002/sim.7584
10. Zanchetti A, Thomopoulos C, Parati G. Randomized controlled trials of blood pressure lowering in hypertension: a critical reappraisal. Circ Res. (2015) 116:1058–73. doi: 10.1161/CIRCRESAHA.116.303641
11. Ettehad D, Emdin CA, Kiran A, Anderson SG, Callender T, Emberson J, et al. Blood pressure lowering for prevention of cardiovascular disease and death: a systematic review and meta-analysis. Lancet. (2016) 387:957–67. doi: 10.1016/S0140-6736(15)01225-8
12. Kjeldsen SE, Lund-Johansen P, Nilsson PM, Mancia G. Unattended blood pressure measurements in the systolic blood pressure intervention trial: implications for entry and achieved blood pressure values compared with other trials. Hypertension. (2016) 67:808–12. doi: 10.1161/HYPERTENSIONAHA.116.07257
13. Mancia G, Grassi G. Aggressive blood pressure lowering is dangerous: the J-curve: pro side of the arguement. Hypertension. (2014) 63:29–36. doi: 10.1161/HYPERTENSIONAHA.113.01922
14. Group AS. Effects of intensive blood-pressure control in type 2 diabetes mellitus. New Engl J Med. (2010) 362:1575–85. doi: 10.1056/NEJMoa1001286
15. Benavente OR, Coffey CS, Conwit R, Hart RG, McClure LA, Pearce LA. Blood-pressure targets in patients with recent lacunar stroke: the SPS3 randomised trial. Lancet. (2013) 382:507–15. doi: 10.1016/S0140-6736(13)60852-1
16. Bangalore S, Messerli FH, Wun CC, Zuckerman AL, DeMicco D, Kostis JB, et al. J-curve revisited: an analysis of blood pressure and cardiovascular events in the Treating to New Targets (TNT) Trial. Eur Heart J. (2010) 31:2897–908. doi: 10.1093/eurheartj/ehq328
17. Vidal-Petiot E, Ford I, Greenlaw N, Ferrari R, Fox KM, Tardif JC, et al. Cardiovascular event rates and mortality according to achieved systolic and diastolic blood pressure in patients with stable coronary artery disease: an international cohort study. Lancet. (2016) 388:2142–52. doi: 10.1016/S0140-6736(16)31326-5
18. Mehta RH, Suzuki T, Hagan PG, Bossone E, Gilon D, Llovet A, et al. Predicting death in patients with acute type a aortic dissection. Circulation. (2002) 105:200–6. doi: 10.1161/hc0202.102246
19. Bossone E, Pyeritz RE, Braverman AC, Peterson MD, Ehrlich M, O'Gara P, et al. Shock complicating type A acute aortic dissection: clinical correlates, management, and outcomes. Am Heart J. (2016) 176:93–9. doi: 10.1016/j.ahj.2016.02.019
20. Bossone E, Gorla R, LaBounty TM, Suzuki T, Gilon D, Strauss C, et al. Presenting systolic blood pressure and outcomes in patients with acute aortic dissection. J Am Coll Cardiol. (2018) 71:1432–40. doi: 10.1016/j.jacc.2018.01.064
Keywords: systolic blood pressure, SBP, aortic dissection, AAD, in-hospital mortality
Citation: Yang G, Peng W, Zhou Y, He H, Pan X, Li X and Chai X (2021) Admission Systolic Blood Pressure and In-hospital Mortality in Acute Type A Aortic Dissection: A Retrospective Observational Study. Front. Med. 8:542212. doi: 10.3389/fmed.2021.542212
Received: 11 March 2020; Accepted: 28 June 2021;
Published: 20 July 2021.
Edited by:
Komal Marwaha, Maharishi University of Management, United StatesReviewed by:
Zaiping Jing, Second Military Medical University, ChinaHelmut Schumacher, Consultant, Ingelheim, Germany
Copyright © 2021 Yang, Peng, Zhou, He, Pan, Li and Chai. This is an open-access article distributed under the terms of the Creative Commons Attribution License (CC BY). The use, distribution or reproduction in other forums is permitted, provided the original author(s) and the copyright owner(s) are credited and that the original publication in this journal is cited, in accordance with accepted academic practice. No use, distribution or reproduction is permitted which does not comply with these terms.
*Correspondence: Xiangping Chai, chaixiangping@csu.edu.cn