 Yuxin Tong
 Tiantian Wang
 Xinyu Zhang
 Yi He
Yi He Bing Jiang
- 1Department of Ophthalmology, Second Xiangya Hospital, Central South University, Changsha, China
- 2Hunan Clinical Research Center of Ophthalmic Disease, Changsha, China
- 3Department of Ophthalmology, Xiangya Hospital, Central South University, Changsha, China
- 4Department of Neurosurgery, Xiangya Hospital, Central South University, Changsha, China
Background: This study aimed to assess the differences in the average and sectoral peripapillary retinal nerve fiber layer (pRNFL), macular ganglion cell plus inner plexiform layer (mGCIPL), and macular ganglion cell complex (mGCC) thickness using optical coherence tomography (OCT) in patients with pre-perimetric glaucoma (PPG) compared to those with early perimetric glaucoma (EG) and ocular hypertension (OHT).
Methods: A comprehensive literature search of the PubMed database, the Cochrane Library, and Embase was performed from inception to March 2021. The weighted mean difference (WMD) with the 95% confidence interval (CI) was pooled for continuous outcomes.
Results: Twenty-three cross-sectional studies comprising 2,574 eyes (1,101 PPG eyes, 1,233 EG eyes, and 240 OHT eyes) were included in the systematic review and meta-analysis. The pooled results demonstrated that the average pRNFL (WMD = 8.22, 95% CI = 6.32–10.12, P < 0.00001), mGCIPL (WMD = 4.83, 95% CI = 3.43–6.23, P < 0.00001), and mGCC (WMD = 7.19, 95% CI = 4.52–9.85, P < 0.00001) were significantly thinner in patients with EG than in those with PPG. The sectoral thickness of pRNFL, mGCIPL, and mGCC were also significantly lower in the EG eyes. In addition, the average pRNFL and mGCC were significantly thinner in the PPG eyes than those in the OHT eyes (pRNFL: WMD = −8.57, 95% CI = −9.88 to −7.27, P < 0.00001; mGCC: WMD = −3.23, 95% CI = −6.03 to −0.44, P = 0.02). Similarly, the sectoral pRNFL and mGCC were also significantly thinner in the PPG eyes than those in the OHT eyes.
Conclusion: OCT-based measurements of peripapillary and macular structural alterations can be used to distinguish PPG from EG and OHT, which can help understand the pathophysiology of glaucoma at earlier stages. Studies that employ clock hour classification methods and longitudinal studies are needed to verify our findings.
Systematic Review Registration: https://www.crd.york.ac.uk/prospero/display_record.php?RecordID=239798 CRD42021239798
Introduction
Glaucoma is a group of neurodegenerative diseases that is characterized by the progressive loss of retinal ganglion cells (RGCs) and axons, followed by the irreversible visual field (VF) deterioration (1). Glaucoma is one of the leading causes of blindness, and ~111.8 million people worldwide are expected to suffer from glaucomatous optic neuropathy through 2040. This imposes a huge burden on public health systems (2). Elevated intraocular pressure (IOP) is believed to be one of the major risk factors of glaucoma. Patients that have increased IOP with normal appearance of the optic disc can have about nine times the risk of developing glaucoma and are regarded as ocular hypertension (OHT) individuals or glaucoma suspects (3). Currently, reducing the IOP is the only effective method for glaucoma treatment (4, 5). However, since glaucoma has an insidious onset and obscure symptoms especially at the earlier stages, such as pre-perimetric glaucoma (PPG) and early perimetric glaucoma (EG), patients are usually diagnosed at an advanced stage with severe VF defects (2, 6). Thus, early detection of glaucomatous damage is crucial for hypotensive therapies to slow glaucoma progression and ameliorate the quality of life (7, 8).
Several methods have been utilized for the diagnosis of glaucoma, and of these, standard automated perimetry-based VF examination is the gold standard for evaluating the severity of glaucomatous damage (9). Nevertheless, studies have shown that ganglion cell loss can precede VF defects in glaucoma (10–18) indicating that morphological changes occur earlier than functional damage. Since severe functional damage is closely related to the central region of the VF, it is difficult to solely rely on poor patient performance in standard automated perimetry (19). Moreover, the VF test is occasionally unreliable, which impairs its diagnostic efficacy. Therefore, more objective and reproducible methods are required for assessing the peripapillary and macular structure changes in glaucoma.
Optical coherence tomography (OCT) is a quantitative and non-invasive method of enhanced-depth visualization of the optic nerve head (ONH) and retina with high imaging quality and scanning speed, which enables clinicians to monitor morphological changes of the ONH and retina in glaucoma (20–24). Several studies using OCT have reported that the attenuation of the peripapillary retinal nerve fiber layer (pRNFL), macular ganglion cell plus inner plexiform layer (GCIPL), and macular ganglion cell complex (mGCC) could be hallmark features of glaucoma (20, 22, 24, 25). Although some investigations have revealed the continuum of glaucoma from mild to advanced stages, studies have shown inconsistencies regarding the diagnostic values of OCT indicators in differentiating PPG from EG (26–44) and in differentiating PPG from OHT (39, 43, 45–48).
Thus, we conducted this systematic review and meta-analysis to facilitate a better understanding of glaucomatous progression form OHT without apparent ONH configuration changes to the pre-perimetric stage with structural deterioration, and from the pre-perimetric to the early perimetric stage with impaired VF in view of the peripapillary and macular structural alterations, and to enable ophthalmologists to discriminate PPG from EG, and PPG from OHT.
Methods
This systematic review and meta-analysis adhered to the Preferred Reporting Items for Systematic Reviews and Meta-analysis (PRISMA) statement methodology and the Meta-analysis of Observational Studies in Epidemiology (MOOSE) guidelines (49, 50). Three investigators (YT, TW, and YH) independently performed the literature search, data extraction, and quality assessment based on the same standard. The study was registered in PROSPERO (CRD42021239798).
Literature Search
We performed a comprehensive literature search of the PubMed database, Embase, and the Cochrane Library from inception to March 2021 using the following strategy with the combination of free text terms and Medical Subject Headings (MeSH): “preperimetric”[All Fields] AND (“glaucoma”[MeSH Terms] OR “glaucoma”[All Fields] OR “glaucomas”[All Fields]) AND (“ocular hypertension”[MeSH Terms] OR (“ocular”[All Fields] AND “hypertension”[All Fields]) OR “ocular hypertension”[All Fields] OR (“suspect”[All Fields] OR “suspected”[All Fields] OR “suspecting”[All Fields] OR “suspects”[All Fields]) OR “early”[All Fields] OR “mild”[All Fields] OR (“hypertense”[All Fields] OR “hypertension”[MeSH Terms] OR “hypertension”[All Fields] OR “hypertension s”[All Fields] OR “hypertensions”[All Fields] OR “hypertensive”[All Fields] OR “hypertensive s”[All Fields] OR “hypertensives”[All Fields])) AND (“tomography, optical coherence”[MeSH Terms] OR (“tomography”[All Fields] AND “optical”[All Fields] AND “coherence”[All Fields]) OR “optical coherence tomography”[All Fields] OR (“optical”[All Fields] AND “coherence”[All Fields] AND “tomography”[All Fields]) OR “OCT”[All Fields]). We modified search strategies according to the different requirements of the different databases. Full-text screening was conducted to include potentially applicable studies.
Inclusion and Exclusion Criteria
Eligible studies were included if they fulfilled the following criteria: (1) original article; (2) inclusion of PPG and (EG or OHT) with the same diagnostic standard: for PPG, patients had to demonstrate characteristic glaucomatous optic nerve damage (i.e., neuroretinal rim thinning, excavation, or notching) without a reproducible VF; for EG, in addition to the typical glaucomatous optic disc changes (i.e., neuroretinal rim thinning, excavation, or notching), the mean deviation (MD) of the VF defect had to exceed −6 dB based on the Hodapp-Anderson-Parrish VF severity grading scale (51); for OHT, patients with an elevated IOP > 21 mmHg but with normal optic disc appearance and VF were included; and (3) inclusion of at least one of the following quantitative indicators measured by OCT – pRNFL, mGCIPL, or mGCC thickness.
The exclusion criteria were: (1) animal experiments, reviews, case reports, and conference abstracts; (2) non-inclusion of PPG, EG and OHT; (3) lack of information regarding pRNFL, mGCIPL, or mGCC thickness; (4) different diagnostic standards; and (5) studies with unextractable data.
Data Extraction
The following details were extracted with regard to the studies: title, first author, publication year, study type, region, source of patients, number of patients and eyes, mean age of patients, female/male ratios, type of spectral domain OCT (SD-OCT) or time domain OCT (TD-OCT) devices, type of glaucoma, diagnostic standards, average and sectoral pRNFL, mGCIPL and mGCC thickness, scan area and protocol of the ONH and macular region, and MD of the VF. Disagreements were resolved through consensus after discussion among all authors.
Quality Assessment
The Agency for Healthcare Research and Quality (AHRQ) methodology checklist was used to evaluate the quality of the included cross-sectional studies.
Statistical Analyses
All statistical analyses were conducted using Review Manager V5.4.1 (Cochrane Collaboration, London, United Kingdom) and Stata V12.0 (StataCorp LLC, Texas, America). We employed the weighted mean difference (WMD) with the 95% confidence interval (CI) to pool the mean differences of OCT parameters between the PPG and EG groups, and between the PPG and OHT groups. A P-value of < 0.05 was considered to be statistically significant. Heterogeneity was estimated using Cochrane's Q test and I2 statistics. A fixed-effects model was used when I2 < 50% (52); otherwise, a random-effects model (Der Simonian-Laird method) was used. We performed subgroup analyses according to the type of glaucoma, type of OCT device, and macular scan area. Subgroups with less than two included studies were excluded to prevent further discrepancy. “Leave-one-out” sensitivity analyses were performed to validate the stability and reliability of the results. Publication bias was evaluated by the combination of Begg's funnel plot and Egger's test (53, 54).
In some articles, the eight-quadrant classification method was used to display sectoral thickness while other studies employed the four-quadrant classification method. Since most of the studies used the four-quadrant classification (only one study used the eight-quadrant classification, which we included for the combined analysis regarding the pRNFL thickness), we transformed the eight-quadrant data to four-quadrant data to reduce heterogeneity using the following formula to combine the means and standard deviations of the two groups:
and are the mean pRNFL or mGCIPL or mGCC thickness of the two adjacent sections in the eight-quadrant classification. σ1 and σ2 are the standard deviations of the two groups. N1 and N2 are number of the eyes in the two sections. and σ12 are the combined mean and standard deviation (i.e., and σ1 refer to parameters of the temporal superior quadrant, and σ2 refer to parameters of the temporal inferior quadrant, and and σ12 refer to combined parameters of the temporal superior and inferior quadrants).
Results
Literature Search
A total of 334 studies were retrieved in our screening, of which 85 duplicates were removed and 208 articles were excluded by titles and abstracts. We further excluded 17 studies with unextractable data and 1 study that used a different diagnostic standard. Finally, 23 studies were integrated into the qualitative and quantitative analyses (26–48). The flow diagram of literature search is shown in Figure 1.
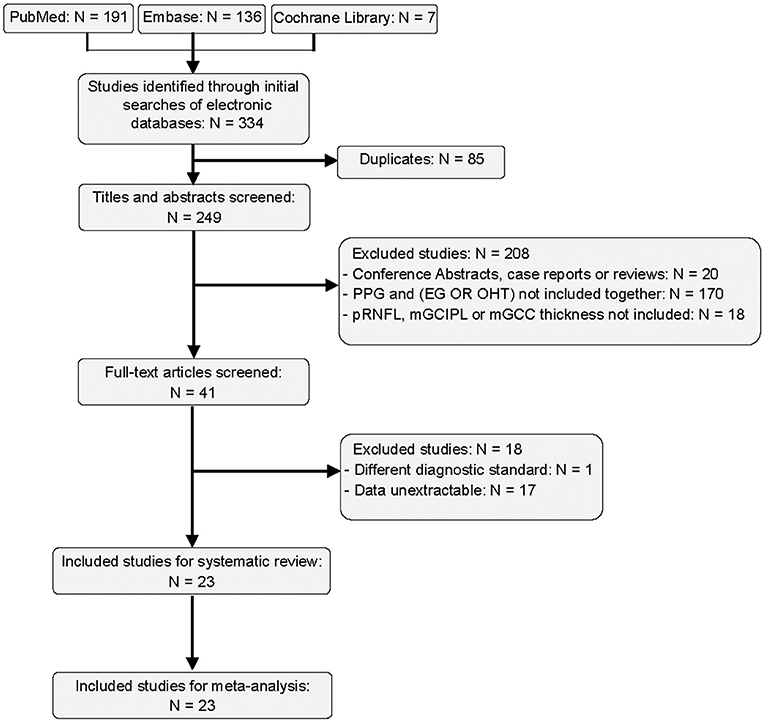
Figure 1. Flow diagram of included studies.
Characteristics of Included Studies
According to our eligibility criteria, 23 cross-sectional studies comprising 2,574 eyes (1,101 PPG eyes, 1,233 EG eyes, and 240 OHT eyes) were included in the systematic review and the meta-analysis. Detailed characteristics of the included studies are summarized in Table 1. The AHRQ checklist scores of all the included cross-sectional studies were not <5, demonstrating that the studies were of good quality. Details are presented in Table 2.
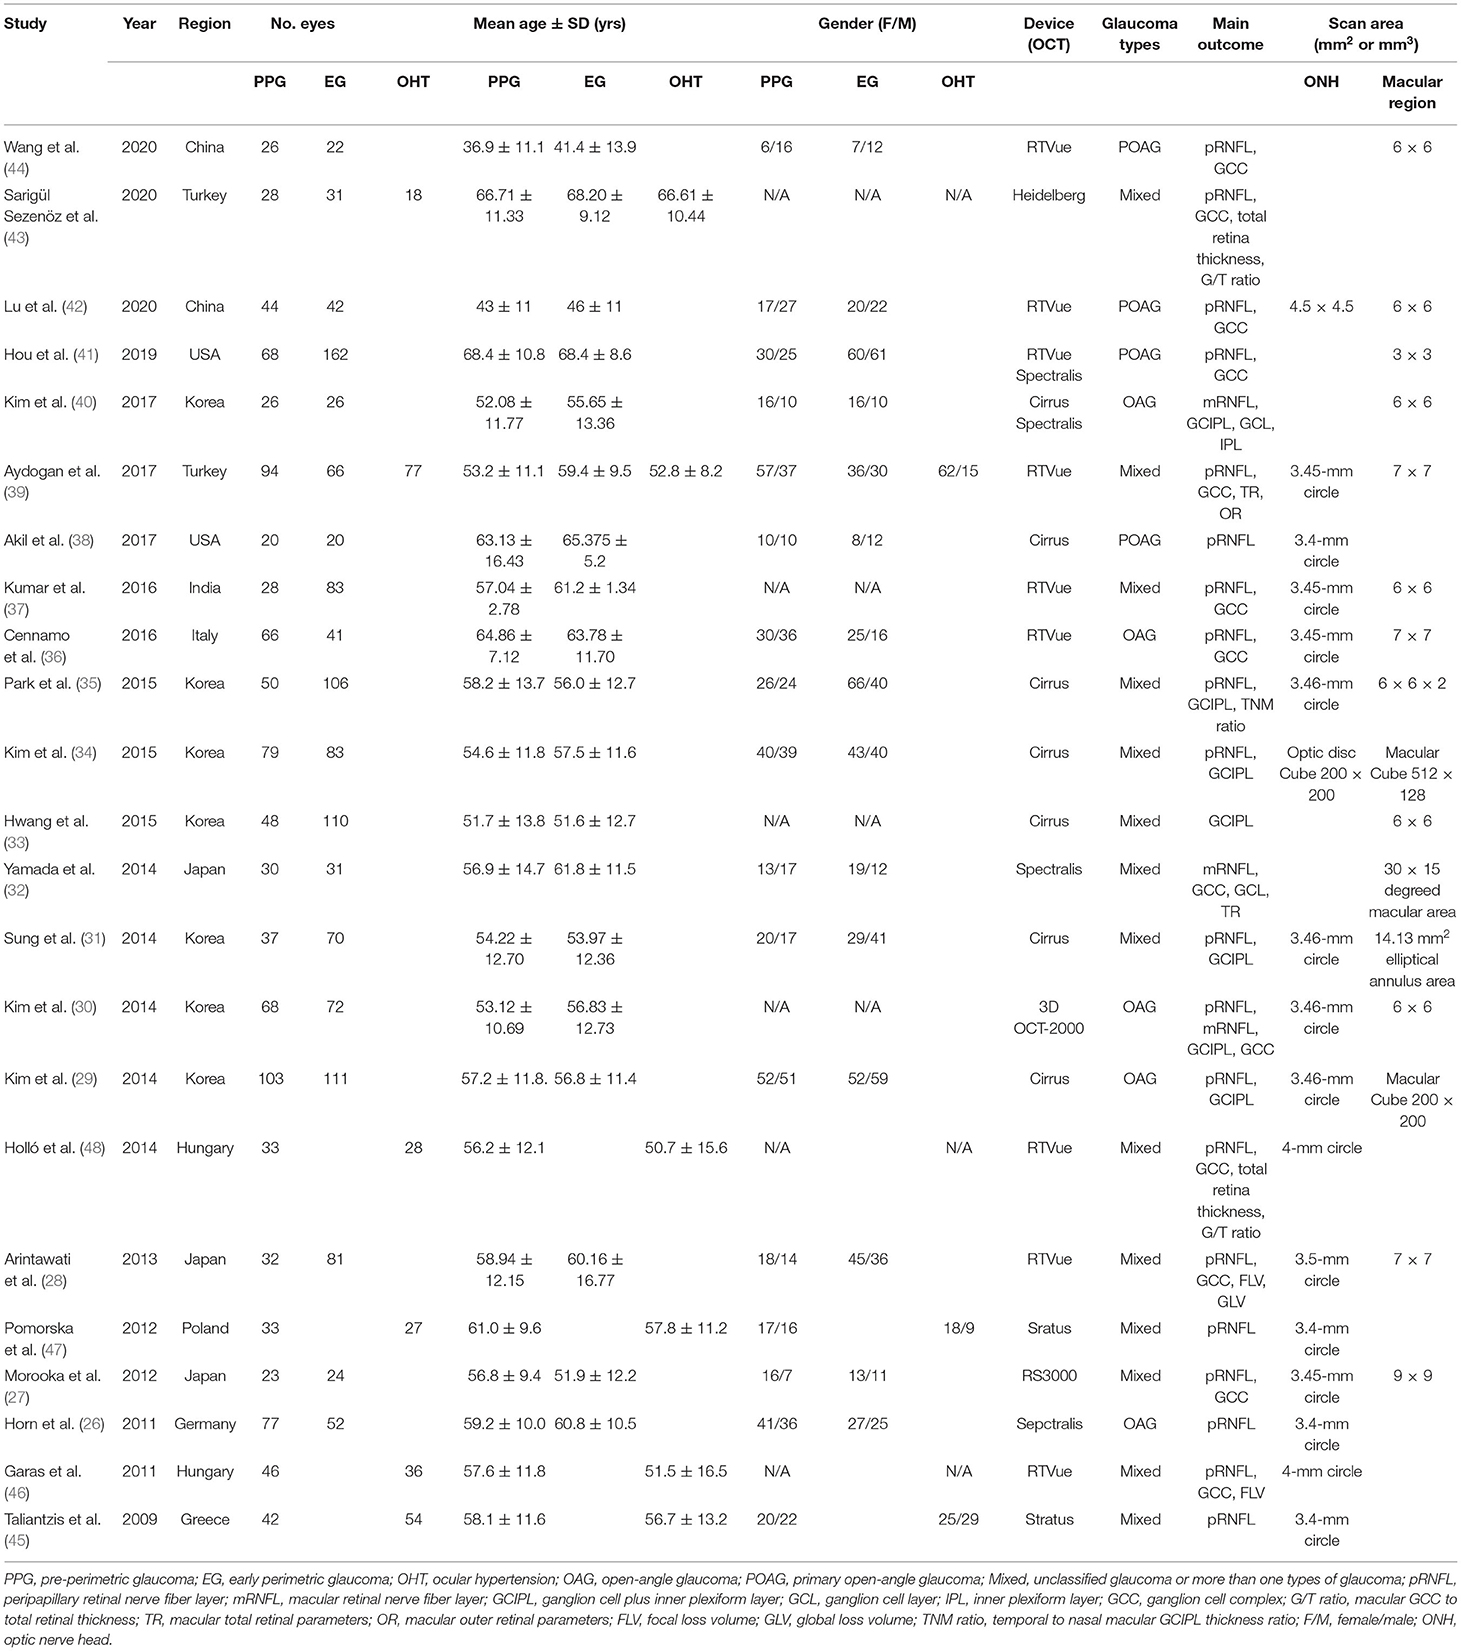
Table 1. Characteristics of included studies.
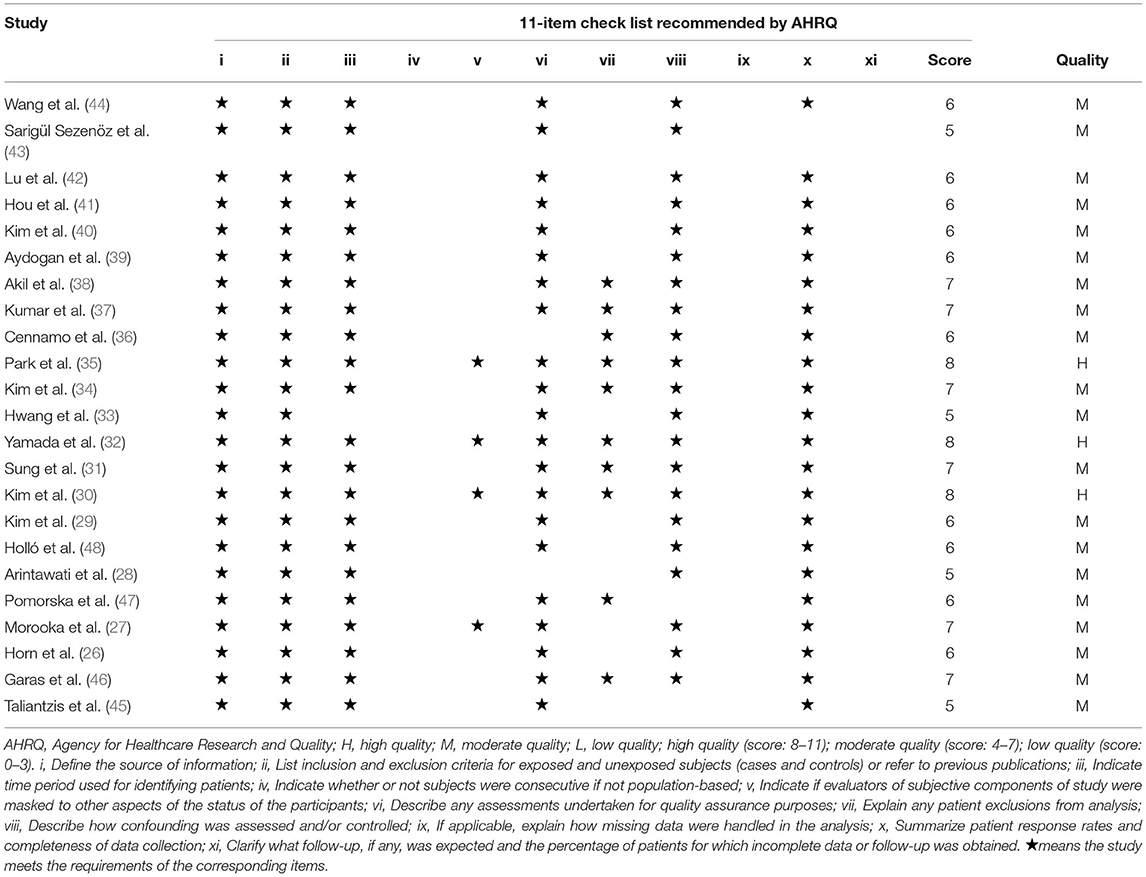
Table 2. Methodological quality of included studies.
PPG vs. EG
Peripapillary RNFL Thickness
Sixteen studies evaluating pRNFL thickness showed significant heterogeneity (I2 > 50%); thus, the random-effects model was used. The pooled results demonstrated a significant decrease in the average and quadrant pRNFL thickness in the EG eyes compared with the PPG eyes (average: WMD = 8.22, 95% CI = 6.32–10.12, P < 0.00001, Figure 2A; superior: WMD = 9.64, 95% CI = 6.69–12.59, P < 0.00001, Figure 2B; nasal: WMD = 5.69, 95% CI = 1.67–9.71, P = 0.005, Figure 2C; inferior: WMD = 12.79, 95% CI = 9.08–16.50, P < 0.00001, Figure 2D; temporal: WMD = 7.64, 95% CI = 4.39–10.89, P < 0.00001, Figure 2E).
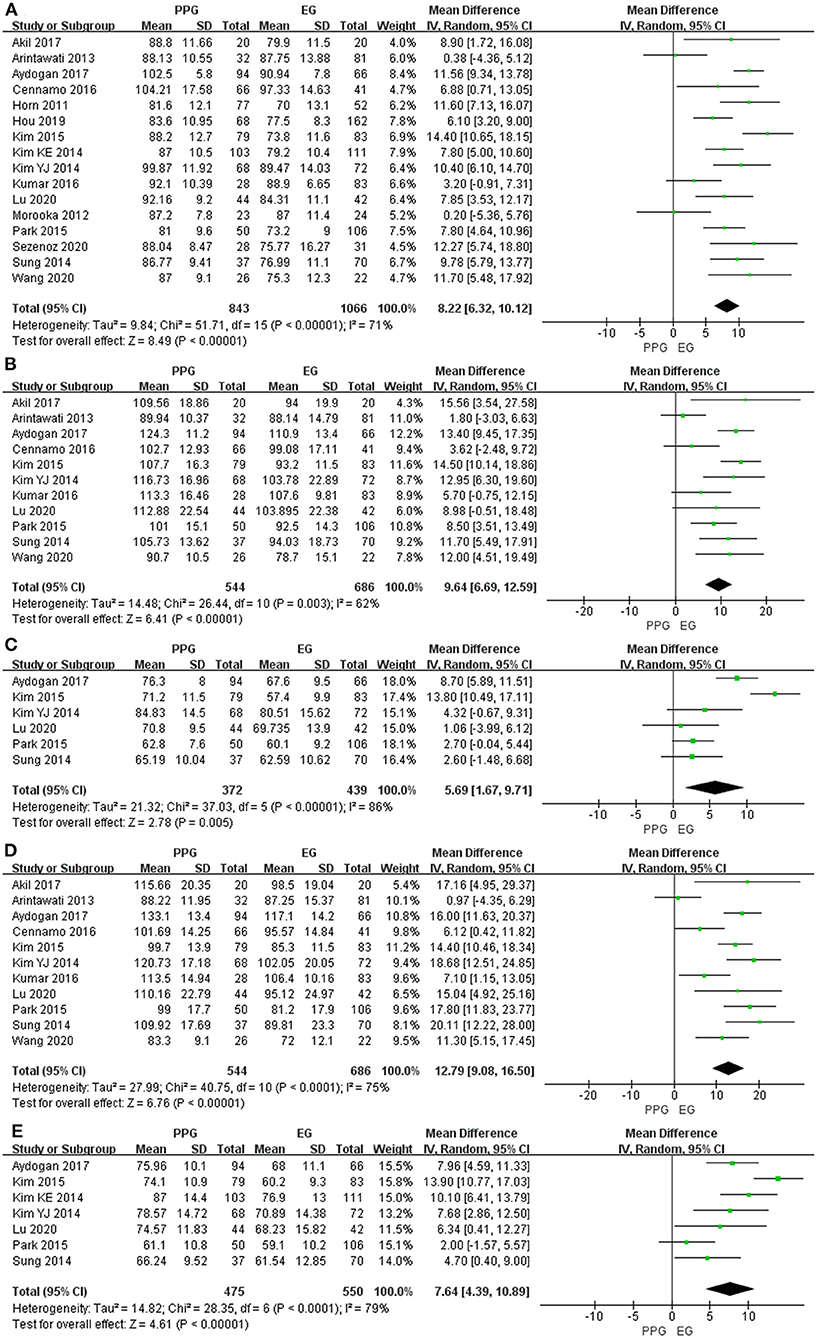
Figure 2. pRNFL thickness in patients with PPG and EG. (A) Average. (B) Superior. (C) Nasal. (D) Inferior. (E) Temporal.
Macular GCIPL Thickness
Seven of the included studies assessed the average mGCIPL thickness and six studies assessed superior and inferior mGCIPL thickness with significant heterogeneity (I2 > 50%). The pooled results indicated the average mGCIPL thickness was significantly less in the EG eyes than in the PPG eyes (WMD = 4.83, 95% CI = 3.43–6.23, P < 0.00001, Figure 3A). Likewise, the superior and inferior mGCIPL were also significantly thinner in patients with EG than in those with PPG (superior: WMD = 3.71, 95% CI = 1.71–5.72, P = 0.0003, Figure 3B; inferior: WMD = 6.18, 95% CI = 4.61–7.75, P < 0.00001, Figure 3C).
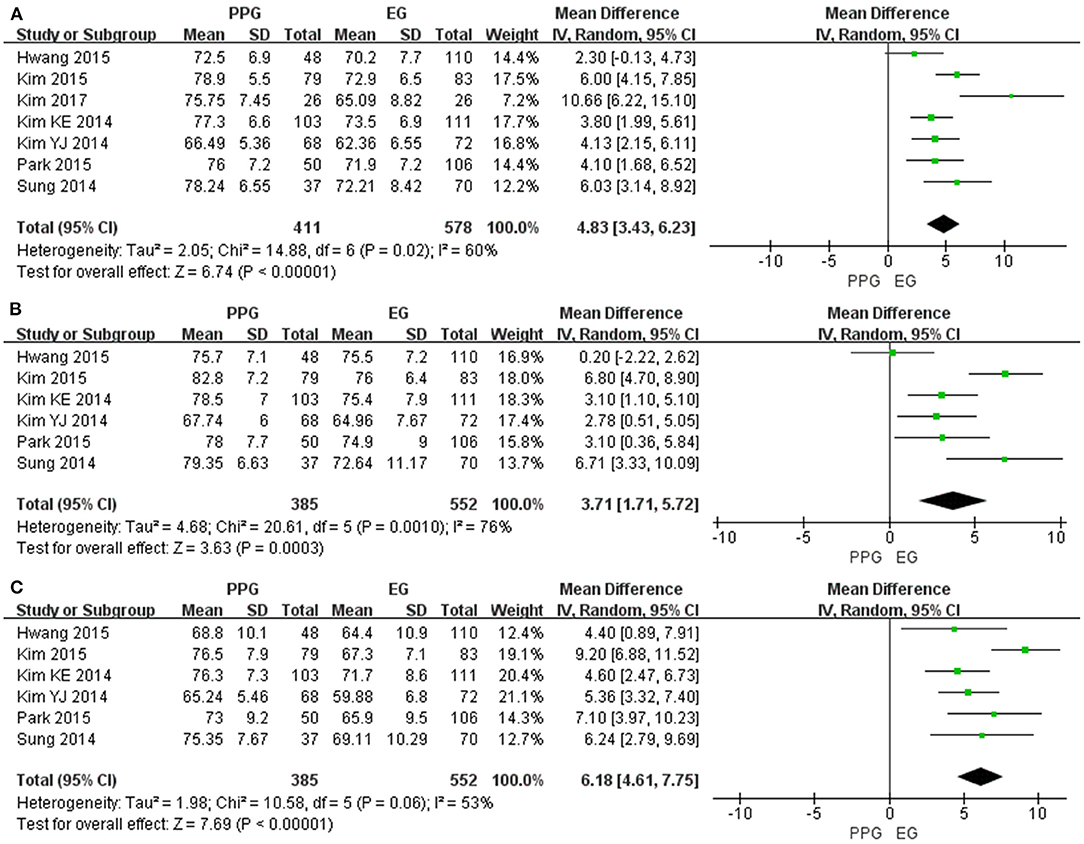
Figure 3. mGCIPL thickness in patients with PPG and EG. (A) Average. (B) Superior. (C) Inferior.
Macular GCC Thickness
Ten studies measured the average mGCC thickness and seven studies assessed quadrant mGCC thickness with I2 > 50%. All the pooled mGCC thickness values were significantly reduced in the EG eyes compared to the PPG eyes (average: WMD = 7.19, 95% CI = 4.52–9.85, P < 0.00001, Figure 4A; superior: WMD = 4.42, 95% CI = 2.53–6.30, P < 0.00001, Figure 4B; inferior: WMD = 7.26, 95% CI = 4.23–10.30, P < 0.00001, Figure 4C).
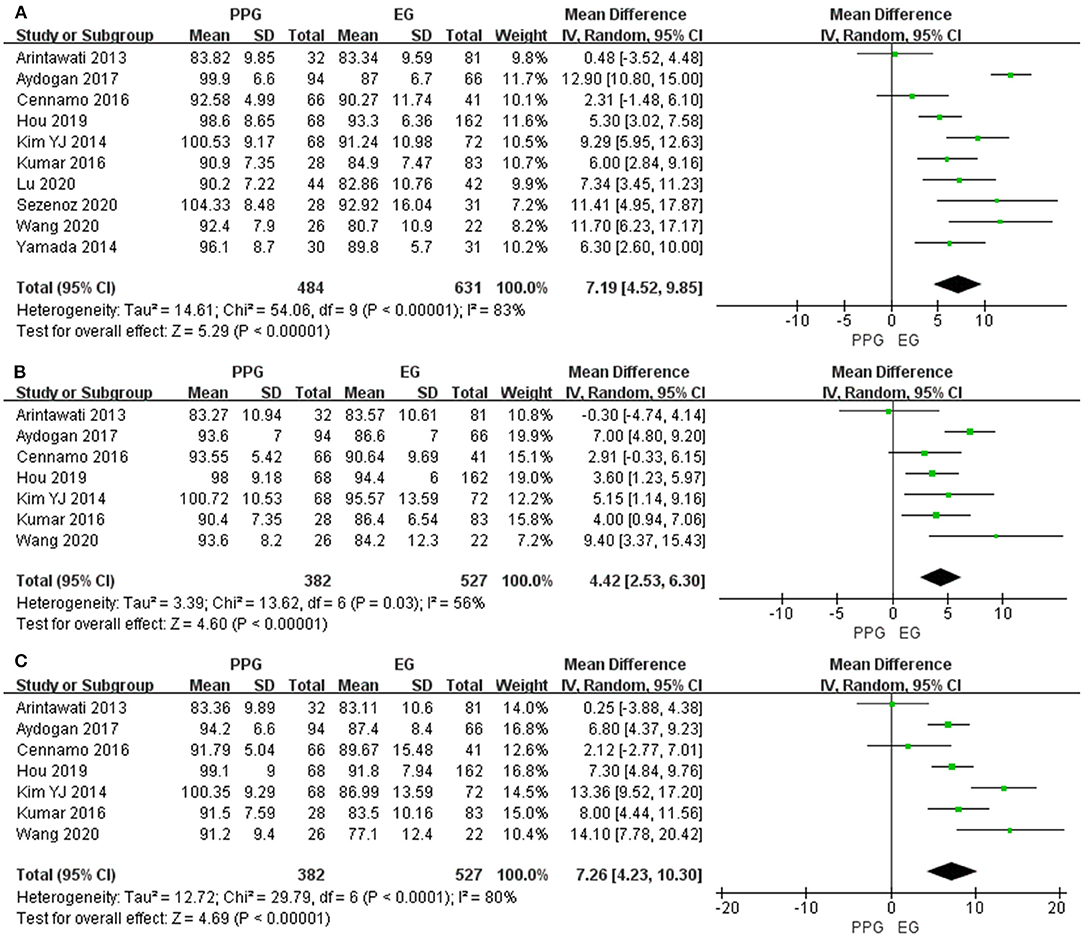
Figure 4. mGCC thickness in patients with PPG and EG. (A) Average. (B) Superior. (C) Inferior.
Subgroup Analyses
The stratified subgroup analysis according to the type of glaucoma (Table 3) showed a similar decreased trend of pRNFL and mGCIPL thickness in EG compared with PPG except for the superior quadrant of pRNFL in the open-angle glaucoma subgroup (WMD = 8.19, 95% CI = −0.95 to 17.33, P = 0.08). However, unlike the combined pooled data, in the subgroup of the open-angle glaucoma in terms of the average and inferior mGCC thickness, there was no difference between the EG and PPG eyes (average: WMD = 5.86, 95% CI = −0.98 to 12.70, P = 0.09; inferior: WMD = 7.85, 95% CI = −3.17 to 18.86, P = 0.16).
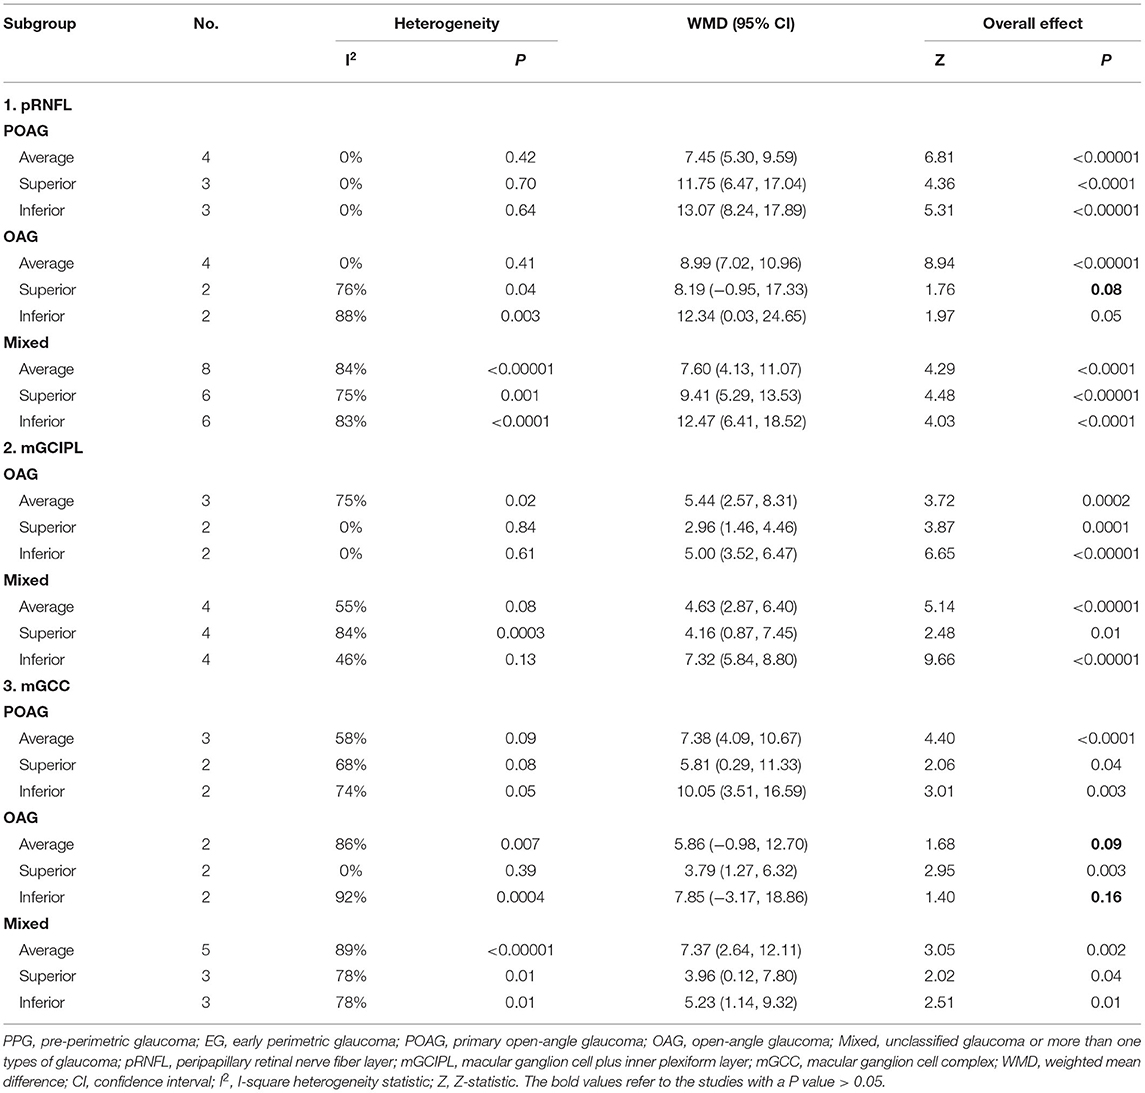
Table 3. Subgroup analysis of average and sectoral pRNFL, mGCIPL and mGCC thickness according to the type of glaucoma in patients with PPG and EG.
In addition, considering the different types of OCT (Table 4), the average and quadrant pRNFL thickness were significantly lower in the EG eyes than in the PPG eyes regardless of the kind of OCT that was used except for the nasal quadrant of pRNFL in the Cirrus SD-OCT subgroup (WMD = 6.38, 95% CI = −1.02 to 13.78, P = 0.09).
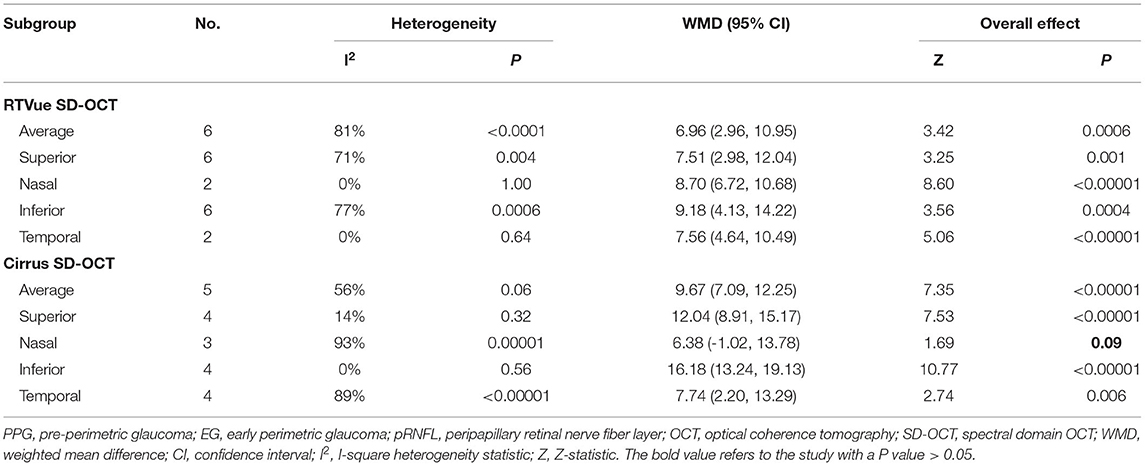
Table 4. Subgroup analysis of average and sectoral pRNFL thickness according to the type of OCT in patients with PPG and EG.
The subgroup analysis regarding the scan area of the macular region (Table 5) revealed that the average and sectoral mGCC thickness were significantly lower in patients with EG than in those with PPG in the 6 × 6 mm subgroup, whereas no difference was found in 7 × 7 mm subgroup (average: WMD = 5.36, 95% CI = −3.27 to 13.99, P = 0.22; superior: WMD = 3.54, 95% CI = −0.64 to 7.72, P = 0.10; inferior: WMD = 3.35, 95% CI = −1.08 to 7.79, P = 0.14).
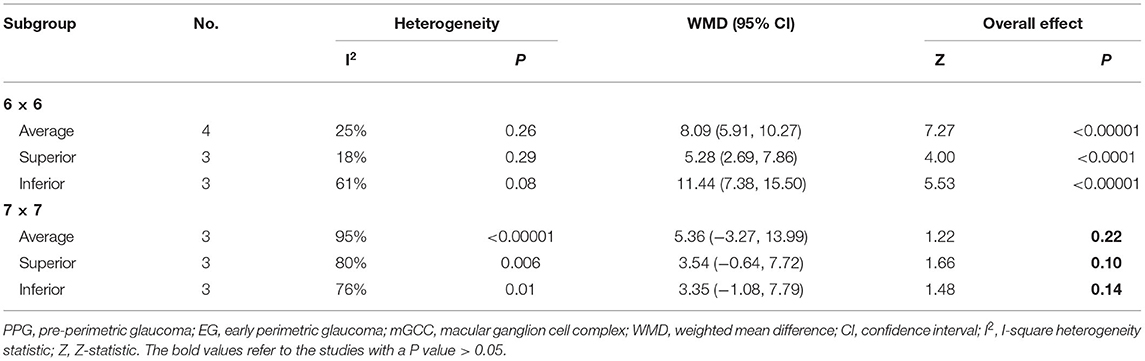
Table 5. Subgroup analysis of average and sectoral mGCC thickness according to the macular scan area (mm2) in patients with PPG and EG.
PPG vs. OHT
Peripapillary RNFL Thickness
Six studies evaluated average pRNFL thickness in patients with PPG and OHT with I2 < 50%; thus, fixed-effects model was used. The pooled results demonstrated that the average and quadrant pRNFL thickness were significantly lower in patients with PPG than in those with OHT (average: WMD = −8.57, 95% CI = −9.88 to −7.27, P < 0.00001, Figure 5A; superior: WMD = −12.43, 95% CI = −15.00 to −9.86, P < 0.00001, Figure 5B; inferior: WMD = −11.02, 95% CI = −13.81 to −8.23, P < 0.00001, Figure 5C).
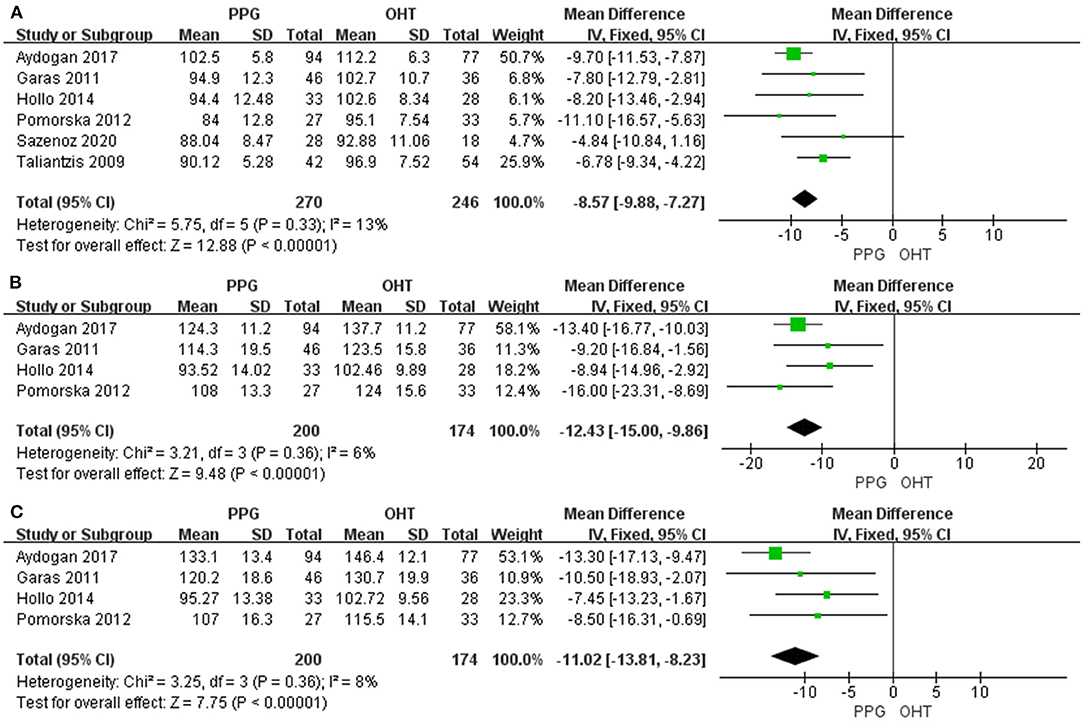
Figure 5. pRNFL thickness in patients with PPG and OHT. (A) Average. (B) Superior. (C) Inferior.
Macular GCC Thickness
Four studies measured average mGCC thickness with I2 > 50%, and three studies assessed sectoral mGCC thickness with I2 < 50%. The average and sectoral mGCC were significantly thinner in the PPG eyes than those in the OHT eyes (average: WMD = −3.23, 95% CI = −6.03 to −0.44, P = 0.02, Figure 6A; superior: WMD = −5.78, 95% CI = −7.25 to −4.31, P < 0.00001, Figure 6B; inferior: WMD = −6.14, 95% CI = −7.54 to −4.73, P < 0.00001, Figure 6C).
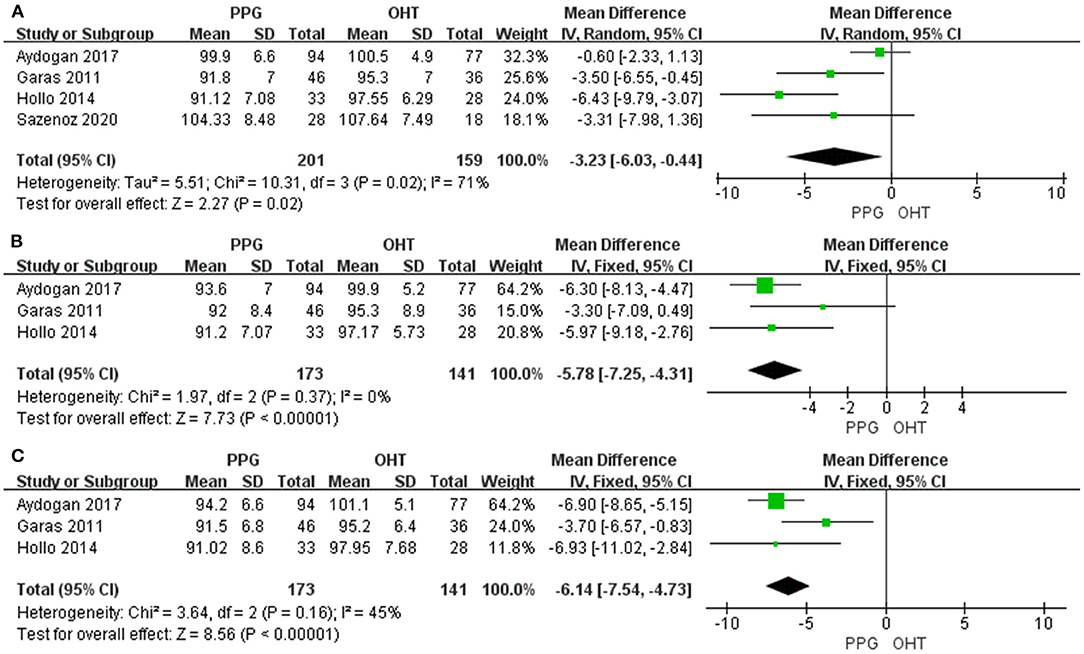
Figure 6. mGCC thickness in patients with PPG and OHT. (A) Average. (B) Superior. (C) Inferior.
Subgroup Analysis
The subgroup analysis demonstrated that the average pRNFL thickness was significantly lower in patients with PPG than in those with OHT, regardless of the type of OCT (SD-OCT: WMD = −9.04, 95% CI = −10.62 to −7.46, P < 0.00001; TD-OCT: WMD = −7.56, 95% CI = −9.88 to −5.24, P < 0.00001, Supplementary Figure 1).
Publication Bias
No significant publication bias was shown according to the results of Egger's and Begg's tests (P > 0.05, Table 6), and no obvious asymmetry or correlation between study and effect size was observed in the funnel plot in terms of pRNFL and mGCC thickness (Supplementary Figures 2–5). However, slight asymmetry was noted in the funnel plot of average mGCIPL thickness (Supplementary Figure 6A), but not in those of superior and inferior mGCIPL thickness (Supplementary Figures 6B,C).
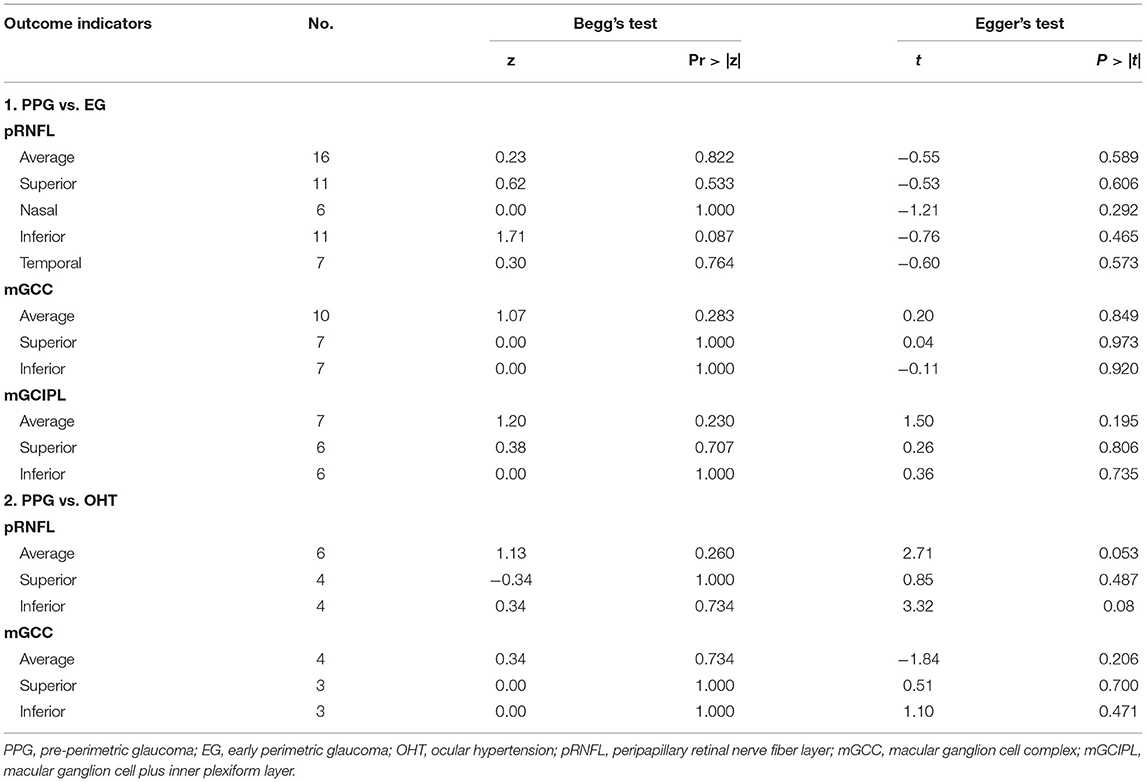
Table 6. Begg's and Egger's tests results for the evaluation of publication bias.
Sensitivity Analyses
There was no obvious change in the results after “leave-one-out” sensitivity analyses, indicating the reproducibility and stability of our results (Supplementary Figures 7–11). However, the sensitivity analysis of average mGCIPL thickness in patients with PPG and EG indicated that the study by Kim et al. (40) contributed mostly to the heterogeneity (Table 7). After excluding this study, heterogeneity was largely reduced (I2 = 34%, Supplementary Figure 12) and the funnel plot became symmetrical (Table 6 and Supplementary Figure 13, P-value of Egger's test increased from 0.195 to 0.745). In addition, the sensitivity analysis of average mGCC thickness in PPG eyes and EG eyes demonstrated that the study by Aydogan et al. (39) was the major source of the heterogeneity (Table 8). After excluding this study, the I2 decreased from 83% to 64% (Supplementary Figure 14). In the sensitivity analysis of average mGCC thickness in the PPG eyes and OHT eyes, the study by Aydogan et al. (39) was also shown to introduce the heterogeneity mostly (Table 9). After excluding this study, no heterogeneity was noted (I2 = 0%, Supplementary Figure 15).
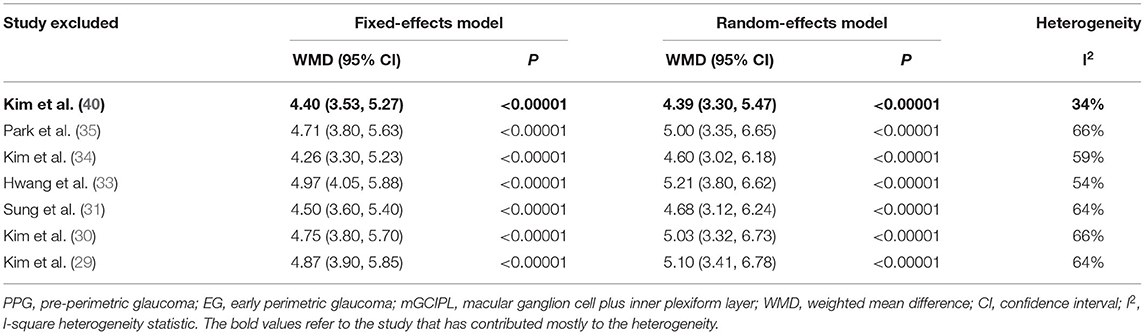
Table 7. Sensitivity analysis of average mGCIPL thickness in patients with PPG and EG.
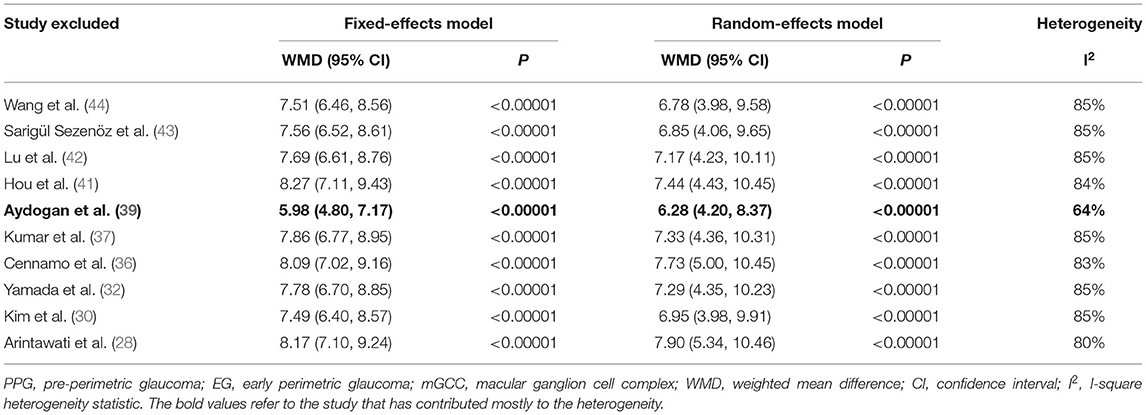
Table 8. Sensitivity analysis of average mGCC thickness in patients with PPG and EG.
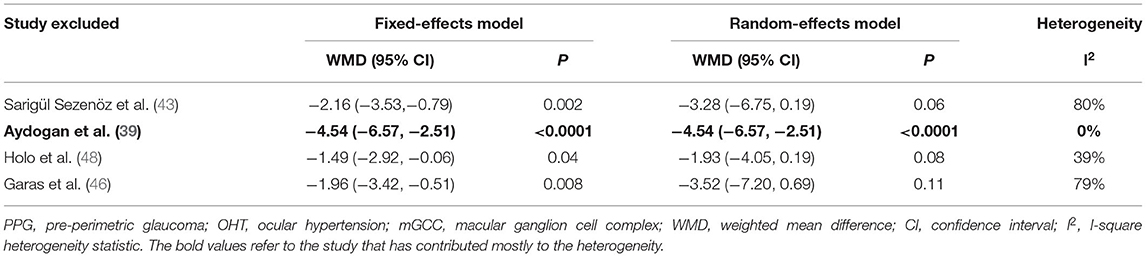
Table 9. Sensitivity analysis of average mGCC thickness in patients with PPG and OHT.
Discussion
In the present study, we first pooled the average and sectoral pRNFL, mGCIPL, and mGCC thickness in patients with PPG and EG. Our results demonstrated that the average and sectoral pRNFL, mGCIPL, and mGCC were significantly thinner in the EG eyes than in the PPG eyes. These findings were consistent across several studies (26, 29, 34, 38–41, 43, 44), whereas the results of eight studies were not significantly different in terms of the average or sectoral pRNFL thickness (27, 28, 30, 31, 35–37, 42); two studies reported there was no significant difference in the EG eyes compared to the PPG eyes concerning mGCC thickness (28, 36), and one study did not demonstrate a significant reduction in the EG eyes regarding the average and superior mGCIPL thickness (33). Currently, the exact biomechanisms of glaucomatous neurodegeneration remain poorly understood (1, 55). Nevertheless, continuous and progressive glaucomatous damage may lead to configuration changes in retinal ganglion cell dendrites, soma, and axons (56, 57), causing the attenuation of thickness in corresponding residing sites, inner plexiform layer, ganglion cell layer and RNFL (20). Our pooled results of pRNFL, mGCIPL, and mGCC thickness suggested that more serious structural damage occurred in EG than in PPG.
To explore the source of heterogeneity across the included studies, we performed subgroup analyses according to the different types of glaucoma. Our findings did not show a significant decrease in the superior quadrant of pRNFL (P = 0.08), and the average, as well as the inferior mGCC thickness in the EG eyes when patients with open-angle glaucoma were enrolled (average: P = 0.09; inferior quadrant: P = 0.16). This was probably mainly due to the relatively small sample size in the subgroup of OAG regarding the pRNFL and the mGCC thickness (N = 2), because of which heterogeneity could not be excluded. Another reason was that no quality assurance step was taken in the study of Cennamo et al. (36). Since only a single OCT examination was performed to evaluate each parameter by one experienced ophthalmologist, ensuring the reproducibility and reliability of the examination results was difficult.
Based on the anatomy of retina, ~30–50% RGCs are centered within the 4.5-mm-circle region of the fovea (44, 58–60); thus, using a relatively small scan area of 3 × 3 mm may not allow the differentiation of EG from PPG or suspected glaucoma (41, 61). For this reason, we also performed a subgroup analysis of the macular scan area. Interestingly, our pooled data showed that when the 6 × 6 mm scan protocol was used, there was a significant decrease in mGCC thickness in the EG eyes compared with the PPG eyes, whereas there was no difference when the 7 × 7 mm scan protocol was used. One reason for the different diagnostic performances between these two scan protocols may be the decreased signal-to-noise ratio. Although the enlarged scan area could cover the region with the most abundant RGCs, the concomitant decrease in signal-to-noise ratio and increase in test-retest variability (62) may have undervalued the assessment of GCC thickness measured by SD-OCT. Another explanation was the strict inclusion criteria by Arintawati et al. (28). In this study, investigators only accepted subjects with all the typical glaucomatous changes observed in fundus photographs to avoid false-positive cases. Consequently, patients with higher severity may have been enrolled; thus, showing a minimal difference between the PPG and EG groups. Unfortunately, because of the small sample size (N = 3), we were unable to include other scan areas and protocols, introducing difficulties in the overall evaluation of the diagnostic values regarding different macular scan protocols. In addition, sensitivity analysis demonstrated that the study of Aydogan et al. (39) contributed mostly to the heterogeneity of average mGCC thickness. The main reason was that the age was not well-matched among PPG and EG groups (P < 0.001), which may induce potential bias since glaucoma is an age-related optic neuropathy (55). However, after excluding this study, the heterogeneity decreased (I2 decreased from 83 to 64%).
Recently, in addition to OCT, several studies have focused on the macular microvasculature changes in PPG and EG via OCT angiography, revealing the progression patterns of glaucoma with respect to microvascular dysregulation (41, 42, 44, 63, 64). Although macular vessel density (VD) was reported to significantly decrease both in PPG and EG, one study demonstrated that mGCC thickness, unlike macular VD, could serve as a tool to discriminate PPG from EG (41). The study also showed that the percentage loss of mGCC thickness was significantly higher than that of macular VD both in PG and EG. Another study reported that both inferotemporal and superotemporal pRNFL thickness were significantly decreased in EG eyes compared to PPG eyes whereas only the inferotemporal sector of the radial peripapillary capillary VD experienced a significant decrease (42). Considering previous OCT studies that suggest that structural deterioration usually occurs before functional loss (10–18), these findings consolidate the results of our study, which indicate that the OCT evaluation of macular structure changes could help to clarify the pathophysiological mechanisms of glaucoma and differentiate PPG from EG.
In a subgroup analysis of pRNFL thickness according to the type of SD-OCT, the pooled results were generally consistent with the combined pooled data except for the nasal quadrant in the Cirrus SD-OCT subgroup. The main reason was that Kim et al. (34) utilized the optic disc Cube 200 × 200 scanning protocol, whereas the other two studies focused on a 3.46-mm-diameter circle region of the ONH (31, 35). Although all types of SD-OCT could detect characteristic glaucomatous damage patterns of pRNFL thickness, different algorithms, software, and parameters may have induced subtle differences in diagnostic performance (65). However, our pooled results demonstrate the important diagnostic value of SD-OCT in evaluating the severity of the glaucomatous damage of the ONH.
Apart from this, studies have shown that individuals with OHT are at higher risk of developing glaucoma than others (3, 4, 66); however, there is no optimal IOP cut-off that possesses both reasonable sensitivity and specificity (3), which may delay the early diagnosis until patients are found to have apparent optic disc structural deterioration. Although the widely used cut-off of 21 mmHg has high sensitivity, it can decrease the specificity to 44% (67). In addition, spectrum bias usually occurs when studies inappropriately include the control groups without any suspicious symptoms of the disease, which can impair the diagnostic efficacy when clinically non-relevant individuals are enrolled (68–70). Thus, we also pooled the average and sectoral pRNFL and mGCC thickness in patients with PPG and OHT.
The pooled results revealed that the pRNFL and mGCC were significantly thinner in the PPG eyes than those in the OHT eyes, which were consistent with several investigations (45, 47, 48). However, two studies reported that there was no difference in patients with PPG and OHT in terms of the average mGCC thickness (39, 43); one study demonstrated that the average pRNFL thickness could not serve as a valued indicator for differential diagnosis (43), and another study showed that no difference was noted in the PPG eyes and OHT eyes regarding the superior mGCC thickness (46).
Similar to the investigation of exploring the heterogeneity across different OCT parameters for the differential diagnosis of PPG and EG, we also performed subgroup analysis of average pRNFL thickness according to the type of OCT. However, no difference was noted in the pooled results with either SD-OCT or TD-OCT. Compared to the traditional TD-OCT, SD-OCT is the latest generation of OCT with ultra-high scanning speed and retinal image resolutions, and is reported to have higher diagnostic abilities in terms of sectoral pRNFL and macular thickness. However, both SD-OCT and TD-OCT showed comparable reproducibility regarding the mean pRNFL (71). This was consistent with our finding. In the sensitivity analysis, the study of Aydogan et al. (39) also contributed mostly to the heterogeneity of mGCC thickness in patients with PPG and OHT. This may be due to usage of the different macular scanning protocol.
Despite the strengths of our study, some of its limitations should be considered. First, mild asymmetry was shown in the funnel plot of average mGCIPL thickness (Supplementary Figure 6A), suggesting potential publication bias. To elucidate the source of the bias, we performed a “leave-one-out” sensitivity analysis (Table 7). The results showed that the study by Kim et al. (40) contributed mostly to the heterogeneity in average mGCIPL thickness, wherein some problems of automated segmentation software occurred, although measures were taken to minimize the consequence of the segmentation error. Therefore, after excluding this study, low heterogeneity (I2 = 34%) was noted (Supplementary Figure 12), and the funnel plot became symmetrical (Supplementary Figure 13). Second, regarding the subgroup analysis of the macular scan area, due to the relatively small sample size, we did not include other scan protocols apart from the 6 × 6 mm and 7 × 7 mm scan protocols. Further, the small sample size may have also introduced heterogeneity in the analysis of mGCC thickness, although sensitivity analyses proved the reliability of our results. Further studies should be included to comprehensively evaluate the influence of scan area and protocols on the assessment of macular structure changes in PPG, EG, and OHT. Moreover, the heterogeneity was high regarding many of our findings, indicating that the results should be cautiously interpreted.
Conclusion
The OCT-based assessment of peripapillary and macular structural changes could be potentially utilized to discriminate PPG from EG and OHT. This facilitates a better understanding of the pathophysiology of glaucoma and provides references for ophthalmologists to manage individuals suspected to have glaucoma and glaucoma patients according to the extent of severity in a non-invasive way. Further studies that employ clock hour classification methods that can monitor the configuration alterations in a narrower range and longitudinal studies are needed to verify our findings.
Data Availability Statement
The original contributions presented in the study are included in the article/Supplementary Material, further inquiries can be directed to the corresponding author/s.
Author Contributions
YT, TW, XZ, and BJ: conceptualization and design. YT, TW, and YH: literature search, data extraction, quality assessment, and data analysis. YT, TW, XZ, YH, and BJ: manuscript writing and editing. BJ: supervision. All authors approved the final version of the manuscript.
Funding
This study was supported by the Natural Science Foundation of China (NSFC 82070967 and 81770930 to BJ), Natural Science Foundation of Hunan Province Grant (2020jj4788 to BJ), China Hunan Provincial Science and Technology Department (No. 2020SK2086). The sponsors did not participate in the design or implementation of this study.
Conflict of Interest
The authors declare that the research was conducted in the absence of any commercial or financial relationships that could be construed as a potential conflict of interest.
Supplementary Material
The Supplementary Material for this article can be found online at: https://www.frontiersin.org/articles/10.3389/fmed.2021.696004/full#supplementary-material
References
1. Weinreb RN, Aung T, Medeiros FA. The pathophysiology and treatment of glaucoma: a review. JAMA. (2014) 311:1901–11. doi: 10.1001/jama.2014.3192
2. Tham YC, Li X, Wong TY, Quigley HA, Aung T, Cheng CY. Global prevalence of glaucoma and projections of glaucoma burden through 2040: a systematic review and meta-analysis. Ophthalmology. (2014) 21:2081–90. doi: 10.1016/j.ophtha.2014.05.013
3. San Laureano J. When is glaucoma really glaucoma? Clin Exp Optom. (2007) 90:376–85. doi: 10.1111/j.1444-0938.2007.00175.x
4. Kass MA, Heuer DK, Higginbotham EJ, Johnson CA, Keltner JL, Miller JP, et al. The ocular hypertension treatment study: a randomized trial determines that topical ocular hypotensive medication delays or prevents the onset of primary open-angle glaucoma. Arch Ophthalmol. (2002) 120:701–13. Discussion 829-30. doi: 10.1001/archopht.120.6.701
5. Boland MV, Ervin AM, Friedman DS, Jampel HD, Hawkins BS, Vollenweider D, et al. Comparative effectiveness of treatments for open-angle glaucoma: a systematic review for the U.S. Preventive Services Task Force. Ann Intern Med. (2013) 158:271–9. doi: 10.7326/0003-4819-158-4-201302190-00008
6. Heijl A, Bengtsson B, Oskarsdottir SE. Prevalence and severity of undetected manifest glaucoma: results from the early manifest glaucoma trial screening. Ophthalmology. (2013) 120:1541–5. doi: 10.1016/j.ophtha.2013.01.043
7. Quigley HA. Number of people with glaucoma worldwide. Br J Ophthalmol. (1996) 80:389–93. doi: 10.1136/bjo.80.5.389
8. Shiga Y, Aizawa N, Tsuda S, Yokoyama Y, Omodaka K, Kunikata H, et al. Preperimetric glaucoma prospective study (PPGPS): predicting visual field progression with basal optic nerve head blood flow in normotensive PPG eyes. Transl Vis Technol. (2018) 7:11. doi: 10.1167/tvst.7.1.11
9. Camp AS, Weinreb RN. Will perimetry be performed to monitor glaucoma in 2025? Ophthalmology. (2017) 124:S71–5. doi: 10.1016/j.ophtha.2017.04.009
10. Quigley HA, Miller NR, George T. Clinical evaluation of nerve fiber layer atrophy as an indicator of glaucomatous optic nerve damage. Arch Ophthalmol. (1980) 98:1564–71. doi: 10.1001/archopht.1980.01020040416003
11. Airaksinen PJ, Drance SM, Douglas GR, Mawson DK, Nieminen H. Diffuse and localized nerve fiber loss in glaucoma. Am J Ophthalmol. (1984) 98:566–71. doi: 10.1016/0002-9394(84)90242-3
12. Sommer A, Katz J, Quigley HA, Miller NR, Robin AL, Richter RC, et al. Clinically detectable nerve fiber atrophy precedes the onset of glaucomatous field loss. Arch Ophthalmol. (1991) 109:77–83. doi: 10.1001/archopht.1991.01080010079037
13. Quigley HA, Katz J, Derick RJ, Gilbert D, Sommer A. An evaluation of optic disc and nerve fiber layer examinations in monitoring progression of early glaucoma damage. Ophthalmology. (1992) 99:19–28. doi: 10.1016/S0161-6420(92)32018-4
14. Harwerth RS, Carter-Dawson L, Shen F, Smith EL 3rd, Crawford ML. Ganglion cell losses underlying visual field defects from experimental glaucoma. Invest Ophthalmol Vis Sci. (1999) 40:2242–50.
15. Asrani S, Challa P, Herndon L, Lee P, Stinnett S, Allingham RR. Correlation among retinal thickness, optic disc, and visual field in glaucoma patients and suspects: a pilot study. J Glaucoma. (2003) 12:119–28. doi: 10.1097/00061198-200304000-00006
16. Ajtony C, Balla Z, Somoskeoy S, Kovacs B. Relationship between visual field sensitivity and retinal nerve fiber layer thickness as measured by optical coherence tomography. Invest Ophthalmol Vis Sci. (2007) 48:258–63. doi: 10.1167/iovs.06-0410
17. Cho JW, Sung KR, Lee S, Yun SC, Kang SY, Choi J, et al. Relationship between visual field sensitivity and macular ganglion cell complex thickness as measured by spectral-domain optical coherence tomography. Invest Ophthalmol Vis Sci. (2010) 51:6401–7. doi: 10.1167/iovs.09-5035
18. Cvenkel B, Sustar M, Perovšek D. Ganglion cell loss in early glaucoma, as assessed by photopic negative response, pattern electroretinogram, and spectral-domain optical coherence tomography. Doc Ophthalmol. (2017) 135:17–28. doi: 10.1007/s10633-017-9595-9
19. Blumenthal EZ, Sapir-Pichhadze R. Misleading statistical calculations in far-advanced glaucomatous visual field loss. Ophthalmology. (2003) 110:196–200. doi: 10.1016/S0161-6420(02)01297-6
20. Tan O, Chopra V, Lu AT, Schuman JS, Ishikawa H, Wollstein G, et al. Detection of macular ganglion cell loss in glaucoma by Fourier-domain optical coherence tomography. Ophthalmology. (2009) 116:2305–14.e1-2. doi: 10.1016/j.ophtha.2009.05.025
21. Savini G, Carbonelli M, Barboni P. Spectral-domain optical coherence tomography for the diagnosis and follow-up of glaucoma. Curr Opin Ophthalmol. (2011) 22:115–23. doi: 10.1097/ICU.0b013e3283437222
22. Hood DC, Raza AS, de Moraes CG, Johnson CA, Liebmann JM, Ritch R. The nature of macular damage in glaucoma as revealed by averaging optical coherence tomography data. Transl Vis Technol. (2012) 1:3. doi: 10.1167/tvst.1.1.3
23. Eladawi N, Elmogy MM, Ghazal M, Helmy O, Aboelfetouh A, Riad A, et al. Classification of retinal diseases based on OCT Images. Front Biosci. (2018) 23:247–64. doi: 10.2741/4589
24. Hood DC, Raza AS. On improving the use of OCT imaging for detecting glaucomatous damage. Br J Ophthalmol. (2014) 98 (Suppl. 2):ii1–9. doi: 10.1136/bjophthalmol-2014-305156
25. Kim MJ, Jeoung JW, Park KH, Choi YJ, Kim DM. Topographic profiles of retinal nerve fiber layer defects affect the diagnostic performance of macular scans in preperimetric glaucoma. Invest Ophthalmol Vis Sci. (2014) 55:2079–87. doi: 10.1167/iovs.13-13506
26. Horn FK, Mardin CY, Bendschneider D, Jünemann AG, Adler W, Tornow RP. Frequency doubling technique perimetry and spectral domain optical coherence tomography in patients with early glaucoma. Eye. (2011) 25:17–29. doi: 10.1038/eye.2010.155
27. Morooka S, Hangai M, Nukada M, Nakano N, Takayama K, Kimura Y, et al. Wide 3-dimensional macular ganglion cell complex imaging with spectral-domain optical coherence tomography in glaucoma. Invest Ophthalmol Vis Sci. (2012) 53:4805–12. doi: 10.1167/iovs.12-9870
28. Arintawati P, Sone T, Akita T, Tanaka J, Kiuchi Y. The applicability of ganglion cell complex parameters determined from SD-OCT images to detect glaucomatous eyes. J Glaucoma. (2013) 22:713–8. doi: 10.1097/IJG.0b013e318259b2e1
29. Kim KE, Park KH, Jeoung JW, Kim SH, Kim DM. Severity-dependent association between ganglion cell inner plexiform layer thickness and macular mean sensitivity in open-angle glaucoma. Acta Ophthalmol. (2014) 92:e650–6. doi: 10.1111/aos.12438
30. Kim YJ, Kang MH, Cho HY, Lim HW, Seong M. Comparative study of macular ganglion cell complex thickness measured by spectral-domain optical coherence tomography in healthy eyes, eyes with preperimetric glaucoma, and eyes with early glaucoma. Jpn J Ophthalmol. (2014) 58:244–51. doi: 10.1007/s10384-014-0315-7
31. Sung MS, Yoon JH, Park SW. Diagnostic validity of macular ganglion cell-inner plexiform layer thickness deviation map algorithm using cirrus HD-OCT in preperimetric and early glaucoma. J Glaucoma. (2014) 23:e144–51. doi: 10.1097/IJG.0000000000000028
32. Yamada H, Hangai M, Nakano N, Takayama K, Kimura Y, Miyake M, et al. Asymmetry analysis of macular inner retinal layers for glaucoma diagnosis. Am J Ophthalmol. (2014) 158:1318–29.e3. doi: 10.1016/j.ajo.2014.08.040
33. Hwang YH, Ahn SI, Ko SJ. Diagnostic ability of macular ganglion cell asymmetry for glaucoma. Clin Exp Ophthalmol. (2015) 43:720–6. doi: 10.1111/ceo.12545
34. Kim YK, Yoo BW, Kim HC, Park KH. Automated detection of hemifield difference across horizontal raphe on ganglion cell–inner plexiform layer thickness map. Ophthalmology. (2015) 122:2252–60. doi: 10.1016/j.ophtha.2015.07.013
35. Park JW, Jung HH, Heo H, Park SW. Validity of the temporal-to-nasal macular ganglion cell-inner plexiform layer thickness ratio as a diagnostic parameter in early glaucoma. Acta Ophthalmol. (2015) 93:e356–65. doi: 10.1111/aos.12666
36. Cennamo G, Montorio D, Romano MR, Cardone DM, Minervino C, Reibaldi M, et al. Structure-functional parameters in differentiating between patients with different degrees of glaucoma. J Glaucoma. (2016) 25:e884–8. doi: 10.1097/IJG.0000000000000491
37. Kumar RS, Anegondi N, Chandapura RS, Sudhakaran S, Kadambi SV, Rao HL, et al. Discriminant function of optical coherence tomography angiography to determine disease severity in glaucoma. Invest Ophthalmol Vis Sci. (2016) 57:6079–88. doi: 10.1167/iovs.16-19984
38. Akil H, Huang AS, Francis BA, Sadda SR, Chopra V. Retinal vessel density from optical coherence tomography angiography to differentiate early glaucoma, pre-perimetric glaucoma and normal eyes. PLoS ONE. (2017) 12:e0170476. doi: 10.1371/journal.pone.0170476
39. Aydogan T, Akçay BIS, Kardeş E, Ergin A. Evaluation of spectral domain optical coherence tomography parameters in ocular hypertension, preperimetric, and early glaucoma. Indian J Ophthalmol. (2017) 65:1143–50. doi: 10.4103/ijo.IJO_157_17
40. Kim EK, Park HL, Park CK. Segmented inner plexiform layer thickness as a potential biomarker to evaluate open-angle glaucoma: dendritic degeneration of retinal ganglion cell. PLoS ONE. (2017) 12:e0182404. doi: 10.1371/journal.pone.0182404
41. Hou H, Moghimi S, Zangwill LM, Shoji T, Ghahari E, Penteado RC, et al. Macula vessel density and thickness in early primary open-angle glaucoma. Am J Ophthalmol. (2019) 199:120–32. doi: 10.1016/j.ajo.2018.11.012
42. Lu P, Xiao H, Liang C, Xu Y, Ye D, Huang J. Quantitative analysis of microvasculature in macular and peripapillary regions in early primary open-angle glaucoma. Curr Eye Res. (2020) 45:629–35. doi: 10.1080/02713683.2019.1676912
43. Sarigül Sezenöz A, Gür Güngör S, Akman A, Öztürk C, Cezairlioglu S, Aksoy M, et al. The diagnostic ability of ganglion cell complex thickness-to-total retinal thickness ratio in glaucoma in a Caucasian population. Turk J Ophthalomol. (2020) 50:26–30. doi: 10.4274/tjo.galenos.2019.19577
44. Wang Y, Xin C, Li M, Swain DL, Cao K, Wang H, et al. Macular vessel density versus ganglion cell complex thickness for detection of early primary open-angle glaucoma. BMC Ophthalmol. (2020) 20:17. doi: 10.1186/s12886-020-1304-x
45. Taliantzis S, Papaconstantinou D, Koutsandrea C, Moschos M, Apostolopoulos M, Georgopoulos G. Comparative studies of RNFL thickness measured by OCT with global index of visual fields in patients with ocular hypertension and early open angle glaucoma. Clin Ophthalmol. (2009) 3:373–9. doi: 10.2147/OPTH.S6150
46. Garas A, Vargha P, Holló G. Diagnostic accuracy of nerve fibre layer, macular thickness and optic disc measurements made with the RTVue-100 optical coherence tomograph to detect glaucoma. Eye. (2011) 25:57–65. doi: 10.1038/eye.2010.139
47. Pomorska M, Krzyzanowska-Berkowska P, Misiuk-Hojło M, Zajac-Pytrus H, Grzybowski A. Application of optical coherence tomography in glaucoma suspect eyes. Clin Exp Optom. (2012) 95:78–88. doi: 10.1111/j.1444-0938.2011.00654.x
48. Holló G, Naghizadeh F, Vargha P. Accuracy of macular ganglion-cell complex thickness to total retina thickness ratio to detect glaucoma in white Europeans. J Glaucoma. (2014) 23:e132–7. doi: 10.1097/IJG.0000000000000030
49. Stroup DF, Berlin JA, Morton SC, Olkin I, Williamson GD, Rennie D, et al. Meta-analysis of observational studies in epidemiology: a proposal for reporting. Meta-analysis of observational studies in epidemiology (MOOSE) group. JAMA. (2000) 283:2008–12. doi: 10.1001/jama.283.15.2008
50. Liberati A, Altman DG, Tetzlaff J, Mulrow C, Gøtzsche PC, Ioannidis JP, et al. The PRISMA statement for reporting systematic reviews and meta-analyses of studies that evaluate health care interventions: explanation and elaboration. J Clin Epidemiol. (2009) 62:e1–34. doi: 10.1016/j.jclinepi.2009.06.006
51. Parrish RK, Gedde SJ, Scott IU, Feuer WJ, Schiffman JC, Mangione CM, et al. Visual function and quality of life among patients with glaucoma. Arch Ophthalmol. (1997) 115:1447–55. doi: 10.1001/archopht.1997.01100160617016
52. Higgins JP, Thompson SG, Deeks JJ, Altman DG. Measuring inconsistency in meta-analyses. BMJ. (2003) 327:557–60. doi: 10.1136/bmj.327.7414.557
53. Begg CB, Mazumdar M. Operating characteristics of a rank correlation test for publication bias. Biometrics. (1994) 50:1088–101. doi: 10.2307/2533446
54. Egger M, Davey Smith G, Schneider M, Minder C. Bias in meta-analysis detected by a simple, graphical test. BMJ. (1997) 315:629–34. doi: 10.1136/bmj.315.7109.629
55. Weinreb RN, Khaw PT. Primary open-angle glaucoma. Lancet. (2004) 363:1711–20. doi: 10.1016/S0140-6736(04)16257-0
56. Frankfort BJ, Khan AK, Tse DY, Chung I, Pang JJ, Yang Z, et al. Elevated intraocular pressure causes inner retinal dysfunction before cell loss in a mouse model of experimental glaucoma. Invest Ophthalmol Vis Sci. (2013) 54:762–70. doi: 10.1167/iovs.12-10581
57. El-Danaf RN, Huberman AD. Characteristic patterns of dendritic remodeling in early-stage glaucoma: evidence from genetically identified retinal ganglion cell types. J Neurosci. (2015) 35:2329–43. doi: 10.1523/JNEUROSCI.1419-14.2015
58. Quigley HA, Dunkelberger GR, Green WR. Retinal ganglion cell atrophy correlated with automated perimetry in human eyes with glaucoma. Am J Ophthalmol. (1989) 107:453–64. doi: 10.1016/0002-9394(89)90488-1
59. Curcio CA, Allen KA. Topography of ganglion cells in human retina. J Comp Neurol. (1990) 300:5–25. doi: 10.1002/cne.903000103
60. Kerrigan-Baumrind LA, Quigley HA, Pease ME, Kerrigan DF, Mitchell RS. Number of ganglion cells in glaucoma eyes compared with threshold visual field tests in the same persons. Invest Ophthalmol Vis Sci. (2000) 41:741–8.
61. Triolo G, Rabiolo A, Shemonski ND, et al. Optical coherence tomography angiography macular and peripapillary vessel perfusion density in healthy subjects, glaucoma suspects, and glaucoma patients. Invest Ophthalmol Vis Sci. (2017) 58:5713–22. doi: 10.1167/iovs.17-22865
62. Wan KH, Lam AKN, Leung CK. Optical coherence tomography angiography compared with optical coherence tomography macular measurements for detection of glaucoma. JAMA Ophthalmol. (2018) 136:866–74.42. doi: 10.1001/jamaophthalmol.2018.1627
63. Poli M, Cornut PL, Nguyen AM, De Bats F, Denis P. Accuracy of peripapillary versus macular vessel density in diagnosis of early to advanced primary open angle glaucoma. J Fr Ophtalmol. (2018) 41:619–29. doi: 10.1016/j.jfo.2018.02.004
64. Rolle T, Dallorto L, Tavassoli M, Nuzzi R. Diagnostic ability and discriminant values of OCT-angiography parameters in early glaucoma diagnosis. Ophthalmic Res. (2019) 61:143–52. doi: 10.1159/000489457
65. Chen TC, Hoguet A, Junk AK, Nouri-Mahdavi K, Radhakrishnan S, Takusagawa HL, et al. Spectral-domain OCT: helping the clinician diagnose glaucoma: a report by the American Academy of Ophthalmology. Ophthalmology. (2018) 125:1817–27. doi: 10.1016/j.ophtha.2018.05.008
66. Jayanetti V, Sandhu S, Lusthaus JA. The latest drugs in development that reduce intraocular pressure in ocular hypertension and glaucoma. J Exp Pharmacol. (2020) 12:539–48. doi: 10.2147/JEP.S281187
67. Tielsch JM, Katz J, Singh K, Quigley HA, Gottsch JD, Javitt J, et al. A population-based evaluation of glaucoma screening: the Baltimore Eye Survey. Am J Epidemiol. (1991) 134:1102–10. doi: 10.1093/oxfordjournals.aje.a116013
68. Rao HL, Kumbar T, Addepalli UK, Bharti N, Senthil S, Choudhari NS, et al. Effect of spectrum bias on the diagnostic accuracy of spectral-domain optical coherence tomography in glaucoma. Invest Ophthalmol Vis Sci. (2012) 53:1058–65. doi: 10.1167/iovs.11-8463
69. Rao HL, Addepalli UK, Chaudhary S, Kumbar T, Senthil S, Choudhari NS, et al. Ability of different scanning protocols of spectral domain optical coherence tomography to diagnose preperimetric glaucoma. Invest Ophthalmol Vis Sci. (2013) 54:7252–7. doi: 10.1167/iovs.13-12731
70. Willis BH. Spectrum bias–why clinicians need to be cautious when applying diagnostic test studies. Fam Pract. (2008) 25:390–6. doi: 10.1093/fampra/cmn051
Keywords: pre-perimetric glaucoma, early perimetric glaucoma, ocular hypertension, optical coherence tomography, retinal nerve fiber layer, ganglion cell plus inner plexiform layer, ganglion cell complex
Citation: Tong Y, Wang T, Zhang X, He Y and Jiang B (2021) Optical Coherence Tomography Evaluation of Peripapillary and Macular Structure Changes in Pre-perimetric Glaucoma, Early Perimetric Glaucoma, and Ocular Hypertension: A Systematic Review and Meta-Analysis. Front. Med. 8:696004. doi: 10.3389/fmed.2021.696004
Received: 15 April 2021; Accepted: 28 May 2021;
Published: 01 July 2021.
Edited by:
Michele Lanza, University of Campania Luigi Vanvitelli, ItalyReviewed by:
Je Hyun Seo, Pusan National University, South KoreaChristian Mardin, University of Erlangen Nuremberg, Germany
Copyright © 2021 Tong, Wang, Zhang, He and Jiang. This is an open-access article distributed under the terms of the Creative Commons Attribution License (CC BY). The use, distribution or reproduction in other forums is permitted, provided the original author(s) and the copyright owner(s) are credited and that the original publication in this journal is cited, in accordance with accepted academic practice. No use, distribution or reproduction is permitted which does not comply with these terms.
*Correspondence: Bing Jiang, ZHJqaWFuZ2JAY3N1LmVkdS5jbg==
†These authors have contributed equally to this work