The biobehavioural pain and movement questionnaire (BioPMovQ): development and psychometric validation of a new questionnaire
 Roy La Touche1,2,3,4
  Alba Paris-Alemany2,3,5*
  Joaquín Pardo-Montero1,2,6
  Diego Miñambres-Martín7,8
  Francisco Mercado-Romero9,10 Irene de la Rosa-Díaz1,2 Miguel A. Sorrel11
  Mónica Grande-Alonso12,13
- 1Departamento de Fisioterapia, Centro Superior de Estudios Universitarios (CSEU) La Salle, Universidad Autónoma de Madrid, Madrid, Spain
- 2Motion in Brains Research Group, Institute of Neuroscience and Sciences of the Movement (INCIMOV), Centro Superior de Estudios Universitarios La Salle, Madrid, Spain
- 3Instituto de Dolor Craneofacial y Neuromusculoesquelético (INDCRAN), Madrid, Spain
- 4PhD Program in Medicine and Surgery, Doctoral School, Universidad Autónoma de Madrid, Madrid, Spain
- 5Departamento de Radiología, Rehabilitación y Fisioterapia, Facultad de Enfermería, Fisioterapia y Podología, Universidad Complutense de Madrid, Madrid, Spain
- 6La Paz Hospital Institute for Health Research, IdiPAZ, Madrid, Spain
- 7Premium Madrid Global Health Care, Madrid, Spain
- 8Faculty of Sport Sciences, Universidad Europea de Madrid, Madrid, Spain
- 9Cognitive Neuroscience, Pain, and Rehabilitation Research Group (NECODOR), Faculty of Health Sciences, Rey Juan Carlos University, Madrid, Spain
- 10Department of Psychology, Faculty of Health Sciences, Rey Juan Carlos University, Madrid, Spain
- 11Departamento de Psicología Social y Metodología, Universidad Autónoma de Madrid, Madrid, Spain
- 12Departamento de Cirugía, Ciencias Médicas y Sociales, Facultad de Medicina, Universidad de Alcalá, Alcalá de Henares, Spain
- 13Grupo de Investigación Clínico-Docente sobre Ciencias de la Rehabilitación (INDOCLIN), Centro Superior de Estudios Universitarios La Salle, Madrid, Spain
Objective: The purpose of this research was to design and psychometrically validate a new instrument (the Biobehavioural Pain and Movement Questionnaire/BioPMovQ), which assesses the relationship between pain and various factors related to motor behaviour from a biobehavioural perspective.
Methods: A mixed-method design combining a qualitative study with an observational and cross-sectional study was employed to develop (content validity) and psychometrically validate (construct validity, reliability and concurrent/discriminant validity) a new instrument. A total of 200 patients with chronic musculoskeletal pain were recruited.
Results: According to the exploratory factor analysis, the final version of the BioPMovQ consists of 16 items distributed across 4 subscales (1, disability, 2, self-efficacy for physical activity; 3, movement avoidance behaviours; and 4, self-perceived functional ability), all with an eigen value greater than 1, explaining 55.79% of the variance. The BioPMovQ showed high internal consistency (Cronbach’s α = 0.82; McDonald’s ω = 0.83). The intraclass correlation coefficient was 0.86 (95% confidence interval 0.76 to 0.91), which was considered to demonstrate excellent test–retest reliability. The standard error of measurement and minimal detectable change were 3.43 and 8.04 points, respectively. No floor or ceiling effects were identified. There was a positive, significant and moderate magnitude correlation with the Graded Chronic Pain Scale (r = 0.54), kinesiophobia (r = 0.60), pain catastrophising (r = 0.44) and chronic pain self-efficacy (r = −0.31).
Conclusion: The BioPMovQ showed good psychometric properties. Based on the findings of this study, the BioPMovQ can be used in research and clinical practice to assess patients with chronic musculoskeletal pain.
1 Introduction
Pain is a complex multidimensional experience that significantly influences behaviour and has a perceptual character dependent on context and individual evaluative processes. In the multidimensional aspect of pain, movement is considered to play a key role (1). Simmonds et al. (2) considered that movement responses are not just a consequence of anticipating and minimising pain; the authors’ proposed that the motor behaviour involved in pain is a very complex factor because psychological (cognition and emotions), social and contextual factors can influence motor activity within the behavioural component of pain as a multidimensional experience (2). Many psychological constructs are significant predictors of outcomes, such as pain, disability and work retention (3). These variables are relevant in a biobehavioural approach.
Several studies have reported the onset of functional and structural changes in the cortical motor areas of patients with chronic pain (4, 5). Pain-related movement disorders have been proposed to neurophysiologically involve central and peripheral mechanisms, which have varying degrees of influence in determining behavioural performance (6). There are also numerous studies on kinematic abnormalities associated with musculoskeletal pain (7–9).
In the past 2 decades, several theories have been developed to explain the relationship between pain and movement (10), which have been designed on the basis of findings from studies of experimentally induced pain (11) and on research assessing functional deficits and disability through the influence or interaction of sensory, cognitive, emotional and motor components in patients with chronic pain (12–16).
A number of authors have suggested the general premise that pain generates changes in the way patients move, which in turn can change the way patients perceive the painful experience (17–19), leading to the proposition that movement is initially involved in the experience of pain as an adaptive and protective response to control or diminish its perception (10, 20). These evoked responses can influence movement by altering neuromuscular speed, variability and efficiency. The theory of the motor behaviour dimension of the pain experience encompasses the set of adaptive or maladaptive motor responses related to the pain experience that affect modulation, processing and function and that also interact with or are influenced by contextual, cognitive and affective-motivational factors (1).
Emotional factors related to fear of pain play an important role in the degree of protective behaviours experienced when faced with pain (21). Research has shown that extreme fear of pain is associated with being less physically active (22, 23), having limited range of motion (24, 25), having greater physical disability (26) and developing strategies for adopting alternative movements (27). Behaviours associated with psychological distress, activity disruption and activity avoidance are essential components of pain-related disability (28).
Current evidence supports the fact that psychosocial factors other than fear of pain might contribute to pain-related functional impairment (29–31). Sullivan et al. suggested that certain psychological factors, such as pain catastrophising, fear and depression can influence pain behaviour by lowering the threshold for activating motor programmes related to the experience of pain (21).
Although more research is still needed to determine the complex interactions between movement and pain and their mutual influence on cognitive, behavioural and social factors, it is important to understand the relationship between movement and pain (32). It is now considered a clinical necessity to evaluate these interactions from a biobehavioural perspective, taking into account that pain-related movement disorders have a significant effect on the deterioration of the patient’s functional capacity and quality of life (33).
Biobehavioural factors related to pain, functional limitation and disability can be classified into three broad categories: (1) cognitive-perceptual (cognitive-perceptual bias, perceived control, perceived disability, fear of pain, work and family perceptions and perceived self-efficacy); (2) behavioural-environmental (positive and negative behavioural consequences and physical stressors); and (3) physiological (physiological responses to work and physiological responses to pain or other aversive somatic stimuli) (33).
The central hypothesis of this research posits that the Biobehavioural Pain and Movement Questionnaire (BioPMovQ), specifically developed to evaluate the multifaceted impact of pain on movement from a biobehavioural standpoint, will demonstrate robust validity and psychometric properties, rendering it suitable for application in individuals suffering from musculoskeletal pain.
In light of the intricate interplay between pain, motor behaviour, and psychosocial factors in chronic musculoskeletal pain management, this study aims to address three primary objectives, each responding to a distinct need highlighted in the literature.
The first objective is to design a self-administered instrument assessing the impact of pain on various factors related to motor behaviour from a biobehavioural perspective. There are currently no valid and reliable assessment instruments that assess the multidimensional influence of pain on movement from a biobehavioural perspective. A single instrument that assesses various factors related to pain and movement (such as exercise self-efficacy, avoidance behaviours, physical discomfort, disability and perceived functional ability) could be useful for clinicians involved in the study and treatment of pain.
The second objective, to evaluate the comprehension and content validity of the designed instrument, is rooted in the necessity to ensure that the instrument is both intelligible to patients and clinically relevant. This is pivotal to ensure that the measurements accurately reflect patients’ experiences and are useful for health practitioners in clinical decision-making.
Lastly, the third objective aims to identify the basic psychometric properties of the instrument. This objective addresses the critical need for reliable and valid assessment tools to measure the complexities of musculoskeletal pain and its effects on motor behaviour. Psychometric validation is indispensable for advancing both research and clinical practice, enabling more tailored and effective interventions.
2 Methods
A mixed method design combining a qualitative study with an observational and cross-sectional study was employed to develop and psychometrically validate the new instrument. The design of the BioPMovQ was developed using a standardised methodology based on six phases (34): (1) perform an intensive literature review; (2) perform semi-structured interviews; (3) synthesise the literature review and analyse the semi-structured interviews; (4) develop the items (detail the items and identify the domains); (5) perform expert validation (content validity); and (6) assess the instrument’s comprehension and feasibility (cognitive debriefing) in a small group of patients (pilot testing). The procedures during the psychometric validation were performed according to the COSMIN Study Design checklist for patient-reported outcome measurement instruments (35).
The study was approved by the bioethics committee of the Centro Superior de Estudios Universitarios La Salle (CSEULS-PI-005/2020). The objective of the research was explained to all participants in detail, who provided written informed consent to participate in the study. The data were collected between January 2020 and February 2022.
2.1 Development of the items
2.1.1 Literature review
A search of the scientific literature was performed in 6 specialised databases (Medline, PEDro, PsycINFO, CINAHL, EMBASE and Web of Science). Information was extracted from narrative reviews, qualitative studies, observational studies, systematic reviews and meta-analyses addressing the topics of pathophysiology of musculoskeletal pain, neurophysiology of chronic pain, pain-related motor impairments, function and disability, assessment of pain and movement and the social and psychological implications related to disability and functional ability.
The content analysis of the scientific literature was independently evaluated by 2 researchers who performed a tabular extraction of the relevant topics.
A second search was conducted to identify psychometrically validated self-report instruments aimed at identifying motor and functional implications related to pain, disability and psychosocial aspects. A total of 17 self-reporting instruments were identified and analysed in depth from a critical perspective, taking into account each instrument’s differences, similarities, advantages, disadvantages and limitations (36–52).
2.1.2 Semi-structured interviews
Based on the scientific literature review, a semi-structured interview for patients with chronic musculoskeletal pain was designed by consensus. The interview was developed by focusing on the relationship between pain and movement function and possible psychosocial interference. Drafts of the interview questions were discussed and reviewed by the research team during a pre-established session. A semi-structured interview was conducted involving 12 patients with chronic musculoskeletal pain.
2.1.3 Synthesis of the literature review and semi-structured interview analysis
The results of the semi-structured interview were analysed, employing an interpretative phenomenological analysis (53), which is a qualitative study that assesses the meaning that people attach to their own experiences (54–56).
From the qualitative analysis, it was possible to extract the experiences and a construct meaning, and a list of three main themes and seven sub-themes was generated, which included (1) behaviours and cognitions of fear-avoidance; (2) pain-related changes in motor behaviours; (3) coping behaviours; (4) pain-related disability; (5) pain-related bodily perceptions; (6) self-efficacy related to activities of daily living; and (7) exercise self-efficacy.
The final analysis of this phase was performed by 2 researchers who, through a consensus methodology, grouped and sorted the results of the qualitative study and literature review.
From the synthesis of scientific evidence obtained through literature review, five fundamental conclusions can be drawn:
1. A multitude of studies have delineated or hypothesised various neurophysiological mechanisms, both central and peripheral, associated with pain. These mechanisms might be linked to alterations in movement and functionality, such as changes in motor control, range of movement, muscle strength and endurance, as well as the onset of disability.
2. Various factors influencing motor behaviour associated with pain—such as disability, avoidance behaviours, movement fear, and deficits in self-efficacy—can significantly impact patient quality of life. These factors are interconnected with multiple psychological aspects.
3. Disability is identified as a crucial factor in the analysis of patients with chronic pain, highlighting how these individuals face challenges in performing daily activities, recreational activities, physical activities, and work-related tasks.
4. Motor and functional alterations associated with pain could be conceptualised as a multidimensional construct that encompasses cognitive, emotional, sensory, and social dimensions.
5. Currently, there are no psychometrically validated instruments available that comprehensively assess the implications of motor and functional alterations associated with pain from a multidimensional perspective. There are various instruments that specifically and separately evaluate disability, self-efficacy in different pain-related contexts (physical activity, exercise, pain self-management) and factors associated with fear and activity avoidance.
2.1.4 Developing items
Findings from the relevant literature and data from the semi-structured interviews were qualitatively analysed by 3 researchers to define the conceptual construct of “pain related to movement and function from a biobehavioural perspective.” Subsequently, the articles were written. A total of 28 items were designed through a structured consensus process (57), with 27 items ultimately established for this phase and ordered by their relevance within each dimension (sub-constructs).
2.1.5 Expert-validated content
A 26-item preliminary list was drafted for the scale, the suitability of which (relevance, pertinence, clarity, coherence and degree of coverage of the relevant aspects) was evaluated by an external expert panel (validation by judges). The requirements to be considered an expert judge were (1) having at least 4 publications related to chronic pain, movement and function; (2) at least 10 years of clinical or scientific experience in the area of pain and movement; and (3) knowledge about the psychometric validation of questionnaires.
The expert content validation panel consisted of 11 expert judges with research and clinical backgrounds (1 medical doctor, 7 physiotherapists and 3 psychologists), who were asked to conduct a qualitative evaluation (relevance, comprehensiveness and comprehensibility) of every item, using a 5-level Likert scale (1, strongly agree; 2, agree; 3, neither agree nor disagree; 4, disagree; and 5, strongly disagree).
To consider an item for deletion, the following performance indicators were considered: (1) mean item score of <0.70 Aiken’s V statistic (58); (2) the behavioural content did not have a generally accepted meaning or definition; (3) the item was ambiguously defined; (4) the content item was irrelevant or repetitive to the purposes of measurement; and (5) whether the qualified judges had agreed that the item had been adequately sampled based on consensus.
2.1.6 Cognitive debriefing
A cognitive debriefing methodology was applied as a qualitative evaluation of the preliminary version of the instrument by a small group of patients (32 patients). The cognitive debriefing was based on the instrument’s evaluation, considering 5 aspects that analyse the completeness, relevance and clarity of expression (59): (1) comprehension of each question; (2) relevance of the information; (3) decision processes (response time, response/abandonment rate); (4) response processes; and (5) general comments.
2.2 Psychometric validation
2.2.1 Participants
A consecutive non-probability sample of participants were recruited from 2 physiotherapy clinics. All participants were assessed by physiotherapists with experience and academic training in managing musculoskeletal disorders, and the patients were classified as having chronic musculoskeletal pain. Chronic musculoskeletal pain is defined as “persistent or recurrent pain arising as part of a pathological process that directly affects the bones, joints, muscles or related soft tissues” (60).
Patients were selected if they met all the following criteria: (1) presence of pain of more than 6 months’ duration; (2) a pain intensity greater than or equal to 3 points on the numerical pain rating scale (NPRS); (3) an age of 18 years or older; (4) chronic primary musculoskeletal pain, classified as primary chronic pain (cannot be directly attributed to a known disease or damage process) or as secondary if caused by a disease or process that directly affects the bones, joints, muscles and/or related soft tissues (61); (5) a good understanding of the Spanish language; and (6) not having started physiotherapy or having undergone fewer than 2 treatment sessions.
The exclusion criteria were (1) cognitive impairment; (2) psychiatric limitations that impede participation in the study assessments; (3) inability to grant written informed consent; (4) a history of musculoskeletal trauma (e.g., fracture); (5) postoperative musculoskeletal pain during the previous 6 months; and (6) musculoskeletal pain suspected to originate from neurological (e.g., stroke), neoplastic (e.g., breast cancer) and/or referred pain (e.g., visceral referred pain).
2.2.2 Sample size
The sample size for the psychometric evaluation was specifically established through a theoretical profile based on exploratory factorial analysis. We estimated that the sample size should exceed 200 cases based on a moderate condition where communalities of between 0.40 and 0.70 and at least 2 factors with more than 4 items each are expected (62). This estimate is in line with the methodological criteria of experts who consider that even under ideal conditions, such as obtaining high communalities and well-determined factors, the sample for studies that perform a factorial analysis should exceed 200 cases (62, 63).
For the sample size calculation for the test–retest reliability study, we employed the method described by Walter et al. (64), which is based on estimating the sample size from assumptions of the intraclass correlation coefficient (ICC) result. The minimum acceptable ICC estimated for the test–retest assessments (2 assessments) was P0 = 0.75; however, we expected an ICC higher than P1 = 0.90. Considering a power of 95% (β = 0.5) and an alpha error level of 0.05, the study sample size should comprise 45 participants; after estimating possible losses of 15% for the sample, the total recommended sample size is 53 participants. The sample size was calculated with a web calculator (65).
2.2.3 Procedure
After consenting to participate in the study, the recruited participants received a series of self-reports to assess disability-related and other psychological variables, as well as to record demographic characteristics. The self-reports included the preliminary version of the BioPMovQ, the Spanish version of the Chronic Pain Self-Efficacy Scale (CPSS), the Spanish version of the Pain Catastrophising Scale (PCS), the Spanish version of the Tampa Scale for Kinesiophobia (TSK-11) and the Spanish version of the Graded Chronic Pain Scale (GCPS).
The sociodemographic questionnaire collected information on gender, date of birth, marital status, educational level and employment status.
Biobehavioural Pain and Movement Questionnaire (BioPMovQ) (Draft version).
The preliminary version of the BioPMovQ consisted of 25 items and 5 theoretical subscales (factors) that evaluated (1) movement avoidance behaviours; (2) self-efficacy for physical activity; (3) physical discomfort; (4) self-perceived functional ability; and (5) disability. The items were scored on a 5-level Likert scale (1, strongly agree; 2, agree; 3, neither agree nor disagree; 4, disagree; and 5, strongly disagree). Higher scores indicate greater implications for pain-related motor and functional impairment.
2.3 Data analysis
The theoretical construct was determined and its reliability and external validity evaluated using SPSS software version 21 (IBM SPSS Statistics). Descriptive statistics were employed to summarise the data for categorical variables as absolute (number) and relative frequencies (percentage). Sociodemographic and clinical variables are presented as mean ± standard deviation (SD), 95% confidence interval, range (minimum-maximum), Skewness and Kurtosis. A normality analysis was conducted using the Kolmogorov–Smirnov test.
2.3.1 Construct validity
The construct validity was evaluated using an exploratory factor analysis (EFA) to determine the optimal factor structure. The factorial structure was investigated using Generalised Least Squares factoring (66) with OBLIMIN rotation. (67) The quality of the factor analysis models was assessed with the Kaiser–Meyer–Olkin (KMO) test and the Bartlett sphericity test. The KMO measures the degree of multicollinearity and ranges from 0 to 1 (with an optimal range of >0.50–0.60) (68). We established the optimal number of factors based on Kaiser’s eigenvalue criterion (eigenvalue ≥1), evaluation of the scree plot (69), parallel analysis (70), and exploratory graph analysis (EGA); (71) and by choosing stable factors (more than 2 items per factor, lowest number of cross-loadings). These, parallel analysis and EGA, were executed using the psych and EGAnet R packages (72, 73). To evaluate the fit of the model to the data, a semi-confirmatory parallel analysis was conducted utilising various fit indices. The Root Mean Square Error of Approximation (RMSEA) was calculated, with a 90% Confidence Interval (CI). Typically, RMSEA values up to 0.08 are considered to indicate a reasonable fit to the data, with values closer to 0.05 or below suggesting a good fit. The Tucker-Lewis Index (TLI) was also determined. This index compares the fit of the proposed model to a null or baseline model. TLI values approaching or exceeding 0.95 are commonly viewed as indicative of an excellent fit to the data. The Bayesian Information Criterion (BIC) was computed as an additional measure of fit. Lower BIC values (more negative) are generally preferred, indicating a model that better captures the underlying data structure with fewer parameters. Lastly, the model’s goodness of fit was assessed using the chi-square test. A non-significant chi-square value suggests that the observed and expected covariances are not substantially different, indicating a suitable model fit.
Finally, items were selected in such a way as to preserve the theoretical structure in order to ensure the content validity of the test. For EFA, a factor loading greater than 0.4 was considered necessary for the item’s inclusion in each factor (74).
An additional measure to assess the appropriateness of the proposed factorial solution involved the use of alternative models (1, 2, 3 factors). For this purpose, fit measures, and the percentage of explained variance were analysed. Furthermore, the distribution of factors and their respective factorial weights will be presented.
2.3.2 Floor and ceiling effect
The floor and ceiling effect were evaluated by calculating the percentage of patients who obtained the minimum or maximum possible scores. If at least 15% of the patients achieved the minimum/maximum score, a floor/ceiling effect was considered to be present (75).
2.3.3 Concurrent validity
The concurrent validity was measured using Pearson correlations between BioPMovQ and the other disability and psychological measures. A value <0.30 was considered a low correlation, 0.30–0.60 a moderate correlation and > 0.60 a strong correlation (75).
1. Disability. Disability was assessed with the Spanish version of the GCPS, which has been employed to measure the degree of interference from chronic pain in activities of daily living. The GCPS consists of 8 items with response options in 11-point Likert format, with a total range of 0–70 points. The scale has 2 sub-scales, one measuring pain intensity and the other disability, and grades disability into moderate and severe levels. The Spanish version of this scale has demonstrated good internal consistency (Cronbach α, 0.87) (40).
2. Pain intensity. Self-reported pain intensity was assessed with the NPRS (0–10/10). On this scale, a score of 0 indicates “no pain” while a score of 10 indicates “maximum possible pain intensity” (76).
3. Pain catastrophism. To measure the level of pain catastrophising, we employed the Spanish version of the PCS, which has demonstrated adequate internal consistency (Cronbach’s α, 0.79) and test–retest reliability (ICC, 0.84) (77). The scale contains 13 items subdivided into 3 domains: rumination (constant worry and inability to inhibit pain-related thoughts, 4 items), magnification (exaggeration of the unpleasantness of pain, 3 items), and hopelessness (loss of hope for achieving something or for some physical and/or psychological aspect detrimental to health to disappear, 6 items) (77).
4. Chronic pain self-efficacy. The level of self-efficacy was assessed using the Spanish version of the CPSS, which has acceptable psychometric properties for assessing perceived self-efficacy and the ability to cope with the consequences of chronic pain (Cronbach’s α, 0.91) (78). The version consists of 19 items subdivided into 3 dimensions: self-efficacy in coping with symptom control, self-efficacy in pain management and self-efficacy in physical function. The final score ranges from 0 to 190, and the total score is obtained with the sum of the 3 dimensions, with higher scores indicating higher self-efficacy (48).
5. Fear of movement. To measure fear of movement, we employed the Spanish version of the TSK-11, which has adequate psychometric properties and good internal consistency (Cronbach’s α, 0.81) (42). The scale consists of 2 subscales, one related to fear of physical activity and the other related to fear of harm. Each of the 11 items was scored from 1–4 (1 = “strongly disagree,” 2 = “disagree,” 3 = “agree,” 4 = “strongly agree”), for total scores ranging from 11 to 44, with higher scores indicating greater fear of movement (42).
2.3.4 Reliability
Internal consistency was measured with Cronbach’s α and item-total correlation coefficients. The internal consistency was considered appropriate when the α coefficient was ≥0.70 (79). We also computed McDonald’s coefficient ω (total) using the psych R package (73). This is one index recommended as an alternative to Cronbach’s α (80).
We examined the test–retest reliability using the ICC and considered that values <0.50 indicated poor reliability, 0.50–0.75 indicated moderate reliability, 0.75–0.90 indicated good reliability and > 0.90 indicated excellent reliability (81).
Measurement error was expressed as a standard error of the mean (SEM), which was calculated using the formula SEM = SD *√(1 − ICC), in which SD is the standard deviation of the values from all participants (82, 83).
The minimum detectable change (MDC) was calculated to establish whether the magnitude of change observed between the 2 measures (separated by 7–8 days) reflected real change and not just measurement error. The MDC at the 95% confidence interval (MDC95) was calculated as SEM × 2−√ × 1.96 (82).
2.3.5 Discriminant validity
Discriminant validity analysis of the BioPMovQ was employed to assess varying degrees of pain-related motor and functional impairment. As a criterion variable, the disability sub-scale from the GCPS was utilised, which gauges the extent of pain interference on daily activities. Scores ranging from 17 to 24 are classified as moderately limiting interference, while those from 25 to 40 indicate severely limiting interference. In this analysis, we will classify the participants into subclinical, moderate, and severe levels of pain-related motor and functional impairment.
The Kruskal-Wallis H test and the Mann–Whitney test were applied to discern differences between the levels of motor and functional impairment linked to pain. Furthermore, the area under the receiver operating characteristic curve was evaluated to determine the proportion of patients accurately classified across different levels. The highest value for this metric is 1, indicating optimal diagnostic utility. Diagnostic accuracy is deemed excellent for values ranging from 0.9 to 1, very good for 0.8 to 0.9, good for 0.7 to 0.8, fair for 0.6 to 0.7, and poor for 0.5 to 0.6. Any value below 0.5 renders the test non-informative (84). The optimal cutoff point between levels of motor and functional impairment associated with pain was determined using the Youden index (85). Additionally, for each score, diagnostic test indicators such as sensitivity, specificity, negative predictive value, and positive predictive value were calculated.
3 Results
3.1 Content validity analysis
In the expert analysis of the content, 2 items were eliminated (“a. Physical activity can be counterproductive for my problem” and “b. Did cardiovascular exercise such as walking or cycling to reduce my pain”) because the score according to Aiken’s V was <0.70, and there were numerous comments questioning the specificity and usefulness of these items.
A total of 25 items were validated, with a range of 0.70–0.95 according to Aiken’s V. All theoretical constructs were validated by the expert committee.
Table 1 shows the Aiken V values for each item, the theoretical constructs and the general comments of the expert committee.
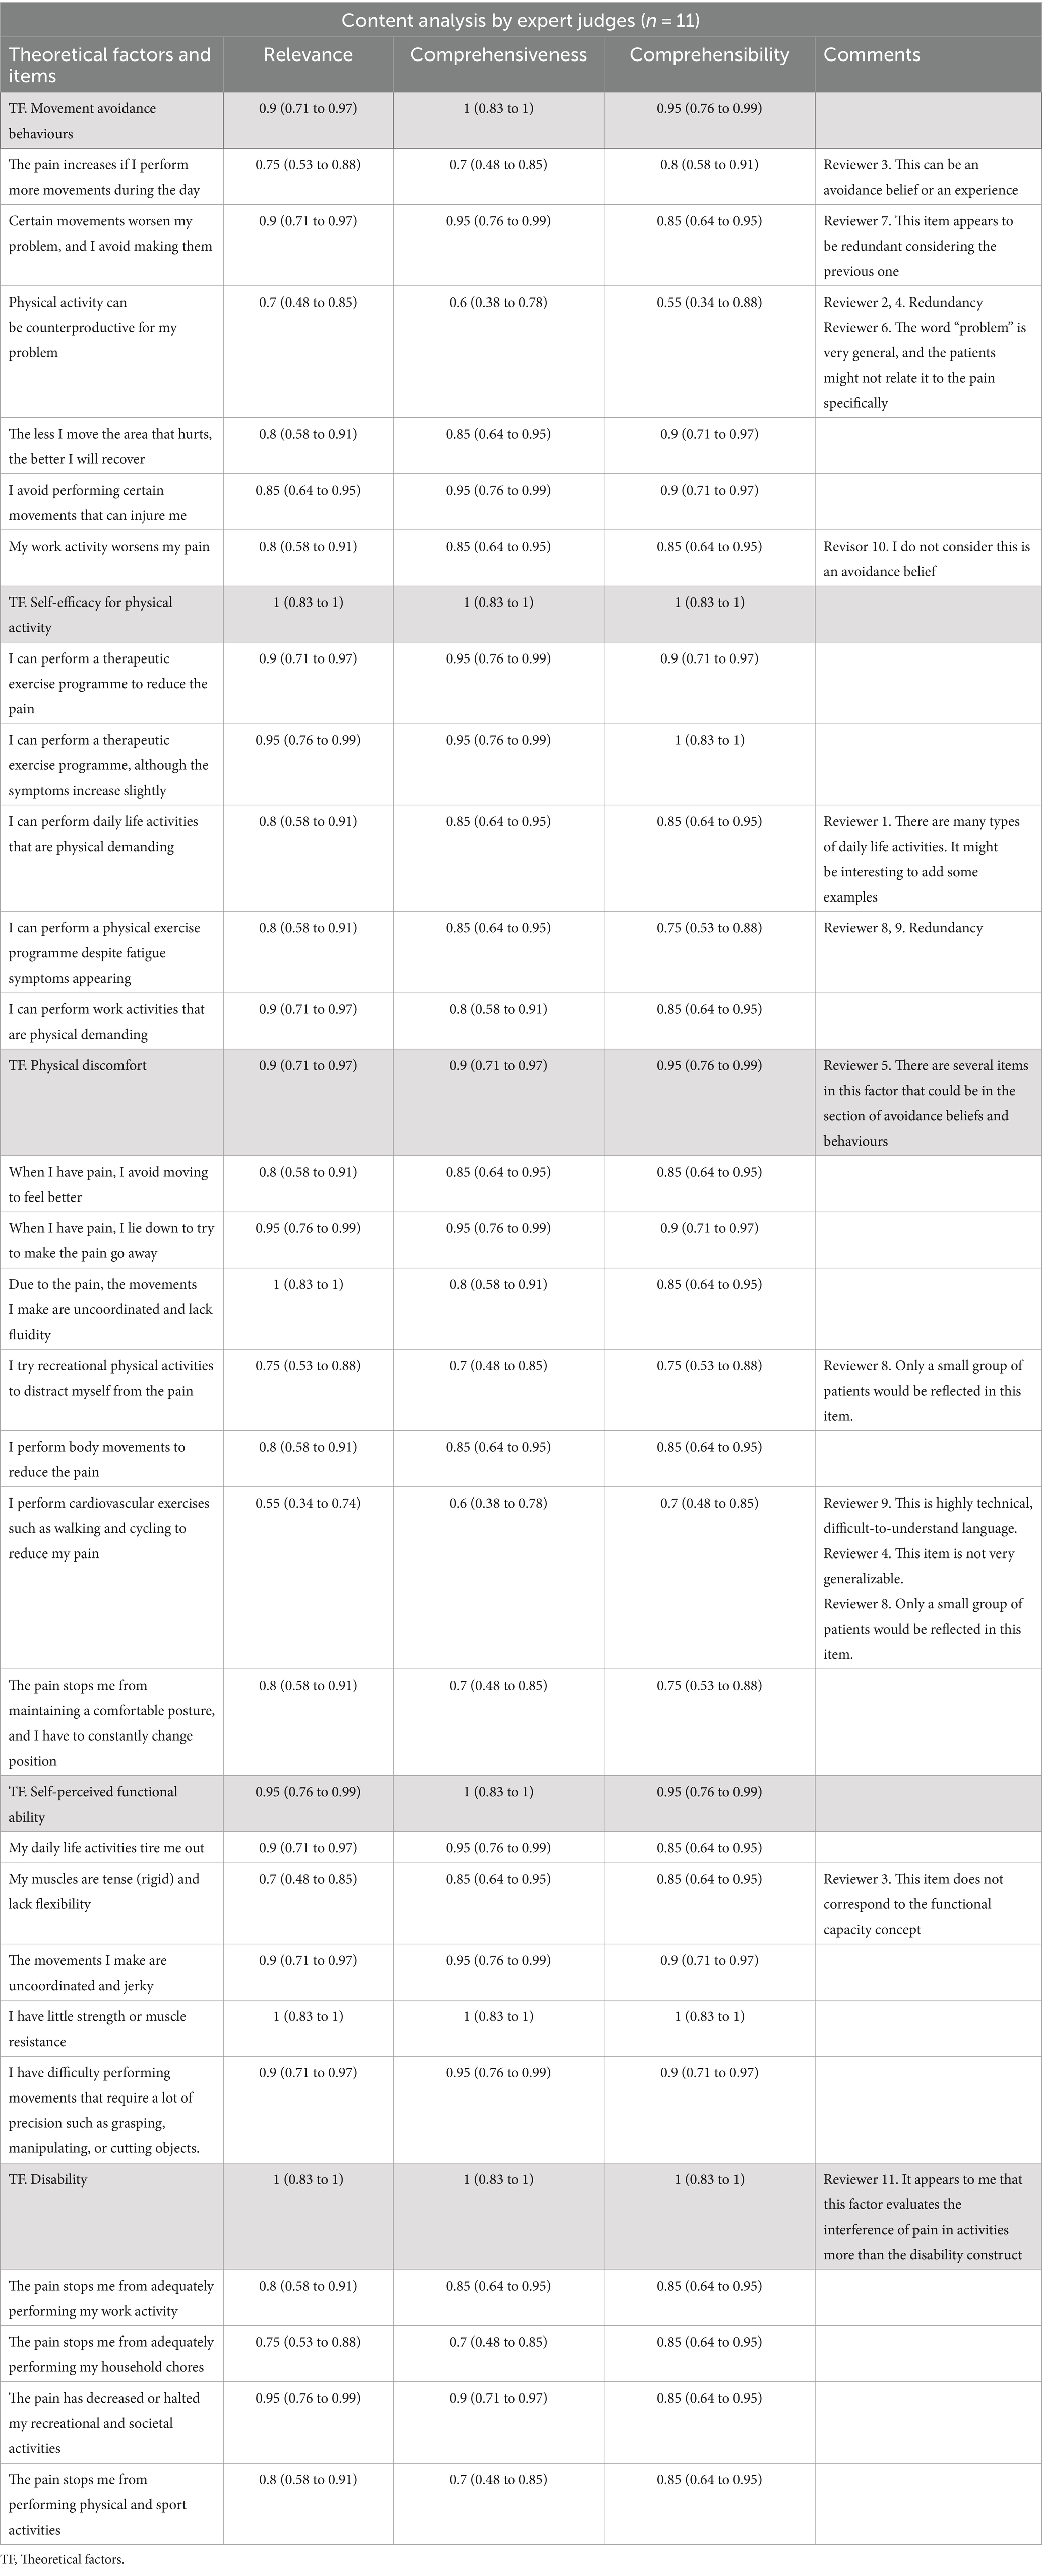
Table 1. Aiken V values for each item, the theoretical constructs and the general comments of the expert committee.
3.2 Characteristics of the sample
The total sample consisted of 200 participants with chronic musculoskeletal pain, 68.6% of whom were women. Table 2 presents the patients’ sociodemographic characteristics and scores on the various self-reported scales. The BioPMovQ data did not follow a normal distribution, but the instrument’s response rate was 100%. In Table 3, the descriptive statistics for each item of the BioPMovQ are presented, along with the ‘if item dropped’ metrics such as Item, Mean, SD, Skewness, Kurtosis, frequencies for 0 to 4, Item-rest correlation, Cronbach’s α, and McDonald’s ω.
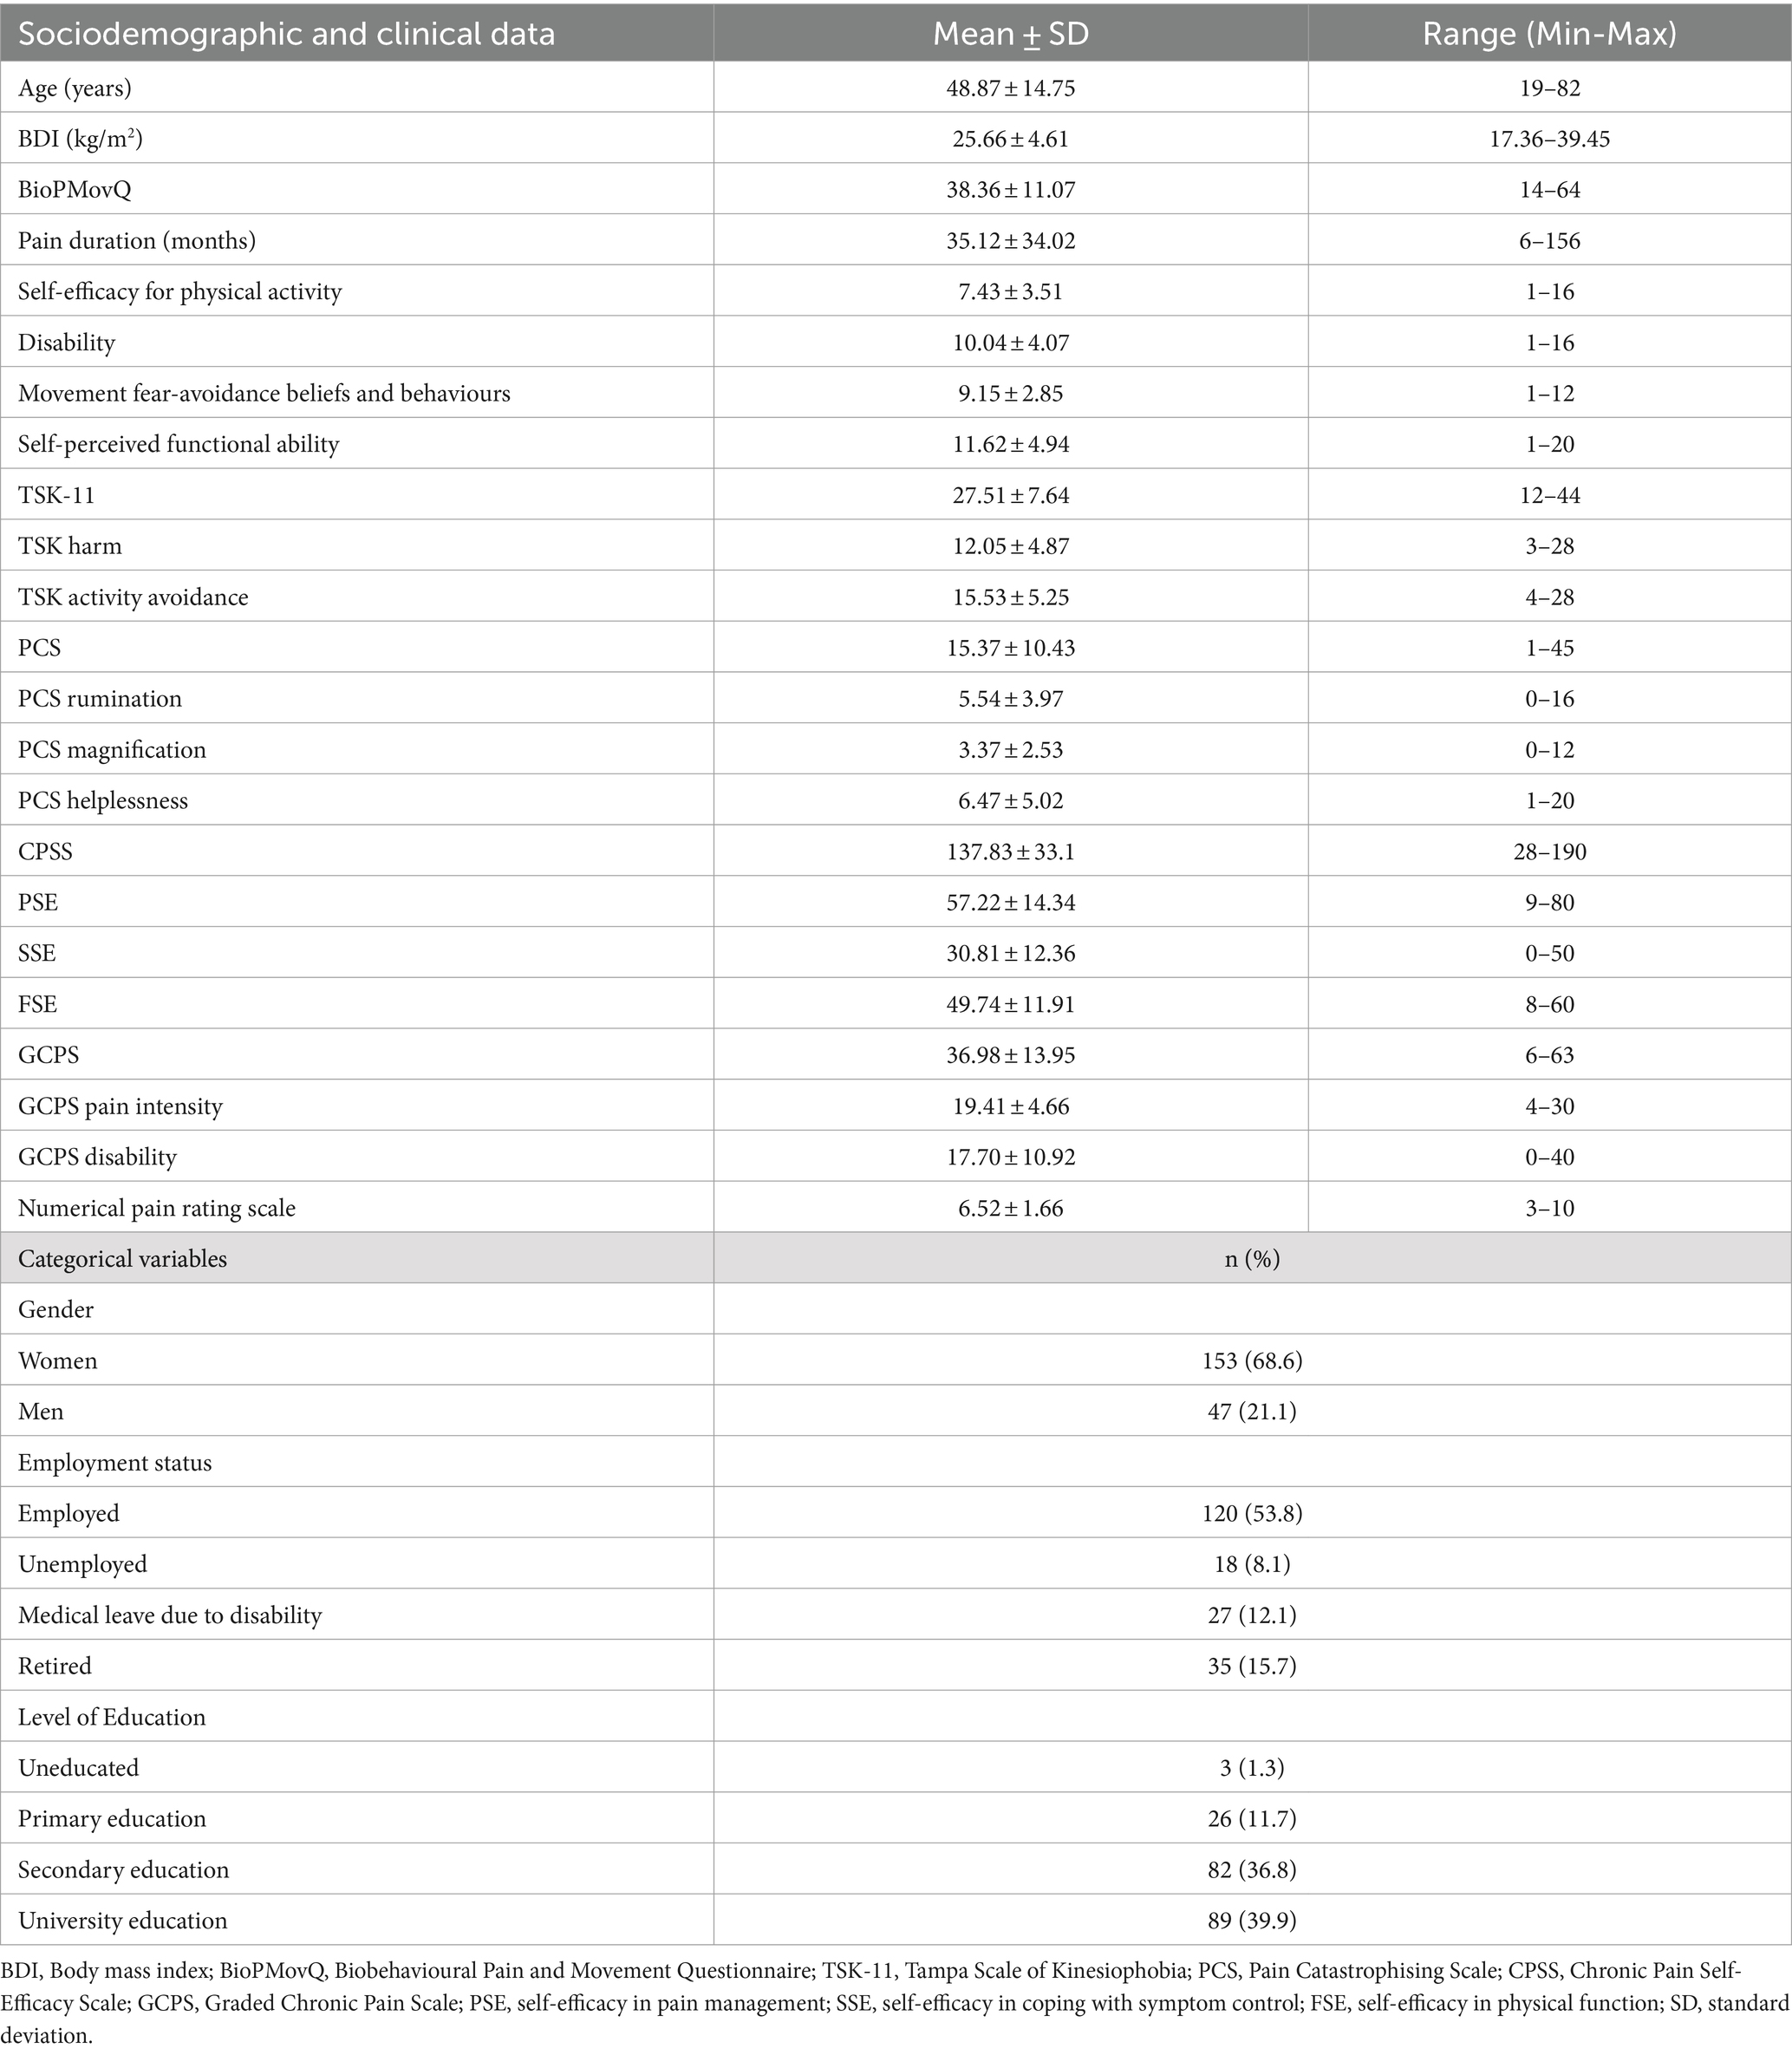
Table 2. Sociodemographic and clinical data and scores obtained on the self-reported scale.
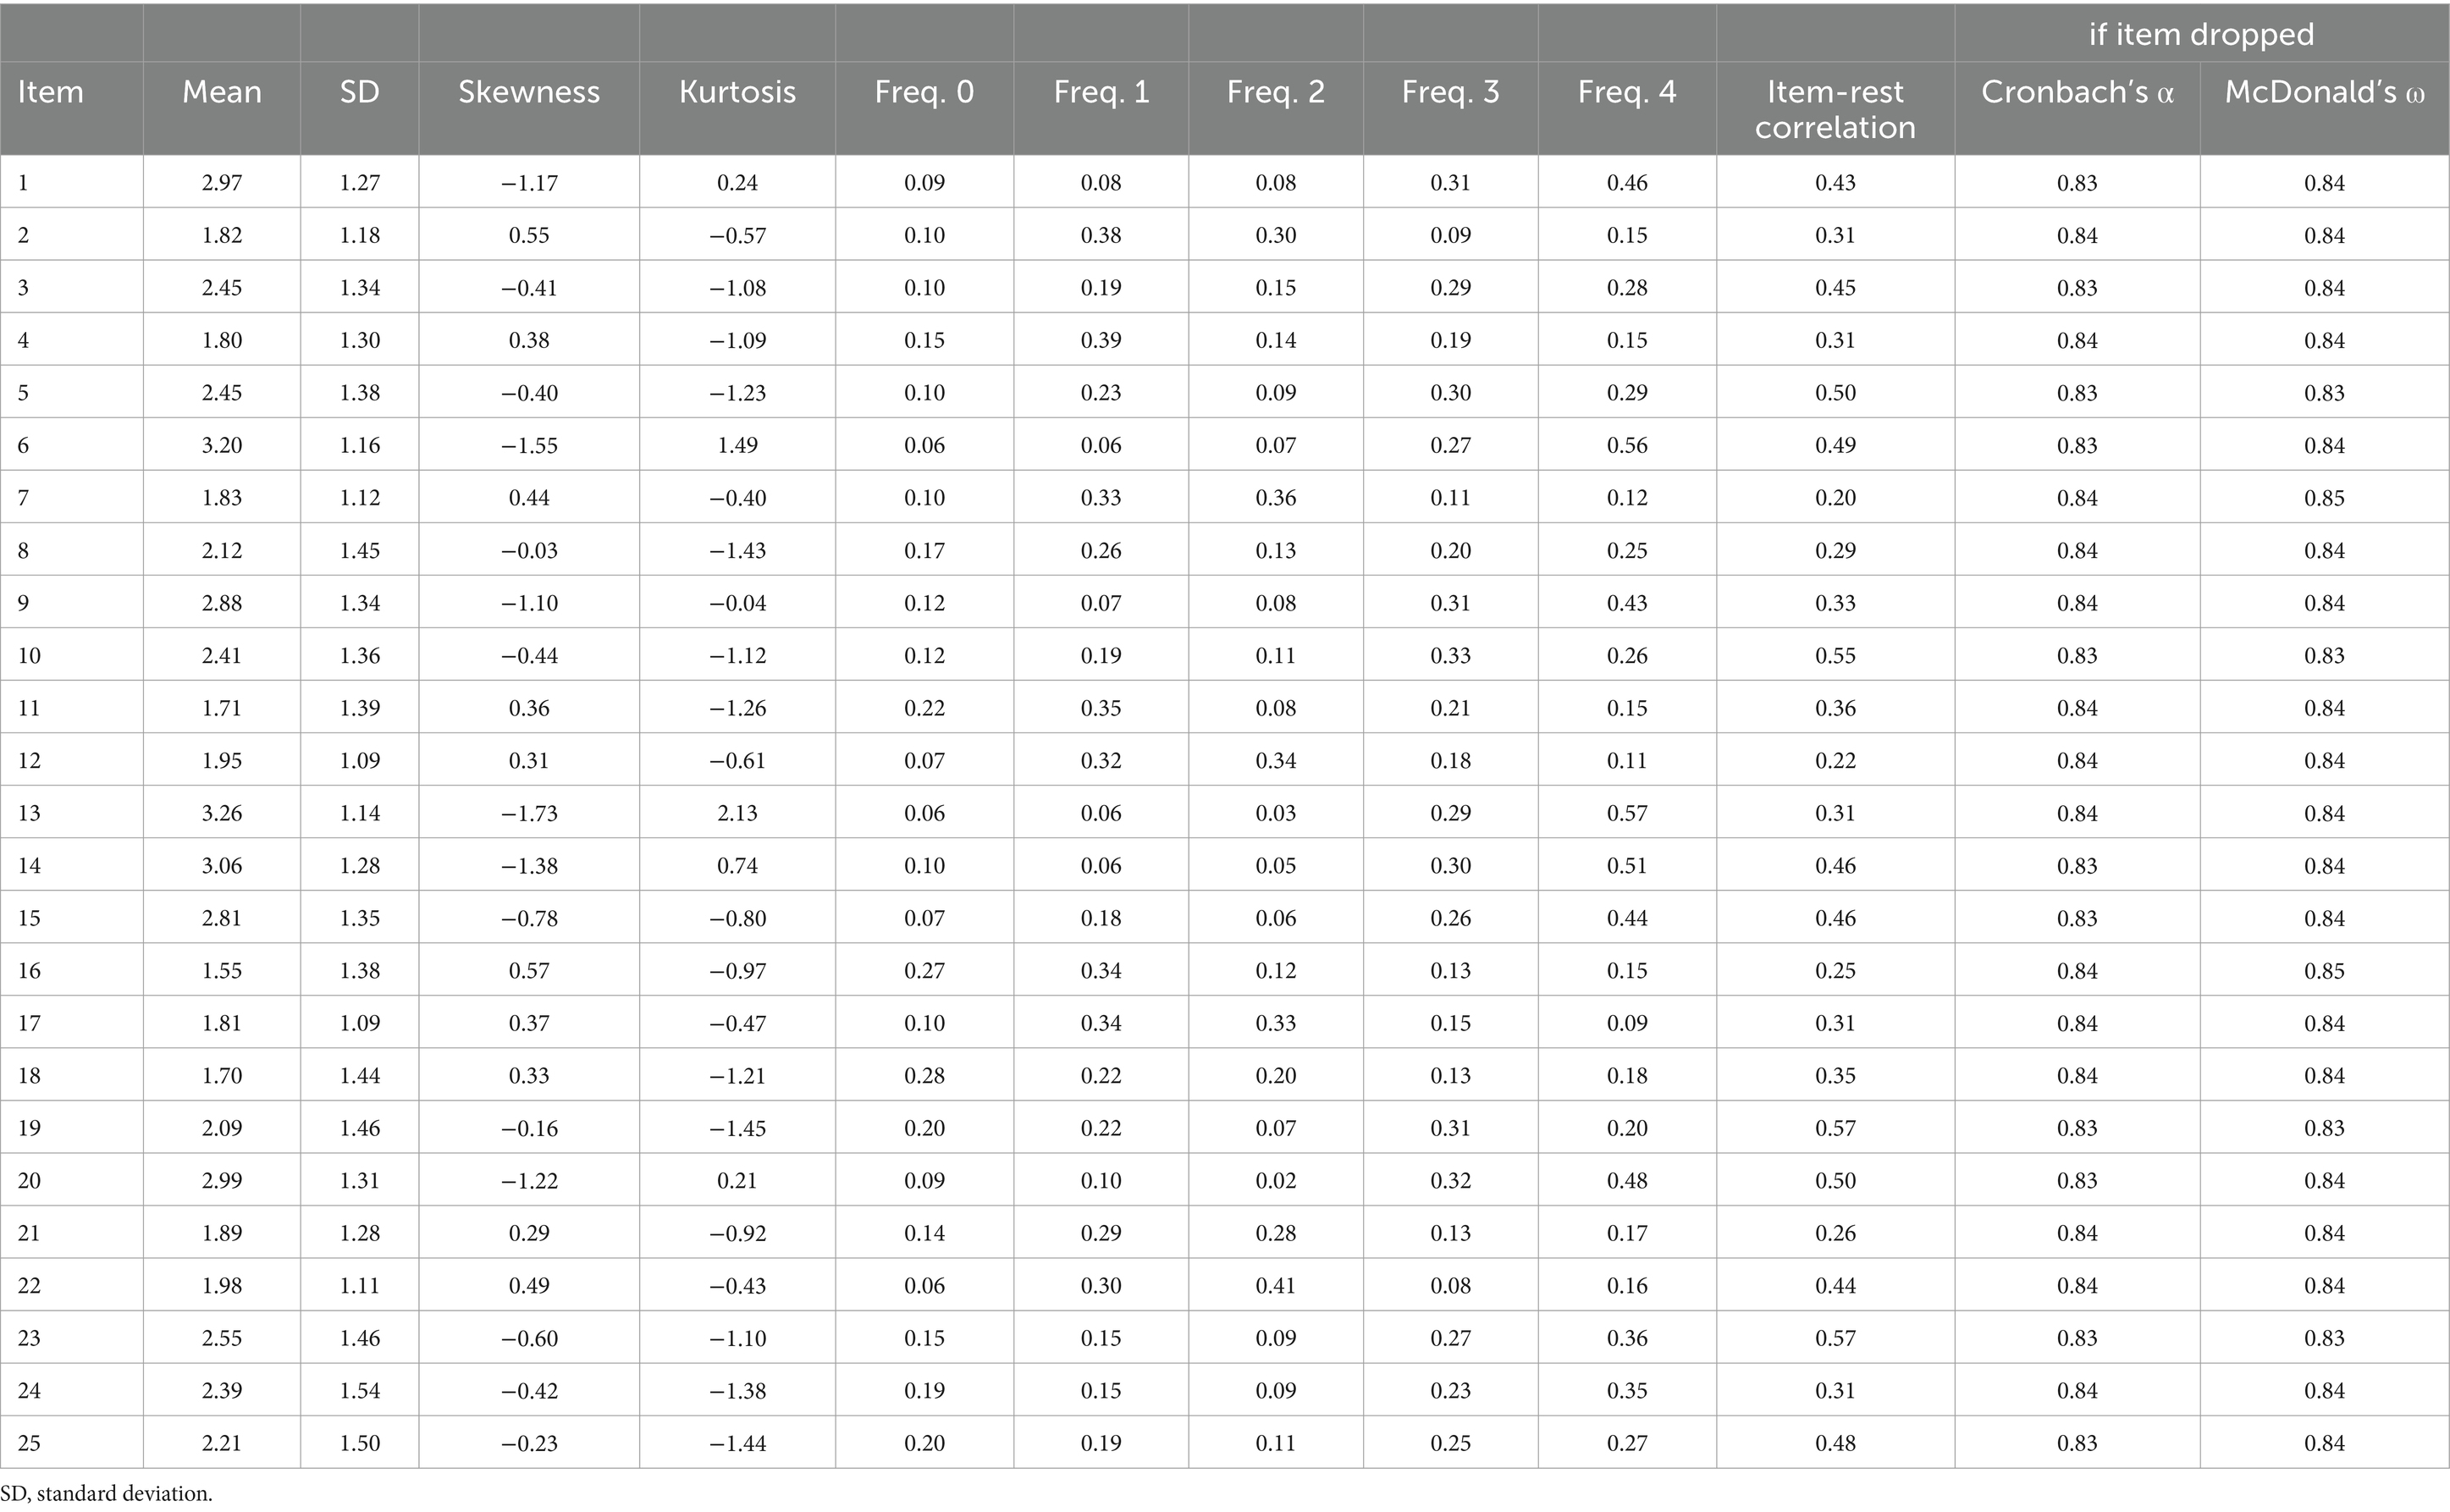
Table 3. Descriptive statistics.
3.3 Exploratory factor analysis
Item statistics are presented in the Table 3. It can be seen how all items contribute to internal consistency and that skewness and kurtosis generally remain below 2. The KMO test showed an acceptable data suite for factor analysis (KMO score of 0.829), there were no multicollinearity problems, and Bartlett’s test of sphericity rejected the identity matrix null hypothesis (χ2 (120) = 869.88, p < 0.001).
Based on these results, continuing with the EFA would be justified. Lastly, we used the generalised least squares method of factor extraction with oblimin rotation. The semi-confirmatory parallel analysis recommended between 3 and 5 factors, although the EGA analysis with 500 bootstrap iterations showed that the most repeated solutions were those with 3 to 5 factors (with proportions of 0.324, 0.376, 0.184, respectively). For theoretical reasons and in order to cover all relevant areas described in developing items section finally present a four-factor solution. The four-factor model of the BioPMovQ exhibited a favourable fit as indicated by the model fit metrics: χ2 (62) = 74.6, p = 0.131; BIC = −254; TLI = 0.967; RMSEA = 0.031 with a 95% confidence interval of 0.001–0.055.
The four-factor solution which together represented 55.79% of the total variance. The first factor (28.85% of the total variance) consisted of 4 items. The theoretical content of this factor was labelled “disability.” The second factor (13.55% of the total variance) consisted of 4 items and referred to self-efficacy for physical activity. The third factor (“movement fear-avoidance beliefs and behaviours”) included 3 items and accounted for 6.84% of the total variance. The fourth factor (“self-perception of functional ability”) presented 4 items and accounted for 6.82% of the total variance. The factor loadings for each item are shown in Table 4. A total of 7 items were eliminated because the factorial weight was <0.40.
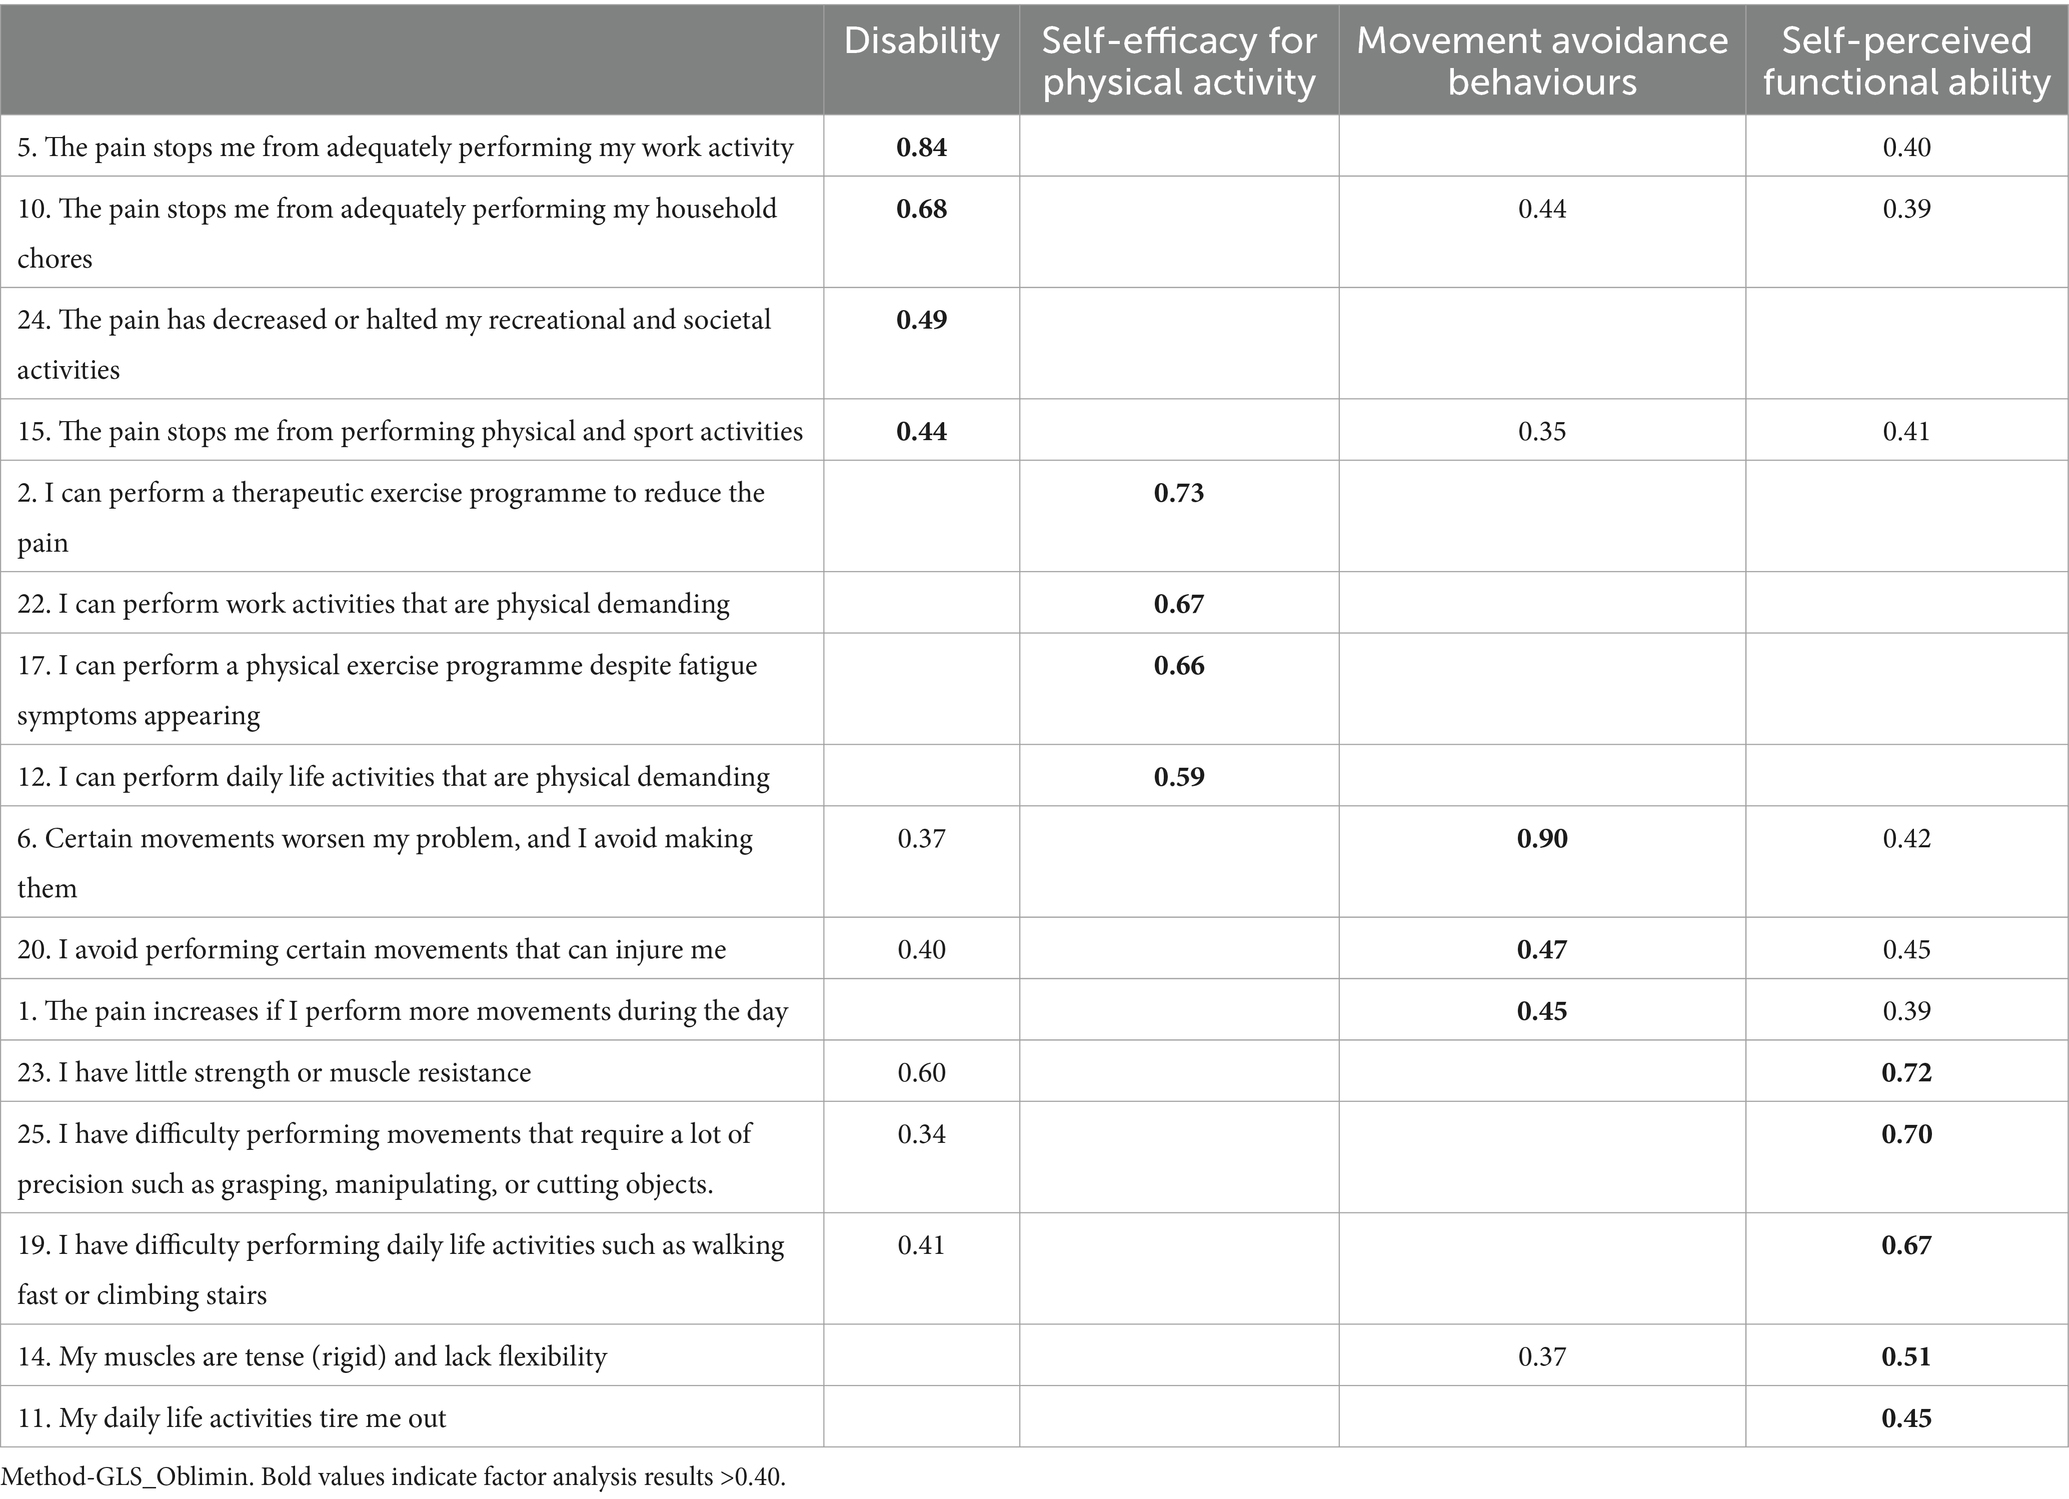
Table 4. Observational factor analysis.
The alternative models analysed do not offer a suitable factorial solution, as their fit metrics are not acceptable. Additionally, several items exhibit factorial weights below 0.40, and the percentage of variance explained by each of these alternative models is significantly lower than that of the proposed factorial solution (Tables 5, 6).
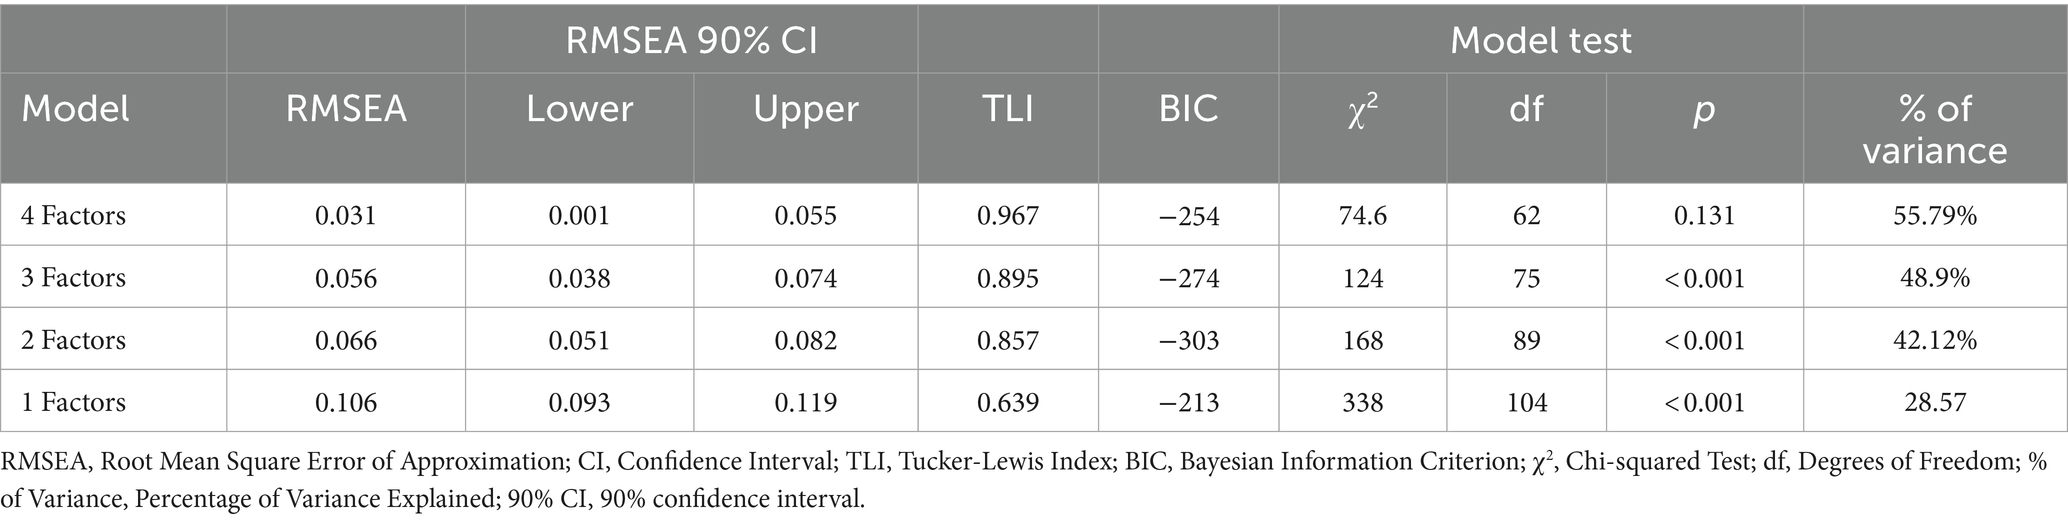
Table 5. Comparations fit measures for factor models.
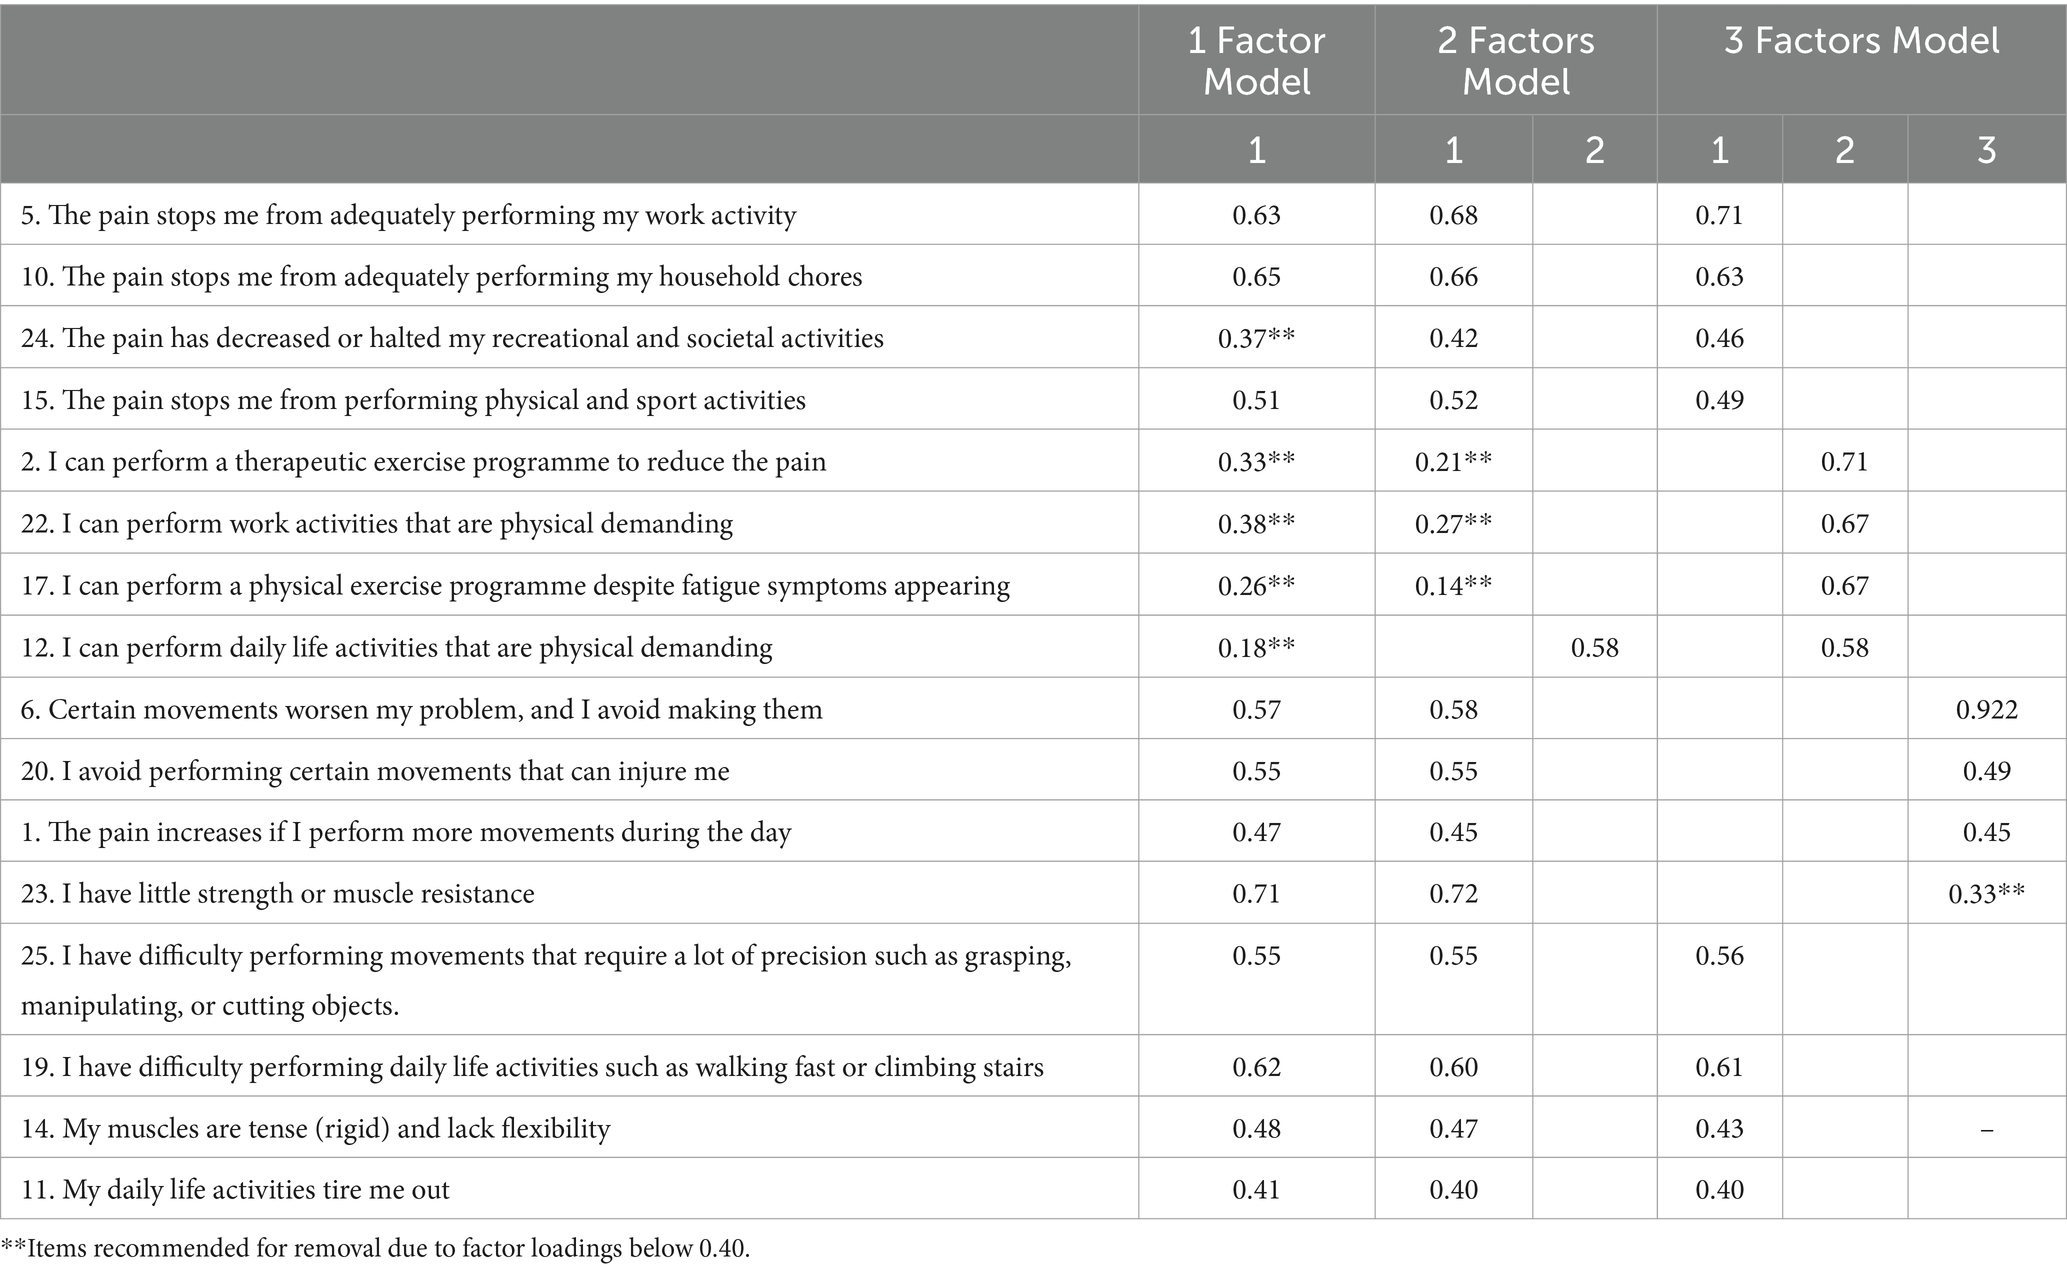
Table 6. Factorial structure using alternative models to the proposed factorial structure.
There was no floor or ceiling effect. Two patients scored 18 points, which is the minimum possible (0.01%), and only 1 patient scored the maximum (0.001%/72 points).
3.4 Concurrent validity
Overall, the BioPMovQ total score presented moderate magnitude correlations with most of the psychological and disability variables. With respect to the BioPMovQ subscales, the correlations were small to moderate in magnitude. Table 7 shows the correlations between the BioPMovQ and its subscales with all the assessed self-reported scales.
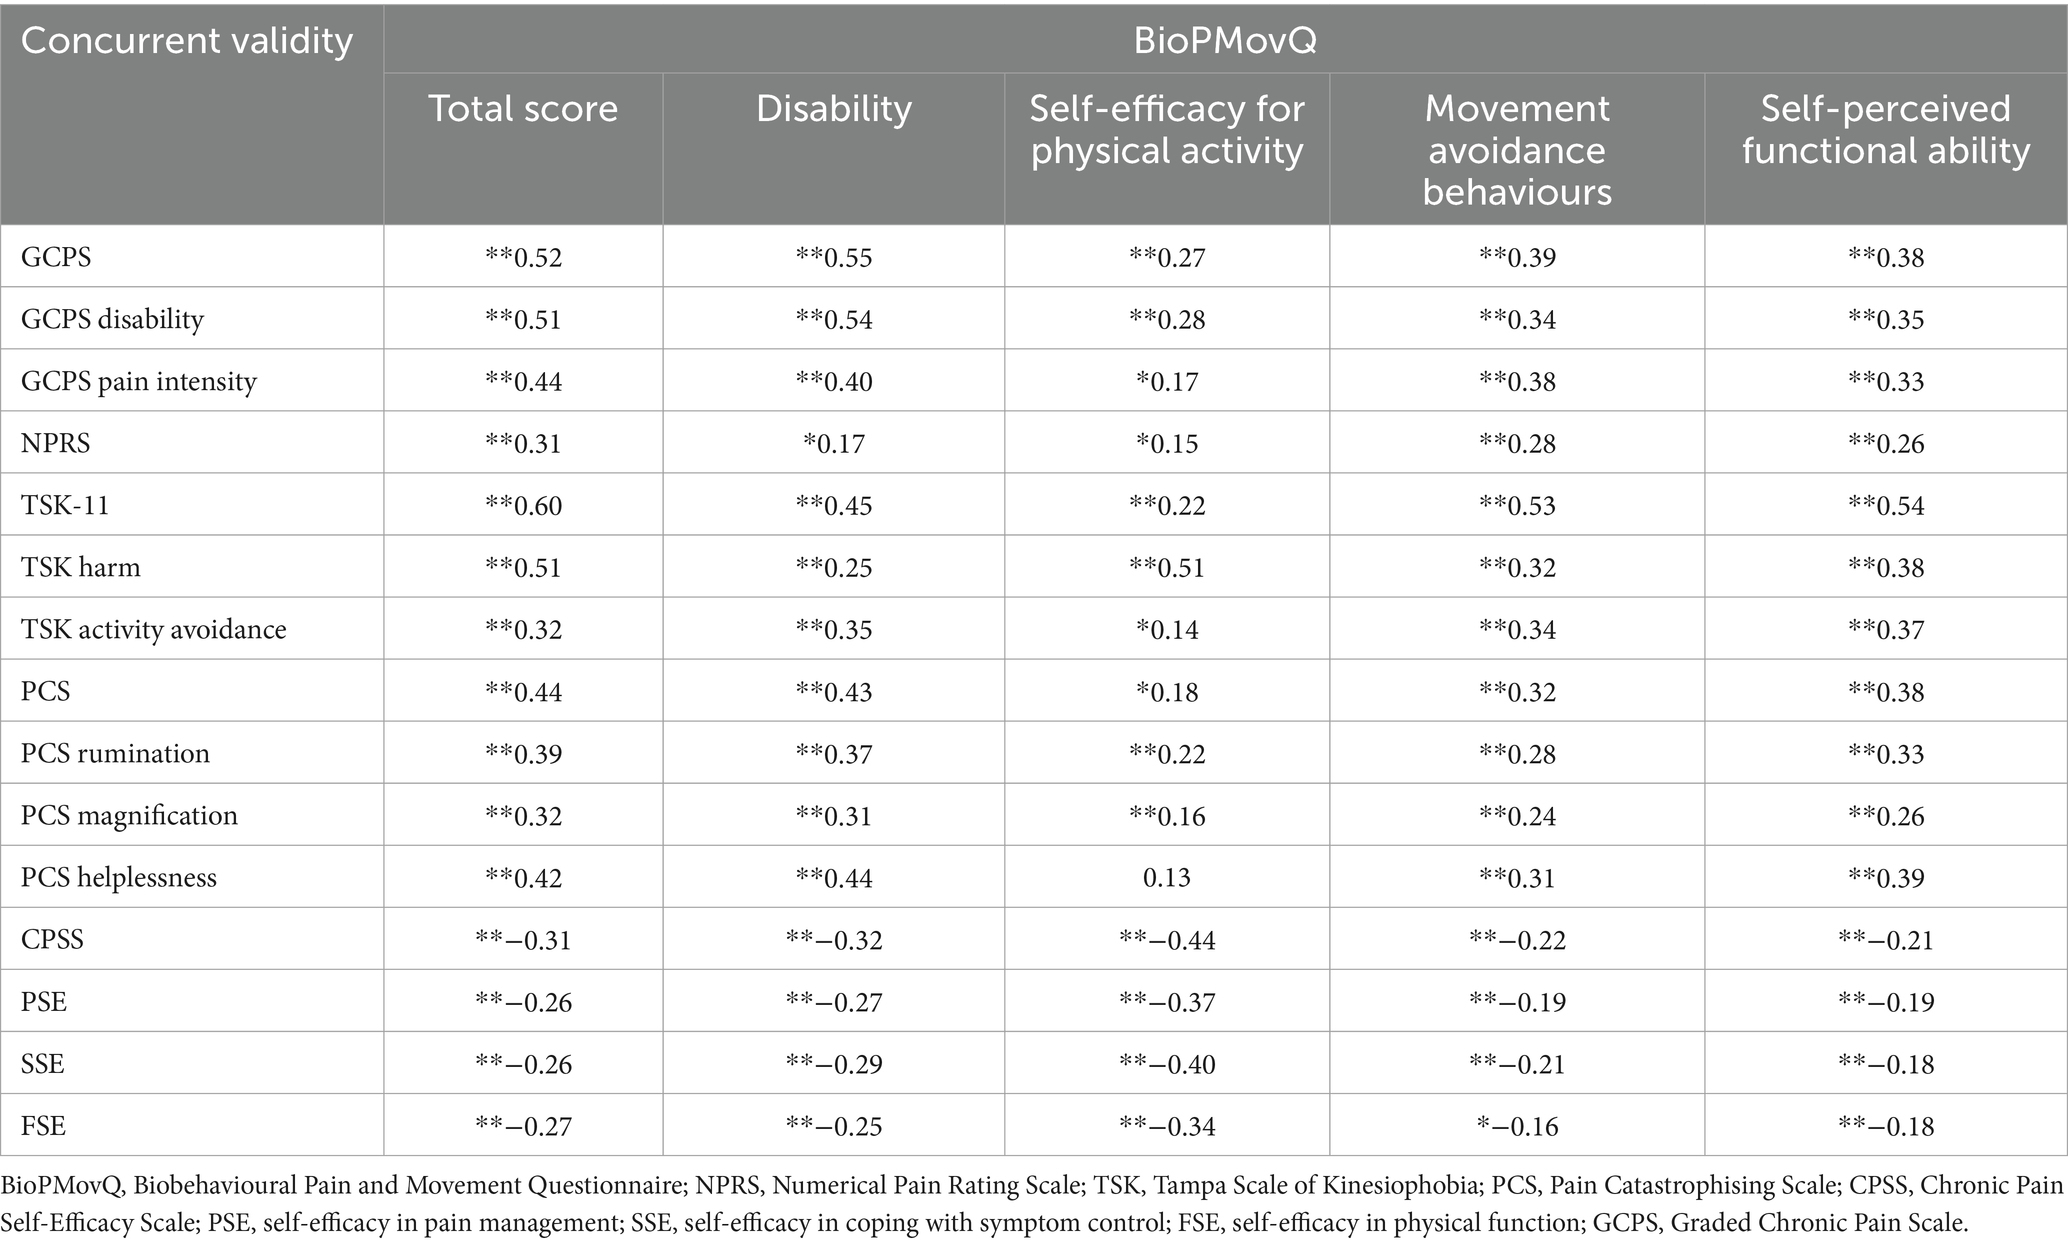
Table 7. Concurrent validity of the BioPMovQ.
3.5 Reliability
The internal consistency of the BioPMovQ was Cronbach’s Alpha = 0.82 and McDonald’s ω = 0.83, with its 4 subscales showing an internal consistency of 0.64–0.75. To assess the instrument’s test–retest reliability, 51 patients (74.5% women; age, 47.74 ± 14.71 years) re-took the scale 10.13 ± 12.52 days later. According to the ICC, the scale’s stability over time was excellent, with an MDC95 of 9.50. Table 8 shows the descriptive statistics and results of the test–retest reliability and responsiveness analysis for the BioPMovQ and its subscales. The highest correlations with the other instruments of the global scale were presented with the GCPS and the TSK-11 and were lower with the NPRS.
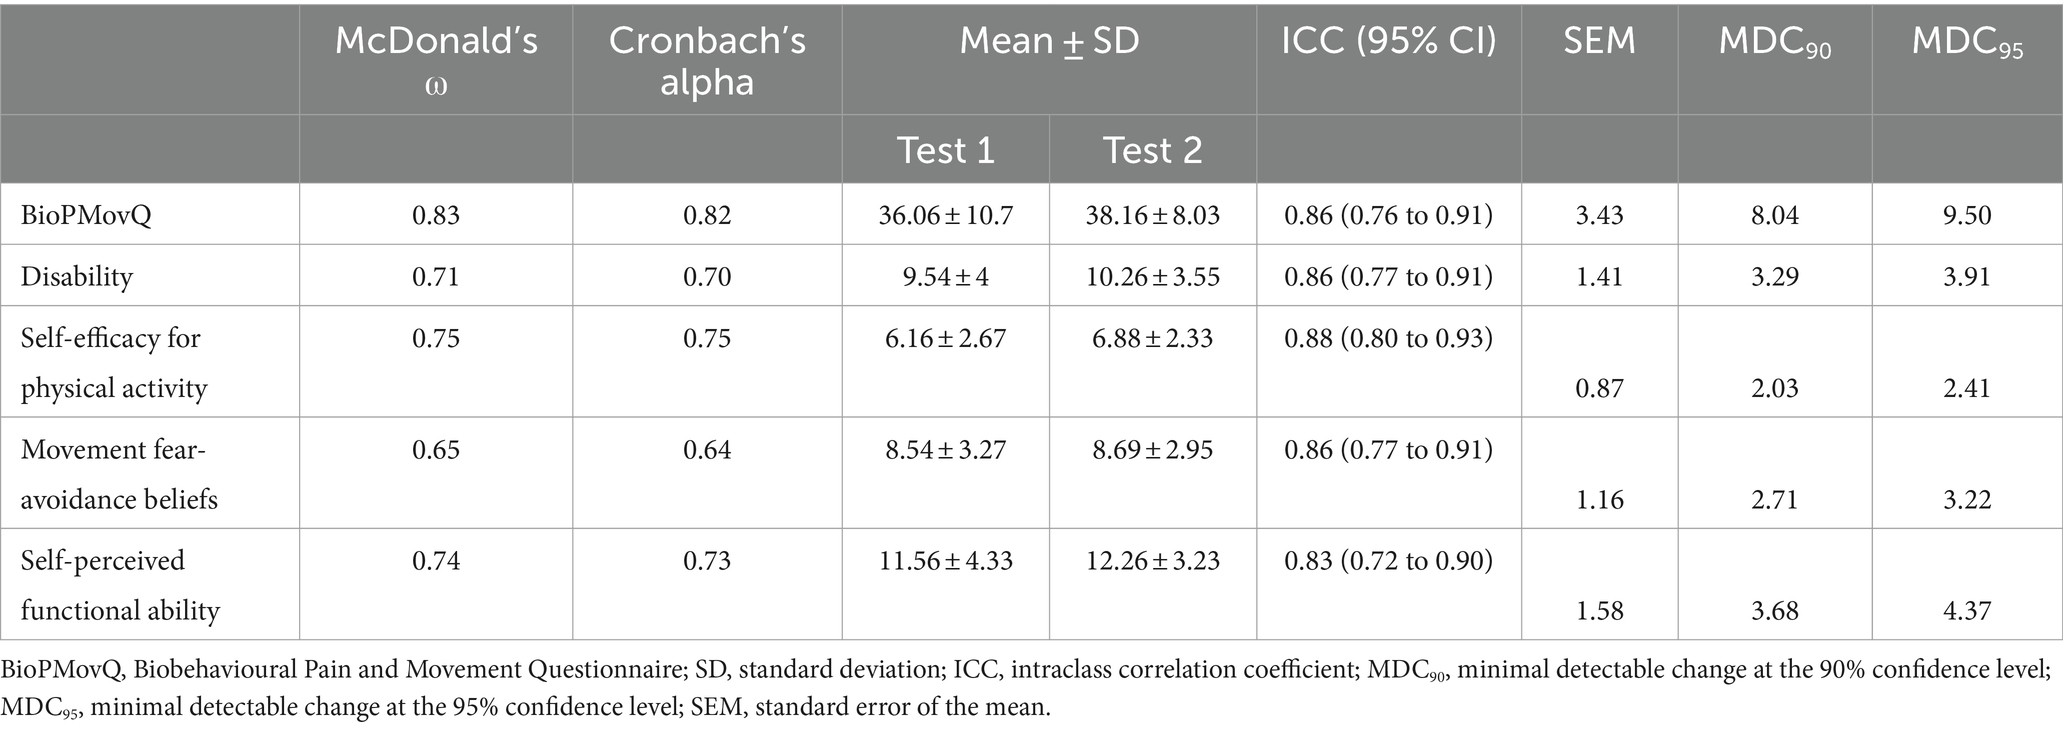
Table 8. Reliability analysis.
3.6 Discriminant validity
Utilizing the Kruskal-Wallis test, significant differences in BioPMovQ were observed among levels of pain-related motor and functional impairment (H = 64.54, p < 0.001). Subsequent Mann–Whitney tests indicated disparities between: (a) individuals subclinical and those with moderate pain-related motor and functional impairment (U = 1340.50, p = 0.003), (b) those subclinical and those with severe pain-related motor and functional impairment (U = 706, p < 0.001), and (c) moderate versus severe levels (U = 803.50, p < 0.001). The rank averages consistently reflected a pattern where the scores increased with the severity of pain-related motor and functional impairment, suggesting a clear distinction in BioPMovQ scores based on the level. In Figure 1, a violin plot representation of the various levels of the BioPMovQ based on pain-related motor and functional impairment can be observed.
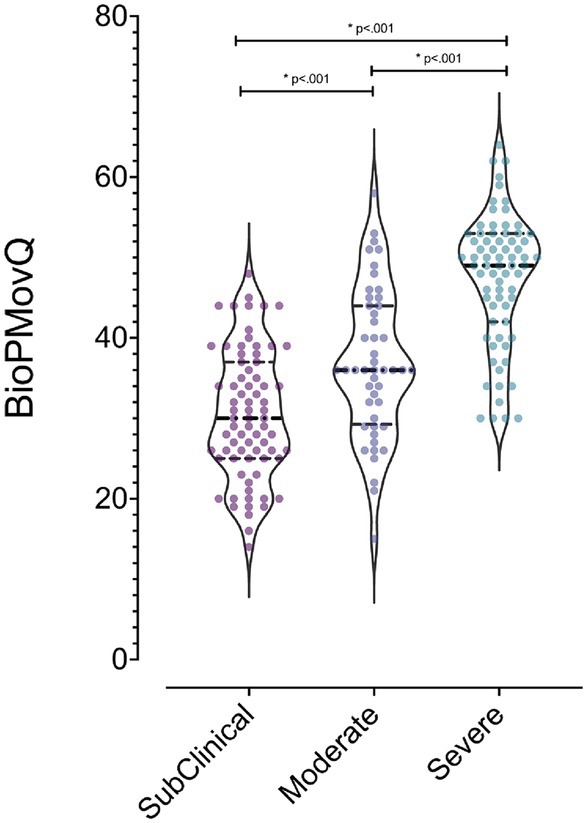
Figure 1. Differences in functional and motor alterations levels related to pain as measured by the BioPMovQ. *Indicates statistical significance (p < .001) and the 95% confidence interval considered for comparisons between variables using the Mann–Whitney U test.
The BioPMovQ demonstrated robust diagnostic precision in discerning patients at the severe level, evidenced by high specificity and sensitivity. In terms of the moderate level, sensitivity was satisfactory, while specificity was commendable. Table 9 delineates the diagnostic precision, including the salient cut-off points. The optimal cutoffs were determined to be <37 for subclinical, ≥37 for moderate, and ≥ 45 for severe levels. For the moderate level, sensitivity was 0.87 with a 95% CI of [0.76–0.84], while specificity stood at 0.59 with a 95% CI of [0.44–0.62]. For the severe level, sensitivity and specificity were 0.72 ([0.61–0.82]) and 0.98 ([0.92–1]), respectively. Figures 2, 3 further elucidate these findings. To determine the optimal cut-off points and conduct sensitivity and specificity analyses, the R package named OptimalCutpoints was used (86).
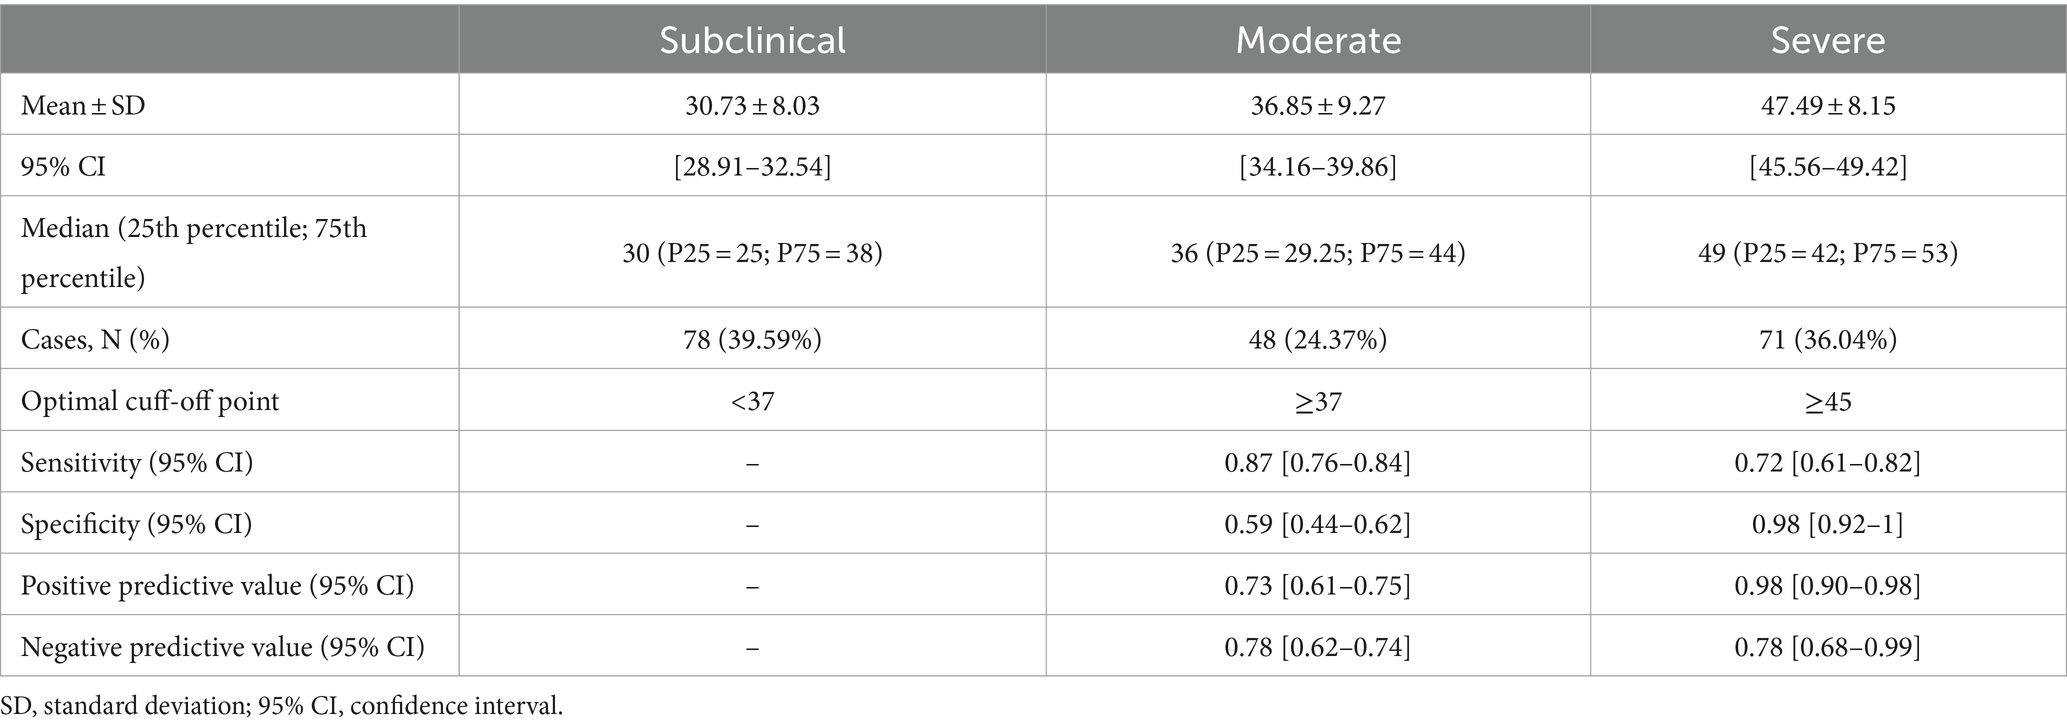
Table 9. Diagnostic accuracy results and all optimal cut-off points of BioPMovQ.
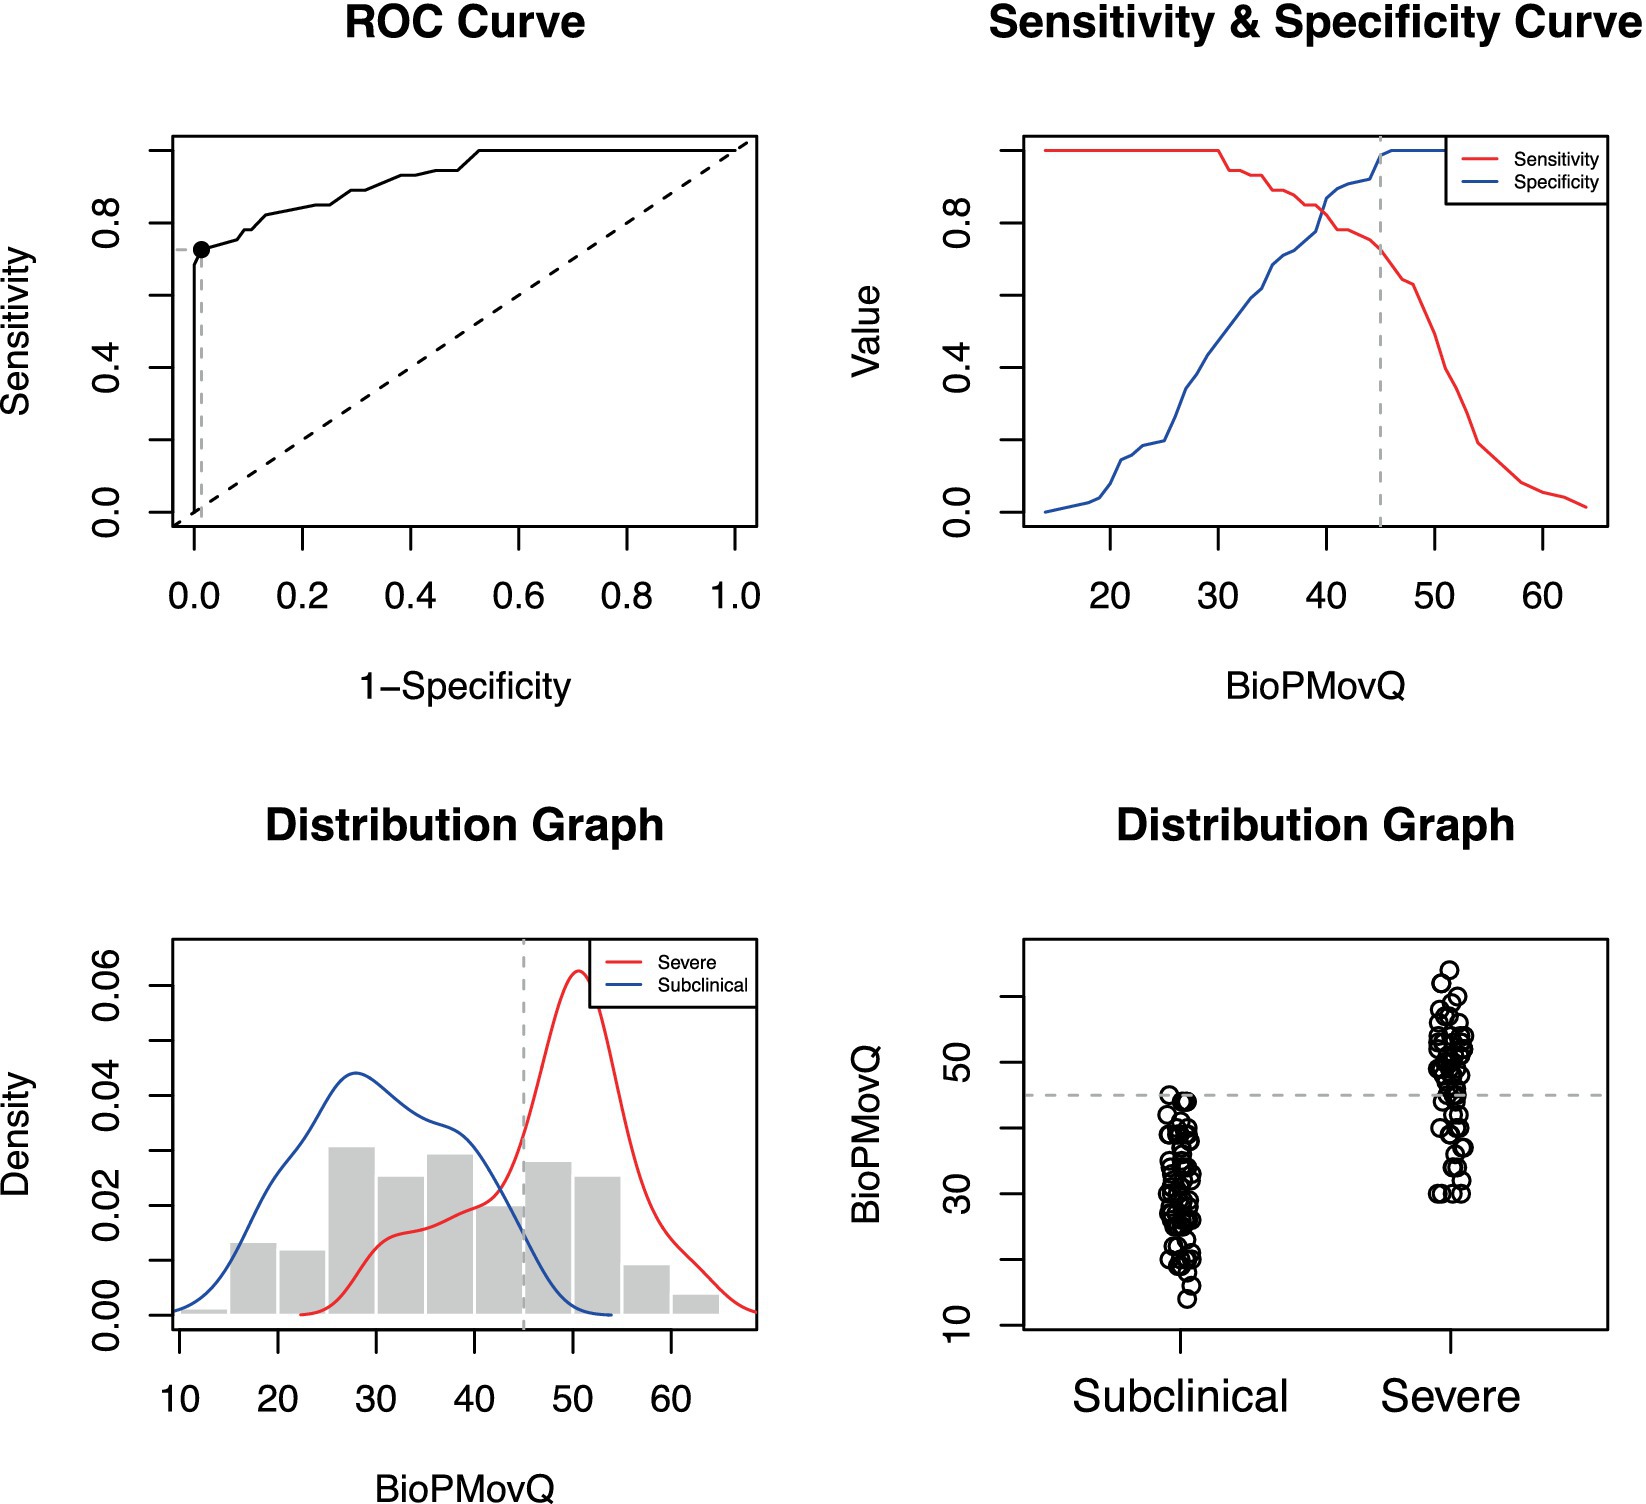
Figure 2. Optimal cut-off point between levels of BioPMovQ (Subclinical vs. Severe). A ROC (receiver operating characteristic) curve that represents the sensitivity of a diagnostic test that produces continuous results, depending on false positives (complementary to specificity), for different cut-off points, the image where the cut-off point at which the highest sensitivity and specificity is achieved and finally, a subclinical and moderate sample distribution graph.
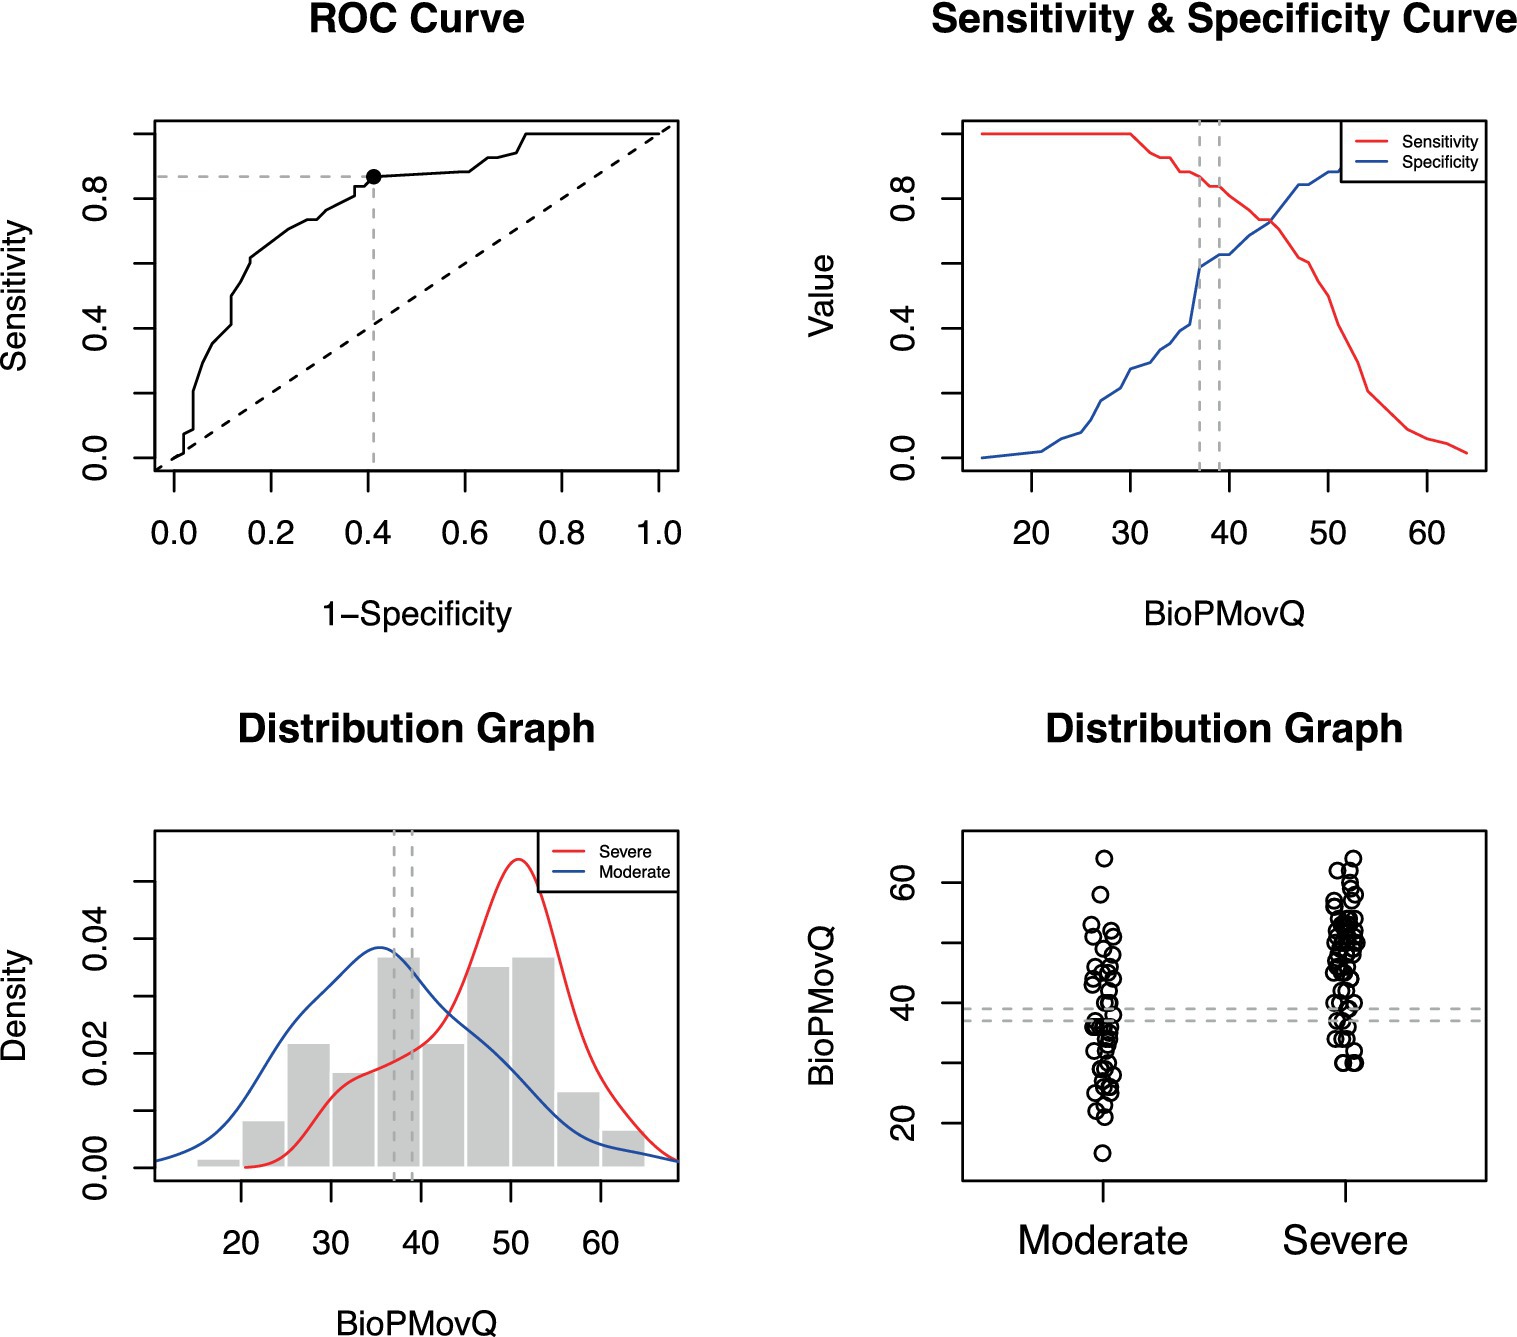
Figure 3. Optimal cut-off point between levels of BioPMovQ (Moderate vs. Severe). A ROC (receiver operating characteristic) curve that represents the sensitivity of a diagnostic test that produces continuous results, depending on false positives (complementary to specificity), for different cut-off points, the image where the cut-off point at which the highest sensitivity and specificity is achieved and finally, a subclinical and moderate sample distribution graph.
4 Discussion
The BioPMovQ is an instrument designed to assess (from a biobehavioural perspective) pain related to functional and motor impairments in patients with musculoskeletal pain. This study provides evidence on the psychometric properties of the BioPMovQ, including its content validity, factor analysis, internal consistency, test–retest reliability and concurrent validity, which suggest that this instrument meets the recommended minimum standards for patient-centered measures proposed by the International Society for Quality of Life Research (87). Overall, the findings of this research show that the BioPMovQ has adequate psychometric properties, showing good validity and reliability for the assessment of the designed construct.
The results of the study indicate that the BioPMovQ has good content validity as assessed by experts, indicating that the questions in the questionnaire have adequate relevance, completeness and comprehensibility and are suitable for measuring the construct of pain related to functional and motor impairments from a biobehavioural perspective in the population with musculoskeletal pain. The BioPMovQ also met the criteria proposed by Patrick et al. (88) for determining good content validity: a correct qualitative phase of instrument development and construction and evidence that identifies adequate understanding of the instrument (88). In the content analysis phase, the experts validated 5 theoretical sub-constructs of the initial instrument; in the exploratory factor analysis, they obtained a 4-factor solution that together accounted for 55.79% of the total variance. The values obtained in the KMO index indicate that the instrument has a good level of multicollinearity between items (89). Each of the subscales had 3–5 items, as recommended by a number of authors (89). The factor loadings of 17 of the 18 items were ≥ 0.44, which are considered strong (74), increasing the solidity of the obtained factor structure. Another positive aspect is that a 5-point Likert scale was employed, which is a good option when the data follow a normal distribution, as in our case (67).
Lastly, the following 4 factors or subscales were included: disability; self-efficacy for physical activity; movement avoidance behaviours; self-perceived functional ability. For 2 of the factors, however, the initial theoretical name had to be redefined, possibly because 7 items were eliminated during the exploratory factor analysis, and 3 items were distributed differently from the initial theoretical assumption.
The BioPMovQ has been designed and constructed from a biobehavioural perspective, which implies that the biological, psychological (affective, cognitive) and social aspects are interrelated (90), thereby providing a broader view in understanding the impact of pain on movement and function in patients with chronic musculoskeletal pain. It makes sense to employ global scoring for decision making using the biobehavioural paradigm.
With its various subscales, the BioPMovQ provides an innovative and comprehensive clinical assessment, with 4 measured factors that can be considered determinants for the functional approach to patients with chronic pain, for which other instruments are not currently integrated into a single construct. The physical activity self-efficacy subscale assesses the patient’s confidence in their ability to perform physical activities despite pain. The disability subscale assesses the impact of pain on the performance of work and daily living activities. The movement avoidance behaviour subscale assesses the individual’s tendency to avoid certain activities due to pain. The self-perceived functional ability subscale assesses the individual’s ability to perform specific tasks related to physical exertion.
Findings related to concurrent validity show that the BioPMovQ presents low/moderate correlations with instruments measuring chronic pain self-efficacy, pain catastrophising, pain intensity, disability and kinesiophobia, the latter 2 correlations being the highest recorded (r = 0.52 and r = 0.60, respectively). These results describe possible relationships with other constructs but also demonstrate that the BioPMovQ and its subscales measure different aspects and rule out the possibility that the instrument is repetitive or redundant with respect to other instruments. The internal consistency of the BioPMovQ was good (Cronbach’s α = 0.82; McDonald’s ω = 0.83); that of most of the subscales was also acceptable (Cronbach’s α, >0.70), except for the subscale of avoidance motor behaviours (Cronbach’s α, 0.64), which were poor. This subscale includes only 3 items was the shortest subscale and that could have affected internal consistency.
The test–retest reliability of the BioPMovQ was good (ICC of 0.86), as were those of all the subscales (ICC > 0.83). A mean of separation of 10.13 ± 12.52 days between the 2 measurements was employed to prevent patients from recalling their previous responses and avoid strong fluctuations in their clinical status. This period was adequate, considering that a period of 2–14 days between measurements is considered acceptable for assessing test–retest reliability (91). Considering the BioPMovQ’s total score, the SEM and the MDC90 presented relatively low values (3.43 and 8.04, respectively), a relevant aspect given that the purpose of the MDC is to detect real changes that are outside the measurement error (92), with smaller results indirectly indicating that the measure is stable in repeated measurements over time.
As for the floor/ceiling effect, only 2 patients (0.01%) obtained the minimum score, while 1 patient (0.001%) obtained the maximum score, which indicates an absence of the floor/ceiling effect (75). The 100% BioPMovQ response rate could have been due to several reasons, including the rigorous process employed for developing the items and the adequate understanding demonstrated in the pilot test with patients. Another factor to consider is the instrument’s brevity. Other authors have reported an association between the questionnaire’s high response rate and length, given that longer questionnaires have lower response rates (93).
4.1 Clinical implications
The introduction of the BioPMovQ represents a significant advancement in the assessment and management of chronic musculoskeletal pain from a biobehavioural perspective. This psychometrically validated tool offers a comprehensive approach to understanding how pain impacts patient functionality and motor behaviour, acknowledging the interplay of biological, psychological, and social factors.
To our knowledge, this is the first instrument developed and psychometrically validated to assess the construct of pain related to functional and motor impairment from a biobehavioural perspective, integrating 4 subscales, 3 of which (self-efficacy for physical activity, disability, movement avoidance behaviours) already have instruments assessing similar constructs. Self-perceived functional ability have not however been sufficiently reported in the literature on chronic musculoskeletal pain, highlighting one the major advantages of the BioPMovQ: the integration of several sub-constructs into a short questionnaire, an important advantage for its clinical use in patients with chronic musculoskeletal pain, given its a broad view of pain-related functional and motor impairments. In certain contexts, the use of multiple questionnaires can be a limitation; as Vickers suggests, this can lead to excessive patient drop-out, undue burden of data management and difficulties with interpreting the results (94). In the context of musculoskeletal pain research and clinical implications, the BioPMovQ could be a solution to the overuse of self-registration.
One of the key contributions of the BioPMovQ to clinical practice is its ability to facilitate a more personalised approach to treating musculoskeletal pain. By assessing various dimensions related to pain and its influence on motor behaviour, clinicians can identify specific therapeutic targets for each patient, such as improving self-efficacy for physical activity, reducing movement avoidance behaviours, and enhancing perceived functional capacity. This customization of care aims not only to optimise therapeutic outcomes but also to improve the quality of life for patients.
Furthermore, the BioPMovQ holds potential as a valuable tool in future research on musculoskeletal pain. Its application in longitudinal studies could provide new insights into how specific therapeutic interventions, such as exercise programs or psychosocial coping strategies, affect the experience of pain and its functional consequences over time. Additionally, it could facilitate the exploration of the dynamics between biological and behavioural components of pain, paving the way for more effective biobehavioural interventions.
Another relevant clinical implication of the BioPMovQ lies in its capacity to serve as a means of communication among different healthcare professionals involved in the management of musculoskeletal pain. By providing a common language to describe the complexity of pain and its effects on mobility and functionality, it enables more effective interdisciplinary collaboration, essential for comprehensive therapeutic approaches.
4.2 Limitations and future studies
Although the BioPMovQ has demonstrated promising psychometric properties, we acknowledge several limitations that underline the need for future research. First, the current study focused on a population with chronic musculoskeletal pain. It is essential to replicate these findings in populations with acute pain conditions and across cultural contexts to validate the instrument’s universality.
Secondly, while exploratory factor analysis provided a solid factorial structure for the BioPMovQ, confirmation of this structure through confirmatory factor analysis in independent samples is crucial. This step will not only reinforce the construct validity of the instrument but also its applicability across different populations and contexts.
Furthermore, item response analysis (IRT) offers an opportunity to examine the utility of each item across the construct measurement spectrum. This approach could provide valuable insights into the BioPMovQ’s sensitivity to clinically meaningful changes, helping to further refine the instrument to capture crucial aspects of pain and movement from a biobehavioural perspective.
An exhaustive evaluation of the DIF and the measurement invariance of the instrument through variables such as sex remains to be done. On a tentative basis, we ran the Mantel–Haenszel procedure with purification and found that items 14, 17 and 25 appeared to be marked with DIF. It is important to verify this result in a larger sample and better balanced by sex.
A particular area of interest is the exploration of individual and group differences in responses to the BioPMovQ. Investigating measurement invariance across demographic groups, such as gender, age, and pain type, will determine if the instrument consistently interprets across diverse groups, ensuring its fairness and accuracy in measurement across different populations.
Finally, longitudinal studies employing the BioPMovQ to assess the efficacy of specific interventions, such as therapeutic exercise programs or psychosocial interventions, could provide additional evidence on the instrument’s sensitivity to changes over time. This is essential for confirming the BioPMovQ’s utility in monitoring treatment progress and assessing outcomes in patients with musculoskeletal pain.
5 Conclusion
This study provides evidence for the psychometric properties of the BioPMovQ. The fact that it showed good content validity, internal consistency and test–retest reliability suggests that it is a reliable and accurate instrument for assessing the relationship between pain and functional impairements and movement. In addition, the identification of 4 subscales provides a more detailed and accurate assessment tool for health professionals involved in the care of patients with chronic musculoskeletal pain. We consider the BioPMovQ to be an instrument that can be used in future clinical research.
Data availability statement
The raw data supporting the conclusions of this article will be made available by the authors, without undue reservation.
Ethics statement
The studies involving humans were approved by Centro Superior de Estudios Universitarios La Salle. The studies were conducted in accordance with the local legislation and institutional requirements. The participants provided their written informed consent to participate in this study.
Author contributions
RT: Conceptualization, Formal analysis, Investigation, Methodology, Writing – original draft, Writing – review & editing. AP-A: Writing – review & editing. JP-M: Formal analysis, Investigation, Methodology, Writing – review & editing. DM-M: Investigation, Writing – review & editing. FM-R: Writing – review & editing. IR-D: Writing – review & editing. MS: Formal analysis, Writing – review & editing. MG-A: Investigation, Writing – original draft, Writing – review & editing.
Funding
The author(s) declare financial support was received for the research, authorship, and/or publication of this article. This publication has been possible thanks to a research grant received from the Colegio Professional de Fisioterapeutas de la Comunidad de Madrid, Spain (Grant No. II PI2021/04).
Acknowledgments
The author would like to express appreciation to everyone who had contributed to the study.
Conflict of interest
The authors declare that the research was conducted in the absence of any commercial or financial relationships that could be construed as a potential conflict of interest.
The reviewer CC-L declared a shared affiliation with the author AP-A to the handling editor at the time of review.
The author(s) declared that they were an editorial board member of Frontiers, at the time of submission. This had no impact on the peer review process and the final decision.
Publisher’s note
All claims expressed in this article are solely those of the authors and do not necessarily represent those of their affiliated organizations, or those of the publisher, the editors and the reviewers. Any product that may be evaluated in this article, or claim that may be made by its manufacturer, is not guaranteed or endorsed by the publisher.
References
1. La Touche, R . Introduciendo la dimensión motora dentro de la conceptualización de la experiencia del dolor. J MOVE Therapeutic Sci. (2021) 3:269–77. doi: 10.37382/JOMTS.V3I1.474
2. Simmonds, MJ, Moseley, GL, and Vlaeyen, JWS. Pain, mind, and movement: an expanded, updated, and integrated conceptualization. Clin J Pain. (2008) 24:279–80. doi: 10.1097/AJP.0b013e31815b607e
3. Campbell, P, Bishop, A, Dunn, KM, Main, CJ, Thomas, E, and Foster, NE. Conceptual overlap of psychological constructs in low back pain. Pain. (2013) 154:1783–91. doi: 10.1016/j.pain.2013.05.035
4. Maihöfner, C, Baron, R, DeCol, R, Binder, A, Birklein, F, Deuschl, G, et al. The motor system shows adaptive changes in complex regional pain syndrome. Brain. (2007) 130:2671–87. doi: 10.1093/brain/awm131
5. Vallence, A-M, Smith, A, Tabor, A, Rolan, PE, and Ridding, MC. Chronic tension-type headache is associated with impaired motor learning. Cephalalgia. (2013) 33:1048–54. doi: 10.1177/0333102413483932
6. Holmes, S, Kim, A, and Borsook, D. The brain and behavioral correlates of motor-related analgesia (MRA). Neurobiol Dis. (2021) 148:105158. doi: 10.1016/J.NBD.2020.105158
7. Côté, JN, Raymond, D, Mathieu, PA, Feldman, AG, and Levin, MF. Differences in multi-joint kinematic patterns of repetitive hammering in healthy, fatigued and shoulder-injured individuals. Clin Biomech. (2005) 20:581–90. doi: 10.1016/j.clinbiomech.2005.02.012
8. Hamill, J, van Emmerik, RE, Heiderscheit, BC, and Li, L. A dynamical systems approach to lower extremity running injuries. Clin Biomech. (1999) 14:297–308. doi: 10.1016/S0268-0033(98)90092-4
9. Lamoth, CJC, Meijer, OG, Daffertshofer, A, Wuisman, PIJM, and Beek, PJ. Effects of chronic low back pain on trunk coordination and back muscle activity during walking: changes in motor control. Eur Spine J. (2006) 15:23–40. doi: 10.1007/s00586-004-0825-y
10. Merkle, S, Sluka, K, and Frey-Law, L. The interaction between pain and movement. J Hand Ther. (2020) 33:60–6. doi: 10.1016/J.JHT.2018.05.001
11. Graven-Nielsen, T, Svenss, P, Svensson, P, and Arendt-Nielsen, L. Effect of muscle pain on motor control: a human experimental approach. Adv Physiother. (2009) 2:26–38. doi: 10.1080/140381900443418
12. George, SZ, Calley, D, Valencia, C, and Beneciuk, JM. Clinical investigation of pain-related fear and pain catastrophizing for patients with low Back pain. Clin J Pain. (2011) 27:108–15. doi: 10.1097/AJP.0b013e3181f21414
13. La Touche, R, Grande-Alonso, M, Arnés-Prieto, P, and Paris-Alemany, A. How does self-efficacy influence pain perception, postural stability and range of motion in individuals with chronic low back pain? Pain Phys. (2019) 22:E1–E13. doi: 10.36076/ppj/2019.22.E1
14. Lambin, D, Thibault, P, Simmonds, M, Lariviere, C, and Sullivan, M. Repetition-induced activity-related summation of pain in patients with fibromyalgia. Pain. (2011) 152:1424–30. doi: 10.1016/J.PAIN.2011.02.030
15. Picavet, H, Vlaeyen, J, and Schouten, J. Pain catastrophizing and kinesiophobia: predictors of chronic low back pain. Am J Epidemiol. (2002) 156:1028–34. doi: 10.1093/AJE/KWF136
16. Sullivan, MJL, Thibault, P, Andrikonyte, J, Butler, H, Catchlove, R, and Larivière, C. Psychological influences on repetition-induced summation of activity-related pain in patients with chronic low back pain. Pain. (2009) 141:70–8. doi: 10.1016/J.PAIN.2008.10.017
17. Bank, P, Peper, C, Marinus, J, Beek, P, and van Hilten, J. Motor consequences of experimentally induced limb pain: a systematic review. Eur J Pain. (2013) 17:145–57. doi: 10.1002/J.1532-2149.2012.00186.X
18. Hodges, PW, and Tucker, K. Moving differently in pain: a new theory to explain the adaptation to pain. Pain. (2011) 152:S90–8. doi: 10.1016/j.pain.2010.10.020
19. Paris, T, Misra, G, Archer, D, and Coombes, S. Effects of a force production task and a working memory task on pain perception. J Pain. (2013) 14:1492–501. doi: 10.1016/J.JPAIN.2013.07.012
20. Hodges, P, and Smeets, S. Interaction between pain, movement, and physical activity: short-term benefits, long-term consequences, and targets for treatment. Clin J Pain. (2015) 31:97–107. doi: 10.1097/AJP.0000000000000098
21. Sullivan, MJL . Toward a biopsychomotor conceptualization of pain: implications for research and intervention. Clin J Pain. (2008) 24:281–90. doi: 10.1097/AJP.0b013e318164bb15
22. Leeuw, M, Goossens, MEJB, Linton, SJ, Crombez, G, Boersma, K, and Vlaeyen, JWS. The fear-avoidance model of musculoskeletal pain: current state of scientific evidence. J Behav Med. (2007) 30:77–94. doi: 10.1007/s10865-006-9085-0
23. Verbunt, JA, Sieben, JM, Seelen, HAM, Vlaeyen, JWS, Bousema, EJ, van der Heijden, GJ, et al. Decline in physical activity, disability and pain-related fear in sub-acute low back pain. Eur J Pain. (2005) 9:417–25. doi: 10.1016/j.ejpain.2004.09.011
24. Geisser, ME, Haig, AJ, Wallbom, AS, and Wiggert, EA. Pain-related fear, lumbar flexion, and dynamic EMG among persons with chronic musculoskeletal low back pain. Clin J Pain. (2004) 20:61–9. doi: 10.1097/00002508-200403000-00001
25. Sarig Bahat, H, Weiss, PLT, Sprecher, E, Krasovsky, A, and Laufer, Y. Do neck kinematics correlate with pain intensity, neck disability or with fear of motion? Man Ther. (2014) 19:252–8. doi: 10.1016/j.math.2013.10.006
26. George, SZ, Fritz, JM, and McNeil, DW. Fear-avoidance beliefs as measured by the fear-avoidance beliefs questionnaire: change in fear-avoidance beliefs questionnaire is predictive of change in self-report of disability and pain intensity for patients with acute low back pain. Clin J Pain. (2006) 22:197–203. doi: 10.1097/01.ajp.0000148627.92498.54
27. Thomas, JS, and France, CR. Pain-related fear is associated with avoidance of spinal motion during recovery from low back pain. Spine. (2007) 32:E460–6. doi: 10.1097/BRS.0b013e3180bc1f7b
28. Vlaeyen, JW, and Linton, SJ. Fear-avoidance and its consequences in chronic musculoskeletal pain: a state of the art. Pain. (2000) 85:317–32. doi: 10.1016/S0304-3959(99)00242-0
29. Asghari, A, and Nicholas, MK. Pain self-efficacy beliefs and pain behaviour. A prospective study. Pain. (2001) 94:85–100. doi: 10.1016/S0304-3959(01)00344-X
30. Sardá, J, Nicholas, MK, Asghari, A, and Pimenta, CAM. The contribution of self-efficacy and depression to disability and work status in chronic pain patients: a comparison between Australian and Brazilian samples. Eur J Pain. (2009) 13:189–95. doi: 10.1016/j.ejpain.2008.03.008
31. Sullivan, MJL, Rodgers, WM, Wilson, PM, Bell, GJ, Murray, TC, and Fraser, SN. An experimental investigation of the relation between catastrophizing and activity intolerance. Pain. (2002) 100:47–53. doi: 10.1016/S0304-3959(02)00206-3
32. Hasenbring, MI, Lundberg, M, Parker, R, Söderlund, A, Bolton, B, Smeets, RJEM, et al. Pain, mind, and movement in musculoskeletal pain: is physical activity always health-promoting or are there detrimental aspects? Clin J Pain. (2015) 31:95–6. doi: 10.1097/AJP.0000000000000101
33. Feuerstein, M, and Beattie, P. Biobehavioral factors affecting pain and disability in low back pain: mechanisms and assessment. Phys Ther. (1995) 75:267–80. doi: 10.1093/ptj/75.4.267
34. Artino, AR, La Rochelle, JS, Dezee, KJ, and Gehlbach, H. Developing questionnaires for educational research: AMEE guide no. 87. Med Teach. (2014) 36:463–74. doi: 10.3109/0142159X.2014.889814
35. Mokkink, LB, Terwee, CB, Patrick, DL, Alonso, J, Stratford, PW, Knol, DL, et al. The COSMIN checklist for assessing the methodological quality of studies on measurement properties of health status measurement instruments: an international Delphi study. Qual Life Res. (2010) 19:539–49. doi: 10.1007/S11136-010-9606-8
36. Andrade Ortega, JA, Delgado Martinez, AD, and Almecija Ruiz, R. Validation of the Spanish version of the neck disability index. Spine. (2010) 35:E114–8. doi: 10.1097/BRS.0b013e3181afea5d
37. Childs, JD, and Piva, SR. Psychometric properties of the functional rating index in patients with low back pain. Eur Spine J. (2005) 14:1008–12. doi: 10.1007/s00586-005-0900-z
38. Esteve, R, Ramírez-Maestre, C, Peters, ML, Serrano-Ibáñez, ER, Ruíz-Párraga, GT, and López-Martínez, AE. Development and initial validation of the activity patterns scale in patients with chronic pain. J Pain. (2016) 17:451–61. doi: 10.1016/J.JPAIN.2015.12.009
39. Fearon, AM, Ganderton, C, Scarvell, JM, Smith, PN, Neeman, T, Nash, C, et al. Development and validation of a VISA tendinopathy questionnaire for greater trochanteric pain syndrome, the VISA-G. Man Ther. (2015) 20:805–13. doi: 10.1016/J.MATH.2015.03.009
40. Ferrer-Peña, R, Gil-Martínez, A, Pardo-Montero, J, Jiménez-Penick, V, Gallego-Izquierdo, T, and La Touche, R. Adaptation and validation of the Spanish version of the graded chronic pain scale. Reumatol Clin. (2016) 12:130–8. doi: 10.1016/J.REUMA.2015.07.004
41. Gloth, FM, Scheve, AA, Stober, CV, Chow, S, and Prosser, J. The functional pain scale: reliability, validity, and responsiveness in an elderly population. J Am Med Dir Assoc. (2001) 2:110–4. doi: 10.1016/S1525-8610(04)70176-0
42. Gomez-Perez, L, Lopez-Martinez, AE, and Ruiz-Parraga, GT. Psychometric properties of the Spanish version of the Tampa scale for Kinesiophobia (TSK). J Pain. (2011) 12:425–35. doi: 10.1016/j.jpain.2010.08.004
43. Hammond, A, Prior, Y, and Tyson, S. Linguistic validation, validity and reliability of the British English versions of the disabilities of the arm, shoulder and hand (DASH) questionnaire and QuickDASH in people with rheumatoid arthritis. BMC Musculoskelet Disord. (2018) 19:118. doi: 10.1186/S12891-018-2032-8
44. Kovacs, FM, Llobera, J, Gil Del Real, MT, Abraira, V, Gestoso, M, Fernández, C, et al. Validation of the Spanish version of the Roland-Morris questionnaire. Spine. (2002) 27:538–42. doi: 10.1097/00007632-200203010-00016
45. Kovacs, FM, Muriel, A, Medina, JM, Abraira, V, Sánchez, MDC, and Jaúregui, JO. Psychometric characteristics of the Spanish version of the FAB questionnaire. Spine. (2006) 31:104–10. doi: 10.1097/01.brs.0000193912.36742.4f
46. Langenfeld, A, Bastiaenen, C, Sieben, J, and Swanenburg, J. Development and validation of a self-administered neck mobility assessment tool (S-ROM-neck) in chronic neck pain patients. Musculoskelet Sci Pract. (2018) 37:75–9. doi: 10.1016/J.MSKSP.2018.04.004
47. Lauche, R, Cramer, H, Langhorst, J, Michalsen, A, and Dobos, GJ. Reliability and validity of the pain on movement questionnaire (POM) in chronic neck pain. Pain Med. (2014) 15:1850–6. doi: 10.1111/pme.12534
48. Martín-Aragón, M, Pastor, MA, Rodríguez-MaríN, J, March, MJ, Lledó, A, and López-Roig,. Percepción de autoeficacia en dolor crónico: adaptación y validación de la Chronic Pain Self-Efficacy Scale. Rev de Psicol de La Salud. (1999) 11:53–75.
49. Naghdi, S, Nakhostin Ansari, N, Yazdanpanah, M, Feise, RJ, and Fakhari, Z. The validity and reliability of the functional rating index for evaluating low back pain in athletes. Scand J Med Sci Sports. (2015) 25:840–5. doi: 10.1111/sms.12447
50. Neblett, R, Mayer, TG, Hartzell, MM, Williams, MJ, and Gatchel, RJ. The fear-avoidance components scale (FACS): development and psychometric evaluation of a new measure of pain-related fear avoidance. Pain Pract. (2016) 16:435–50. doi: 10.1111/PAPR.12333
51. Payares, K, Lugo, LH, Morales, V, and Londoño, A. Validation in Colombia of the Oswestry disability questionnaire in patients with low back pain. Spine. (2011) 36:E1730–5. doi: 10.1097/BRS.0b013e318219d184
52. Wolff, SV, Willburger, R, Hallner, D, Rusu, AC, Rusche, H, Schulte, T, et al. Avoidance-endurance fast screening (AE-FS): Content and predictive validity of a 9-item screening instrument for patients with unspecific subacute low back pain. Schmerz. (2018) 32:283–92. doi: 10.1007/S00482-018-0310-X
53. Smith, JA . Beyond the divide between cognition and discourse: using interpretative phenomenological analysis in health psychology. Psychol Health. (1996) 11:261–71. doi: 10.1080/08870449608400256
54. Duque, H, and Aristizábal Díaz-Granados, ET. Análisis fenomenológico interpretativo. Pensando Psicología. (2019) 15:1–24. doi: 10.16925/2382-3984.2019.01.03
55. Pringle, J, Drummond, J, McLafferty, E, and Hendry, C. Interpretative phenomenological analysis: a discussion and critique. Nurse Res. (2011) 18:20–4. doi: 10.7748/nr2011.04.18.3.20.c8459
56. Tuffour, I . A critical overview of interpretative phenomenological analysis: a contemporary qualitative research approach. J Healthc Commun. (2017) 2:52. doi: 10.4172/2472-1654.100093
57. Jones, J, and Hunter, D. Consensus methods for medical and health services research. BMJ. (1995) 311:376–80. doi: 10.1136/bmj.311.7001.376
58. Aiken, LR . Three coefficients for analyzing the reliability and validity of ratings. Educ Psychol Meas. (1985) 45:131–42. doi: 10.1177/0013164485451012
59. Farnik, M, and Pierzchała, WA. Instrument development and evaluation for patient-related outcomes assessments. Patient Relat Outcome Meas. (2012) 3:1–7. doi: 10.2147/PROM.S14405
60. Treede, RD, Rief, W, Barke, A, Aziz, Q, Bennett, MI, Benoliel, R, et al. A classification of chronic pain for ICD-11. Pain. (2015) 156:1003–7. doi: 10.1097/J.PAIN.0000000000000160
61. Perrot, S, Cohen, M, Barke, A, Korwisi, B, Rief, W, and Treede, RD. The IASP classification of chronic pain for ICD-11: chronic secondary musculoskeletal pain. Pain. (2019) 160:77–82. doi: 10.1097/J.PAIN.0000000000001389
62. Lloret-Segura, S, Ferreres-Traver, A, Hernández-Baeza, A, and Tomás-Marco, I. El Análisis Factorial Exploratorio de los Ítems: una guía práctica, revisada y actualizada. Anales Psicol. (2014) 30:1151–69. doi: 10.6018/ANALESPS.30.3.199361
63. Ferrando Piera, PJ, and Anguiano Carrasco, C. El análisis factorial como técnica de investigación en psicología. Papeles Del Psicólogo. (2010) 31:18–33. Available at: https://www.redalyc.org/articulo.oa?id=77812441003
64. Walter, SD, Eliasziw, M, and Donner, A. Sample size and optimal designs for reliability studies. Stat Med. (1998) 17:101–10. doi: 10.1002/(SICI)1097-0258(19980115)17:1<101::AID-SIM727>3.0.CO;2-E
65. Arifin, WN . A web-based sample size calculator for reliability studies. Educ Med J. (2018) 10:67–76. doi: 10.21315/EIMJ2018.10.3.8
66. Jöreskog, KG, and Goldberger, AS. Factor analysis by generalized least squares. Psychometrika. (1972) 37:243–60. doi: 10.1007/BF02306782/METRICS
67. Izquierdo, I, Olea, J, and Abad, FJ. Exploratory factor analysis in validation studies: uses and recommendations. Psicothema. (2014) 26:395–400. doi: 10.7334/PSICOTHEMA2013.349
68. Kaiser, HF . An index of factorial simplicity. Psychometrika. (1974) 39:31–6. doi: 10.1007/BF02291575
69. Ferguson, E, and Cox, T. Exploratory factor analysis: a user’ s guide. Int J Select Assess. (1993) 1:84–94. doi: 10.1111/j.1468-2389.1993.tb00092.x
70. Garrido, LE, Abad, FJ, and Ponsoda, V. Are fit indices really fit to estimate the number of factors with categorical variables? Some cautionary findings via Monte Carlo simulation. Psychol Methods. (2016) 21:93–111. doi: 10.1037/MET0000064
71. Golino, H, Shi, D, Christensen, AP, Garrido, LE, Nieto, MD, Sadana, R, et al. Investigating the performance of exploratory graph analysis and traditional techniques to identify the number of latent factors: a simulation and tutorial. Psychol Methods. (2020) 25:292–320. doi: 10.1037/MET0000255
72. Golino, H., and Christensen, A. P. (2022). EGAnet: exploratory graph analysis – a framework for estimating the number of dimensions in multivariate data using network psychometrics. R Package Version 2.0.2. Available at: https://r-ega.net
73. Revelle, W . psych: procedures for psychological, psychometric, and personality research. Evanston, Illinois: Northwestern University (2023) R Package Version 2.3.3.
74. Costello, AB, and Osborne, J. Best practices in exploratory factor analysis: four recommendations for getting the most from your analysis. Pract Assess Res Eval. (2005) 10:7. doi: 10.7275/jyj1-4868
75. Terwee, CB, Bot, SDM, de Boer, MR, van der Windt, DAWM, Knol, DL, Dekker, J, et al. Quality criteria were proposed for measurement properties of health status questionnaires. J Clin Epidemiol. (2007) 60:34–42. doi: 10.1016/j.jclinepi.2006.03.012
76. Sendlbeck, M, Araujo, EG, Schett, G, and Englbrecht, M. Psychometric properties of three single-item pain scales in patients with rheumatoid arthritis seen during routine clinical care: a comparative perspective on construct validity, reproducibility and internal responsiveness. RMD Open. (2015) 1:e000140. doi: 10.1136/rmdopen-2015-000140
77. García Campayo, J, Rodero, B, Alda, M, Sobradiel, N, Montero, J, and Moreno, S. Validación de la versión española de la escala de la catastrofización ante el dolor (Pain Catastrophizing Scale) en la fibromialgia. Med Clin. (2008) 131:487–92. doi: 10.1157/13127277
78. Martín-Aragón, M, Pastor, M, Rodríguez-Marín, J, March, M, Lledó, A, López-Roig, S, et al. Percepción de autoeficacia en dolor crónico. Adaptación y validación de la chronic pain self-efficacy scale. Revista de Psicología Salud. (1999) 11:53–75.
79. Cronbach, LJ . Coefficient alpha and the internal structure of tests. Psychometrika. (1951) 16:297–334. doi: 10.1007/BF02310555
80. Trizano-Hermosilla, I, and Alvarado, JM. Best alternatives to Cronbach’s alpha reliability in realistic conditions: congeneric and asymmetrical measurements. Front Psychol. (2016) 7:769. doi: 10.3389/FPSYG.2016.00769
81. Koo, TK, and Li, MY. A guideline of selecting and reporting intraclass correlation coefficients for reliability research. J Chiropr Med. (2016) 15:155–63. doi: 10.1016/J.JCM.2016.02.012
82. Haley, SM, and Fragala-Pinkham, MA. Interpreting change scores of tests and measures used in physical therapy. Phys Ther. (2006) 86:735–43. doi: 10.1093/ptj/86.5.735
83. Weir, JP . Quantifying test-retest reliability using the intraclass correlation coefficient and the SEM. J Strength Condit Res. (2005) 19:231. doi: 10.1519/15184.1
85. Böhning, D, Böhning, W, and Holling, H. Revisiting Youden’s index as a useful measure of the misclassification error in meta-analysis of diagnostic studies. Stat Methods Med Res. (2008) 17:543–54. doi: 10.1177/0962280207081867
86. López-Ratón, M, Rodríguez-Álvarez, MX, Cadarso-Suárez, C, and Gude-Sampedro, F. OptimalCutpoints: an R package for selecting optimal cutpoints in diagnostic tests. J Stat Softw. (2014) 61:1–36. doi: 10.18637/JSS.V061.I08
87. Reeve, BB, Wyrwich, KW, Wu, AW, Velikova, G, Terwee, CB, Snyder, CF, et al. ISOQOL recommends minimum standards for patient-reported outcome measures used in patient-centered outcomes and comparative effectiveness research. Qual Life Res. (2013) 22:1889–905. doi: 10.1007/s11136-012-0344-y
88. Patrick, DL, Burke, LB, Gwaltney, CJ, Leidy, NK, Martin, ML, Molsen, E, et al. Content validity—establishing and reporting the evidence in newly developed patient-reported outcomes (PRO) instruments for medical product evaluation: ISPOR PRO good research practices task force report: part 2—assessing respondent understanding. Value Health. (2011) 14:978–88. doi: 10.1016/j.jval.2011.06.013
89. Beavers, AS, Lounsbury, JW, Richards, JK, Huck, SW, Skolits, GJ, and Esquivel, SL. Practical considerations for using exploratory factor analysis in educational research. Pract Assess Res Eval. (2013) 18:6. doi: 10.7275/qv2q-rk76
90. Gatchel, RJ, Peng, YB, Peters, ML, Fuchs, PN, and Turk, DC. The biopsychosocial approach to chronic pain: scientific advances and future directions. Psychol Bull. (2007) 133:581–624. doi: 10.1037/0033-2909.133.4.581
91. Streiner, DL, and Norman, GR. Health measurement scales: a practical guide to their development and use. In health measurement scales: a practical guide to their development and use (3rd). New York: Oxford University Press (2008).
92. de Vet, HC, Terwee, CB, Ostelo, RW, Beckerman, H, Knol, DL, and Bouter, LM. Minimal changes in health status questionnaires: distinction between minimally detectable change and minimally important change. Health Qual Life Outcomes. (2006) 4:54. doi: 10.1186/1477-7525-4-54
93. Rolstad, S, Adler, J, and Rydén, A. Response burden and questionnaire length: is shorter better? A review and meta-analysis. Value Health. (2011) 14:1101–8. doi: 10.1016/j.jval.2011.06.003
Keywords: chronic pain, biobehavioural approach, self-administered questionnaires, psychological variables, functionality
Citation: La Touche R, Paris-Alemany A, Pardo-Montero J, Miñambres-Martín D, Mercado-Romero F, de la Rosa-Díaz I, Sorrel MA and Grande-Alonso M (2024) The biobehavioural pain and movement questionnaire (BioPMovQ): development and psychometric validation of a new questionnaire. Front. Med. 11:1358829. doi: 10.3389/fmed.2024.1358829
Edited by:
Metoda Lipnik-Stangelj, University of Ljubljana, SloveniaReviewed by:
César Calvo-Lobo, Complutense University of Madrid, SpainJorge Hugo Villafañe, Fondazione Don Carlo Gnocchi Onlus (IRCCS), Italy
Luis Suso-Marti, University of Valencia, Spain
Copyright © 2024 La Touche, Paris-Alemany, Pardo-Montero, Miñambres-Martín, Mercado-Romero, de la Rosa-Díaz, Sorrel and Grande-Alonso. This is an open-access article distributed under the terms of the Creative Commons Attribution License (CC BY). The use, distribution or reproduction in other forums is permitted, provided the original author(s) and the copyright owner(s) are credited and that the original publication in this journal is cited, in accordance with accepted academic practice. No use, distribution or reproduction is permitted which does not comply with these terms.
*Correspondence: Alba Paris-Alemany, albaparis@gmail.com