Contrastive learning with token projection for Omicron pneumonia identification from few-shot chest CT images
 Xiaoben Jiang1†
  Dawei Yang2,3,4†
  Li Feng5† Yu Zhu1*
  Mingliang Wang6
  Yinzhou Feng2
  Chunxue Bai2,3
  Hao Fang6,7*
- 1School of Information Science and Technology, East China University of Science and Technology, Shanghai, China
- 2Department of Pulmonary and Critical Care Medicine, Zhongshan Hospital, Fudan University, Shanghai, China
- 3Shanghai Engineering Research Center of Internet of Things for Respiratory Medicine, Shanghai, China
- 4Department of Pulmonary and Critical Care Medicine, Zhongshan Hospital (Xiamen), Fudan University, Xiamen, Fujian, China
- 5Department of Nursing, Zhongshan Hospital, Fudan University, Shanghai, China
- 6Department of Anesthesiology, Zhongshan Hospital, Fudan University, Shanghai, China
- 7Department of Anesthesiology, Shanghai Geriatric Medical Center, Shanghai, China
Introduction: Deep learning-based methods can promote and save critical time for the diagnosis of pneumonia from computed tomography (CT) images of the chest, where the methods usually rely on large amounts of labeled data to learn good visual representations. However, medical images are difficult to obtain and need to be labeled by professional radiologists.
Methods: To address this issue, a novel contrastive learning model with token projection, namely CoTP, is proposed for improving the diagnostic quality of few-shot chest CT images. Specifically, (1) we utilize solely unlabeled data for fitting CoTP, along with a small number of labeled samples for fine-tuning, (2) we present a new Omicron dataset and modify the data augmentation strategy, i.e., random Poisson noise perturbation for the CT interpretation task, and (3) token projection is utilized to further improve the quality of the global visual representations.
Results: The ResNet50 pre-trained by CoTP attained accuracy (ACC) of 92.35%, sensitivity (SEN) of 92.96%, precision (PRE) of 91.54%, and the area under the receiver-operating characteristics curve (AUC) of 98.90% on the presented Omicron dataset. On the contrary, the ResNet50 without pre-training achieved ACC, SEN, PRE, and AUC of 77.61, 77.90, 76.69, and 85.66%, respectively.
Conclusion: Extensive experiments reveal that a model pre-trained by CoTP greatly outperforms that without pre-training. The CoTP can improve the efficacy of diagnosis and reduce the heavy workload of radiologists for screening of Omicron pneumonia.
1 Introduction
In the tail of February 2022, a new round of COVID-19 epidemic caused by subvariant Omicron BA. 2 and BA. 2.2 broke out in Shanghai (1). There are more than 30 mutation sites in the spike protein of the Omicron mutant, which increases the binding ability of the virus to human cells, and the infectivity is 37.5% higher than that of the Delta variant (2, 3). Until 1 June 2022, Omicron had caused 626,811 infection cases, including 568,811 asymptomatic infections, 58,000 symptomatic cases, and 588 deaths (4), which brought great crisis and challenge to social public health security (5).
Currently, the real-time reverse-transcriptase–polymerase-chain-reaction (RT-PCR) test is the main diagnostic tool (6), while chest CT imaging is increasingly recognized as a complementary or even a reliable alternative method (7, 8). Figure 1 illustrates some CT scan images of mild and severe Omicron pneumonia. All annotations have been provided by experienced doctors, who evaluate patients based on their clinical conditions and CT imaging. From that, we can find that the CT images of mild Omicron pneumonia usually show slight inflammation in the lungs. On the contrary, the CT images of severe Omicron pneumonia are more serious than those of mild Omicron pneumonia, showing more severe inflammation and damage to the lungs. Physicians need to pay more attention to patients with severe Omicron pneumonia and treat them in time. However, experienced radiologists are needed to manually identify all the thin-slice CT images (an average of 300 layers per patient) (9). This may lead to misdiagnosis due to the significantly increased workload of radiologists.
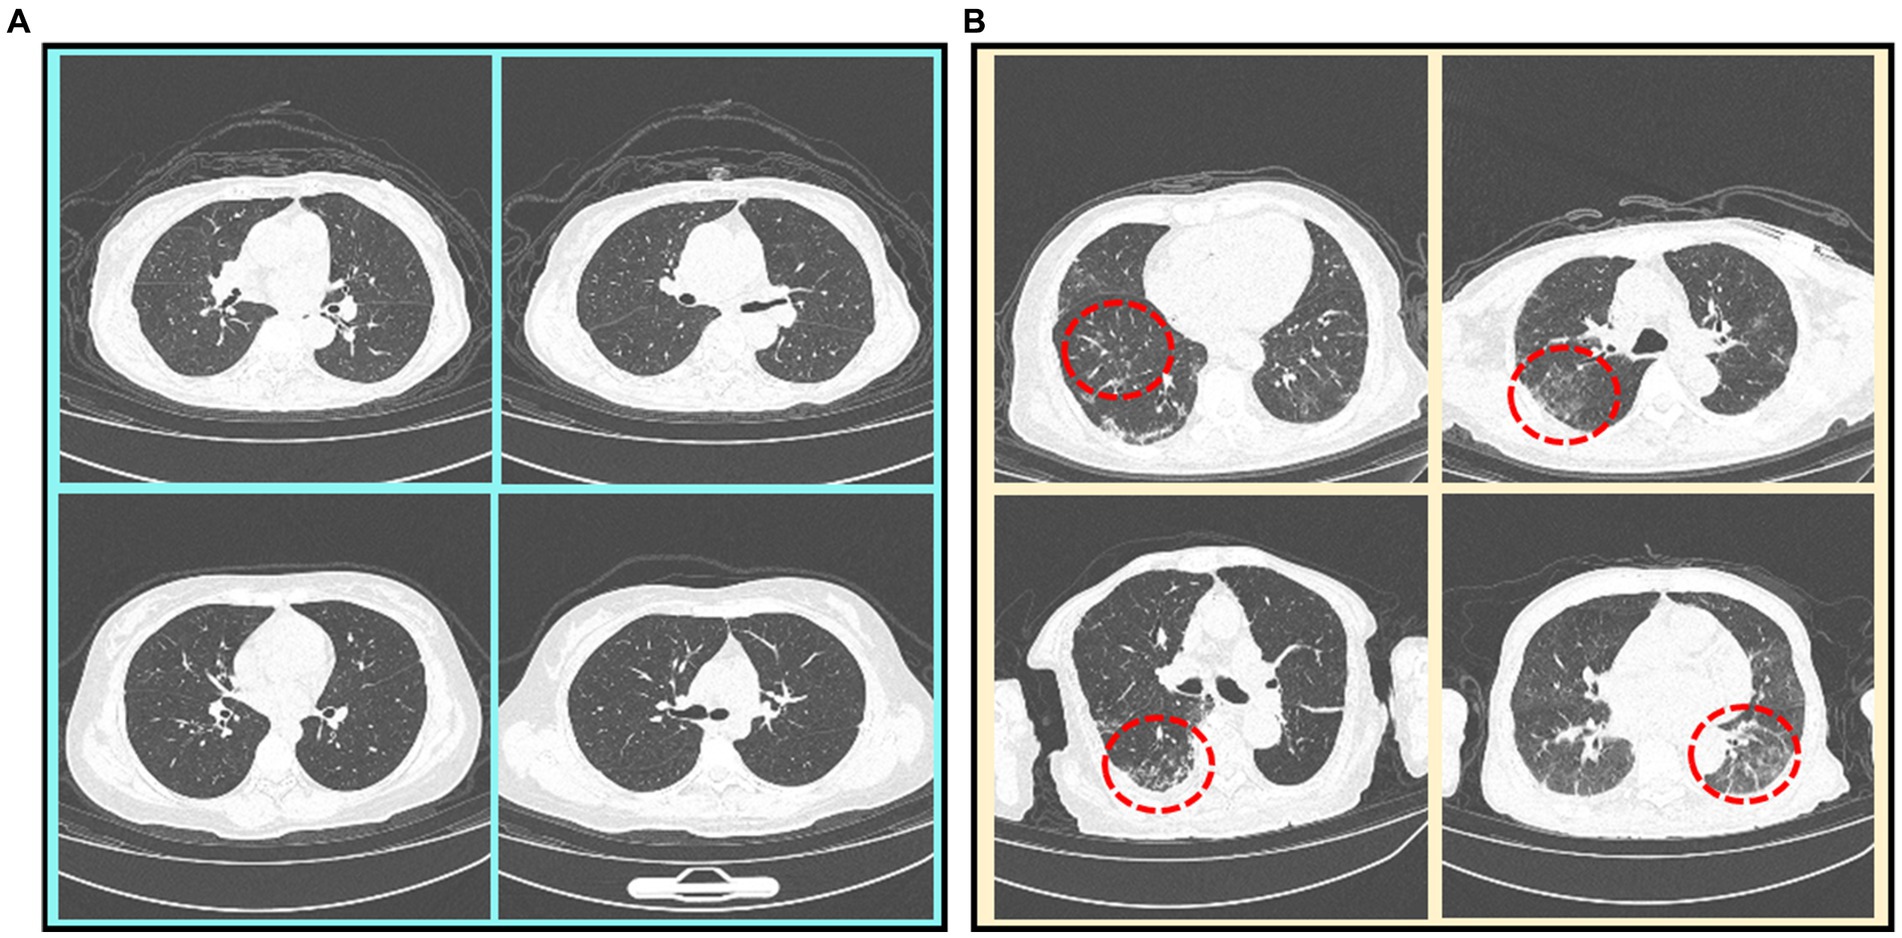
Figure 1. CT scan images of mild and severe Omicron pneumonia. Severe Omicron pneumonia areas are marked with red dotted circles. (A) Mild Omicron pneumonia. (B) Severe Omicron pneumonia.
With the development of deep learning (10), researchers can extract useful information from a significant volume of annotated data (11). However, when compared to natural images, acquiring such quantities of medical data is challenging, and the annotations must be carried out by professional radiologists (12, 13). This poses huge challenges to applying deep learning to medical image analysis and processing (14). In recent years, contrastive learning methods (15–19) have achieved satisfactory results in natural image classification tasks. These methods can utilize unlabeled data to create a pre-trained model, which can then be fine-tuned with lightly annotated data for further improvement.
While some studies have investigated the effects of contrastive learning on natural image classification tasks, there remains a gap in research that specifically addresses chest CT images. The current methods based on contrast learning are insufficient in enhancing chest CT images effectively and exploring global features. To address this issue, we propose a novel contrastive learning with token projection, namely CoTP, to improve global visual representation. The token projection typically consists of a multi-head self-attention (MHSA) (20) and a fully connected (FC) layer. The MHSA can capture short and long-range visual dependencies, while the FC layer can eliminate redundant features. Moreover, we leverage the downsampling layer to reduce the cost of computation. In addition, a private Omicron dataset collected by the Geriatric Medical Center, Zhongshan Hospital, Fudan University is utilized for CoTP pre-training. Especially, data augmentations have important roles in contrastive learning methods (15). However, the widely used augmentations in contrastive learning approaches for natural images may not be suitable for chest CT. Therefore, a new data augmentation approach, random Poisson noise perturbation (PNP) is proposed for CT images, to simulate the noise in CT images. After pre-training, the feature encoder with pre-trained weights is taken out, followed by a simple max pooling and average pooling (MAP) head which can obtain different space areas occupied by objects of different categories. Then, we fine-tune the model on a sub-dataset extracted from Omicron datasets and the external SARS-CoV-2 CT-scan dataset (21), respectively. Extensive experiments reveal that a model pre-trained by the proposed CoTP greatly outperforms that without pre-training.
Our main contributions to this work are summarized as follows:
1. A novel contrastive learning with token projection, namely CoTP, is proposed to improve the diagnostic quality of few-shot Omicron chest CT images. In particular, token projection with a downsampling layer is utilized to further improve the quality of the global visual representations and reduce the computational cost. In addition, the MAP head is employed to obtain different spatial regions occupied by objects of different categories.
2. We present a new Omicron dataset approved by the institutional review board of Zhongshan Hospital, Fudan University in Shanghai. Furthermore, we leverage a new data augmentation approach, random Poisson noise perturbation (PNP) to simulate the noise in CT images which is more realistic.
3. We verify the effectiveness of the proposed CoTP on the private Omicron dataset and the external SARS-CoV-2 CT-scan dataset, which delivers promising results on both datasets.
2 Related work
2.1 Supervised learning for diagnosis of pneumonia from chest CT images
Since the outbreak of coronavirus disease COVID-19 was declared a pandemic by the WHO on 11 March, 2020, various deep learning-based methods have been implemented worldwide to promote and save critical time for pneumonia diagnosis from CT images. Wu et al. (9) proposed a multi-view fusion model to improve the efficacy of diagnosis. A previous study Mei et al. (22) designed a grad-CAM-based deep learning method for fast detection of COVID-19 cases. Another study (23) diagnosed COVID-19 via the proposed network with a multi-receptive field attention module on CT images. Moreover, Mei et al. (22) adopted ResNet (23) to rapidly diagnose COVID-19 patients using both full CT scans and non-image information. In addition, several works (24–26) also used segmentation techniques for detection. However, the current deep learning-based approaches for pneumonia diagnosis primarily rely on supervised learning, leveraging abundant labeled data to acquire precise visual representations. On the contrary, there are few-shot labeled chest CT images. Table 1 summarizes the previous studies on supervised learning for pneumonia diagnosis from chest CT images.
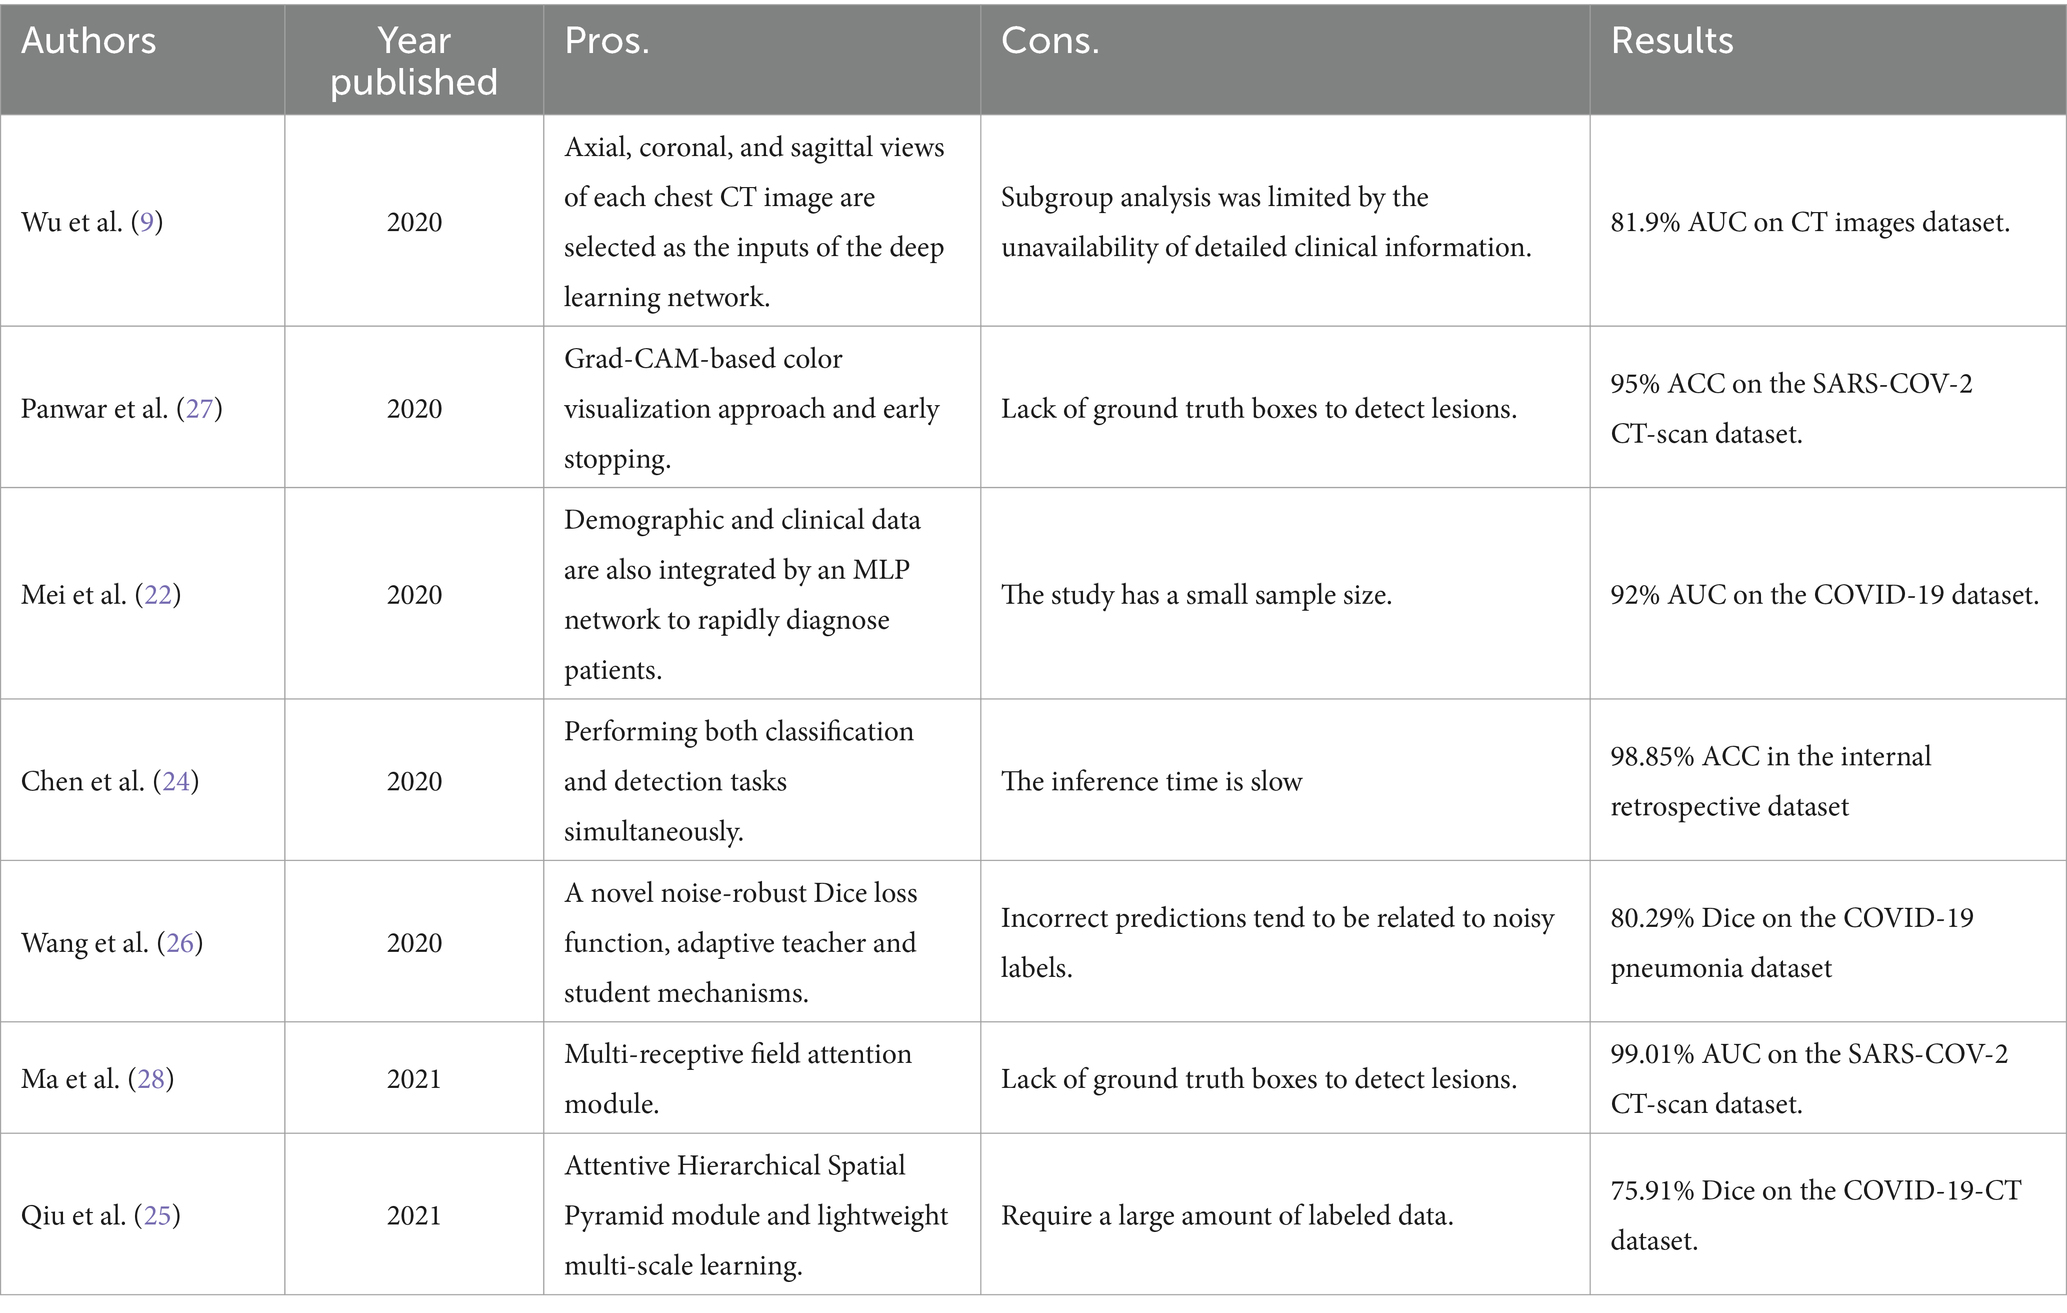
Table 1. Previous studies on supervised learning for pneumonia diagnosis from Chest CT images.
2.2 Contrastive learning in image analysis
Given the efficient visual representation ability of deep learning, contrastive learning has emerged as a promising approach for efficiently extracting accurate visual representations from unlabeled images (29). Wu et al. (16) first designed a framework that pulls away augmented views of different images (negative pair) while pulling in different augmented views of the same image (positive pair). Based on this idea, the two methods, SimCLRv1 (15) and MoCo-v1 (18) were proposed, which can greatly narrow the gap between supervised learning and unsupervised learning on downstream task performance. These methods, SimCLRv2 (17) and MoCo-v2 (19) employed the projection head to improve the ability of visual representation extraction and outperformed the supervised learning on downstream tasks.
The success of these methods motivated many researchers to introduce contrastive learning into medical image analysis. Sowrirajan et al. (13) utilized MoCo pre-training to improve the representation and transferability of chest X-ray Models. Zhang et al. (30) obtained medical visual representations according to contrastive learning with paired images and texts. In addition, the works of various researchers (30–32) employed contrastive learning for medical image segmentation. However, the existing contrastive mechanisms have scope for improvement for Omicron pneumonia diagnosis from chest CT images due to their inability to mine global features and lack of appropriate augmentations for chest CT images. We present the pros and cons of previous studies on contrastive learning in image analysis in Table 2.
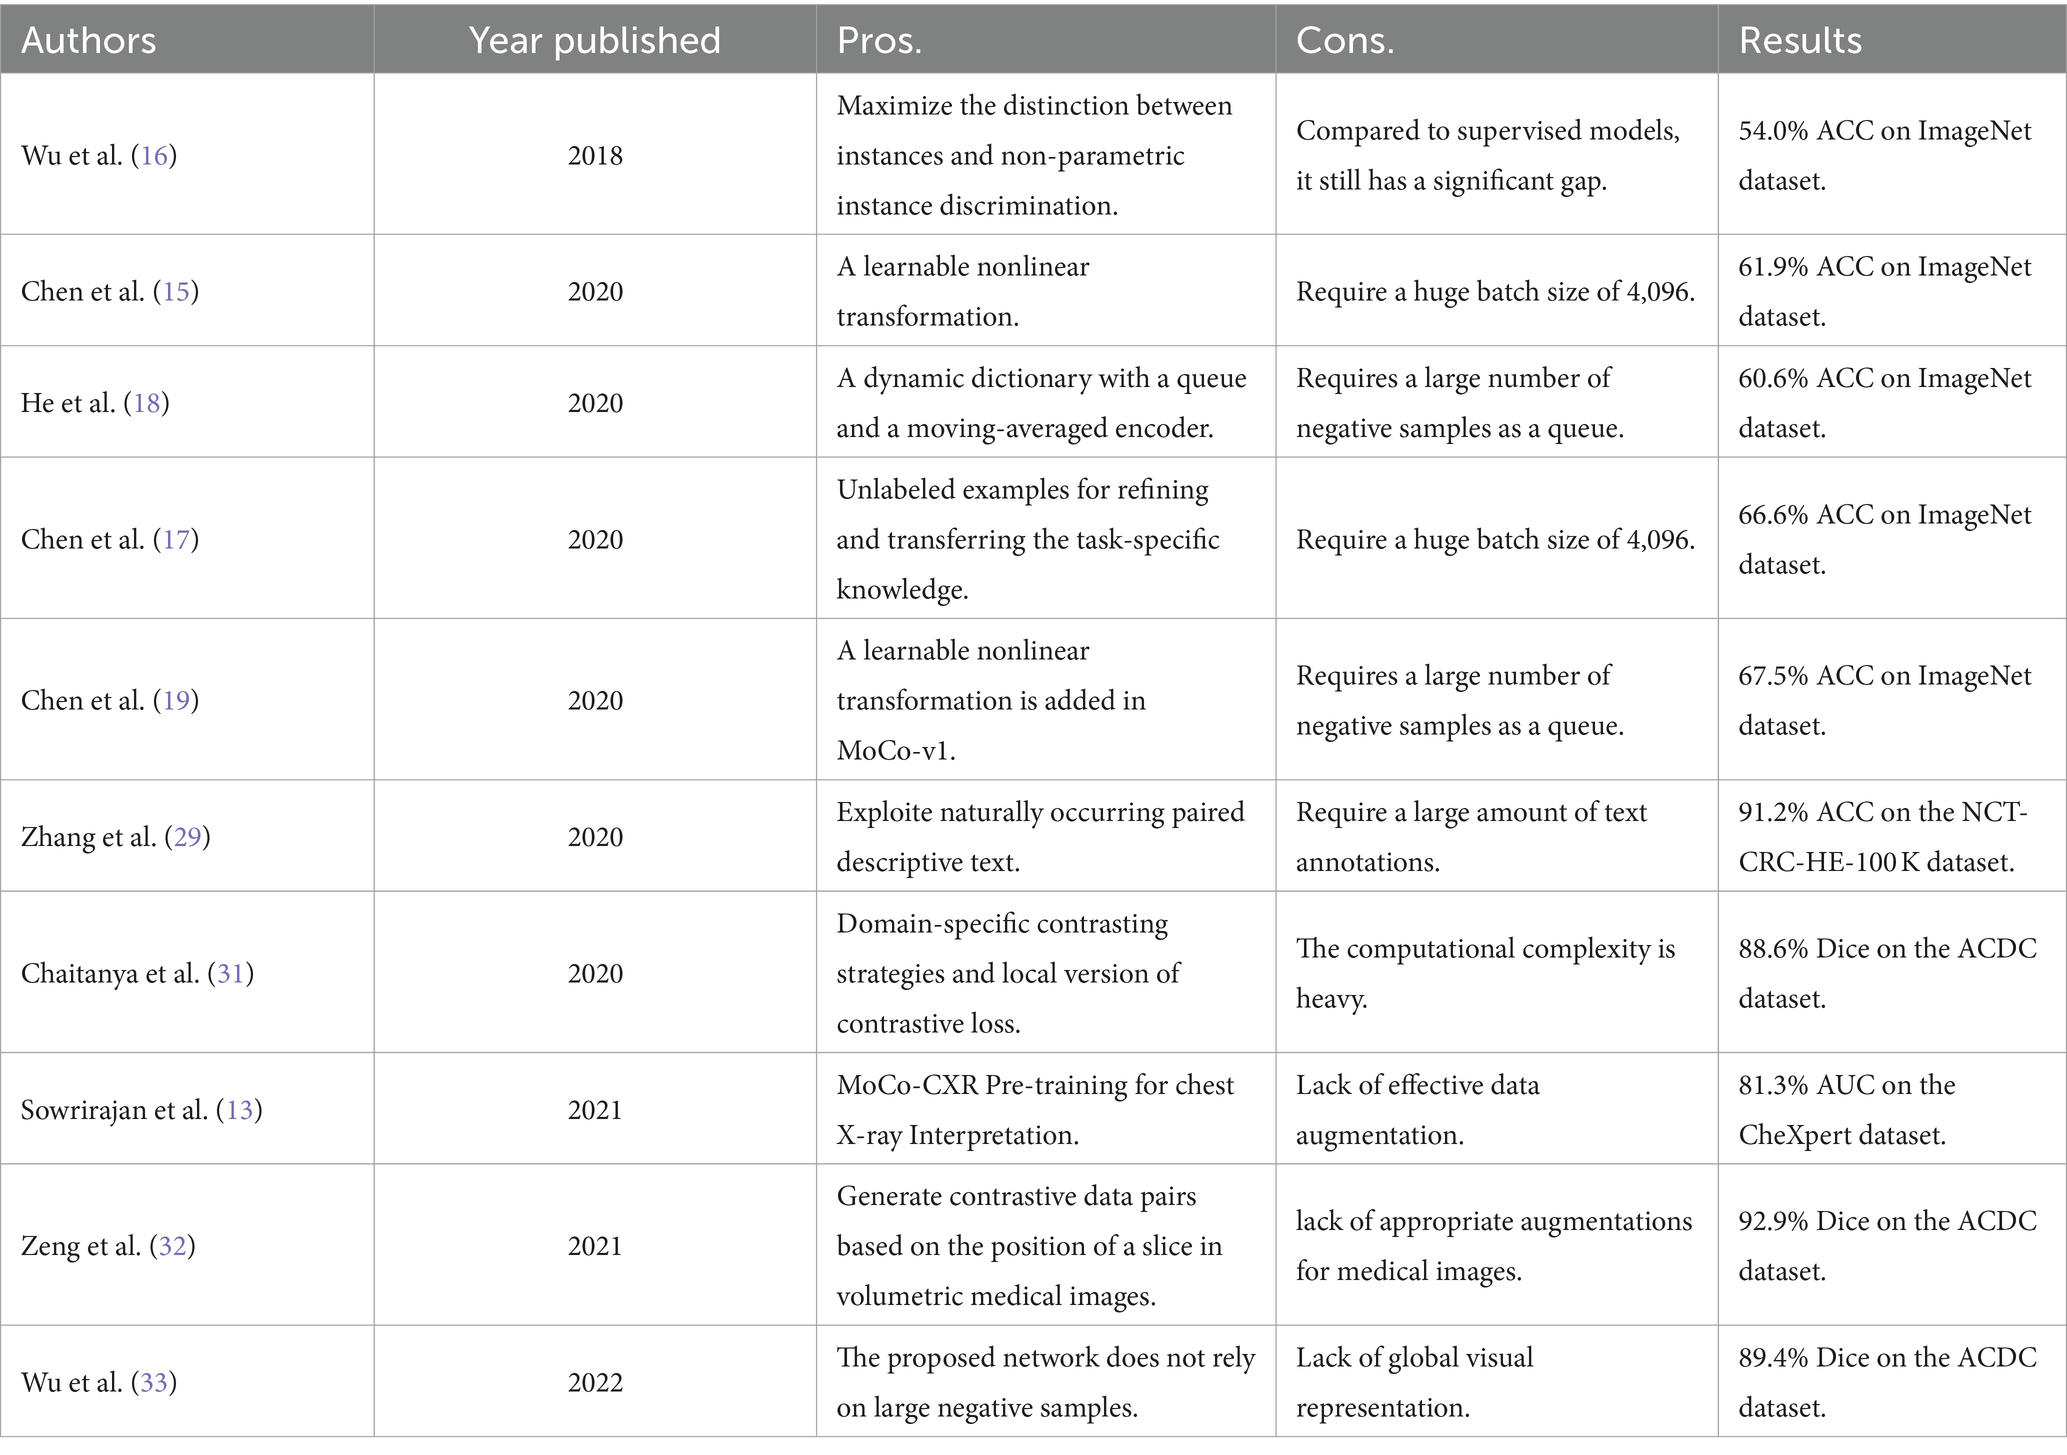
Table 2. Previous studies on contrastive learning in image analysis.
3 Materials and methods
3.1 The pipeline for interpretation of CT images
The overall pipeline for CoTP pre-training and the subsequent fine-tuning with CT images are illustrated in Figure 2. There are two stages for CT image interpretation: the CoTP pre-training stage and subsequent fine-tuning. First, we converted and exported the DICOM files of Omicron patients into JPEG formats and employed CoTP to pre-train the feature encoder using unlabeled Omicron CT images. Second, the feature encoder with pre-trained weights was taken out, followed by a simple linear classifier. Then, we fine-tuned the baseline with a few labeled CT images.
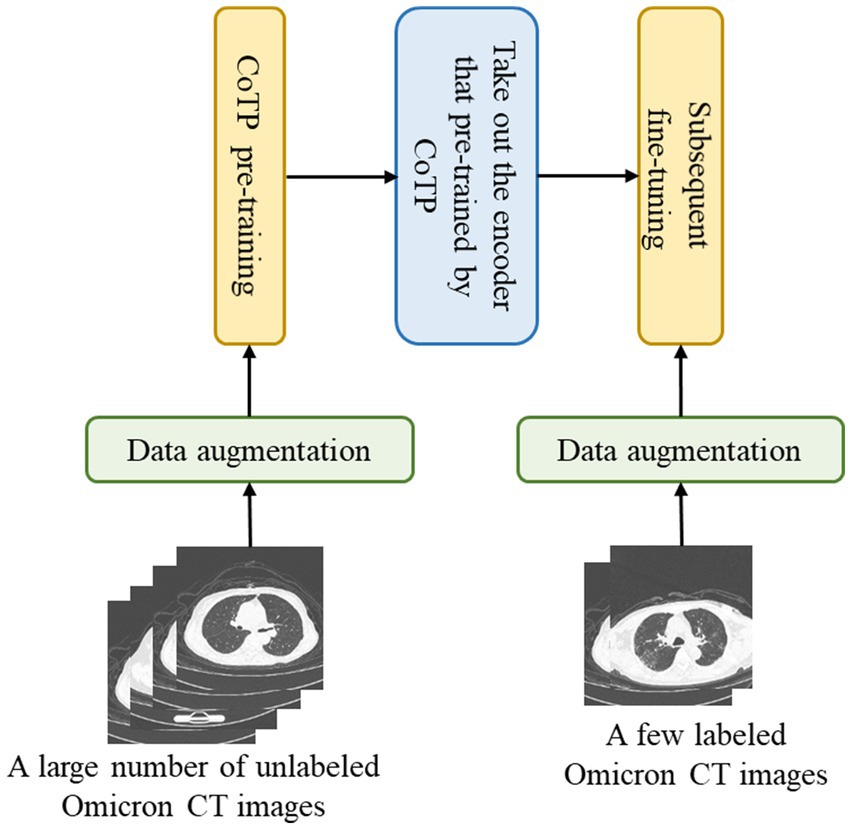
Figure 2. Overview of Omicron pneumonia.
3.2 Random Poisson noise perturbation
Data augmentation is widely used in contrastive learning and is crucial for learning good representations (15). Nevertheless, most existing natural image data augmentations may not be suitable for chest CT images. For example, random crops and cutouts may remove or mask the lesion area of CT images. Meanwhile, color jitter and random grayscale transformation are no longer applicable to grayscale CT images.
As shown in Figure 3, we not only utilized traditional methods, i.e., random horizontal flipping, random center crop, and random rotation (10 degrees) but also a new data augmentation approach, random Poisson noise perturbation for CT images. Poisson distributed noise is a well-known data augmentation (34, 35). However, this was the first time that Poisson-distributed noise was applied to contrastive learning instead of Gaussian noise perturbation. In the process of scanning CT images, various noises will be generated due to the photoelectric interaction, and the noise distribution is more accurately characterized by the Poisson distribution (36). Consequently, we employed random Poisson noise perturbation to simulate the noise in CT images as a new data augmentation for CT images. First, we performed fan beam projection (37) transformation on the CT image , and added Poisson noise as Eq. (1), where stands for the number of photons. Here is set as le-6.
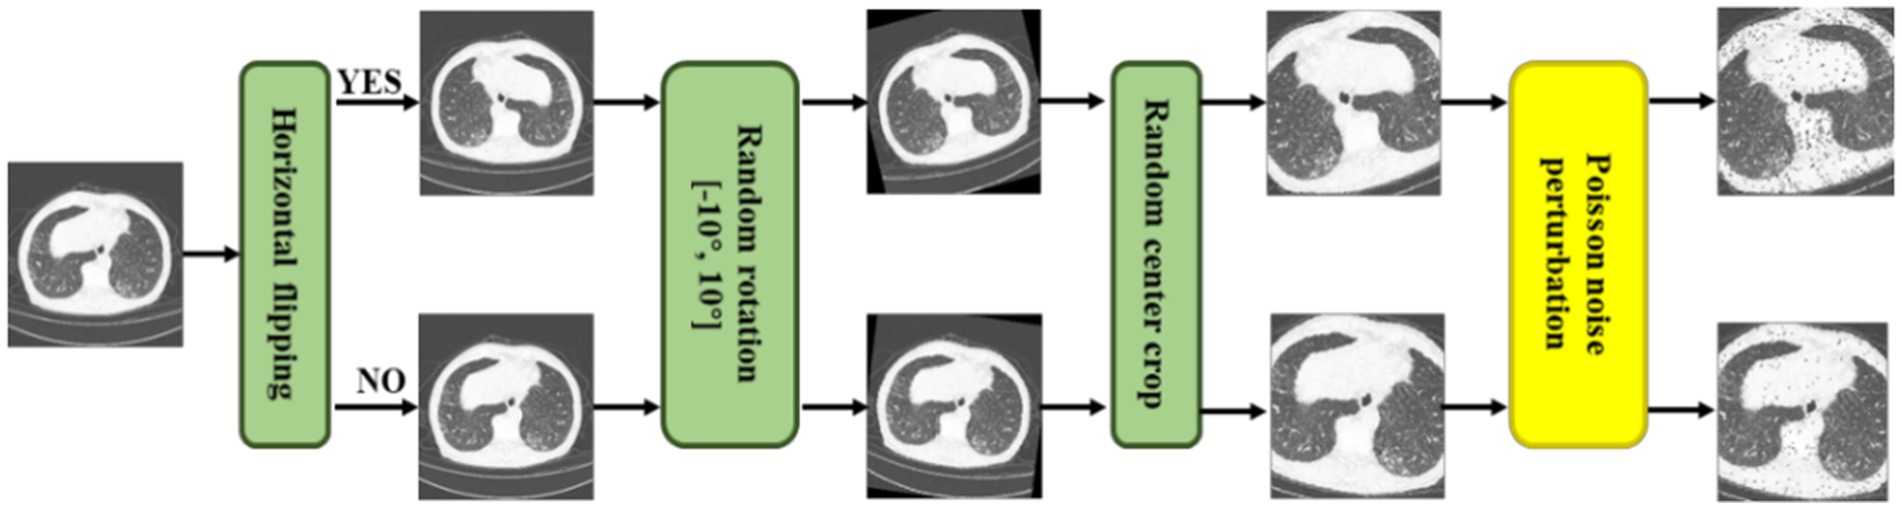
Figure 3. Illustrations of a series of CT augmentation methods, i.e., random horizontal flipping, random center crop, random rotation (10 degrees), and the proposed random Poisson noise perturbation.
Then, has to be processed with a logarithm and transform (iFanbeam) from the classical filtered back-projection (FBP) algorithm (38) to the image domain , as Eq. (2). Thus, we gained the Poisson noise CT image according to Eqs. (1, 2) as a more realistic data augmentation.
3.3 Overview of the proposed CoTP
Algorithm 1 Pseudocode of CoTP.
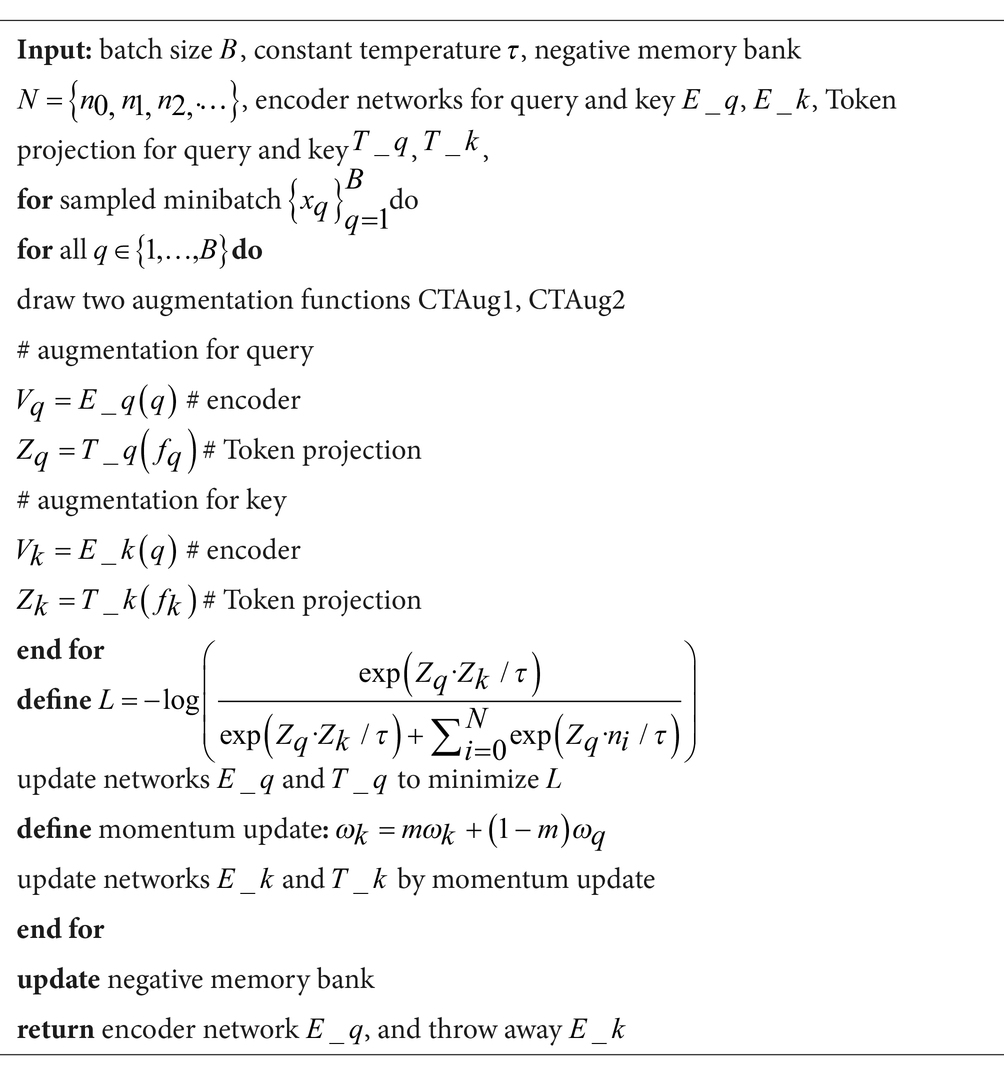
Algorithm 1 summarizes the proposed CoTP.
3.3.1 Feature encoder
As shown in Figure 4, we designed CoTP to learn global visual representations effectively from unlabeled CT images. Given a CT image, , we utilized two different augmentations to create two views of the same example, and . Then, we employed ResNet50 (23) which removed the entire global pooling and Multilayer Perceptron (MLP) parts as the feature encoder. The and are mapped via encoders (q) and (k), to generate visual representations and , respectively. Here, , , and are the length, width, and dimension of the feature map. The pseudocode of CoTP is shown in Algorithm 1.
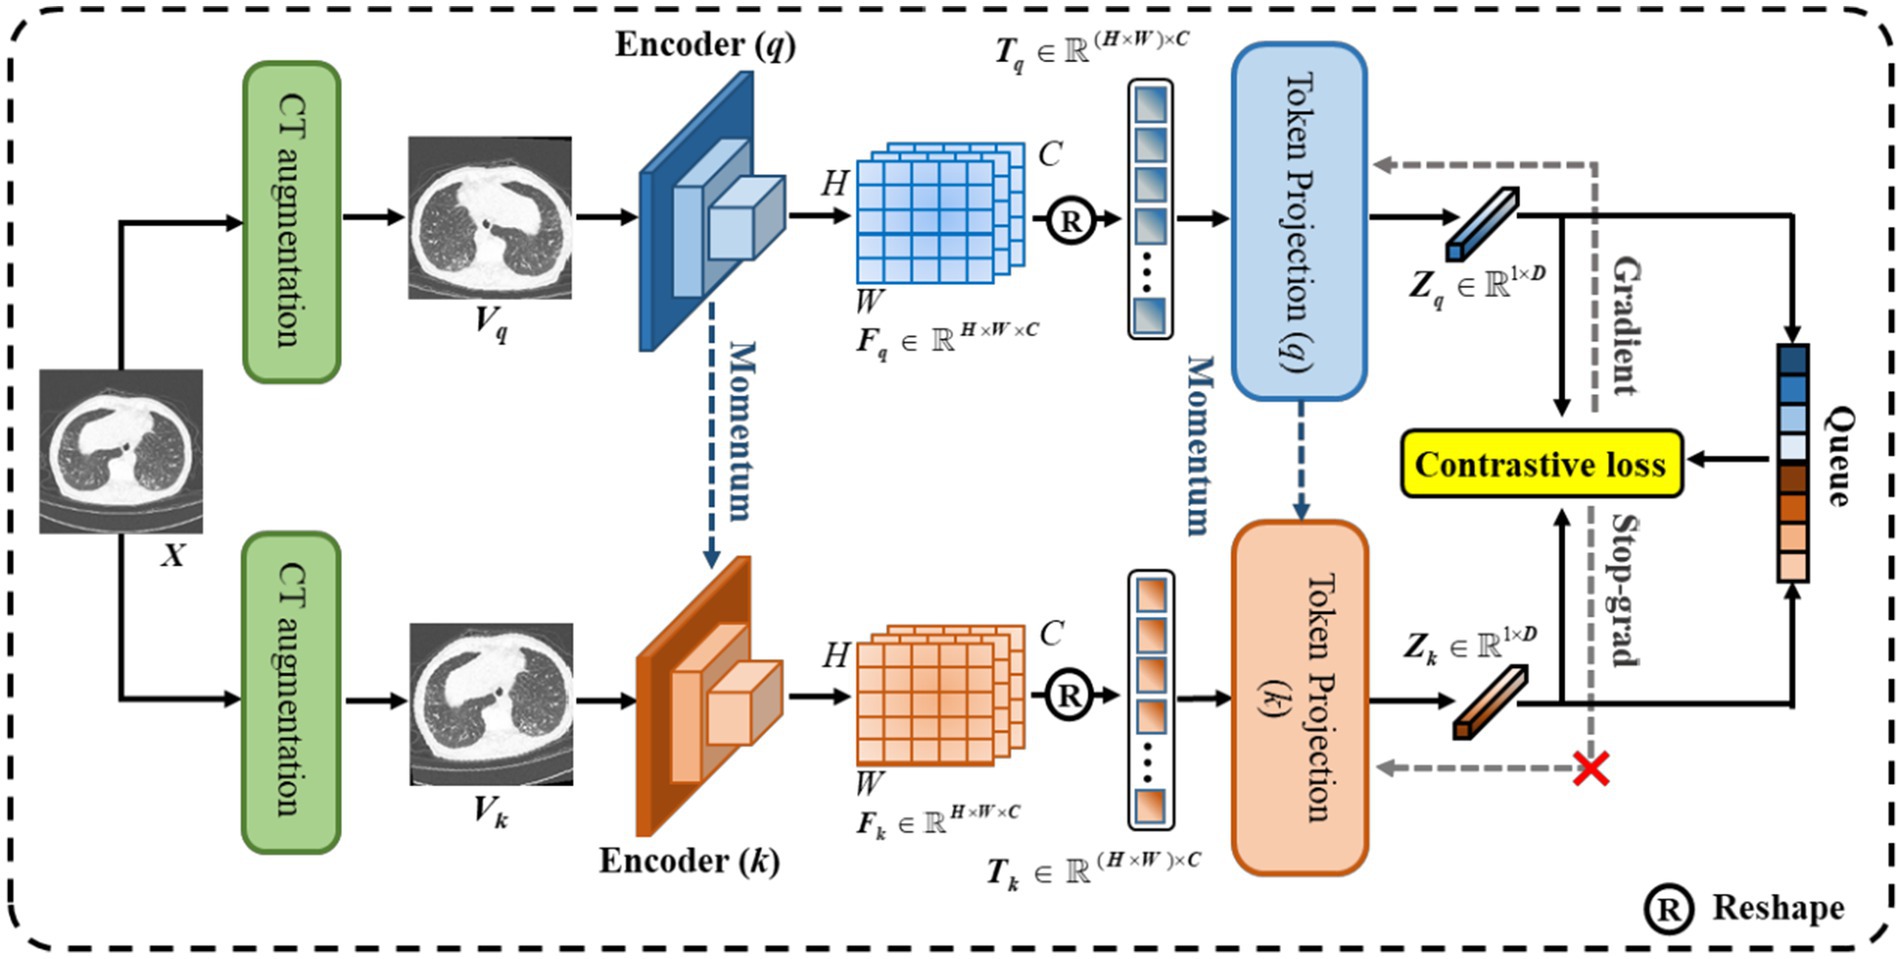
Figure 4. The overall architecture of the proposed CoTP.
3.3.2 Token projection
Traditional contrastive learning (17, 19) typically uses a global pooling operation and an MLP as a projection head to improve the visual representations. Innovatively, we designed a token projection instead of a traditional projection head, as shown in Figure 5.
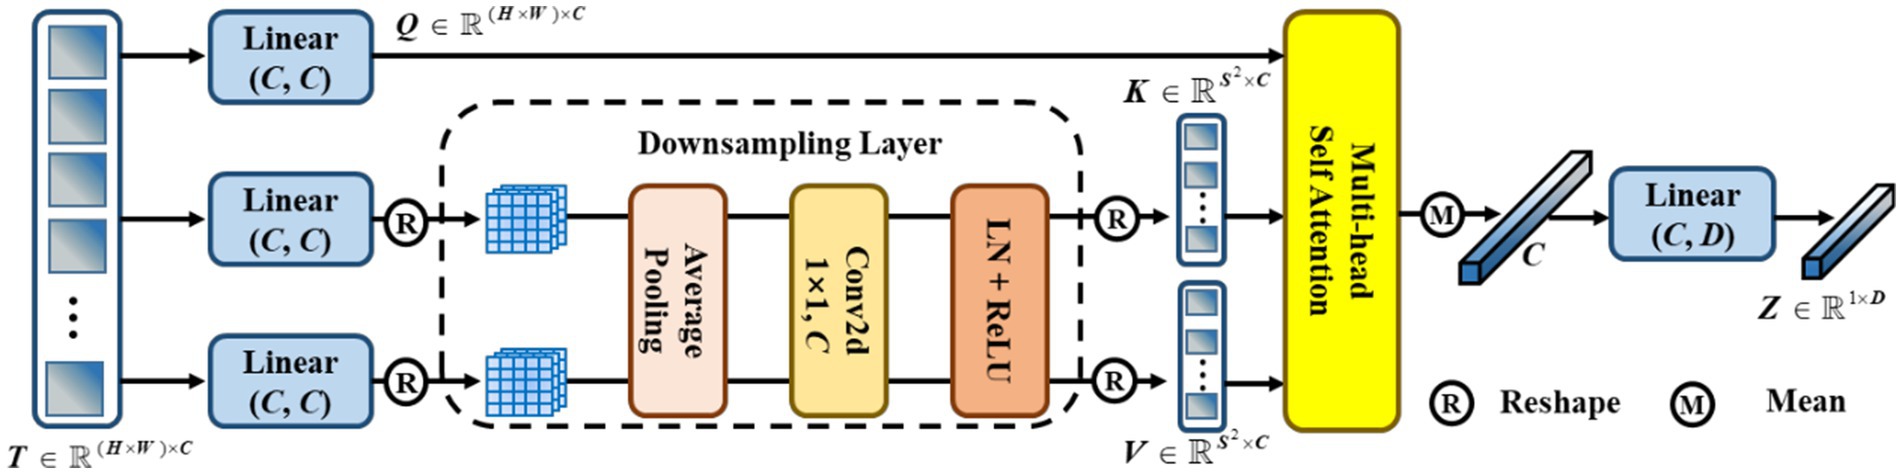
Figure 5. The pipeline of token projection. The downsampling layer is designed for the reduction of calculation by reducing the resolution of feature.
To begin with, we reshaped the feature to . Then, was passed through three different linear projections and yielded a query , a key , and a value . Furthermore, we performed average pooling with a pooling size of for and to reduce the cost of computation. Here, we set . After that, a convolution with 1 kernel size and 1 stride size was utilized to fuse the feature. Then, we gained the and after performing layer normalization (LN) and ReLU activation functions. Afterward, we performed multi-head self-attention (MHSA) on , , and , as shown in Eq. (3),
Then, we calculated the mean score of along the dimension of the column. Finally, we performed a linear projection to eliminate redundant features and obtain . In particular, we set the dimension .
3.3.3 Update the weights
To meet a large number of negative sample pairs and reduce the computing cost of Graphics Processing Unit (GPU), a memory bank was used to store the negative samples generated by the encoder (q), in advance. Hence, we obtained a set of encoded (k) samples . Out of all the encoded (k) samples in the set Ek for each encoded query , a single positive key was matched, while the remainder of the keys (negative keys) represented different images. A contrastive loss function is represented in Eq. (4) as follows, whose value is low when is close to its positive key and moves away from all other encoded (k) samples:
where τ is a temperature hyper-para (16), and the number of negatives is set at 32,256. We updated the weights of the encoder (q) and token projection (q) by back-propagation, while the weights of the encoder (k) and token projection (k) were updated by momentum update (18), as Eq. (5), where is 0.999 to update the weights slowly.
3.4 Subsequent fine-tuning
After CoTP pre-training, we took out the feature encoder with pre-trained weights, followed by a max pooling and average pooling (MAP) head, as shown in Figure 6. First, we performed a convolution and reshaped the feature to . Here, C denotes the class of categories. Afterward, we calculated the mean score and maximum score of the T along the dimension of the column, respectively. Finally, a Hyper-parameter was employed to combine the mean score and maximum score , as Eq. (6).
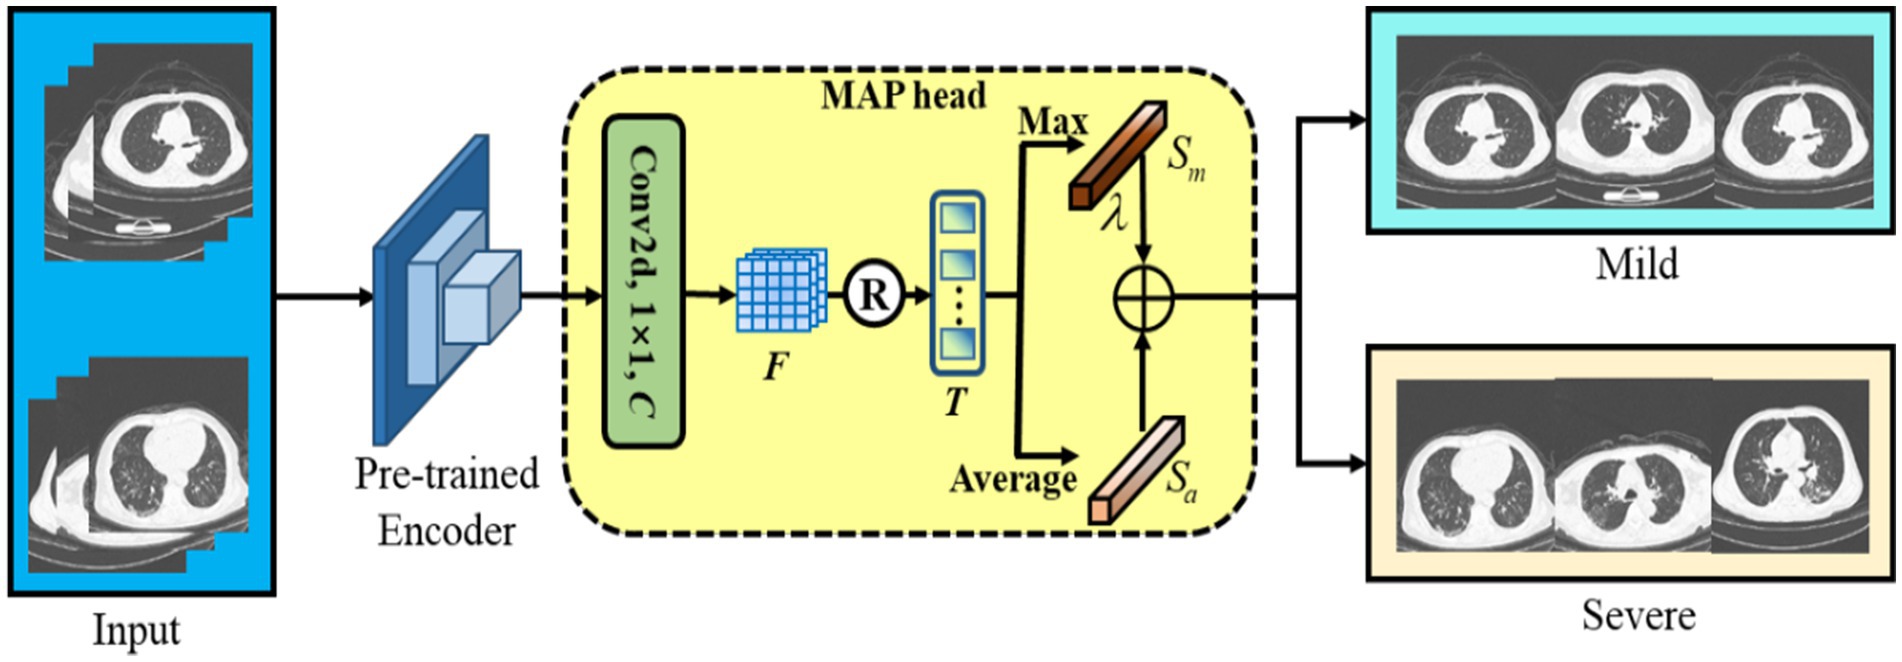
Figure 6. The backbone of the subsequent fine-tuning. We leverage max pooling head and average pooling head to improve classification performance.
It is noteworthy that max-pooling can be considered as class-specific attention that can attain different space areas occupied by objects of different categories. In particular, we performed a simple cross-entropy loss to fine-tune the baseline with a few-shot labeled CT images.
3.5 Implementation details
As shown in Table 3, we utilized Python 3.7 and Pytorch 1.7.0 with PyCharm as our Integrated Development Environment (IDE), running on a PC equipped with Intel(R) i9-10940X CPU and 4 Nvidia 1,080 Ti GPUs with 48 GB memory. At the CoTP pre-training stage, Stochastic Gradient Descent (SGD) was employed as our optimizer, while the weight decay was le-4 and the momentum was 0.9. The mini-batch size refers to the number of examples (data points) that are processed together in one iteration of training in deep learning. Here, we set mini-batch size as 128, and the learning rate is initialized to 0.03. Followed by He et al. (18), we train for a total of 200 epochs, and the learning rate multiplied by 0.1 at 120 and 160 epochs.
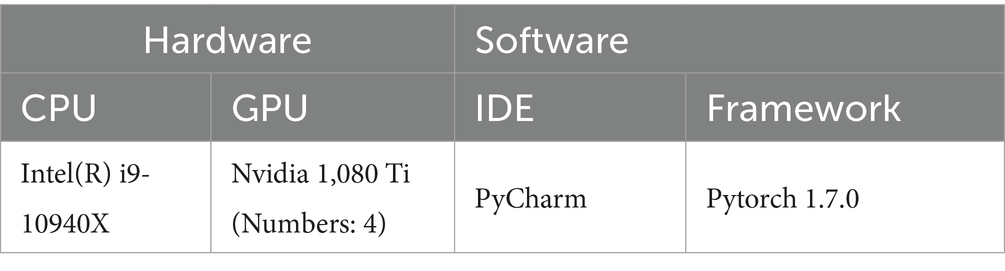
Table 3. The working environment.
At the subsequent fine-tuning stage, we utilized AdmW with le-3 weight decay as the optimizer. The mini-batch size refers to the number of examples (data points) that are processed together in one iteration of training in deep learning. Here, we set mini-batch size as 32, and the learning rate is initialized to le-4.
4 Results
The classification performances of the proposed methods were evaluated in terms of the standard metrics, such as accuracy (ACC), sensitivity (SEN), and precision (PRE) discussed in Eq. (7)–(9), where P, N, TP, TN, and FP denote positives, negatives, true positives, true negatives, and false positives, respectively.
In addition, the mean AUC (39) was employed to evaluate the ability of the model to discriminate between different classes. Furthermore, we also used a non-parametric bootstrap (40) to estimate the variability around model performance. We performed a total of 500 bootstrap sampling with 300 cases from the test set.
4.1 Datasets
The study was approved by Zhongshan Hospital, Fudan University in Shanghai, China. All the chest CT scanning images in the Omicron dataset were selected from a retrospective cohort of adult Omicron patients hospitalized in Shanghai Geriatrics Center from March to July 2022. Chest CT examination was performed as part of the patient’s routine clinical care at the time of admission. The eligibility criteria were as follows: (1) having intact basic information to be retrieved (names, gender, ages, diagnosis, and severity), and (2) having CT scanning on admission. Patients with underlying lung diseases such as chronic obstructive pulmonary disease (COPD) and bronchiectasis were excluded. All patient scans were downloaded in the DICOM image format. The thickness of the CT image was 5 mm.
The diagnosis and classification of severity were based on the Diagnosis and Treatment Scheme of Pneumonia Caused by Novel Coronavirus of China (the ninth version). (National Health Commission of China. The guidelines for the diagnosis and treatment of new coronavirus pneumonia (version 9). Accessed July 25, 2023 https://www.gov.cn/xinwen/2022-06/28/content_5698168.htm). Adults were considered severe Omicron pneumonia if they met any of the following criteria: (1) tachypnea with a respiratory rate ≥ 30 breaths/min; (2) oxygen saturation (at rest) ≤ 93%; (3) PaO2/FiO2 ≤ 300 mmHg; (4) radiographic progression of more than 50% of the lesion over 24–48 h; or (5) respiratory failure, shock, or other organ failures.
Following the above standards, we retrospectively collected high-resolution CT images of 73 patients with mild Omicron pneumonia and 56 patients with severe Omicron pneumonia. The Omicron dataset and demographic characteristics of patients are detailed in Table 4. Initially, we converted and exported the DICOM files of Omicron patients into JPEG formats with 1,500 HU window width and 750 HU window level. After that, we obtained 50,500 unlabeled CT images with the size of for CoTP pre-training.
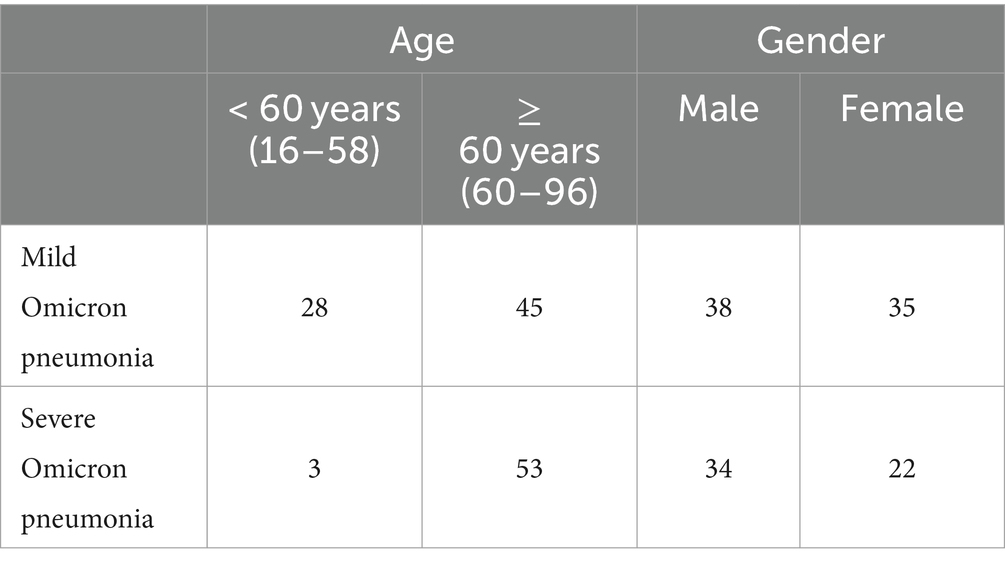
Table 4. Demographics and baseline characteristics of patients in the Omicron dataset.
Two experienced radiologists were selected, and they first labeled 2,742 CT images from the Omicron dataset. Then, we used the remaining data for CoTP pre-training. Note that the labeled CT images were excluded from the CoTP pre-training. The distribution of training and testing set in the Omicron dataset is shown in Table 5. In addition, we utilize the external SARS-CoV-2 CT-scan dataset presented by Soares et al. (21) to evaluate the transferability of CoTP. As shown in Figure 7, 1,252 CT scans were positive for SARS-CoV-2 infection (COVID-19), while 1,229 CT scanning for patients non-infected by SARS-CoV-2.
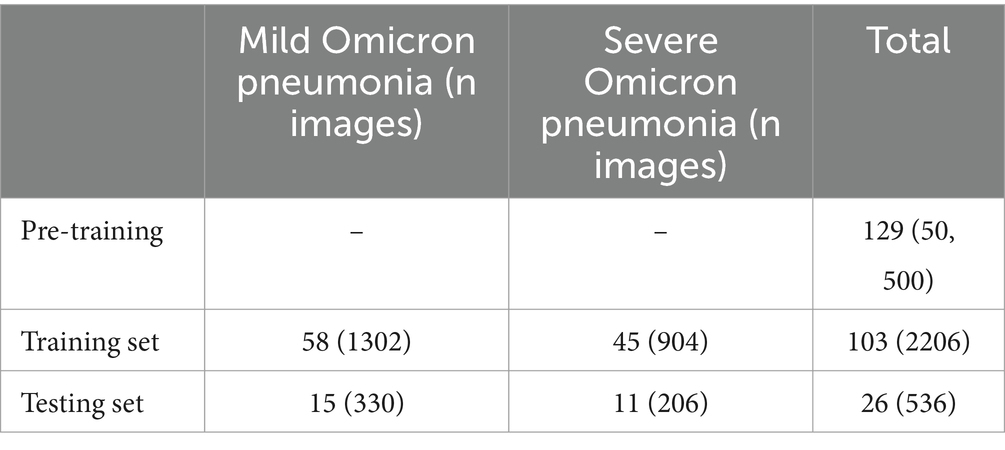
Table 5. Distribution of training and testing set in Omicron dataset.
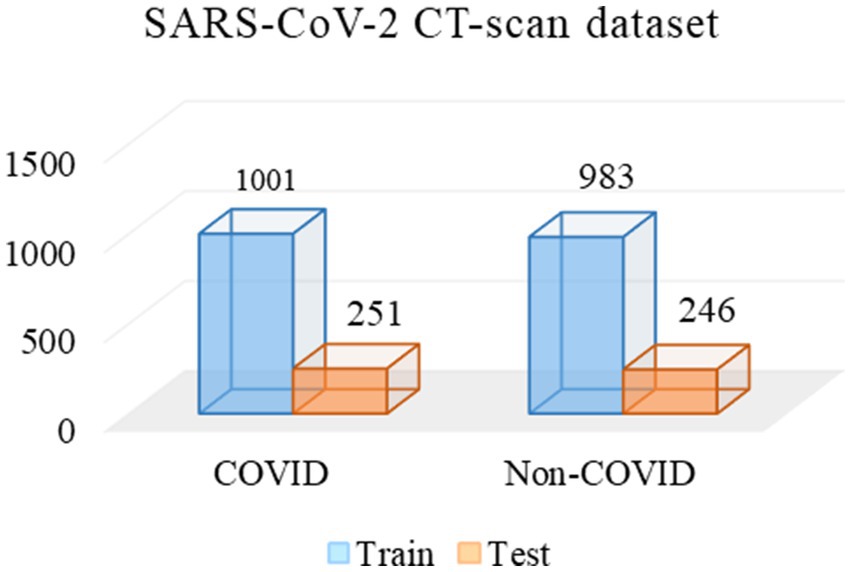
Figure 7. Distribution of training and testing set in SARS-CoV-2 CT-scan dataset.
4.2 Transfer performance of CoTP representations for omicron pneumonia diagnosis
To assess the effectiveness of the visual representations extracted by CoTP, we employed VGG16 (41), DenseNet121 (42), and ResNet50 (23), as our backbones and selected six types of pre-training methods for comparison. As depicted in Table 6, the non-pre-training method’s weights were randomly initialized, while the supervised pre-training method underwent pre-training on ImageNet-1k (43). In addition, we presented a more comprehensive comparison with the existing contrastive methods, such as SimCLRv1 (15), MoCo-v1 (18), SimCLRv2 (17), and MoCo-v2 (19) to prove the effectiveness of the proposed CoTP method. We evaluated the classification performance of the model using mean AUC, accuracy (ACC), sensitivity (SEN), and precision (PRE) of each infection type. Based on Table 6 and Figure 8 we gained the following observations: (1) Pre-training method plays an important role in improving model performance. The ResNet50 with supervised learning on ImageNet-1 k can achieve more 8.02% ACC, 10.43% SEN, and 9.71% PRE than that without pre-training. (2) Our CoTP pre-training method outperforms the supervised method and the contrastive learning methods, which gains 83.54, 91.32, and 92.35% ACC by VGG16, DenseNet121, and ResNet50, respectively. (3) Our CoTP achieves more 8.07, 7.37, 4.11 and 2.56% AUC than the SimCLRv1 (15), MoCo-v1 (18), SimCLRv2 (17), and MoCo-v2 (19) by ResNet50, respectively.
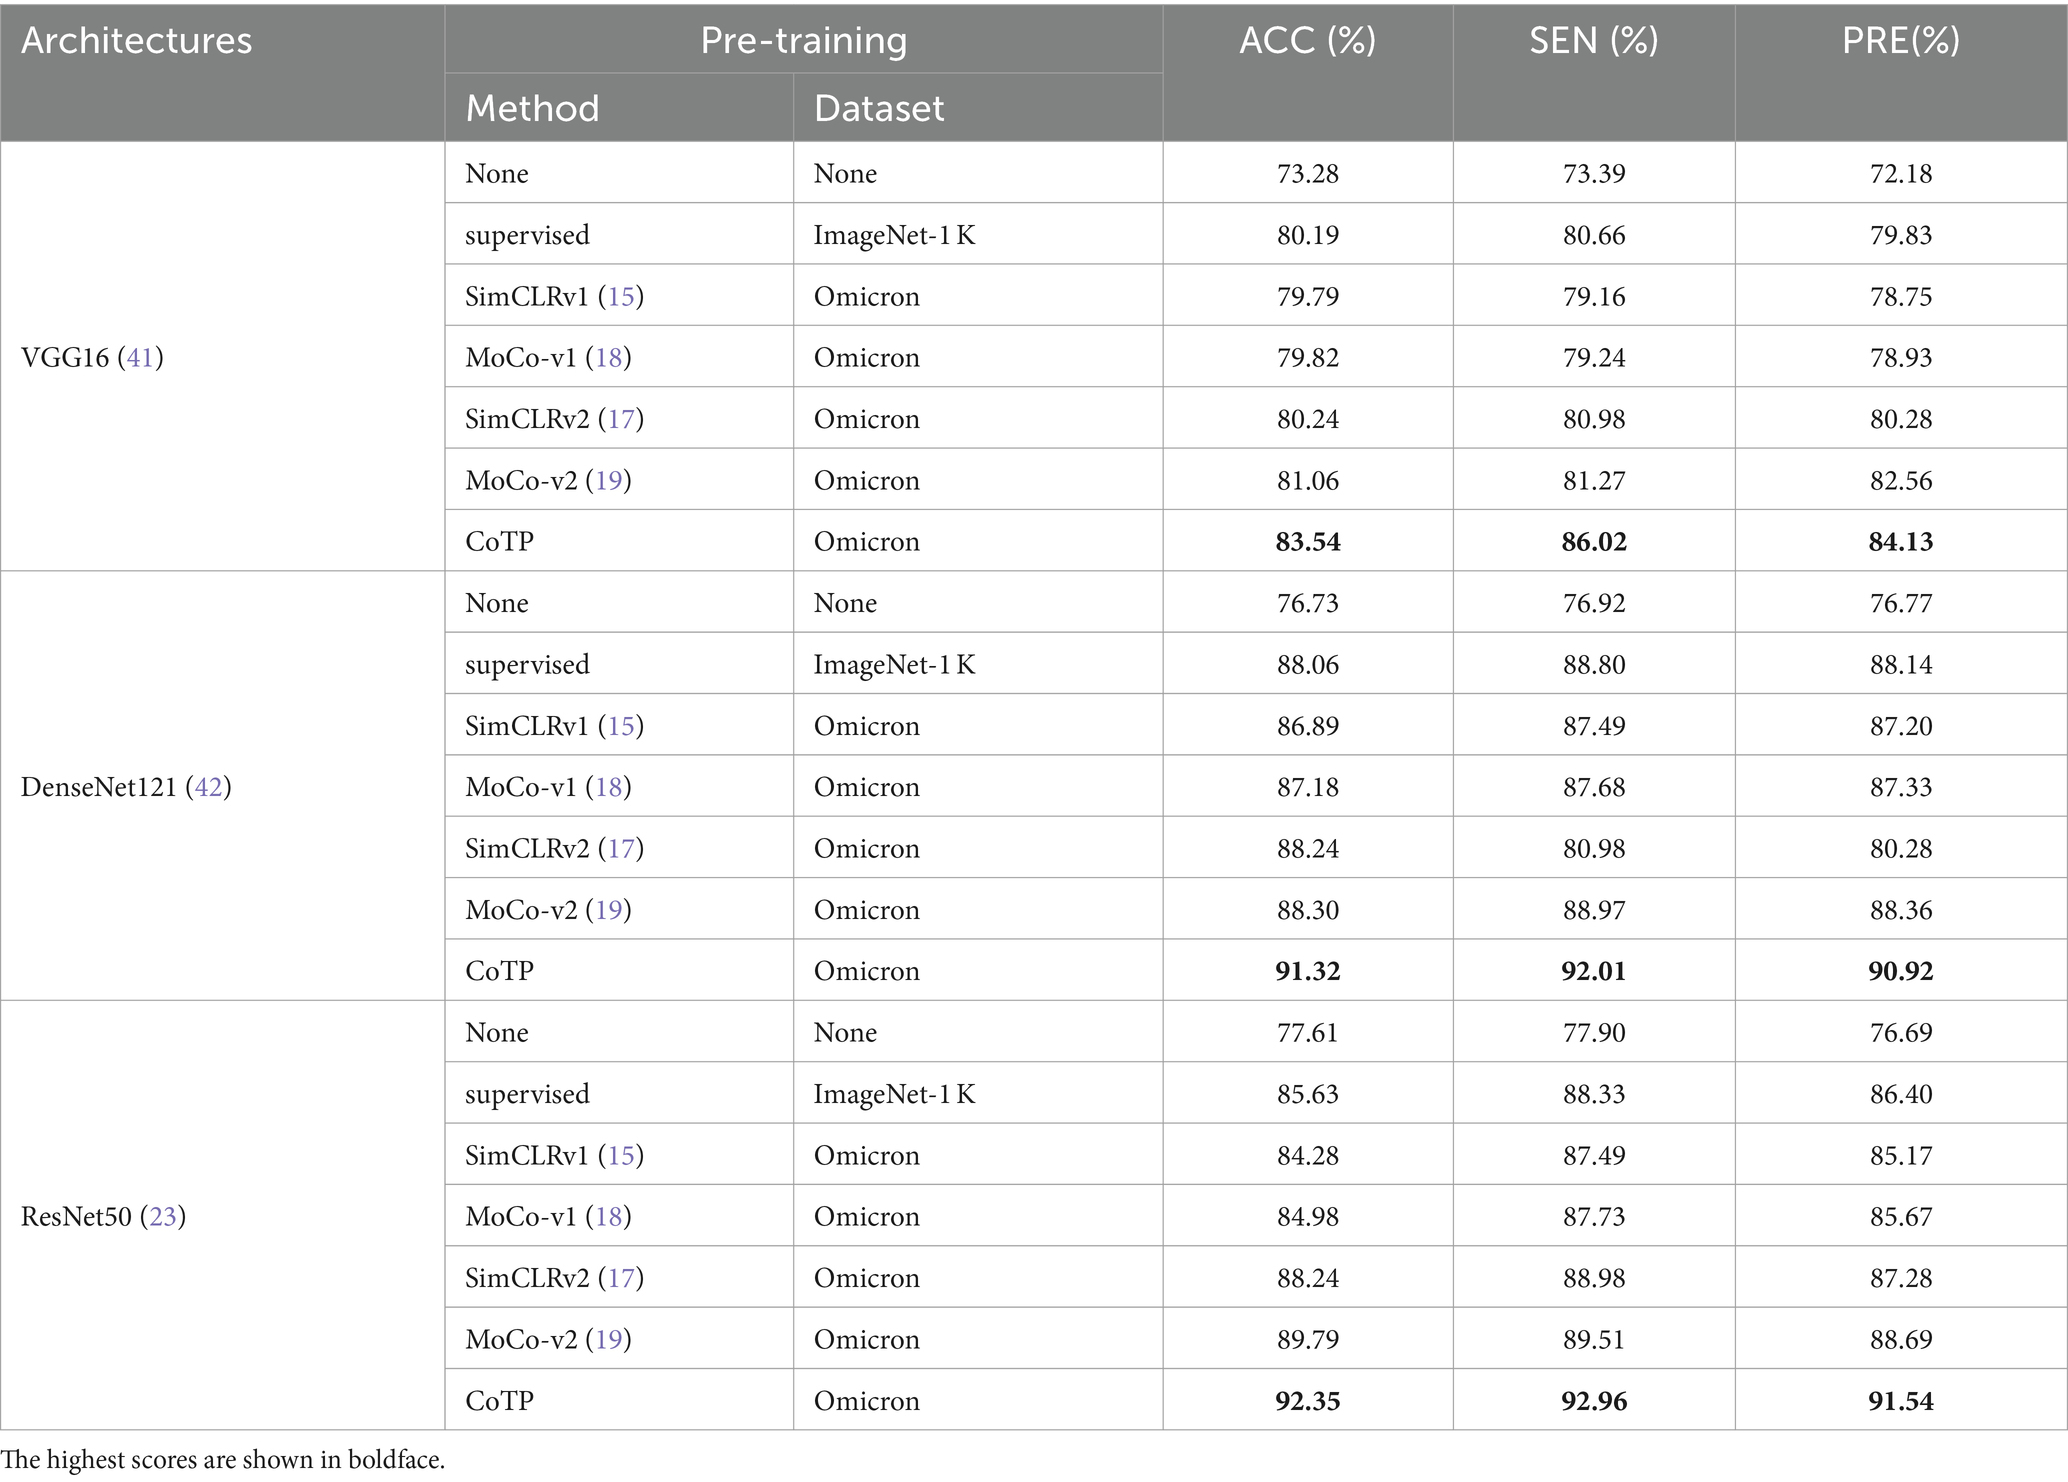
Table 6. The transfer results of Omicron pneumonia diagnosis.
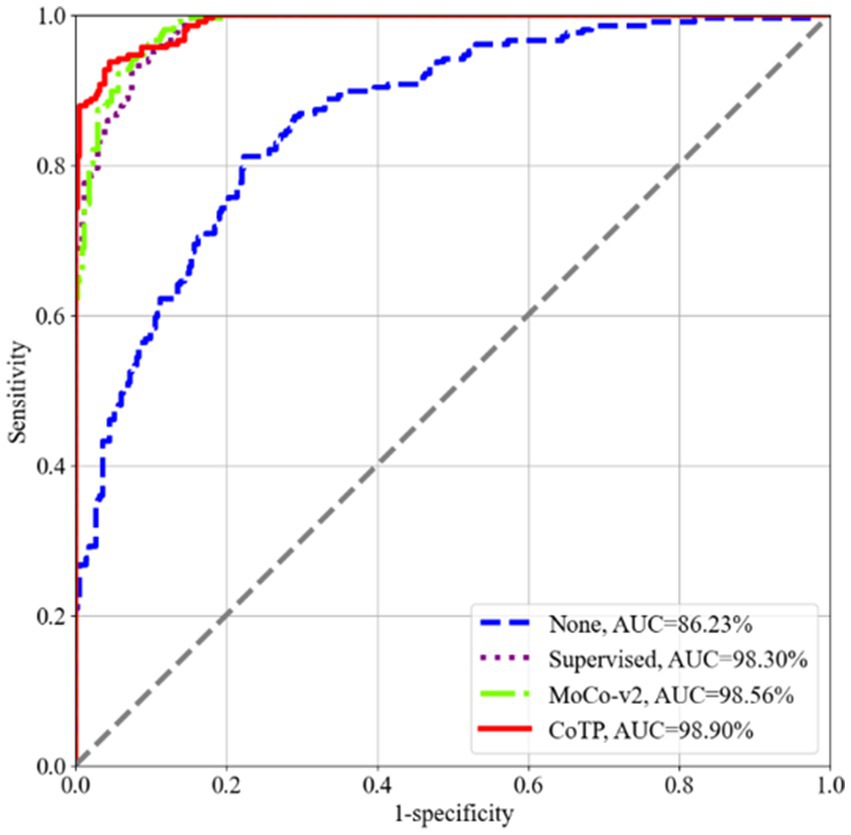
Figure 8. ROC curves of the four types of pre-training methods using ResNet50 on the Omicron dataset. Our CoTP achieves the highest 98.90% AUC.
As shown in Figure 9, we measured the dispersion of the test set using a box plot and performed statistical significance testing using a paired t-test. From this, we observed that CoTP significantly outperforms the non-pre-training method (p-value < le-5) and the supervised method (p-value < le-5), while performing slightly better than contrastive learning MoCo-v2 (19) (p-value < le-4). Moreover, it can be seen that our CoTP method had better robustness than other types of pre-training methods since the distribution of AUCs was more concentrated.
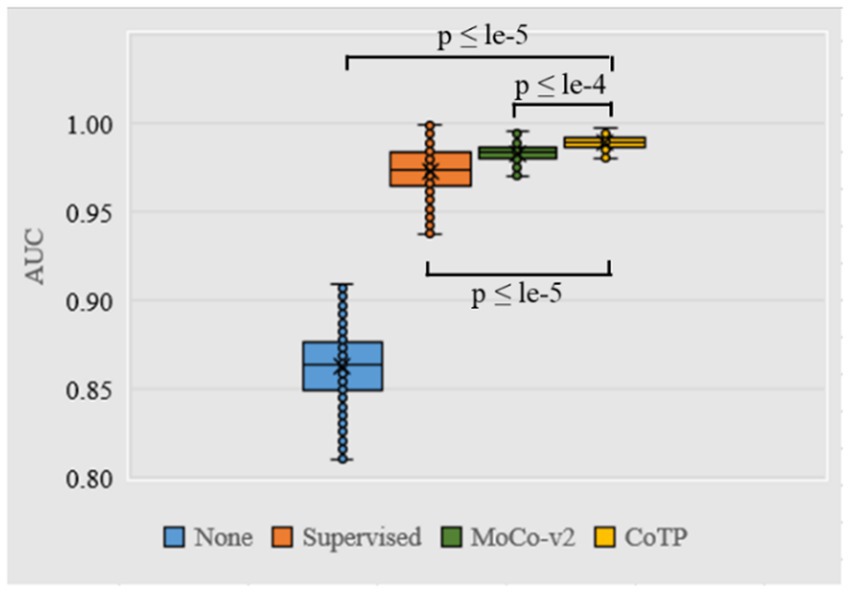
Figure 9. Box plot of AUC values produced by different pre-training methods using ResNet50 based on the Omicron dataset. We use 500 bootstrap samples with 300 cases to calculate the AUC which can evaluate the robustness of the model.
4.3 Transfer benefit of CoTP pre-training on an external SARS-CoV-2 CT-scan dataset
We conducted experiments to test whether CoTP pre-trained chest CT representations acquired from a source dataset (Omicron dataset) transfer to an external dataset, the SARS-CoV-2 CT-scan dataset. Table 8 demonstrates the classification results of the previous methods (27, 28, 44–50) and six types of pre-training methods based on ResNet50, while the confusion matrices for four of them are shown in Figure 10. Based on these various experimental results, we can draw the following conclusions: (1) Visual representations learned from CoTP have better transferability in downstream tasks than those from ImageNet pre-training. (2) By taking advantage of the ability of our CoTP pre-training, our model outperforms all other contrastive methods on all metrics with a large margin in discriminating between COVID and non-COVID from CT images. For example, the ACC score of CoTP increased by 7.25 and 1.01% comparing the non-pre-training and MoCo-v2 pre-training, respectively.
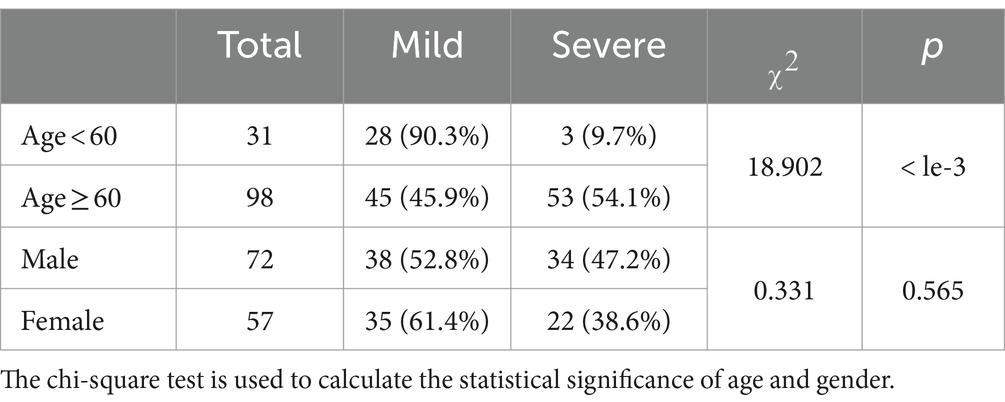
Table 7. Statistical significance testing for age and gender in the Omicron dataset.
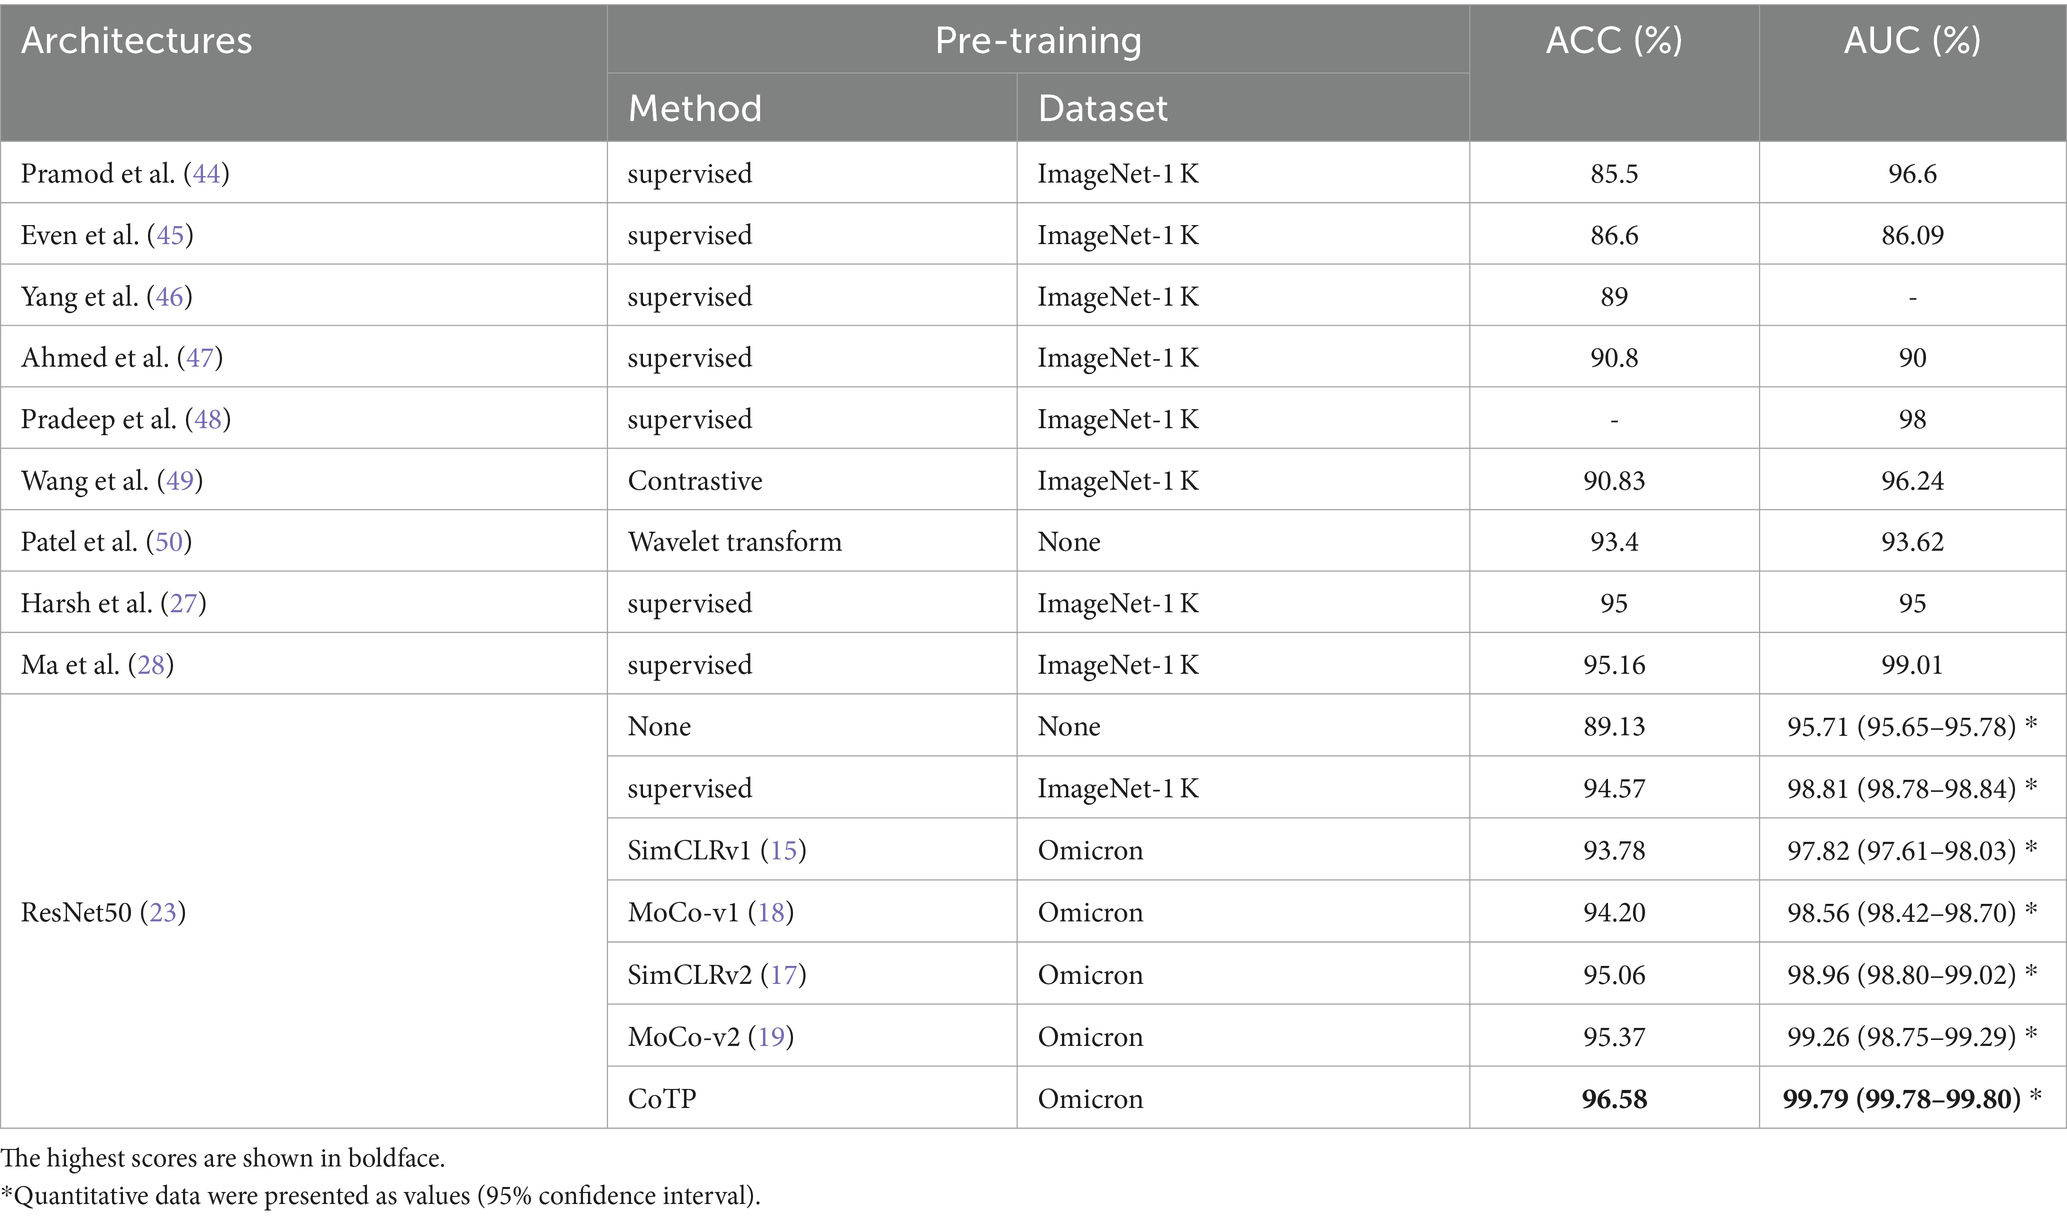
Table 8. The performance of MoCo-TP pre-training on the SARS-CoV-2 CT-scan dataset.
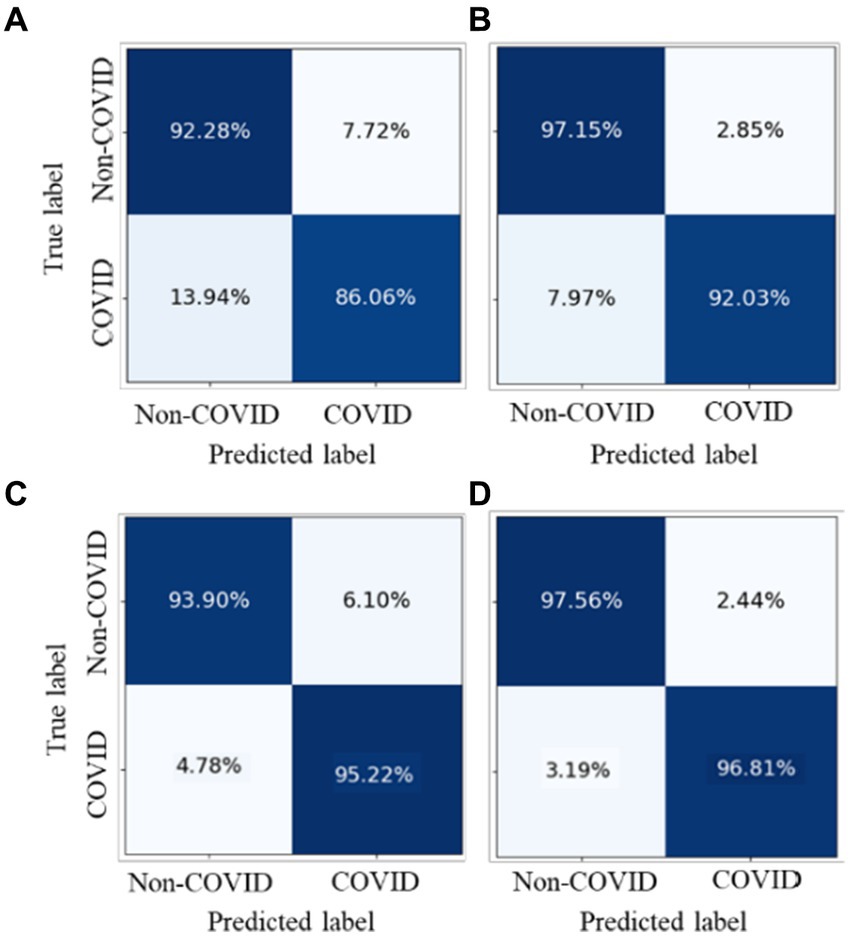
Figure 10. Comparison of the performance of four types of pre-training methods in identifying COVID-19 pneumonia from CXR images.
5 Discussion
Recently, contrastive learning methods have achieved satisfactory results on natural image classification tasks, which can leverage unlabeled data to generate a pre-trained model. However, the existing contrastive mechanisms have scope for improvement for Omicron pneumonia diagnosis from chest CT images due to their inability to mine global features and lack of appropriate augmentations for chest CT images. Therefore, we proposed a novel contrastive learning with token projection, namely CoTP, for improving global visual representation. Furthermore, we leveraged a new data augmentation approach, random Poisson noise perturbation (PNP) to simulate the noise in CT images which is more realistic. In this section, we designed comprehensive ablation studies to assess the effectiveness of each component in the CoTP network.
5.1 Statistical significance testing for baseline characteristics of patients
First, we utilized the chi-square test for statistical significance test for baseline characteristics of patients, including age and gender. Based on Table 7, we can see that there is no significant difference in gender (p = 0.597), while age shows a statistical significance (p = 0.000). It is noted that we need to pay more attention to elderly patients since they are more vulnerable to severe Omicron pneumonia.
5.2 Effects of using different encoders on CoTP performance
Then, we leveraged several encoders VGG16 (41), ResNet50 (23), DenseNet121 (42), and Swin-B (51) for performance comparison, as shown in Figure 11. The results indicated that both convolutional neural networks (CNN)-based encoders and transformer-based encoders exhibited higher AUC and better robustness after pre-training with CoTP. Moreover, it can be seen that there are significant differences between pre-training methods (i.e., P ≤ le-5 between supervised pre-training method and CoTP when using ResNet50 as a backbone).
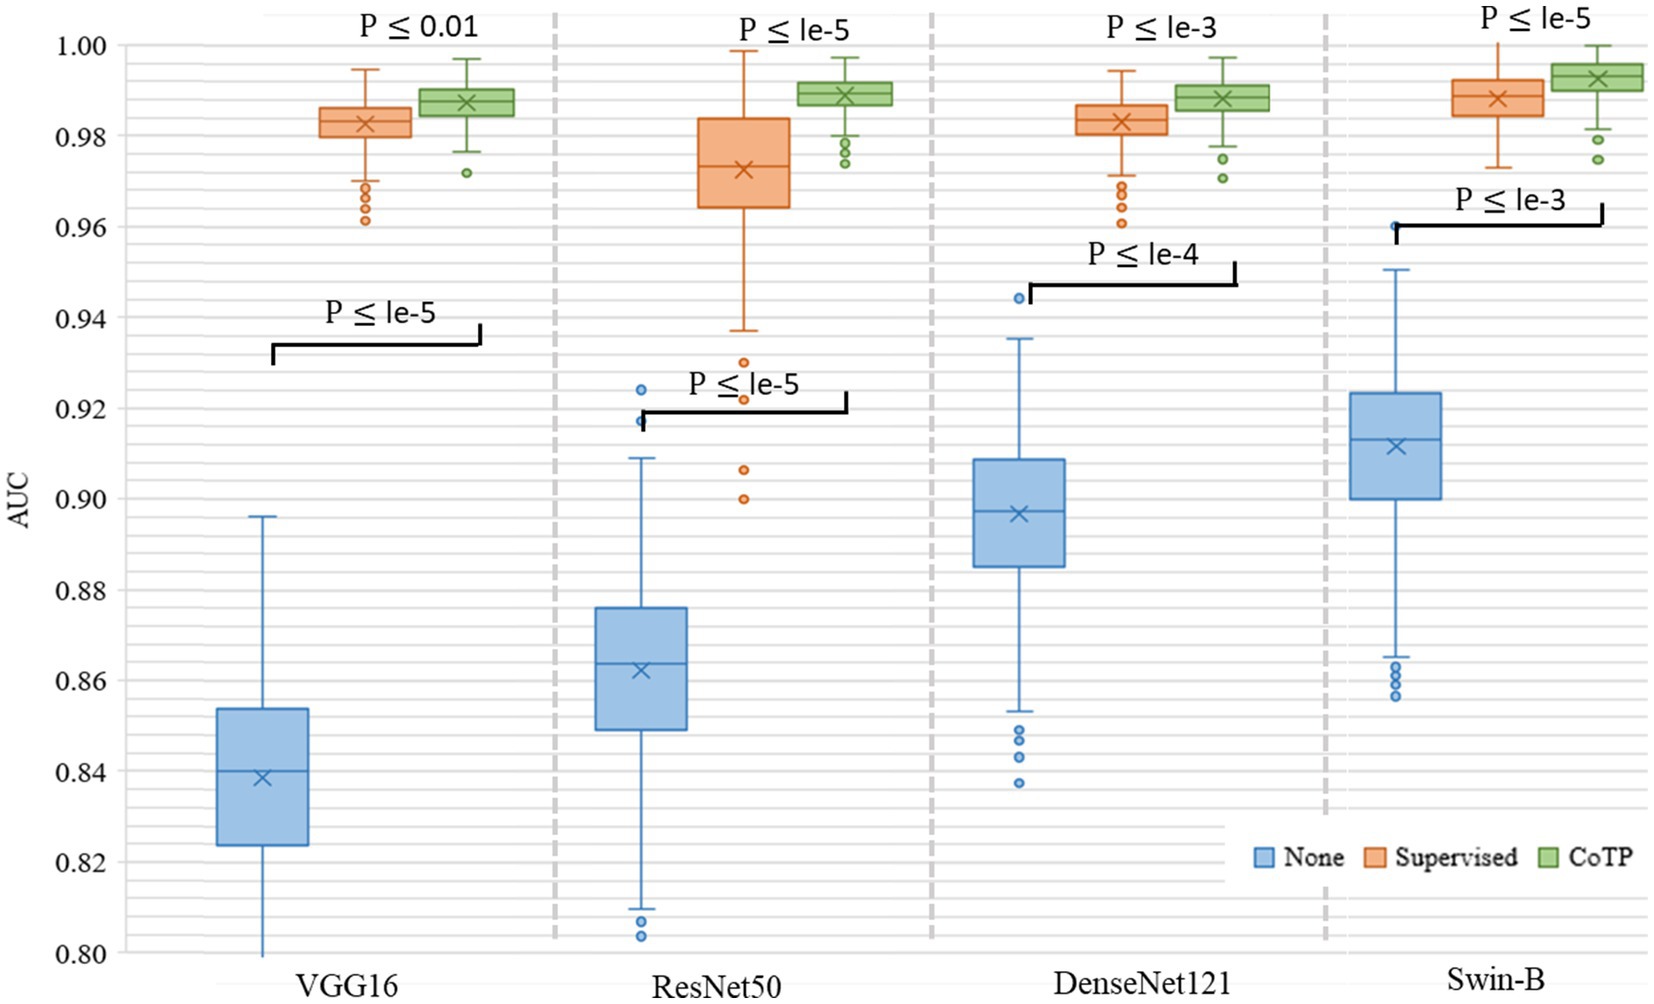
Figure 11. Box plot of AUC values produced by different encoders and types of pre-training methods based on the Omicron dataset. We use 500 bootstrap samples with 300 cases to calculate the AUC which can evaluate the robustness of the model.
5.3 Impact of the random Poisson noise perturbation on CoTP performance
In addition, we investigated the impact of the proposed Poisson noise perturbation (PNP) during the data augmentation process. Therefore, we compared the model performance with and without the PNP and also compared it with the random Gaussian noise perturbation (GNP). From Table 9, we found that PNP affected the performance. For example, the VGG16 (41) with PNP could achieve an accuracy of 0.79%, a sensitivity of 0.84, and a precision of 0.88%, which are higher than those without PNP. On the contrary, GNP could not significantly improve the performance of the model. The PNP could simulate the noise CT images, which can improve the generalization of the model.
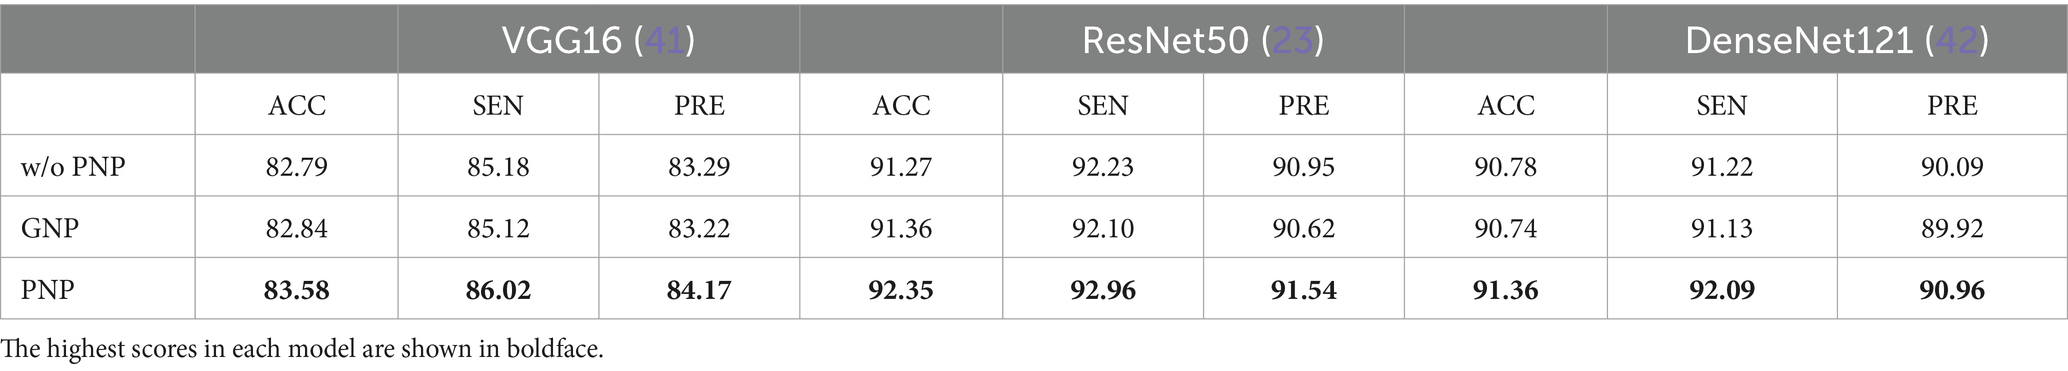
Table 9. Impact of the random Poisson noise perturbation on model performance based on the Omicron dataset.
5.4 Impact of the MAP head on subsequent fine-tuning performance
To evaluate the ability of the MAP head on subsequent fine-tuning performance, the traditional classification (TC) head, which typically consists of a global pooling operation and a fully connected layer, was used for comparative experiments on the SARS-CoV-2 CT-scan dataset. Here, we used ResNet50 (23) pre-trained by our CoTP as the backbone. Based on Figure 12, we found that the proposed MAP head outperforms the TC head and achieved the best overall performance with = 0.02.
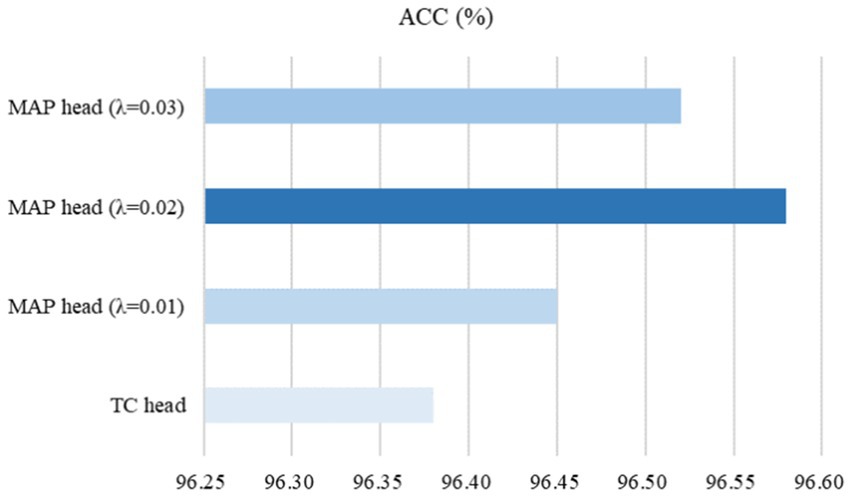
Figure 12. Effect of the MAP head on subsequent fine-tuning performance.
5.5 Impact of the training data size
To study the transferable ability of the model under limited labels during the fine-tuning phase, we experimented with 10, 25, 50, 75, and 100% training data size on the SARS-CoV-2 CT-scan dataset. As shown in Figure 13, we illustrated three types of pre-training methods based on ResNet50 (23). The weight of none pre-training method was randomly initialized, and the supervised pre-training method was pre-trained on ImageNet. From the results, it can be inferred that the expected trend of improving ACC is with an increase in labeled data for the fine-tuning phase. Moreover, it is promising to observe that even with a 50% training data size, the CoTP asymptotically approaches the fully supervised (100% training data size) setup.
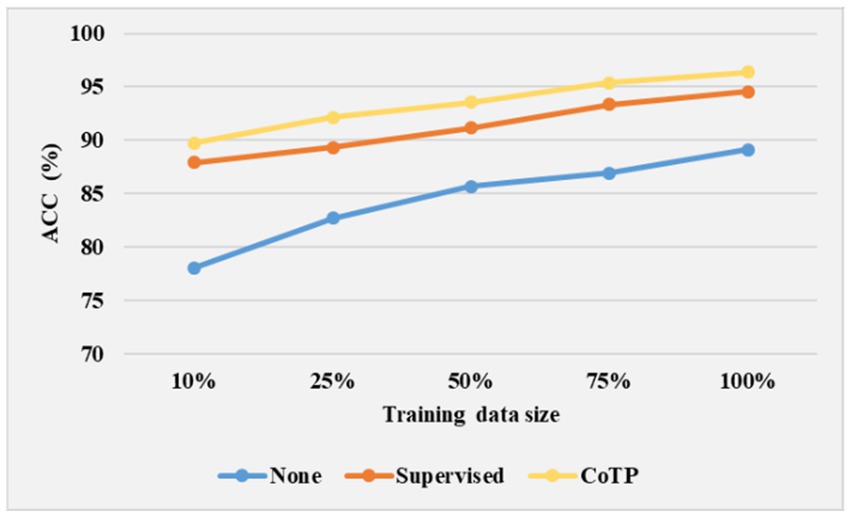
Figure 13. Effect of training data size on model performance.
5.6 Visualization of grad-CAM heat map
Finally, we illustrated Grad-CAM (52) visualizations of the features learned by different pre-training methods based on ResNet50 in Figure 14. The higher response was highlighted in red while the lower one was demonstrated in blue. The expert annotation of the infected regions was indicated by a red dotted circle. As can be seen, the heatmaps generated by non-pre-training method are fuzzy and blurred. In addition, the heatmaps yielded by the supervised pre-training method focused on the edge areas of CT images. On the contrary, our CoTP learned more features that focus on the infection region, which can improve the classification accuracy in comparison with approaches.
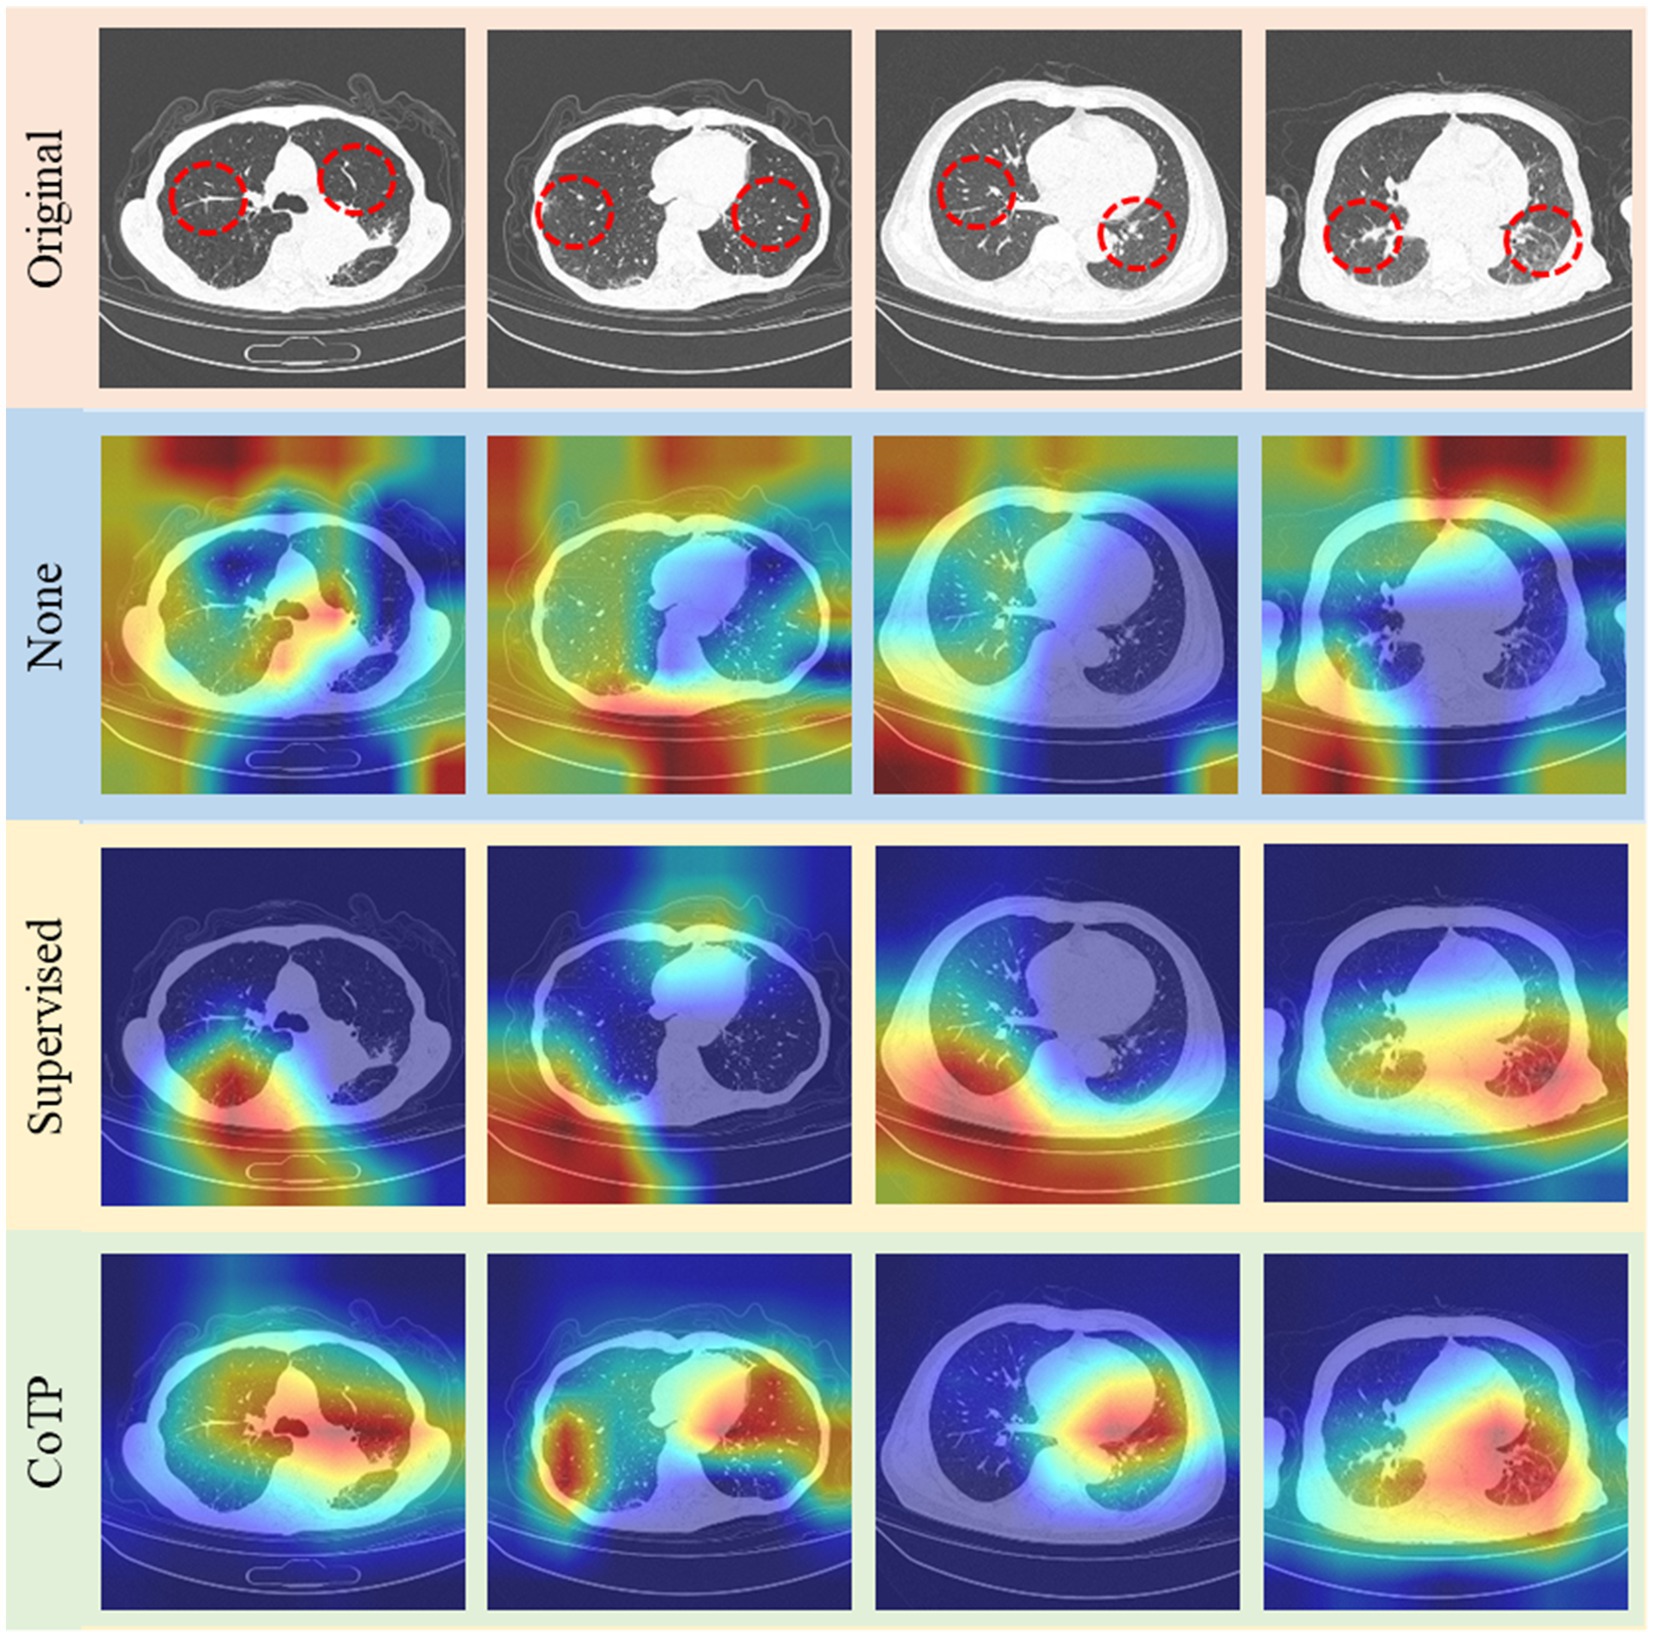
Figure 14. Grad-CAM visualizations of the features learned by different methods. The top row shows the original image set, followed by non-pre-training, pre-training with ImageNet, and CoTP.
5.7 Comparison of inference efficiency
To assess the inference efficiency, we calculated the pre-training time and parameters of MoCo-v1 (18), SimCLRv1 (15), MoCo-v2 (19), and our CoTP on the Omicron dataset. As shown in Table 10, we obtained the following observations: (1) The parameters of the methods are nearly identical. MoCo-v2 (19) adds a simple linear projection based on ResNet50 (23). Meanwhile, our CoTP included an efficient token projection in addition to ResNet50 (23). (2) The training time of SimCLRv1 (15) is the shortest among the methods because it does not utilize a memory bank. (3) Although our CoTP slightly exceeds other methods in terms of training time and parameters, it achieves the highest accuracy of 92.35% and significantly outperforms the other methods.
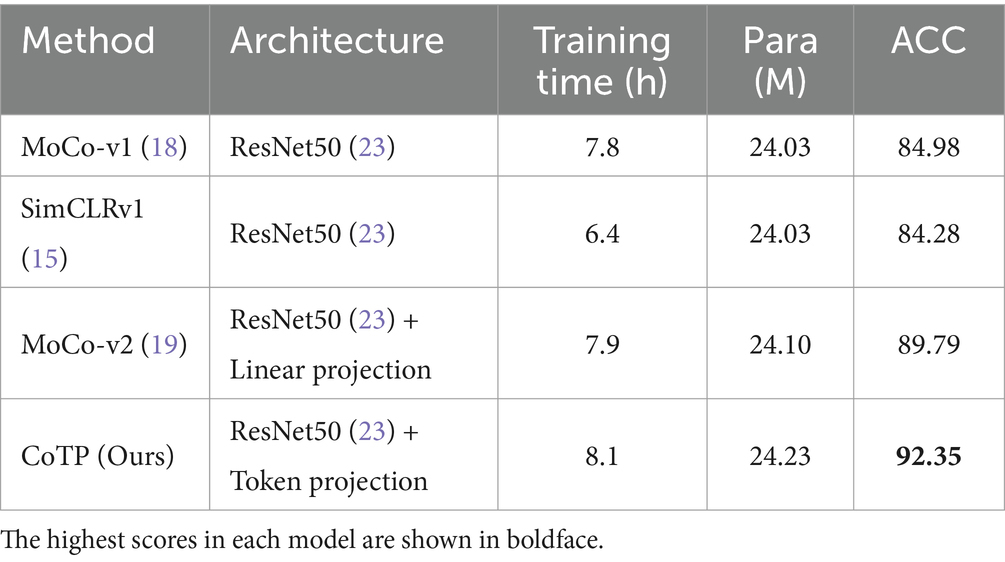
Table 10. Comparison of model efficiency on the Omicron dataset.
6 Conclusion
The existing contrastive mechanisms have scope for improvement for Omicron pneumonia diagnosis from chest CT images due to their inability to mine global features and lack of appropriate augmentations for chest CT images. Therefore, we proposed a novel contrastive learning model with token projection, namely CoTP, for improving few-shot Omicron chest CT image diagnostic quality. Specifically, we designed the token projection to extract the global visual representation from unlabeled CT images. Furthermore, we leveraged random Poisson noise perturbation to simulate the noise CT images as a novel data augmentation. In addition, the MAP head which can obtain different spatial regions occupied by objects of different categories was employed to improve classification performance for subsequent fine-tuning. Extensive experiments on collected datasets demonstrated that our CoTP can provide high-quality representations and transferable initializations for CT image interpretation. In the future, we plan to design more effective pretext tasks and apply the proposed method to more medical image analysis tasks. For image segmentation and edge detection, we can employ the pre-trained encoder as a feature extraction, and then add a segmentation head or a detection head.
Data availability statement
The data analyzed in this study is subject to the following licenses/restrictions: The SARS-CoV-2 CT-scan dataset (21) is available online. Omicron data that support the findings of this study are available from the corresponding author, YZ, upon reasonable request. Requests to access these datasets should be directed to zhuyu@ecust.edu.cn.
Author contributions
XJ: Writing – review & editing, Writing – original draft, Software. DY: Writing – review & editing, Supervision. LF: Writing – review & editing, Data curation. YZ: Writing – review & editing, Writing – original draft, Visualization, Validation, Methodology. MW: Writing – review & editing, Formal analysis, Data curation. YF: Writing – review & editing, Resources, Data curation. CB: Writing – review & editing, Supervision, Resources. HF: Writing – review & editing, Visualization, Supervision.
Funding
The author(s) declare financial support was received for the research, authorship, and/or publication of this article. The authors greatly appreciate the financial support from the National Natural Science Foundation of China (81971863, 82170110), the Shanghai Natural Science Foundation (22ZR1444700), the Shanghai Shenkang project for transformation for scientific production (SHDC2022CRD049), the Fujian Province Department of Science and Technology (2022D014), the Shanghai Pujiang Program (20PJ1402400), the Science and Technology Commission of Shanghai Municipality (20DZ2254400, 20DZ2261200), the Shanghai Municipal Science and Technology Major Project (ZD2021CY001), and the Shanghai Municipal Key Clinical Specialty (shslczdzk02201).
Conflict of interest
The authors declare that the research was conducted in the absence of any commercial or financial relationships that could be construed as a potential conflict of interest.
The author(s) declared that they were an editorial board member of Frontiers, at the time of submission. This had no impact on the peer review process and the final decision.
Publisher’s note
All claims expressed in this article are solely those of the authors and do not necessarily represent those of their affiliated organizations, or those of the publisher, the editors and the reviewers. Any product that may be evaluated in this article, or claim that may be made by its manufacturer, is not guaranteed or endorsed by the publisher.
References
1. Chen, Z, Deng, X, Fang, L, Sun, K, Wu, Y, Che, T, et al. Epidemiological characteristics and transmission dynamics of the outbreak caused by the SARS-CoV-2 omicron variant in Shanghai, China: a descriptive study. Lancet Reg Health-Western Pac. (2022) 29:100592. doi: 10.1016/j.lanwpc.2022.100592
2. Li, J, Lai, S, Gao, GF, and Shi, W. The emergence, genomic diversity and global spread of SARS-CoV-2. Nature. (2021) 600:408–18. doi: 10.1038/s41586-021-04188-6
3. Tian, D, Sun, Y, Xu, H, and Ye, Q. The emergence and epidemic characteristics of the highly mutated SARS-CoV-2 omicron variant. J Med Virol. (2022) 94:2376–83. doi: 10.1002/jmv.27643
4. Chen, X, Yan, X, Sun, K, Zheng, N, Sun, R, Zhou, J, et al. Estimation of disease burden and clinical severity of COVID-19 caused by omicron BA. 2 in Shanghai, February-June 2022. Emerg Microb Infect. (2022) 11:2800–7. doi: 10.1101/2022.07.11.22277504
5. Wilder-Smith, A, and Freedman, DO. Isolation, quarantine, social distancing and community containment: pivotal role for old-style public health measures in the novel coronavirus (2019-nCoV) outbreak. J Travel Med. (2020) 27:1–4. doi: 10.1093/jtm/taaa020
6. Van Elden, LJ, Anton, MAM, Van Alphen, F, Hendriksen, KA, Hoepelman, AI, Van Kraaij, MG, et al. Frequent detection of human coronaviruses in clinical specimens from patients with respiratory tract infection by use of a novel real-time reverse-transcriptase polymerase chain reaction. J Infect Dis. (2004) 189:652–7. doi: 10.1086/381207
7. Ai, T, Yang, Z, Hou, H, Zhan, C, Chen, C, Lv, W, et al. Correlation of chest CT and RT-PCR testing in coronavirus disease 2019 (COVID-19) in China: a report of 1014 cases. Radiology. (2020) 296:E32–40. doi: 10.1148/radiol.2020200642
8. Yang, Q, Liu, Q, Xu, H, Lu, H, Liu, S, and Li, H. Imaging of coronavirus disease 2019: a Chinese expert consensus statement. Eur J Radiol. (2020) 127:109008. doi: 10.1016/j.ejrad.2020.109008
9. Wu, X, Hui, H, Niu, M, Li, L, Wang, L, He, B, et al. Deep learning-based multi-view fusion model for screening 2019 novel coronavirus pneumonia: a multicentre study. Eur J Radiol. (2020) 128:109041. doi: 10.1016/j.ejrad.2020.109041
10. LeCun, Y, Bengio, Y, and Hinton, G. Deep learning. Nature. (2015) 521:436–44. doi: 10.1038/nature14539
11. Kavakiotis, I, Tsave, O, Salifoglou, A, Maglaveras, N, Vlahavas, I, and Chouvarda, I. Machine learning and data mining methods in diabetes research. Comput Struct Biotechnol J. (2017) 15:104–16. doi: 10.1016/j.csbj.2016.12.005
12. Willemink, MJ, Koszek, WA, Hardell, C, Wu, J, Fleischmann, D, et al. Preparing medical imaging data for machine learning. Radiology. (2020) 295:4–15. doi: 10.1148/radiol.2020192224
13. Sowrirajan, H, Yang, J, Ng, AY, and Rajpurkar, P (2021) Moco pretraining improves representation and transferability of chest x-ray models. International Conference on Medical Imaging with deep learning (MIDL).
14. Shen, D, Wu, G, and Suk, H-I. Deep learning in medical image analysis. Annu Rev Biomed Eng. (2017) 19:221–48. doi: 10.1146/annurev-bioeng-071516-044442
15. Chen, T, Kornblith, S, Norouzi, M, and Hinton, G (2020) A simple framework for contrastive learning of visual representationsInternational conference on machine learning (ICML).
16. Wu, Z, Xiong, Y, Yu, SX, and Lin, D (2018) Unsupervised feature learning via non-parametric instance discrimination. IEEE/CVF conference on computer vision and pattern recognition (CVPR).
17. Chen, T, Kornblith, S, Swersky, K, Norouzi, M, and Hinton, GE (2020) Big self-supervised models are strong semi-supervised learners. Annual conference on neural information processing systems (Neur IPS).
18. He, K, Fan, H, Wu, Y, Xie, S, and Girshick, R (2020) Momentum contrast for unsupervised visual representation learning. IEEE/CVF Conference on Computer Vision and Pattern Recognition (CVPR).
19. Chen, X, Fan, H, Girshick, R, and He, K. Improved baselines with momentum contrastive learning. ar Xiv. (2020). doi: 10.48550/arXiv.2003.04297
20. Vaswani, A, Shazeer, N, Parmar, N, Uszkoreit, J, Jones, L, Gomez, AN, et al. Attention is all you need. Neural Inform Process Syst. (2017) 30:5998–08.
21. Soares, E, Angelov, P, Biaso, S, Froes, MH, and Abe, DK. SARS-CoV-2 CT-scan dataset: a large dataset of real patients CT scans for SARS-CoV-2 identification. Med Rxiv. (2020) 10:1–8.
22. Mei, X, Lee, H-C, Diao, K-y, Huang, M, Lin, B, Liu, C, et al. Artificial intelligence–enabled rapid diagnosis of patients with COVID-19. Nat Med. (2020) 26:1224–8. doi: 10.1038/s41591-020-0931-3
23. He, K, Zhang, X, Ren, S, and Sun, J (2016) Deep residual learning for image recognition. IEEE/CVF Conference Computing Vision Pattern Recognisition.
24. Chen, J, Wu, L, Zhang, J, Zhang, L, Gong, D, Zhao, Y, et al. Deep learning-based model for detecting 2019 novel coronavirus pneumonia on high-resolution computed tomography. Sci Rep. (2020) 10:19196–11. doi: 10.1038/s41598-020-76282-0
25. Qiu, Y, Liu, Y, Li, S, and Xu, J. Miniseg: an extremely minimum network for efficient covid-19 segmentation. In: Proceedings of the AAAI Conference on Artificial Intelligence. Virtually: AAAI (2021).
26. Wang, G, Liu, X, Li, C, Xu, Z, Ruan, J, Zhu, H, et al. A noise-robust framework for automatic segmentation of COVID-19 pneumonia lesions from CT images. IEEE Trans Med Imaging. (2020) 39:2653–63. doi: 10.1109/TMI.2020.3000314
27. Panwar, H, Gupta, P, Siddiqui, MK, Morales-Menendez, R, Bhardwaj, P, Singh, VJC, et al. A deep learning and grad-CAM based color visualization approach for fast detection of COVID-19 cases using chest X-ray and CT-scan images. Chaos Solitons Fractals. (2020) 140:110190. doi: 10.1016/j.chaos.2020.110190
28. Ma, X, Zheng, B, Zhu, Y, Yu, F, Zhang, R, and Chen, B. COVID-19 lesion discrimination and localization network based on multi-receptive field attention module on CT images. Optik. (2021) 241:167100. doi: 10.1016/j.ijleo.2021.167100
29. Yang, P, Yin, X, Lu, H, Hu, Z, Zhang, X, Jiang, R, et al. CS-CO: a hybrid self-supervised visual representation learning method for H & E-stained histopathological images. Med Image Anal. (2022) 81:102539. doi: 10.1016/j.media.2022.102539
30. Zhang, Y, Jiang, H, Miura, Y, Manning, CD, and Langlotz, CP. Contrastive learning of medical visual representations from paired images and text. ar Xiv. (2020) 2010:2–25. doi: 10.48550/arXiv.2010.00747
31. Chaitanya, K, Erdil, E, Karani, N, and Konukoglu, E. Contrastive learning of global and local features for medical image segmentation with limited annotations. Adv Neural Inf Proces Syst. (2020) 33:12546–58. doi: 10.48550/arXiv.2006.10511
32. Zeng, D, Wu, Y, Hu, X, Xu, X, Yuan, H, Huang, M, et al. Positional contrastive learning for volumetric medical image segmentation. International Conference on Medical Image Computing and Computer-assisted Intervention. Strasbourg: Springer (2021).
33. Wu, Y, Zeng, D, Wang, Z, Shi, Y, and Hu, J. Distributed contrastive learning for medical image segmentation. Med Image Anal. (2022) 81:102564. doi: 10.1016/j.media.2022.102564
34. Khalifa, NE, Loey, M, and Mirjalili, S. A comprehensive survey of recent trends in deep learning for digital images augmentation. Artif Intell Rev. (2022) 55:2351–77. doi: 10.1007/s10462-021-10066-4
35. Boyat, AK, and Joshi, BK. A review paper: noise models in digital image processing. Sig Image Process. (2015) 6:63. doi: 10.48550/arXiv.1505.03489
36. Evangelista, RC, Salvadeo, DH, and Mascarenhas, ND. A new bayesian Poisson denoising algorithm based on nonlocal means and stochastic distances. Pattern Recog Lett. (2022) 122:108363. doi: 10.1016/j.patcog.2021.108363
37. Zhuang, T, Leng, S, Nett, BE, and Chen, G-H. Fan-beam and cone-beam image reconstruction via filtering the backprojection image of differentiated projection data. Phys Med Biol. (2004) 49:5489–503. doi: 10.1088/0031-9155/49/24/007
38. Stierstorfer, K, Rauscher, A, Boese, J, Bruder, H, Schaller, S, and Flohr, T. Weighted FBP—a simple approximate 3D FBP algorithm for multislice spiral CT with good dose usage for arbitrary pitch. Phys Med Biol. (2004) 49:2209–18. doi: 10.1088/0031-9155/49/11/007
39. Huang, J, and Ling, CX. Using AUC and accuracy in evaluating learning algorithms. IEEE Trans Knowl Data Eng. (2005) 17:299–10. doi: 10.1109/TKDE.2005.50
40. Barber, JA, and Thompson, SG. Analysis of cost data in randomized trials: an application of the non-parametric bootstrap. Stat Med. (2000) 19:3219–36.
41. Simonyan, K, and Zisserman, A. Very deep convolutional networks for large-scale image recognition. Ar xiv preprint ar xiv: 409.1556. (2014).
42. Huang, G, Liu, Z, Van Der Maaten, L, and Weinberger, KQ (2017). Densely connected convolutional networks. IEEE/CVF conference on computer vision and pattern recognition (CVPR).
43. Deng, J, Dong, W, Socher, R, Li, L-J, Li, K, and Fei-Fei, L. Imagenet: a large-scale hierarchical image database. In 2009 IEEE Conference on Computer Vision and Pattern Recognition. Miami: IEEE (2009).
44. Gaur, P, Malaviya, V, Gupta, A, Bhatia, G, Pachori, RB, and Sharma, D. COVID-19 disease identification from chest CT images using empirical wavelet transformation and transfer learning. Biomed Sig Process Control. (2022) 71:103076. doi: 10.1016/j.bspc.2021.103076
45. Ewen, N, and Khan, N (2021) Targeted self supervision for classification on a small covid-19 ct scan dataset. International symposium on biomedical imaging (ISBI).
46. Yang, X, He, X, Zhao, J, Zhang, Y, Zhang, S, and Xie, P. COVID-CT-dataset: a CT scan dataset about COVID-19. Ar xiv preprint ar xiv: 2003.13865. (2020).
47. Ahmed, SAA, Yavuz, MC, Şen, MU, Gülşen, F, Tutar, O, Korkmazer, B, et al. Comparison and ensemble of 2D and 3D approaches for COVID-19 detection in CT images. Neurocomputing. (2022) 488:457–69. doi: 10.1016/j.neucom.2022.02.018
48. Chaudhary, PK, and Pachori, RB. FBSED based automatic diagnosis of COVID-19 using X-ray and CT images. Comp Biol Med Glob Surv. (2021) 134:104454. doi: 10.1016/j.compbiomed.2021.104454
49. Wang, Z, Liu, Q, and Dou, Q. Contrastive cross-site learning with redesigned net for COVID-19 CT classification. IEEE J Biomed Health Inform. (2020) 24:2806–13. doi: 10.48550/arXiv.2009.07652
50. Patel, RK, and Kashyap, M. Automated diagnosis of COVID stages from lung CT images using statistical features in 2-dimensional flexible analytic wavelet transform. Biocybernet Biomed Eng. (2022) 42:829–41. doi: 10.1016/j.bbe.2022.06.005
51. Liu, Z, Lin, Y, Cao, Y, Hu, H, Wei, Y, Zhang, Z, et al. (2021) Swin transformer: hierarchical vision transformer using shifted windows. IEEE/CVF Conference on Computer Vision and Pattern Recognition (CVPR).
Keywords: contrastive learning, token projection, omicron pneumonia identification, random Poisson noise perturbation, chest CT images
Citation: Jiang X, Yang D, Feng L, Zhu Y, Wang M, Feng Y, Bai C and Fang H (2024) Contrastive learning with token projection for Omicron pneumonia identification from few-shot chest CT images. Front. Med. 11:1360143. doi: 10.3389/fmed.2024.1360143
Edited by:
Michalis Savelonas, University of Thessaly, GreeceReviewed by:
Carl-Magnus Svensson, Leibniz Institute for Natural Product Research and Infection Biology, GermanyNabil Ibtehaz, Purdue University, United States
Copyright © 2024 Jiang, Yang, Feng, Zhu, Wang, Feng, Bai and Fang. This is an open-access article distributed under the terms of the Creative Commons Attribution License (CC BY). The use, distribution or reproduction in other forums is permitted, provided the original author(s) and the copyright owner(s) are credited and that the original publication in this journal is cited, in accordance with accepted academic practice. No use, distribution or reproduction is permitted which does not comply with these terms.
*Correspondence: Yu Zhu, zhuyu@ecust.edu.cn; Hao Fang, drfanghao@163.com
†These authors have contributed equally to this work and share first authorship