Relationship between Life’s Essential 8 and metabolic syndrome among older Americans (NHANES, 2007–2010): navigating biological aging and inflammation
 Ruoyu Gou
 Si Xiong
 Xudong Liang3†
  Changjun Luo
- 1School of Public Health, Ningxia Medical University, Yinchuan, Ningxia, China
- 2Department of Ultrasonography, Affiliated Liutie Central Hospital of Guangxi Medical University, Liuzhou, Guangxi, China
- 3Department of Cardiology, Affiliated Liutie Central Hospital of Guangxi Medical University, Liuzhou, Guangxi, China
- 4Department of Endocrinology, Affiliated Liutie Central Hospital of Guangxi Medical University, Liuzhou, Guangxi, China
Background: Metabolic syndrome (MetS) is a global health concern, and it is particularly harmful to middle-aged and elderly individuals. Life Element Eight (LE8), a measure to improve cardiovascular health, may offer benefits for MetS. Herein, we examined the relationship between LE8 and MetS among middle-aged and elderly individuals, and elucidated the role of biological aging and inflammation in this process.
Methods: We obtained the LE8 scores of 2,901 Americans, along with their biological aging indicators (Biological age, Phenotypic age, Serum Klotho), and computed their inflammatory indicators SII, DII. Using logistic regression model, we assessed the association among inflammatory markers, Biological aging, LE8 and MetS. Additionally, we generated restricted cubic spline (RCS) plots to display trends in significant variables in logistic regression. Using parallel mediation analysis, we evaluated the possible mediating role of various factors in the risk relationship between LE8 and MetS.
Results: Our examination revealed that higher LE8 scores were associated with a lower incidence of MetS in a fully adjusted model. The high LE8 subgroup had a 79.73% reduction in the risk of MetS compared to the low subgroup with an OR = 0.2027 (95% Cl 0.0871, 0.4714), with similar correlations between health factor scores and MetS risk. Biological aging mediated the associations between LE8, health behaviors and health factor scores and MetS risk.
Conclusion: A rise in the LE8 score among middle-aged and elderly individuals is a protective factor for MetS, and this association may be partially mediated by biological aging, suggesting that LE8 may reduce the risk of MetS by ameliorating aging.
1 Introduction
Metabolic syndrome (MetS) refers to a range of metabolic disorders that involves augmented fasting blood glucose, hypertension, abdominal obesity, elevated triglycerides (TG) and diminished high-density lipoprotein cholesterol (HDL-C). MetS is a global public health problem, with a prevalence of about 25% worldwide and even higher in developed countries (1). According to the United States National Health and Nutrition Examination Survey (NHANES), over one third adults exhibit MetS, and the incidence rate among middle-aged and elderly people aged 40 and older is as high as 40% (2). MetS is particularly detrimental to middle-aged and elderly people, and some studies mainly composed of middle-aged and elderly people have suggested that MetS is associated with adverse cardiovascular risk and mortality (2, 3). At present, there are no MetS-targeting medications (3). Considering that MetS is closely correlated with cardiovascular disease (4), proper MetS management can potentially enhance cardio vascular health (CVH). More recently, the American Heart Association proposed novel CVH indicators, known collectively as Life’s Essential 8 (LE8) (5). LE8 involves diet, physical activity, nicotine exposure, sleep health, body mass index, lipids, blood glucose, and blood pressure. Relative to the Life’s Simple 7 score proposed in 2010, LE8 includes sleep quality and mental health assessment, and improved the scoring algorithm. Till date, there are no investigations that evaluated the relationship between the LE8 score and MetS, therefore, further research on the relationship between the two is necessary.
Aging is a strong modulator of vascular disease, which progresses to cardiovascular and cerebrovascular events, and it is one of the leading causes of patient deaths worldwide. Based on a recent investigation by Ma et al. (4), Americans with elevated LE8 scores lived longer than those with reduced LE8 scores. Thus, enhanced LE8 scores is linked to slowing down or blocking the aging process. Aging is not only associated with LE8, but also with MetS, which is characterized by insulin resistance, dyslipidemia, hypertension, and abdominal obesity (5), and which tends to accelerate aging, and we hypothesize that aging may partially mediate the association between MetS and LE8. In addition, there are now studies demonstrating a correlation between the pathogenesis of MetS and systemic inflammation. Tilg et al. (6) reported that MetS occurs due to excessive central obesity, which enhances adipose tissue CD8 (+) T cell aggregation, promotes macrophage recruitment and activation (7), and accelerates macrophage-driven metabolic disease inflammation (8). Given these evidences, blocking the inflammatory response is key to delaying MetS onset, and good cardiovascular health scores were shown to downregulate inflammatory markers (9). Therefore, we speculated that inflammation may be another factor that partially mediates the association between MetS and LE8. Based on these analyses, the present study conducted a cross-sectional study based on the 2007–2010 National Health and Nutrition Examination Survey (NHANES) to investigate the association between MetS and LE8 in middle-aged and older adults in the United States and the potential role of aging and chronic inflammation markers in mediating the association between MetS and LE8. potential mediating role in the association between MetS and LE8.
2 Methods
2.1 Study populations
NHANES is a continuing survey of the health and nutritional status of the United States population (10), and it is conducted by members of the Centers for Disease Control and Prevention (NCHS). Participant data are obtained via an intricate, classified, multistage probabilistic cluster sampling design, and involves 5,000 people each year. The collected information includes subject demographics, body measurements, laboratory test results, and dietary information (11). Prior to the survey, all subjects provided a written informed consent for survey participation and data usage in health-related statistical research.
Program details, data acquisition protocols, and available data are open to the public, and can be accessed at https://wwwn.cdc.gov/nchs/nhanes/. This investigation strictly followed the Strengthening the reporting of observational studies in epidemiology (STROBE) criteria for reported of observational studies in epidemiology (12). We examined 2 survey cycles spanning the years 2007–2010. Subjects were aged ≥ 40 with complete data, and among those excluded from analysis were participants with incomplete marital, family income-to-poverty ratio, education status, body mass index (BMI), smoking consumption status, alcohol consumption status, diabetes, phenotype age, SII, DII, LE8 or other information. Ultimately, we included 2,901 subjects in our analyses (Supplementary Figure 1).
2.2 Assessment of MetS
Adult Treatment Panel III (ATP III) of the National Cholesterol Education Program (NCEP) (3) states that MetS is the presence of ≥3 of the following characteristics: concentric obesity (with waist circumference > 35 inches or 88 cm among women and 40 inches or 102 cm among men), insulin resistance (fasting blood glucose > 100 mg/dL or lack of diabetes treatment), hypertension (SBP 130 mmHg or DBP 85 mmHg or requirement of hypertensive medication), elevated triglycerides (TG 150), and reduced high-density lipoprotein (HDL) cholesterol (HDL 40 among men and HDL 50 among women).
2.3 Assessment of LE8
The LE8 scoring system was based on the following questionnaires: 4 health behavior questions (diet, physical activity, nicotine exposure, and sleep duration) and 4 health parameters [BMI, non-HDL cholesterol, blood glucose (BG), and blood pressure (BP)]. The total score ranged between 0 and 100, and the overall LE8 score was calculated based on the average of 8 metrics. Detailed algorithms for calculating the LE8 scores for each of the metrics to NHANES data can be found in Supplementary Table 1. Following the American Heart Association definition, the LE8 scores were considered low (0–49 points), moderate (50–79 points), and high (80–100 points) (13). Dietary metrics were evaluated based on the 2015 Healthy Eating Index (HEI). Subjects were asked to recall two 24-h diets, and the data was integrated into the US Department of Agriculture (USDA) food pattern equivalence data to compute the HEI-2015 scores (14). Moreover, we utilized self-reports of the frequency and duration of intense or moderate physical activity over the past 30 days, and recorded the smoking status, sleep duration, diabetes history, medication history, BP, height, and weight during physical examination. BMI was defined as weight (kg) divided by height (m) squared. BP was recorded as the average reading of 3 consecutive measurements. Subjects were fasted for ≥8 h, prior to 5 mL blood sample collection, and the samples were dispatched to the central laboratory for complete blood count and biochemical (namely, blood lipids, BG, CRP and glycosylated hemoglobin) evaluation.
2.4 Assessment of inflammatory index (SII, DII)
Systemic inflammation was measured using both biochemical or hematological indicators in normal blood tests or as ratios from the measurements. SII was computed as follows: SII = P × N/L, whereby, P, N, and L were the preoperative peripheral platelet, neutrophil, and lymphocyte counts, respectively (15).
DII was first introduced in 2004, its first-generation protocols and verification were presented in 2009, and an enhanced version was offered in 2014 using comparative data from 11 national food and nutrition databases from 4 separate continents. We also measured relevant inflammatory markers, namely, CRP, IL-1β, IL-4, IL-6, IL-10, and TNF-α, to generate food parameter-specific DII scores, which, were, in turn, used to generate an overall DII score for individual subjects analyzed in this study (16).
The NHANES data comes with 28 available parameters that can be used to compute DII. These include energy, protein, carbohydrate, dietary fiber, total fatty acid, total saturated fatty acid, monounsaturated fatty acids (MUFA), polyunsaturated fatty acids (PUFA), cholesterol, β-carotene, niacin, folate, magnesium, iron, zinc, selenium, caffeine, alcohol, n3 polyunsaturated fatty acid, n6 polyunsaturated fatty acid, and vitamins A, B1, B2, B6, B12, C, D, and E. An augmented DII score represents an inflammation-triggering diets, and a reduced score represents an anti-inflammatory diet (17).
2.5 Evaluation of biological aging (biological age, phenotypic age, serum klotho)
We utilized the Klemera and Doubal method of calculating biological age using 8 biomarkers, namely, CRP, circulating creatinine, glycosylated hemoglobin, circulating albumin, circulating total cholesterol, circulating urea nitrogen, circulating alkaline phosphatase, and systolic BP (18).
The phenotypic age was computed using 9 age-related variables, namely, chronological age, albumin, creatinine, glucose, CRP, lymphocyte percent, average cell volume, red blood cell distribution width, alkaline phosphatase, and white blood cell count (19).
Circulating Klotho levels were assessed using ELISA (IBL International, Japan). All samples were twice assessed and the average of the two results were analyzed. Per plate, we also evaluated two quality control samples using reduced and elevated Klotho concentrations for accuracy assessment. The sample analyses were repeated if the assigned value was >2 standard deviations from the expected value. The assay sensitivity was 4.33 pg./mL, and both the intra- and inter-assay coefficient of variations were <5%. Please refer to https://wwwn.cdc.gov/Nchs/Nhanes/2007-2008/SSKL_E.htm for a detailed summary of the ELISA protocol (20).
2.6 Defining covariates
Covariates were defined as patient age, sex, ethnicity/race, marital status, family income to poverty ratio, education status, BMI, smoking consumption status, alcohol consumption status, and physical activity. Race was classified as white, black, Mexican, other. Education status was described as <11th grade, high school graduate, college graduate or above. Family income to poverty ratio was separated into 4 categories, based on a 1.3 to >5 scale as follows: 1.3, 1.3–3, 3–5, and >5. An augmented ratio represented a higher income status. Marital status was classified as follows: married, divorced, unmarried. Alcohol consumption frequency and consumer sex was recorded, and alcohol consumption was defined as: never, former, mild, moderate, and heavy (21). Smoking status can categorized as: currently smoking, formerly smoking, or never. Never smokers were those who smoked <than 100 cigarettes in their lives, ex-smokers were those who smoked > 100 cigarettes, but no longer smoking, and current smokers were defined as smoking > 100 cigarettes, with consistency or inconsistency (22). BMI was defined as follows (23): <25, 25–30, and >30 kg/m2. Physical activity (PA) can be divided into: People were asked about the types of exercise they did in the past month. These included walking, running, cycling, swimming, dancing, weightlifting, and other activities. The intensity of each activity was given as a metabolic equivalent (MET) and is in the original dataset. We multiplied the exercise frequency and its MET to get an activity score to evaluate the PA levels.
2.7 Statistical analysis
We employed the NHANES criteria for statistical analysis (oversampling, stratification, and clustering) to predict the appropriate number of U.S. adults to use in this study. In addition, we also evaluated the required statistical tests for weight adjustment. Categorical variables are presented in n (%), and inter-group differences were assessed via chi-squared test.
We also employed logistic regression models to assess relationships between inflammatory indices (SII, DII), biological aging (phenotypic age, circulating Klotho, biological age), and LE8 with MetS. To control for confounding factors, three weighted logistic regression models were used in this study: Crude model, No adjustment for any potential influence factors; Model 1, Adjusted for Sex, Age and Ethnic/race; Model 2, Adjusted for Sex, Age, Ethnic/race, Marital, Family income-to-poverty ratio Education levels and Alcohol consumption status. The acquired data are presented as weighted (OR [95% CI]). We also assessed sub-categories like patient gender, age, and ethnicity to further elucidate the aforementioned relationships within various populations. Herein, the LE8 (high, moderate and low CVH), health behavior (high, moderate and low CVH) and health factor (high, moderate and low CVH) scores were regarded as the reference group. We generated restricted cubic spline (RCS) plots to display patterns in variables of significance in logistic regression. Using the RCS plots, we determined the presence or absence of a nonlinear association between the mentioned exposure factors and MetS.
The possibility of the inflammatory index (SII, DII) and biological aging (phenotypic age, circulating Klotho, biological age) as a modulator of the LE8 and MetS association was further examined using a parallel mediation model employing a quasi-Bayesian Monte Carlo technique with 1,000 normal approximation-based simulations (R package “mediation”). Direct effect (DE) indicated the LE8-mediated regulation of MetS in the absence of mediators. Indirect effect (IE) indicated the LE8-mediated modulation of MetS using a mediator. Mediation was quantified as follows: IE divided by TE (total effect).
Various packages in R 4.2.2 (R Project for Statistical Computing), including, nhanesR (0.9.2.8), survey, compareGroups, dplyr, tidyverse, do, scatterplot3d, MASS, poLCA, finalfit, Hmisc, lattice, Formula, rms, and foreign were used to conduct the analyses. Significance was set at two-sided p-value < 0.05.
3 Results
3.1 Population demographics
Among the 2,901 subjects, 1,153 had a MetS diagnosis. Table 1 summarizes all participant demographics. In all, we observed marked differences in patient age, household income to poverty ratio, education status, BMI, smoking status, alcohol intake, physical activity, LE8 and LE8 components (health factors and health behaviors), various scores, including HEI, PA, Sleep, BMI, Non-HDL, Glucose, and BP, as well as phenotypic age, biological age, and DII among MetS and non-MetS subjects.
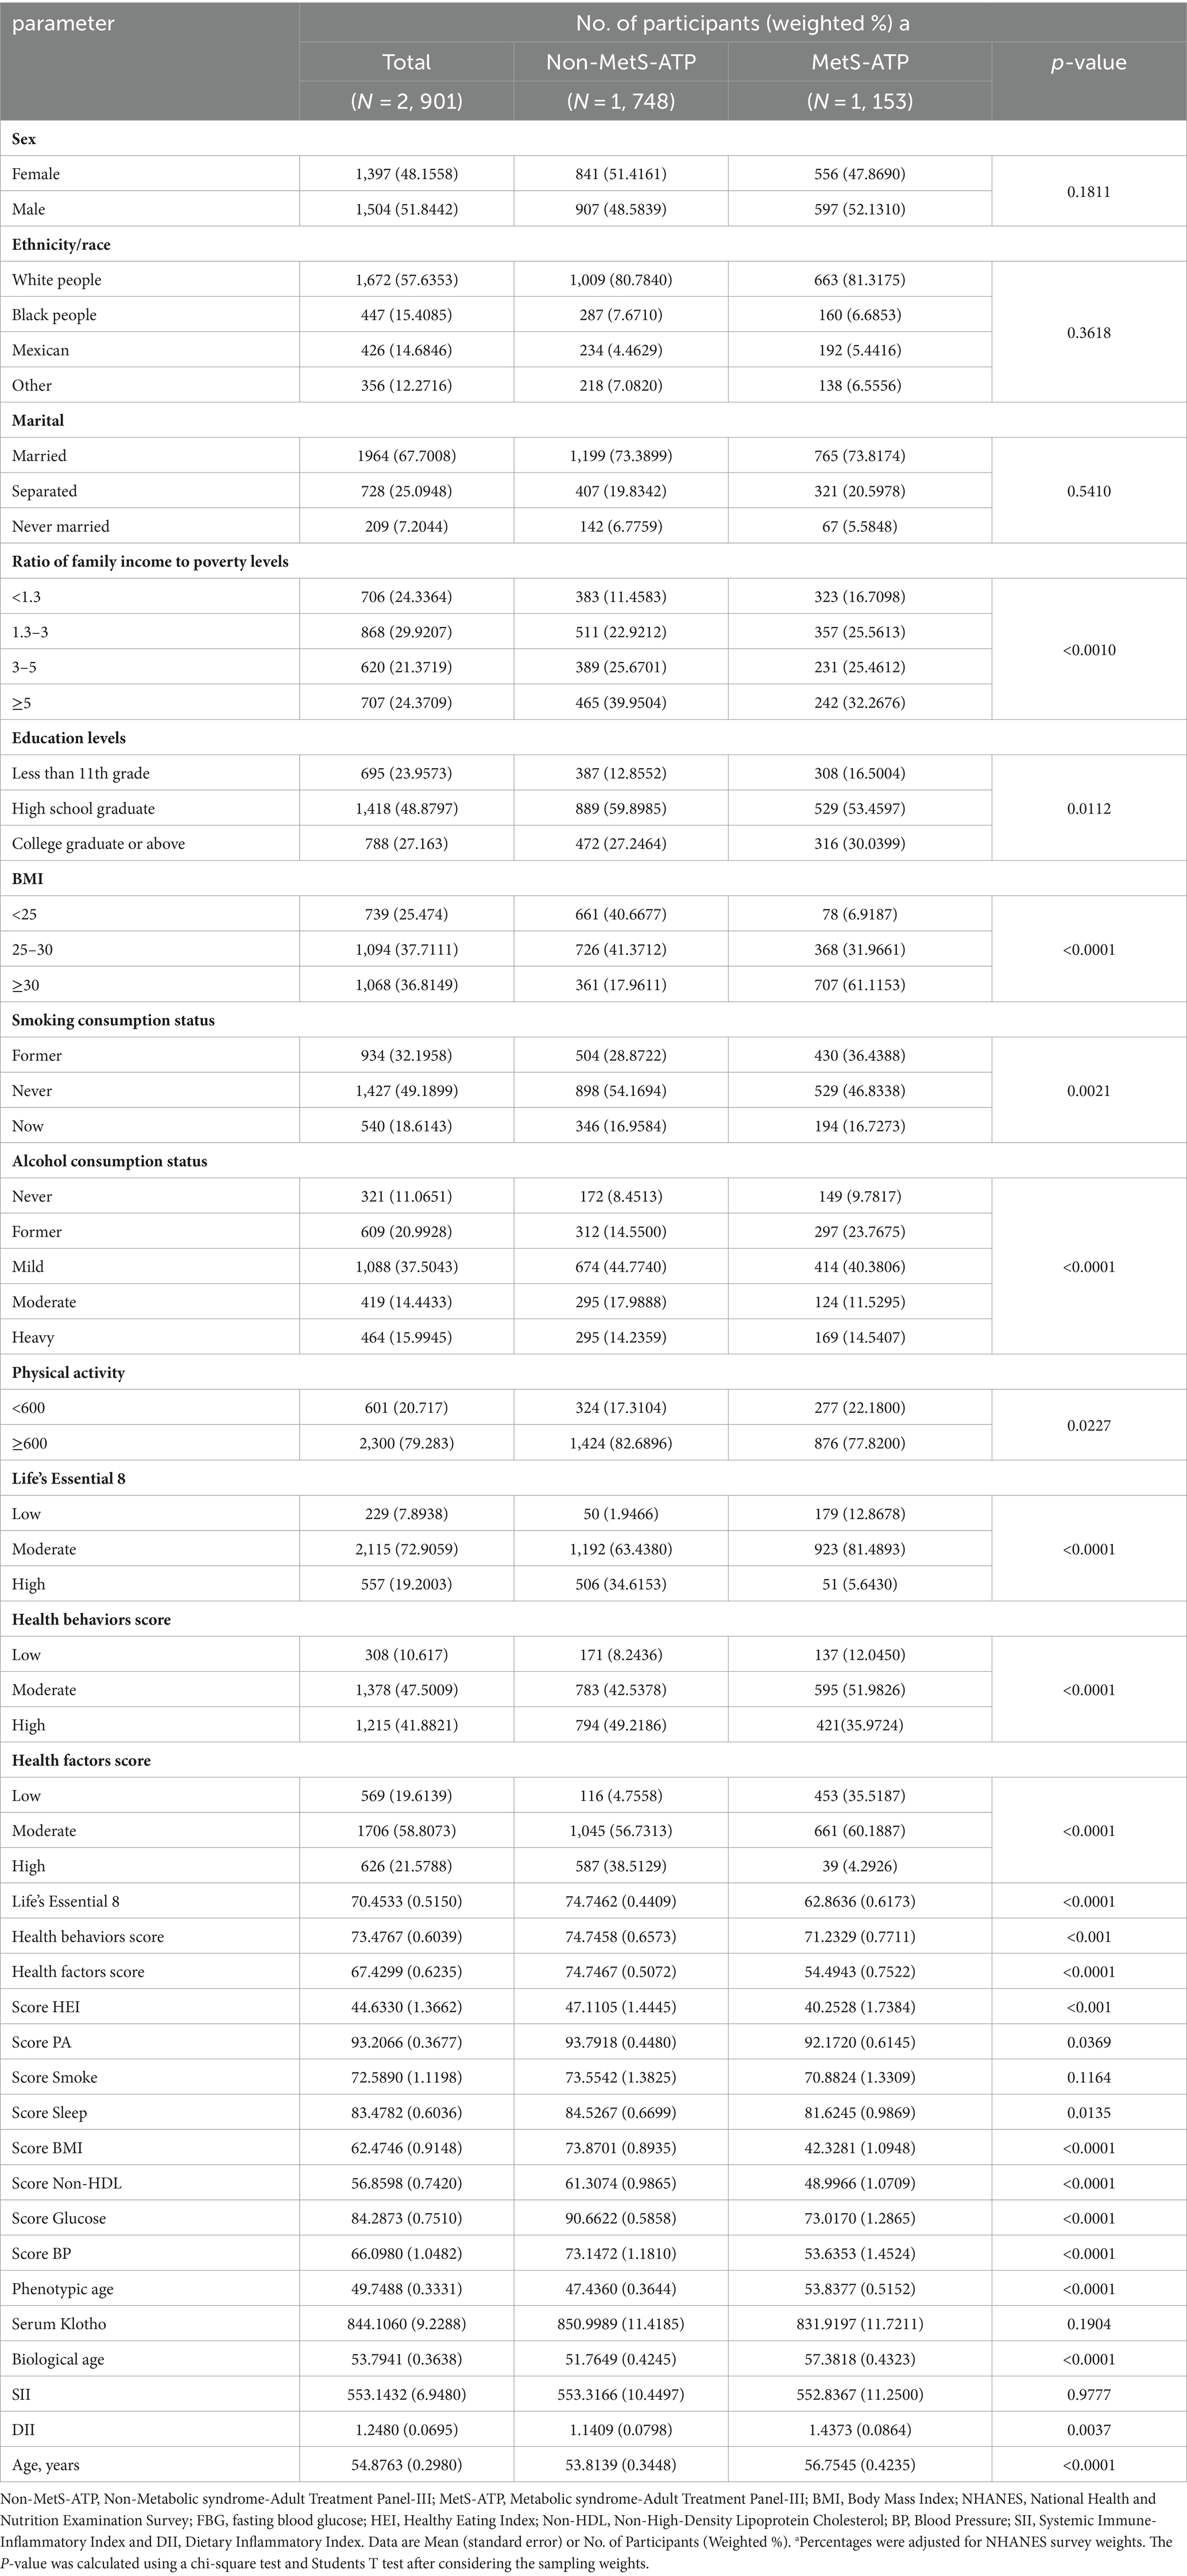
Table 1. Participant demographic characteristics (NHANES, 2007–2010 year cycle).
Table 1 summarizes all participant demographics. Among the 2,901 participants included in this study (48.2% female), a mean age of 54.9 years, and a mean LE8 score of 70.4533 (standard error of 0.5150). 1, 153 individuals were diagnosed with MetS. Participants with MetS were older, had a higher BMI, and were married compared to those without MetS. The MetS group had lower LE8 scores and had higher Phenotypic age, Biological age, and DII.
As depicted in Supplementary Figure 2, there were also strong differences in the MetS-ATP and related components among MetS and non-MetS subjects. In particular, MetS subjects exhibited substantially enhanced hyperglycemia, abnormal TG, abnormal HDL, and obesity, relative to non-MetS, however, the hypertensive incidences were similar between MetS and non-MetS participants.
3.2 Univariate logistic regression model
Based on our LE8 and related component univariate analyses, biological aging and inflammatory markers were strongly associated with MetS risk (Table 2). Apart from the PA score, smoke score, circulating Klotho and SII, other covariates showed marked association with MetS development (p < 0.05).
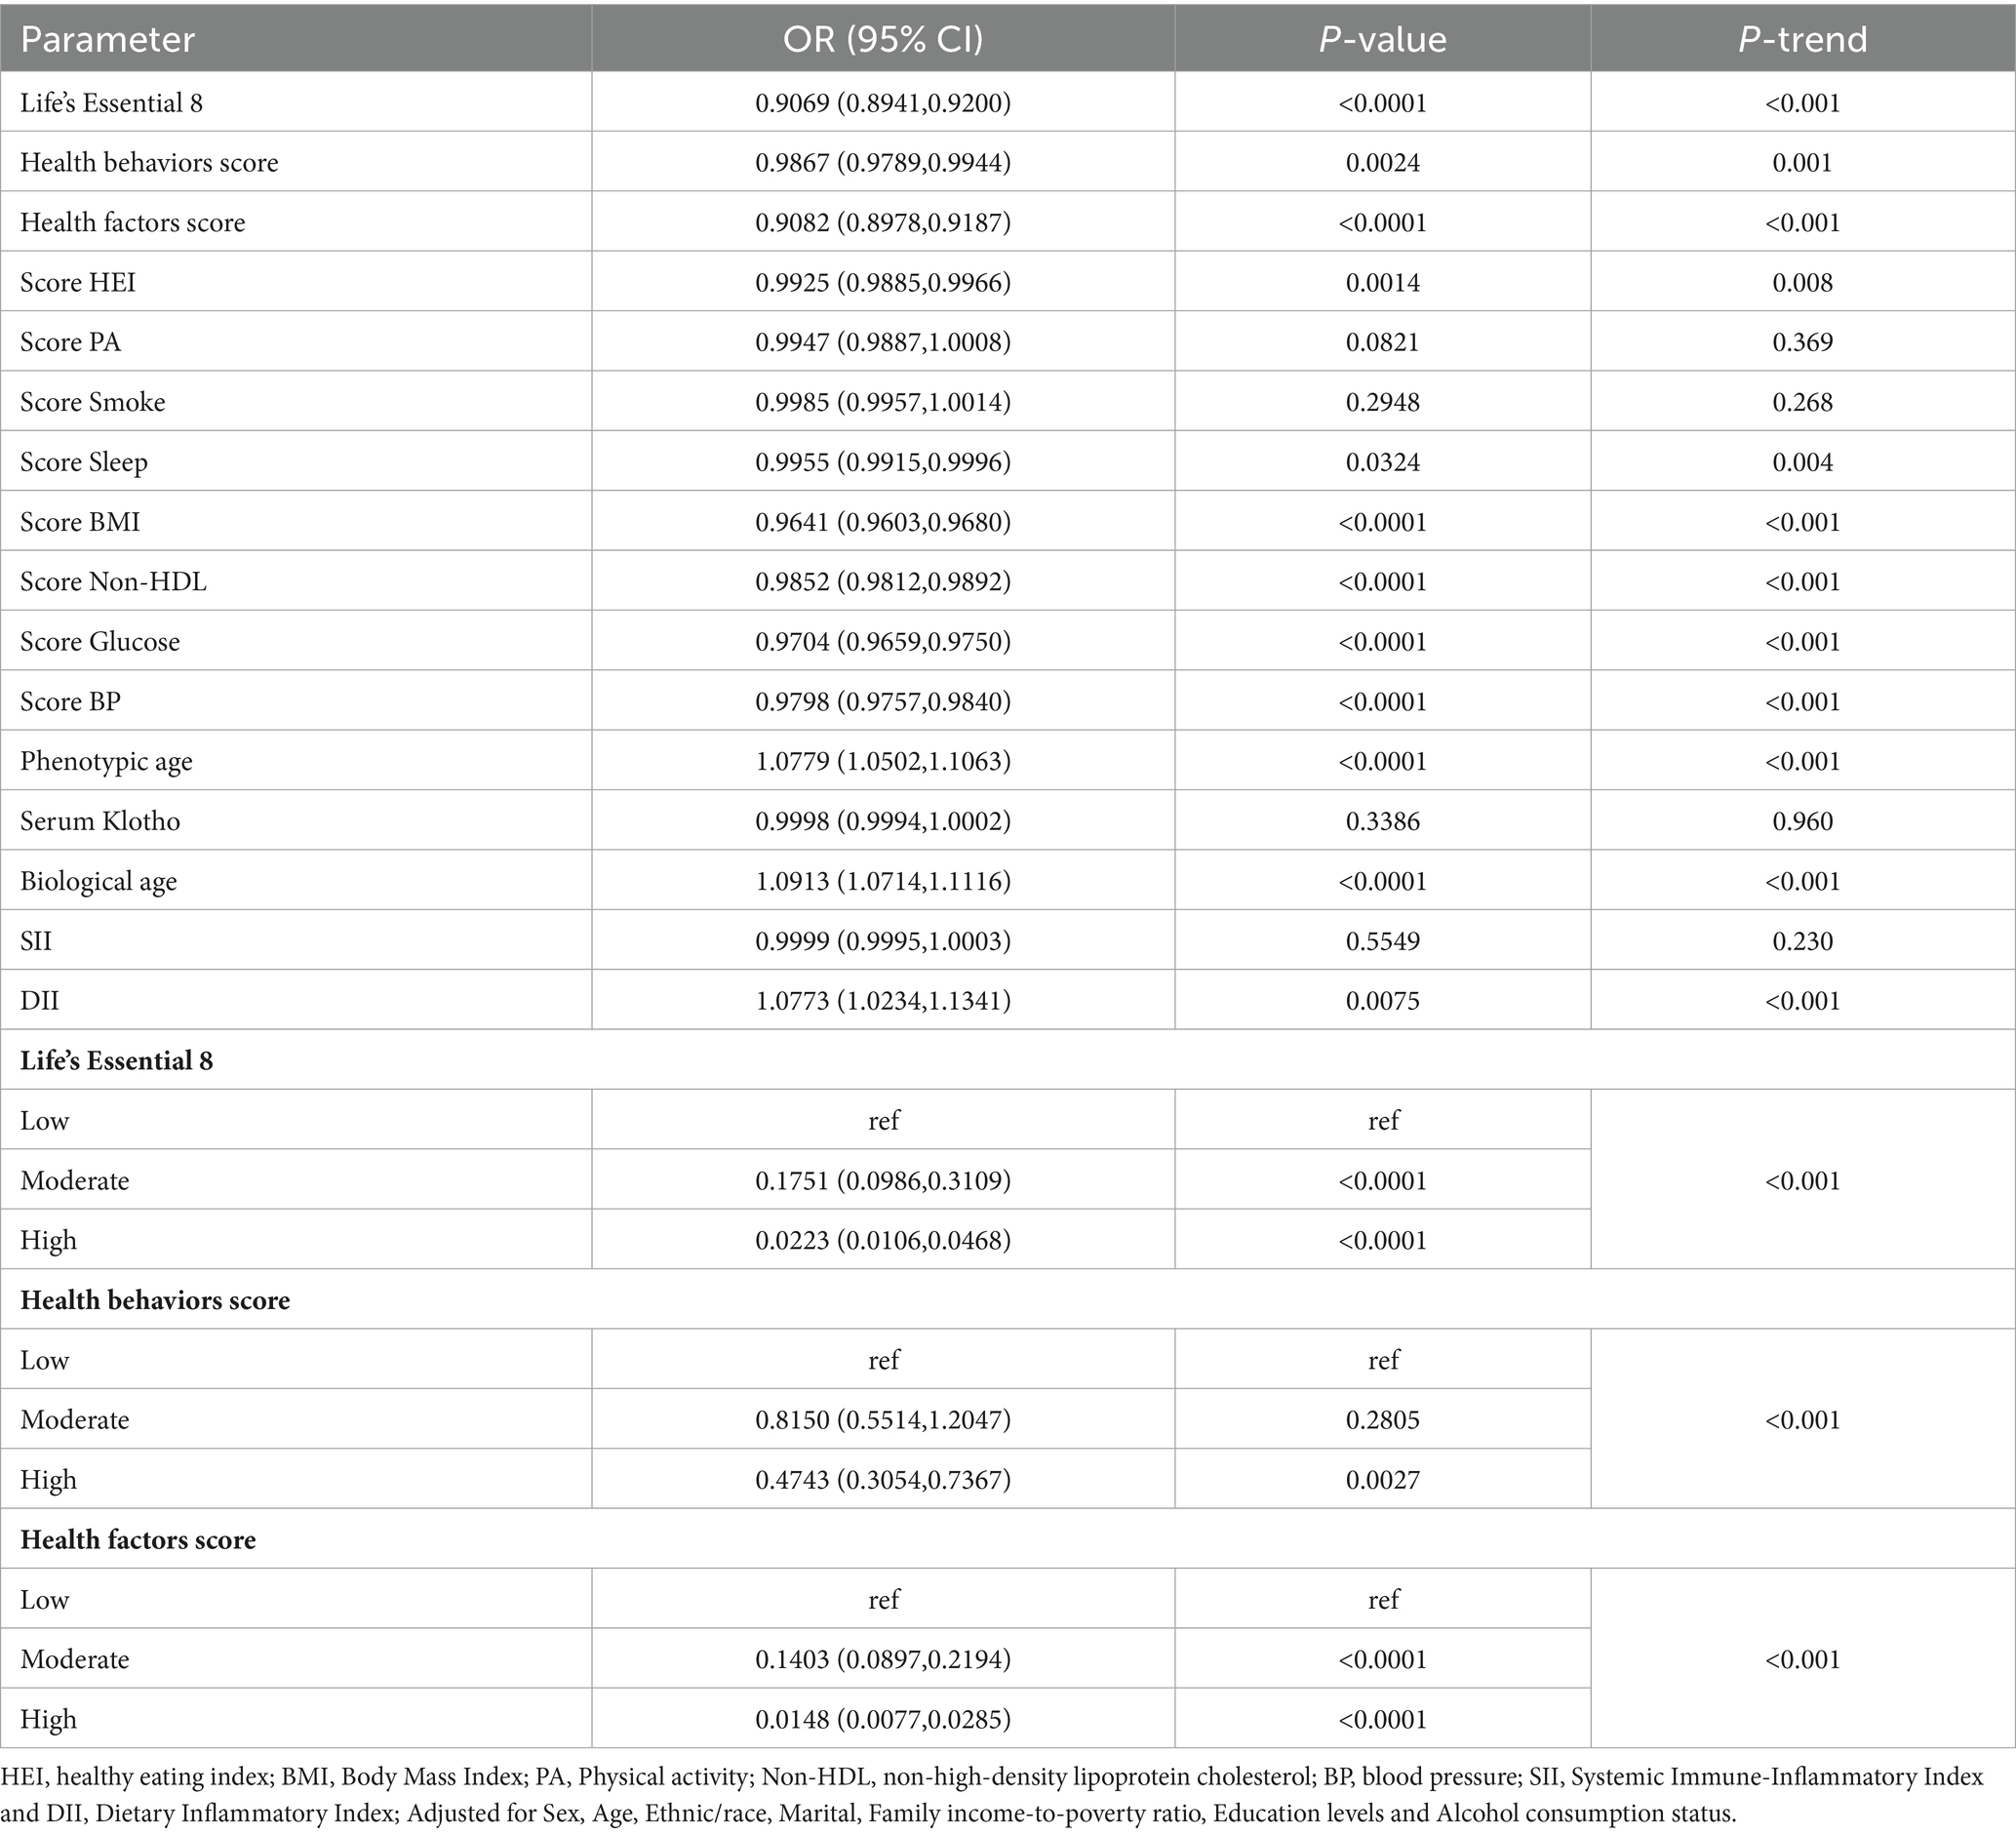
Table 2. Univariate logistic regression analysis.
3.3 Multivariate logistic regression model
Table 3 depicts the conclusions of our multivariate analysis of LE8 and its components with MetS. Following possible confounding factor adjustment, we developed several models for evaluation of the association between LE8 and MetS. We revealed that, with a rise in the LE8 and health factor scores, there was a drastic reduction in MetS risk (P-trend < 0.05). The MetS incidence odds ratios (95% confidence intervals) among LE8 middle and high scoring cohorts were (OR = 0.5163, 95Cl 0.2818~0.9460) and (OR = 0.2027, 95Cl 0.0871~0.4714), respectively, relative to the LE8 low scoring cohort. Furthermore, relative to the low health factor scores, the MetS odds ratios (95% confidence interval) among middle and high health factor scores were (OR = 0.1737, 95%Cl 0.1080~0.2794), (OR = 0.0278, 95%Cl 0.0130~0.0591) respectively (Figure 1). Using the 8 LE8 components as continuous variables, and following confounding factors adjustment, we revealed that 4 health factor scores were inversely proportional to MetS risk, and the OR values were as follows: BMI (OR = 0.9663, 95%Cl 0.9598~0.9728), Glucose (OR = 0.9768, 95%Cl 0.9678~0.9859), BP (OR = 0.9813, 95%Cl 0.9724~0.9903), and Non-HDL (OR = 0.9843, 95%Cl 0.9768~0.9918).
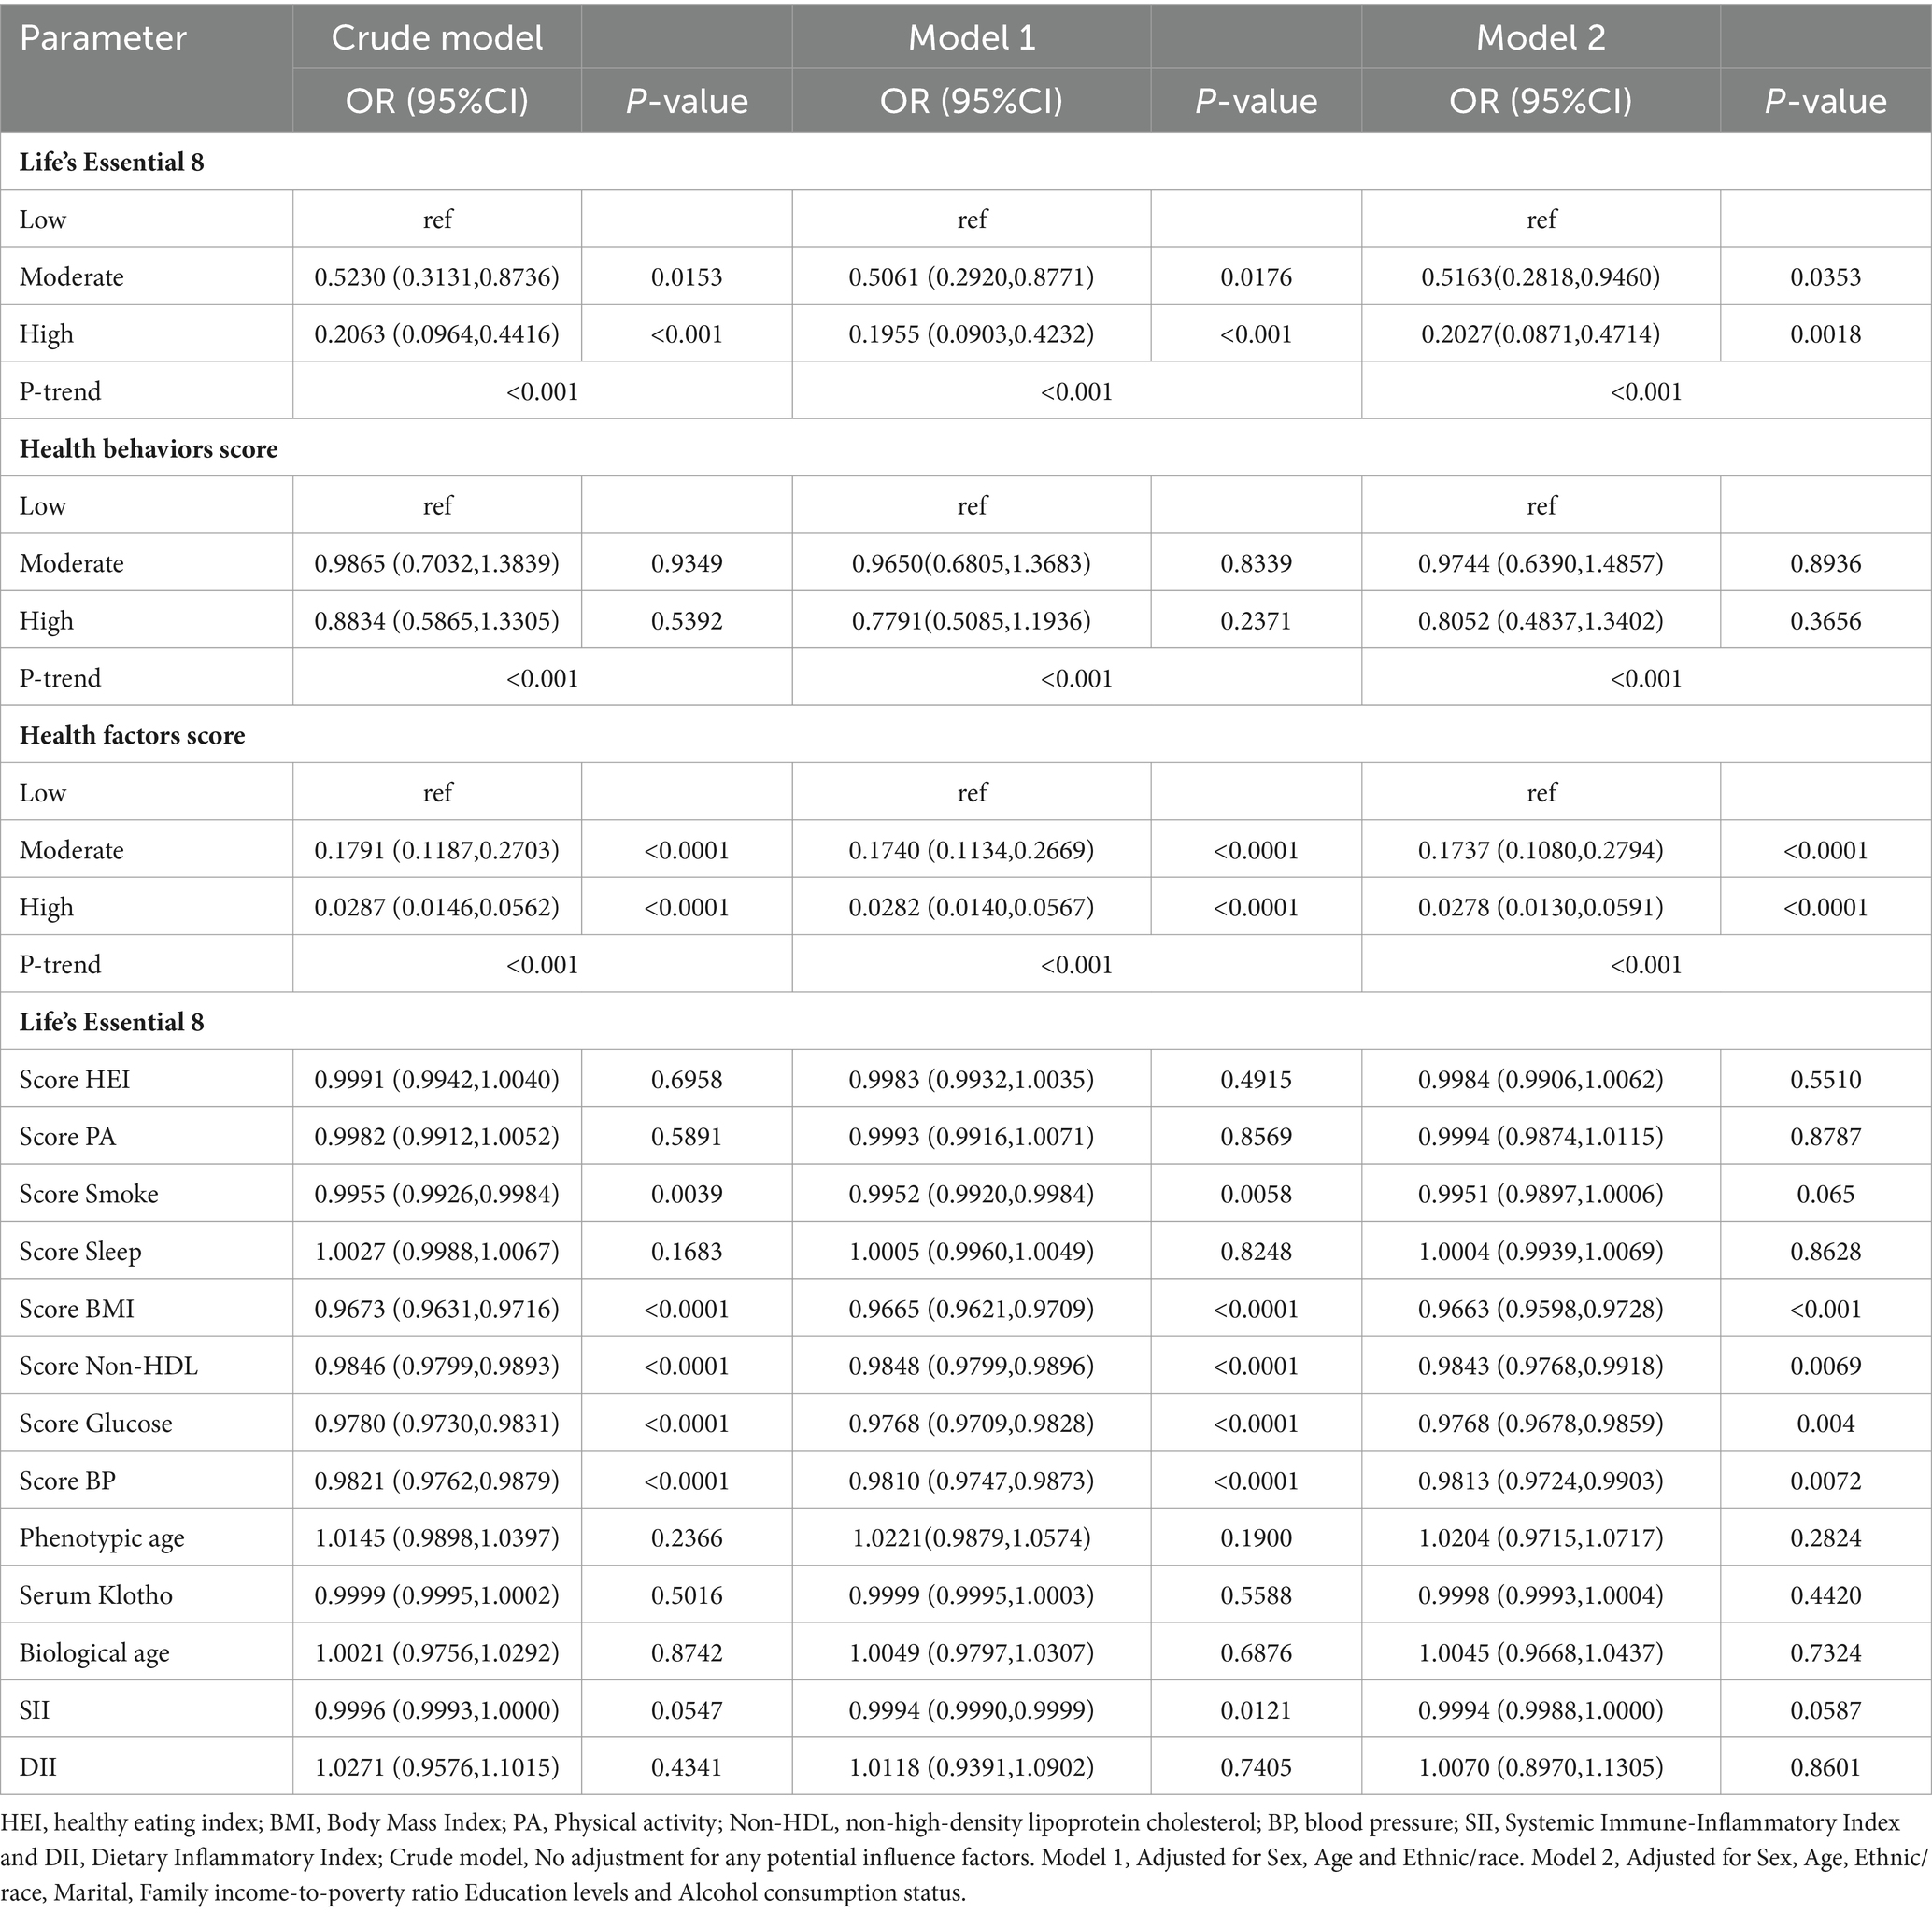
Table 3. Multiple logistic regression models of Life’s Essential 8 with MetS-ATP for participants.
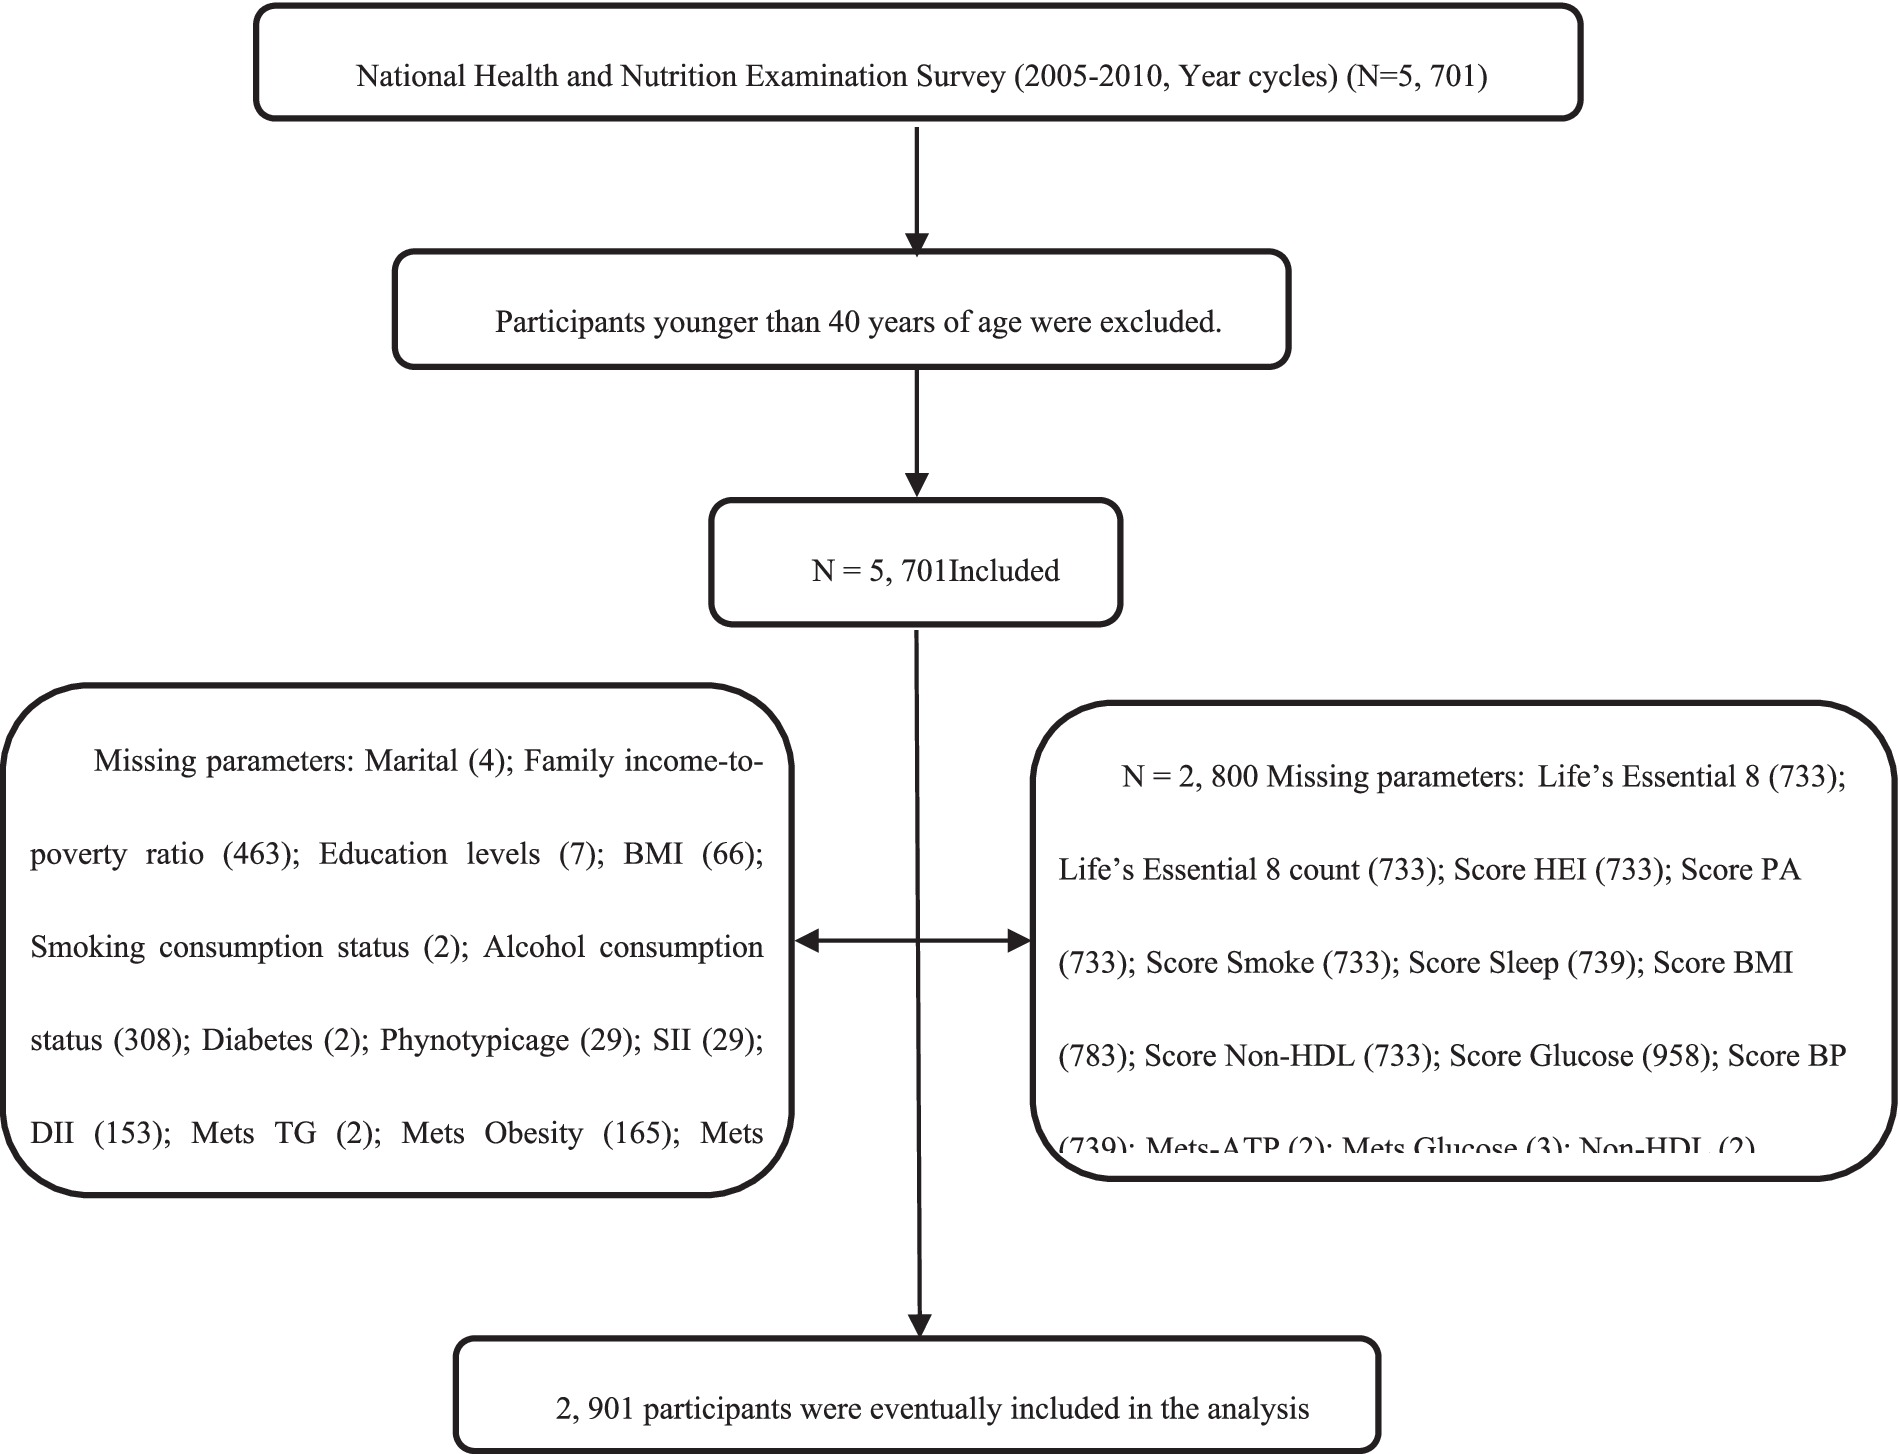
Figure 1. Flow chart of the screening process for the selection of the study population. Non-MetS-ATP, Non-Metabolic syndrome-Adult Treatment Panel-III; MetS-ATP, Metabolic syndrome-Adult Treatment Panel-III; BMI, Body Mass Index; NHANES, National Health and Nutrition Examination Survey; FBG, fasting blood glucose; HEI score, Healthy Eating Index; Non-HDL, Non-High-Density Lipoprotein Cholesterol; BP, Blood Pressure; SII, Systemic Immune-Inflammatory Index and DII, Dietary Inflammatory Index.
Scoring the LE8 scores and health factors and health behaviors as low, medium and high, after adjusting for the covariates of Sex, Age and Ethnic/race in Model 1, the ORs of participants in the high LE8 grouping and the high health factors grouping compared to the low scoring group were (OR = 0.1955, 95% Cl 0.0903,0.4232), (OR = 0.0282, 95%Cl 0.0140,0.0567) (p < 0.05 for trend), and after further adjusting for Marital, Family income-to-poverty ratio Education levels and Alcohol consumption status, the associations in model 2 remained unchanged, with a 79.73% reduction in MetS risk for the high subgroup of LE8 compared to the low subgroup, OR = 0.2027 (95%Cl 0.0871,0.4714), and a 97.22% reduction in MetS risk for the high subgroup of health factors compared to the low subgroup, OR = 0.0278 (95%Cl 0.0130,0.0591). When the eight components of LE8 were used as continuous variables, it was observed that after adjusting for confounders, the four health factor scores were negatively associated with MetS, with OR values of Score BMI (OR = 0.9663, 95% Cl 0.9598~0.9728), Score Glucose (OR = 0.9768, 95% Cl 0.9678~0.9859), Score BP (OR = 0.9813, 95%Cl 0.9724~0.9903), and Score Non-HDL (OR = 0.9843, 95%Cl 0.9768~0.9918), whereas Health Behavior as a whole and its four components were not significantly associated with MetS (p > 0.05).
As presented in Figure 2, following confounding factor adjustment, a nonlinear association was discovered between MetS risk and several variables, including, the LE8 scores, health behavior scores, health factor scores, phenotype age, circulating Klotho, biological age, SII, DII, HEI, Physical Activity, Smoke, Sleep, BMI, Non-HDL, Glucose, and BP (P-nonlinear <0.001; estimated OR = 1).
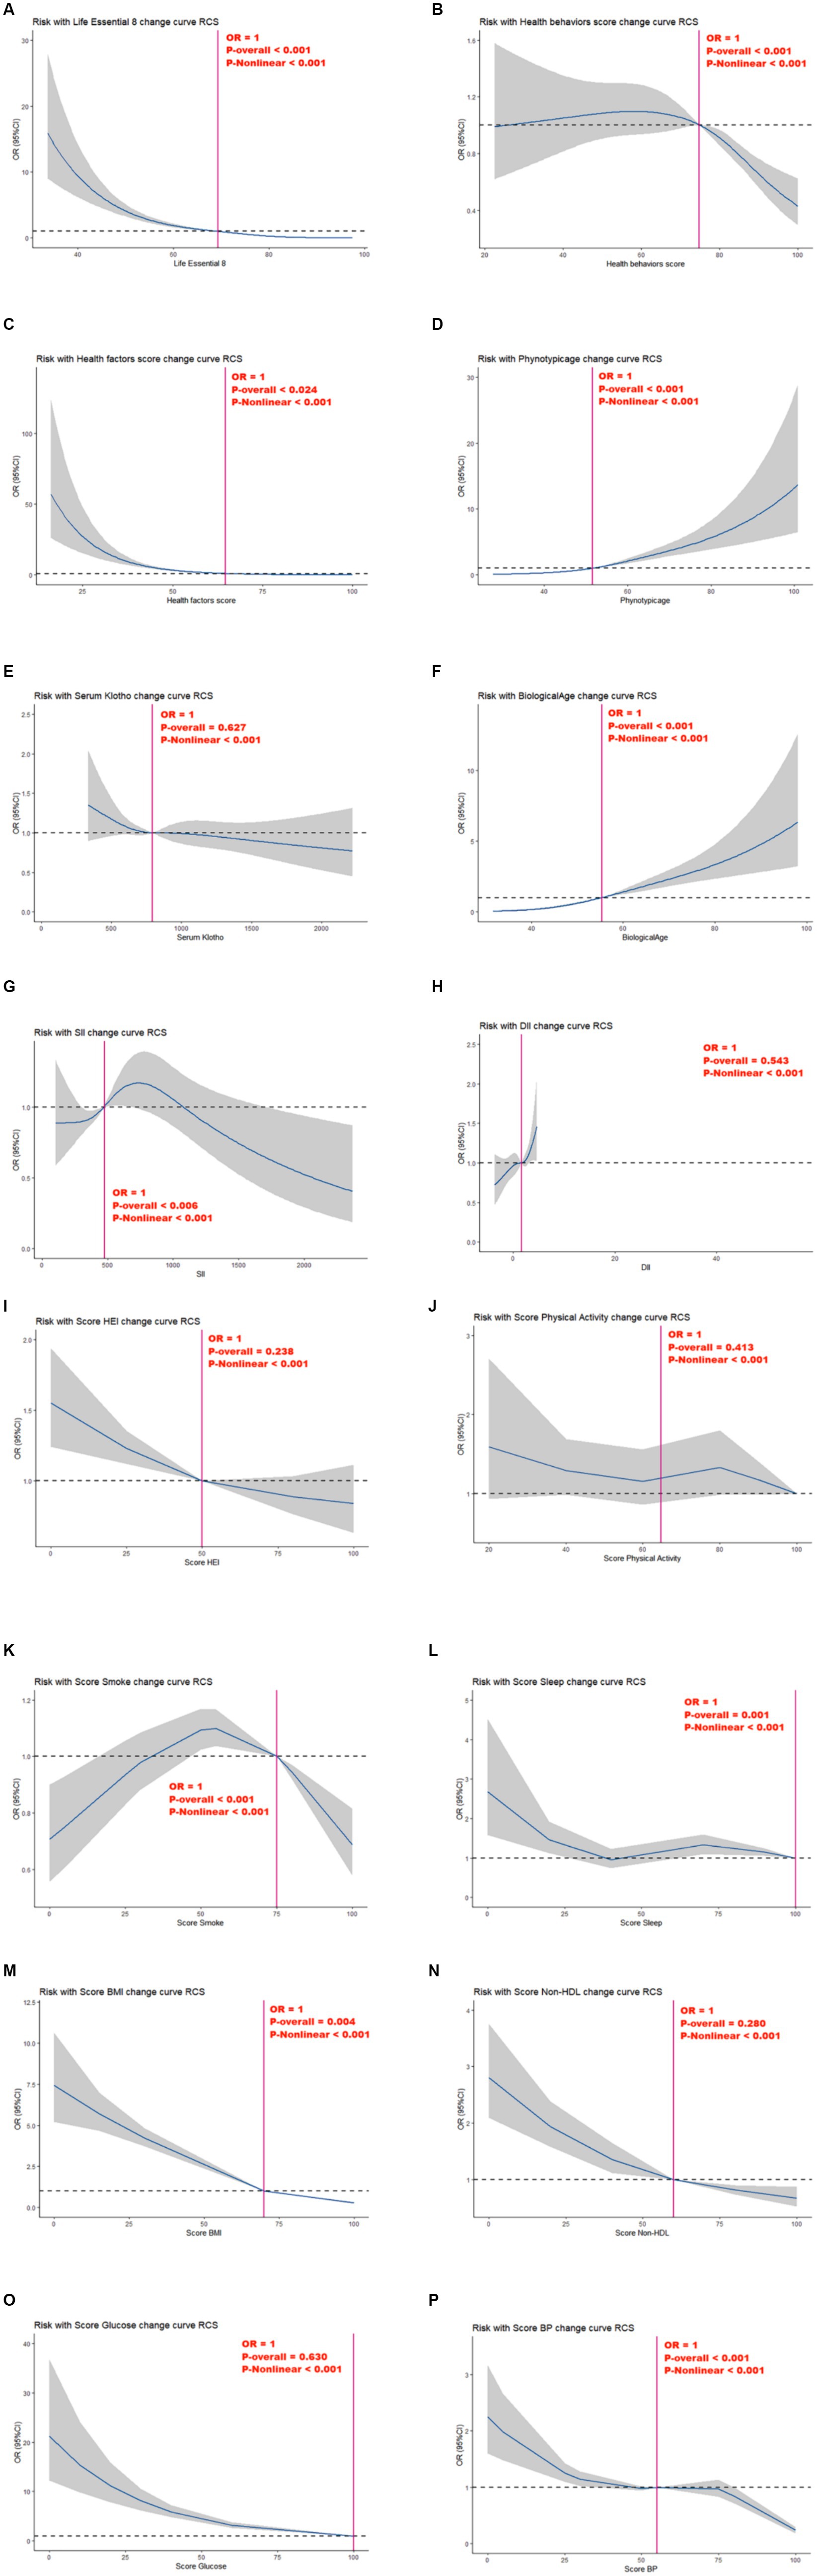
Figure 2. Relationships between Life’s Essential 8 scores (A), health behavior score (B), health factor score (C), Phenotypic age (D), Serum Klotho (E), Biological Age (F), SII (G), DII (H), Score HEI (I), Score Physical Activity (J), Score Smoke (K), Score Sleep (L), Score BMI (M), Score Non-HDL (N), Score Glucose (O), Score BP (P) and MetS. OR (95% CI; shaded areas) were adjusted for Sex, Age, Ethnic/race, Marital, Family income-to-poverty ratio Education levels and Alcohol consumption status. Vertical red solid lines indicate the minimal threshold for the beneficial association with estimated OR = 1. OR, odds ratio.
Nonetheless, we observed no marked independent correlation between circulating Klotho, DII, HEI, physical activity, non-HDL, and glucose and MetS risk in the overall model (P-overall > 0.05).
3.4 Subgroup analysis involving LE8 and MetS
Table 4 summarizes the subgroup analysis results from LE8 and MetS risk. Suggested that the risk of MetS prevalence significantly decreased with progressively higher LE8 and health factor group scores across gender, race, household economic status, BMI, physical activity, and alcohol intake (P-trend < 0.05). In case of women, whites, other races, household income-to-poverty ratio ≥ 5, BMI ≥ 30, and heavy drinkers, elevation in health behavior scores drastically decreased MetS risk (p < 0.05 for trend).
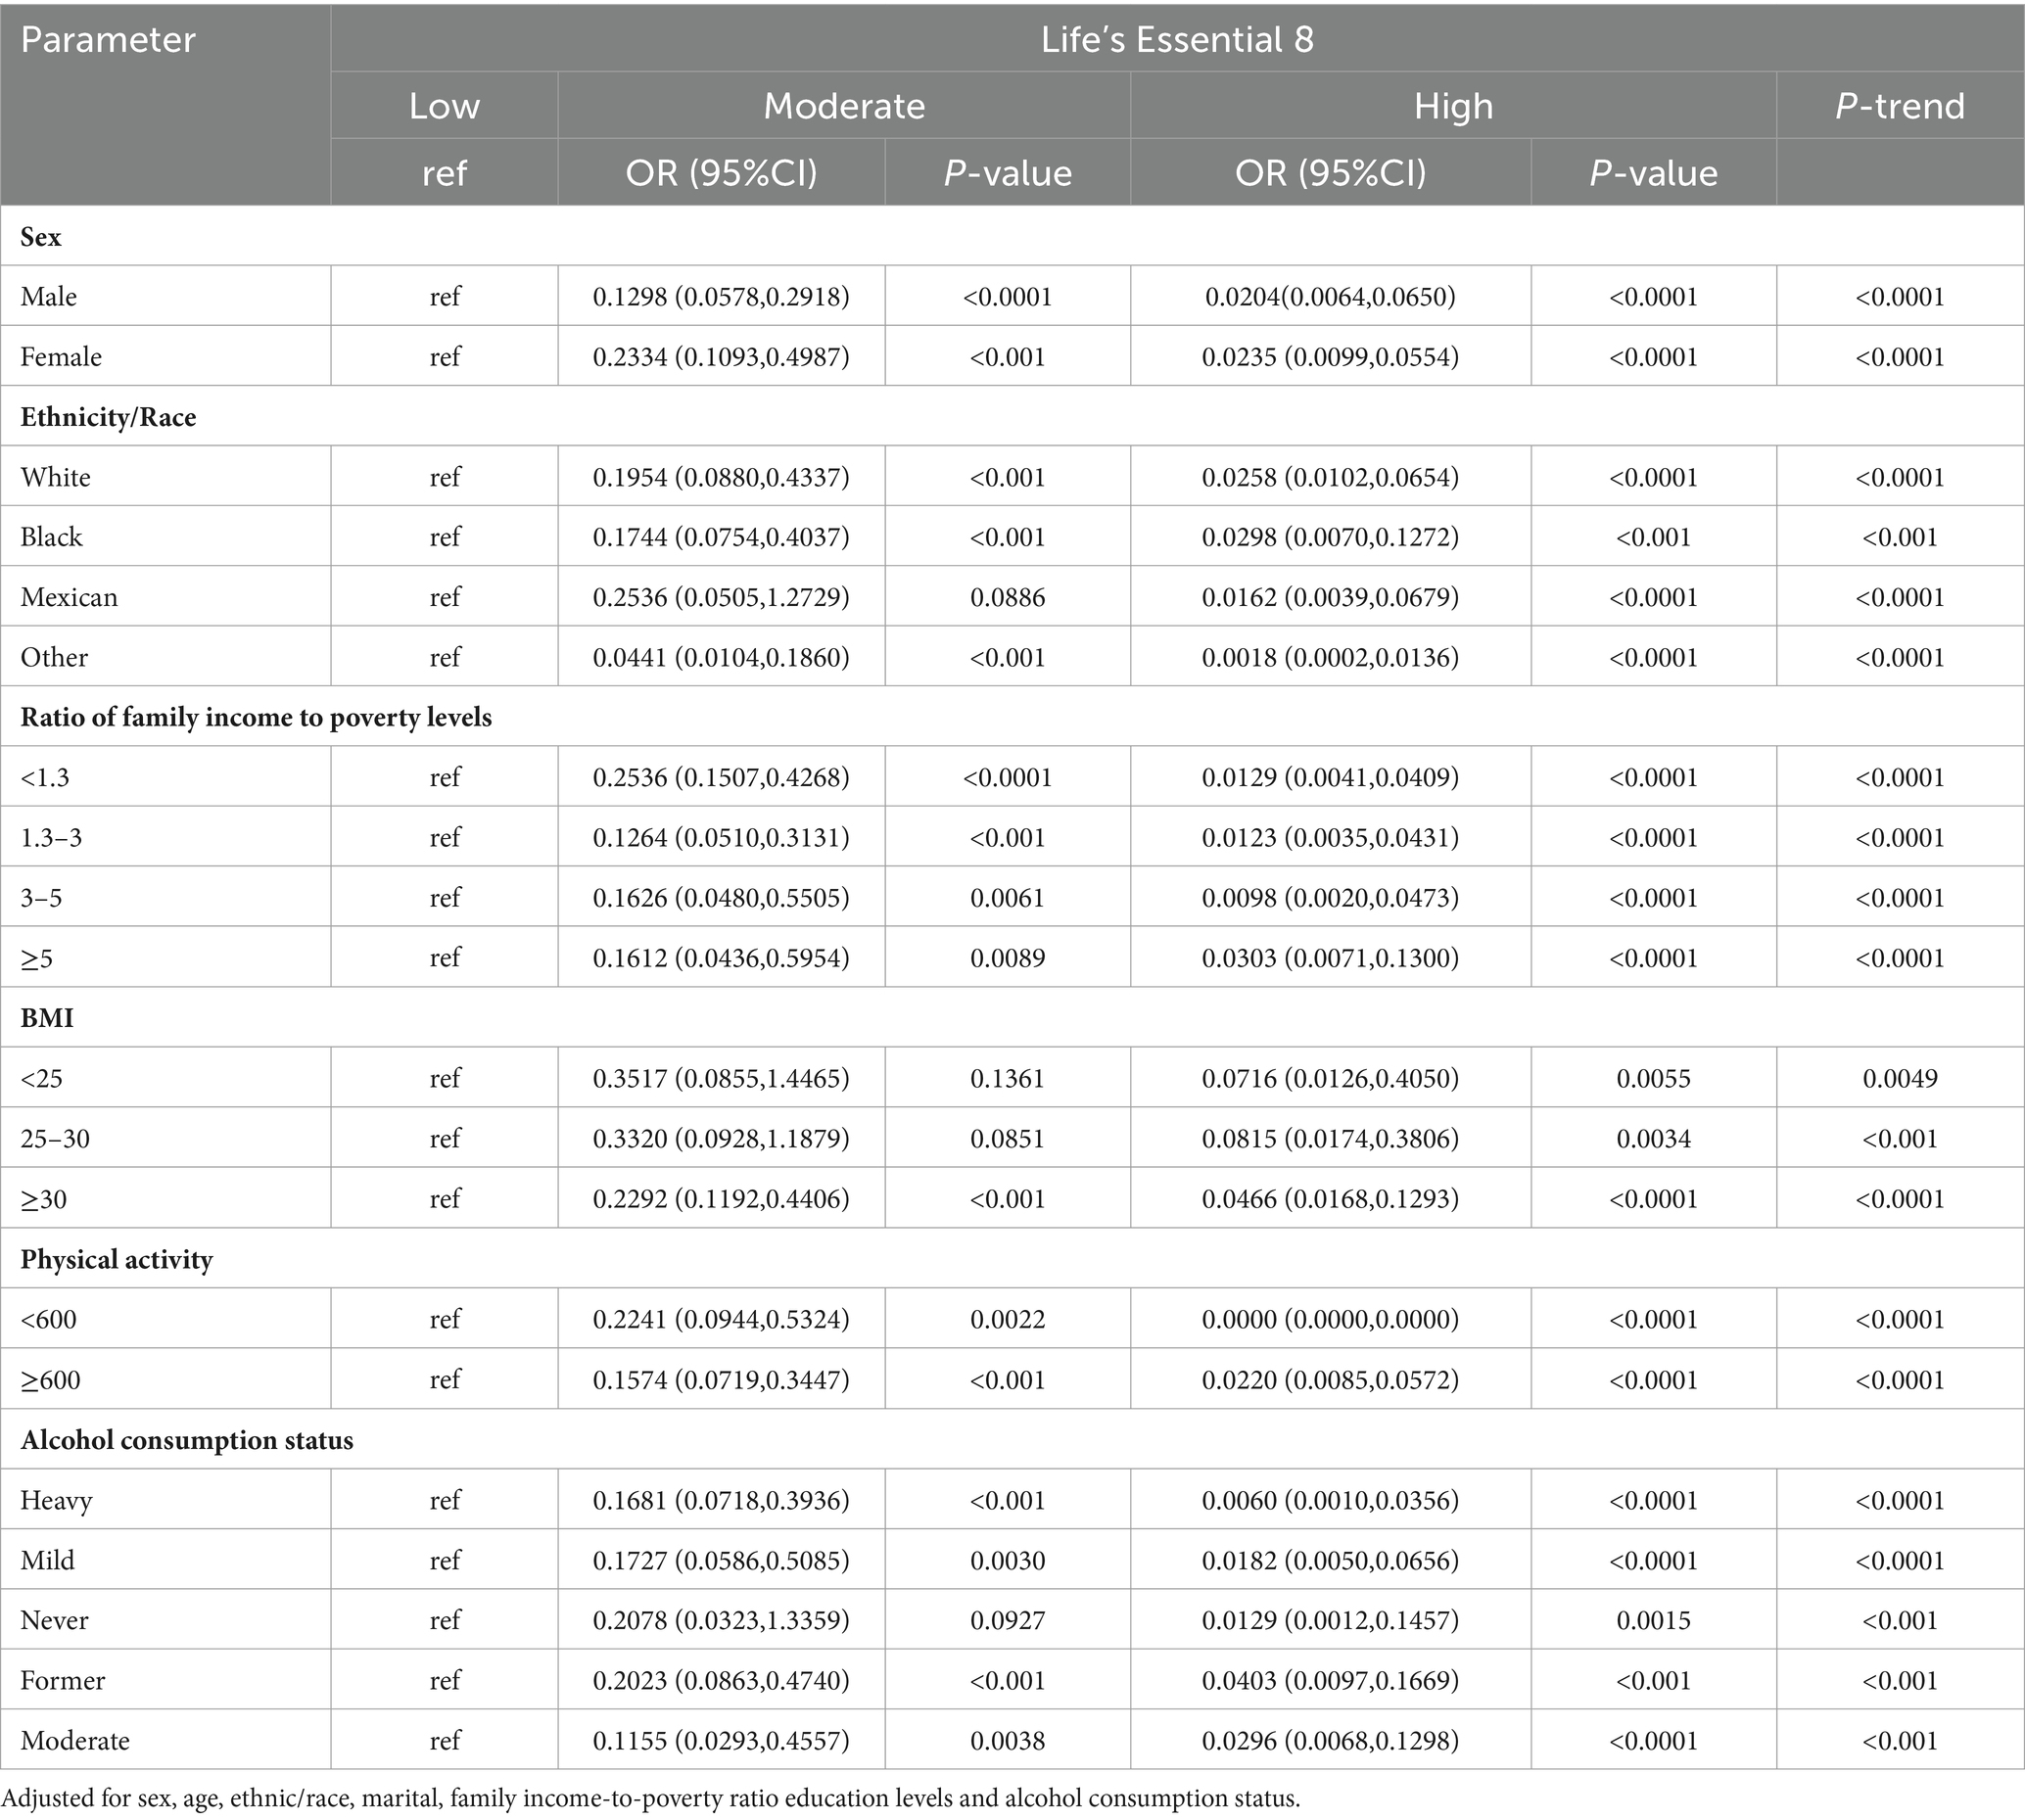
Table 4. Results of multiple logistic regression of participant scores Life’s Essential 8 with MetS-ATP subgroup analysis.
Furthermore, we also assessed associations between MetS and 2 inflammatory indices and 3 biological aging indicators. Based on our analysis, biological and phenotypic ages were strongly associated with MetS risk in various gender, race, family economic status, BMI, physical activity and alcohol intake populations (p < 0.05; Supplementary Tables 3A,B). Higher levels of CVH were associated with lower risk of MetS compared to low CVH (P-trend<0.05), with the strongest association being physical activity, with a high CVH OR = 0.0000 (95%Cl 0.0000,0.0000) compared to low CVH in the <600 min/month group. Further analysis of its components (health factors and health behaviors) in LE8, see Supplementary Tables 2A,B, similarly saw the same trend of negative associations between health factor scores and MetS across subgroups (P-trend < 0.05). In contrast, the negative association of health behavior scores with MetS was correlated among participants who were female, white, had a household income to poverty ratio of ≥5, BMI ≥ 30, Physical Activity ≥ 600, and heavy drinkers, with ORs for high-scoring health behaviors compared to low-scoring health behaviors of (0.4676, 95%Cl 0.2669,0.8191), (0.5399, 95%Cl 0.3285,0.8873), (0.3444,95%Cl 0.1251,0.9483), (0.3790, 95%Cl 0.2073,0.6928), (0.5829, 95%Cl 0.3279,1.0362), (0.3206, 95%Cl 0.1728, 0.5948) (P-trend < 0.05).
The association of two inflammatory indices and three biological aging indicators with MetS was also examined in subgroup analyses, suggesting that biological age and phenotypic age were positively associated with MetS among participants in different gender, race, household economic status, BMI, physical activity, and alcohol intake groups (p < 0.05; Supplementary Tables 3A,B).
3.5 Mediation analyses
We employed parallel mediation assessment to assess modulatory roles of biological aging (phenotypic age, circulating Klotho, biological age) and inflammatory index (SII, DII) in the intricate relationship between the LE8, health behavior, and health factor scores and MetS risk.
Of note, phenotypic age exhibited a strong modulatory role on the relationship between LE8, health behavior, and health factor scores and MetS risk, with mediation proportions 0.13%, p ≤ 0.001; 0.0.69%, p = 0.240; 0.08%; and p ≤ 0.001, respectively.
Biological age exhibited a strong modulatory role on the relationship between LE8 and MetS risk, with mediation proportions at 0.08%, p ≤ 0.001 (Figure 2).
3.6 Sensitivity analysis
A new MetS definition was presented at the International Diabetes Federation (IDF) workshop in 2005, which was distinct from the ATP III description in that it emphasized central obesity as a prerequisite (23). In 2009, IDF renewed the MetS definition yet again, reducing the importance of waist measurement from 2006. Under the new definition, waist size was only used as a preliminary screening tool, with strict thresholds set for the waist circumference, based on distinct ethnic populations (24). Given that certain articles employed the IDF-based MetS diagnosis in 2005 and 2009, sensitivity analysis was conducted to validate whether distinct diagnostic criteria impacted the conclusions of this investigation (Supplementary Tables 4–7). We revealed robust inverse relationships between LE8 and health factors and MetS even under different diagnostic criteria (Figure 3).
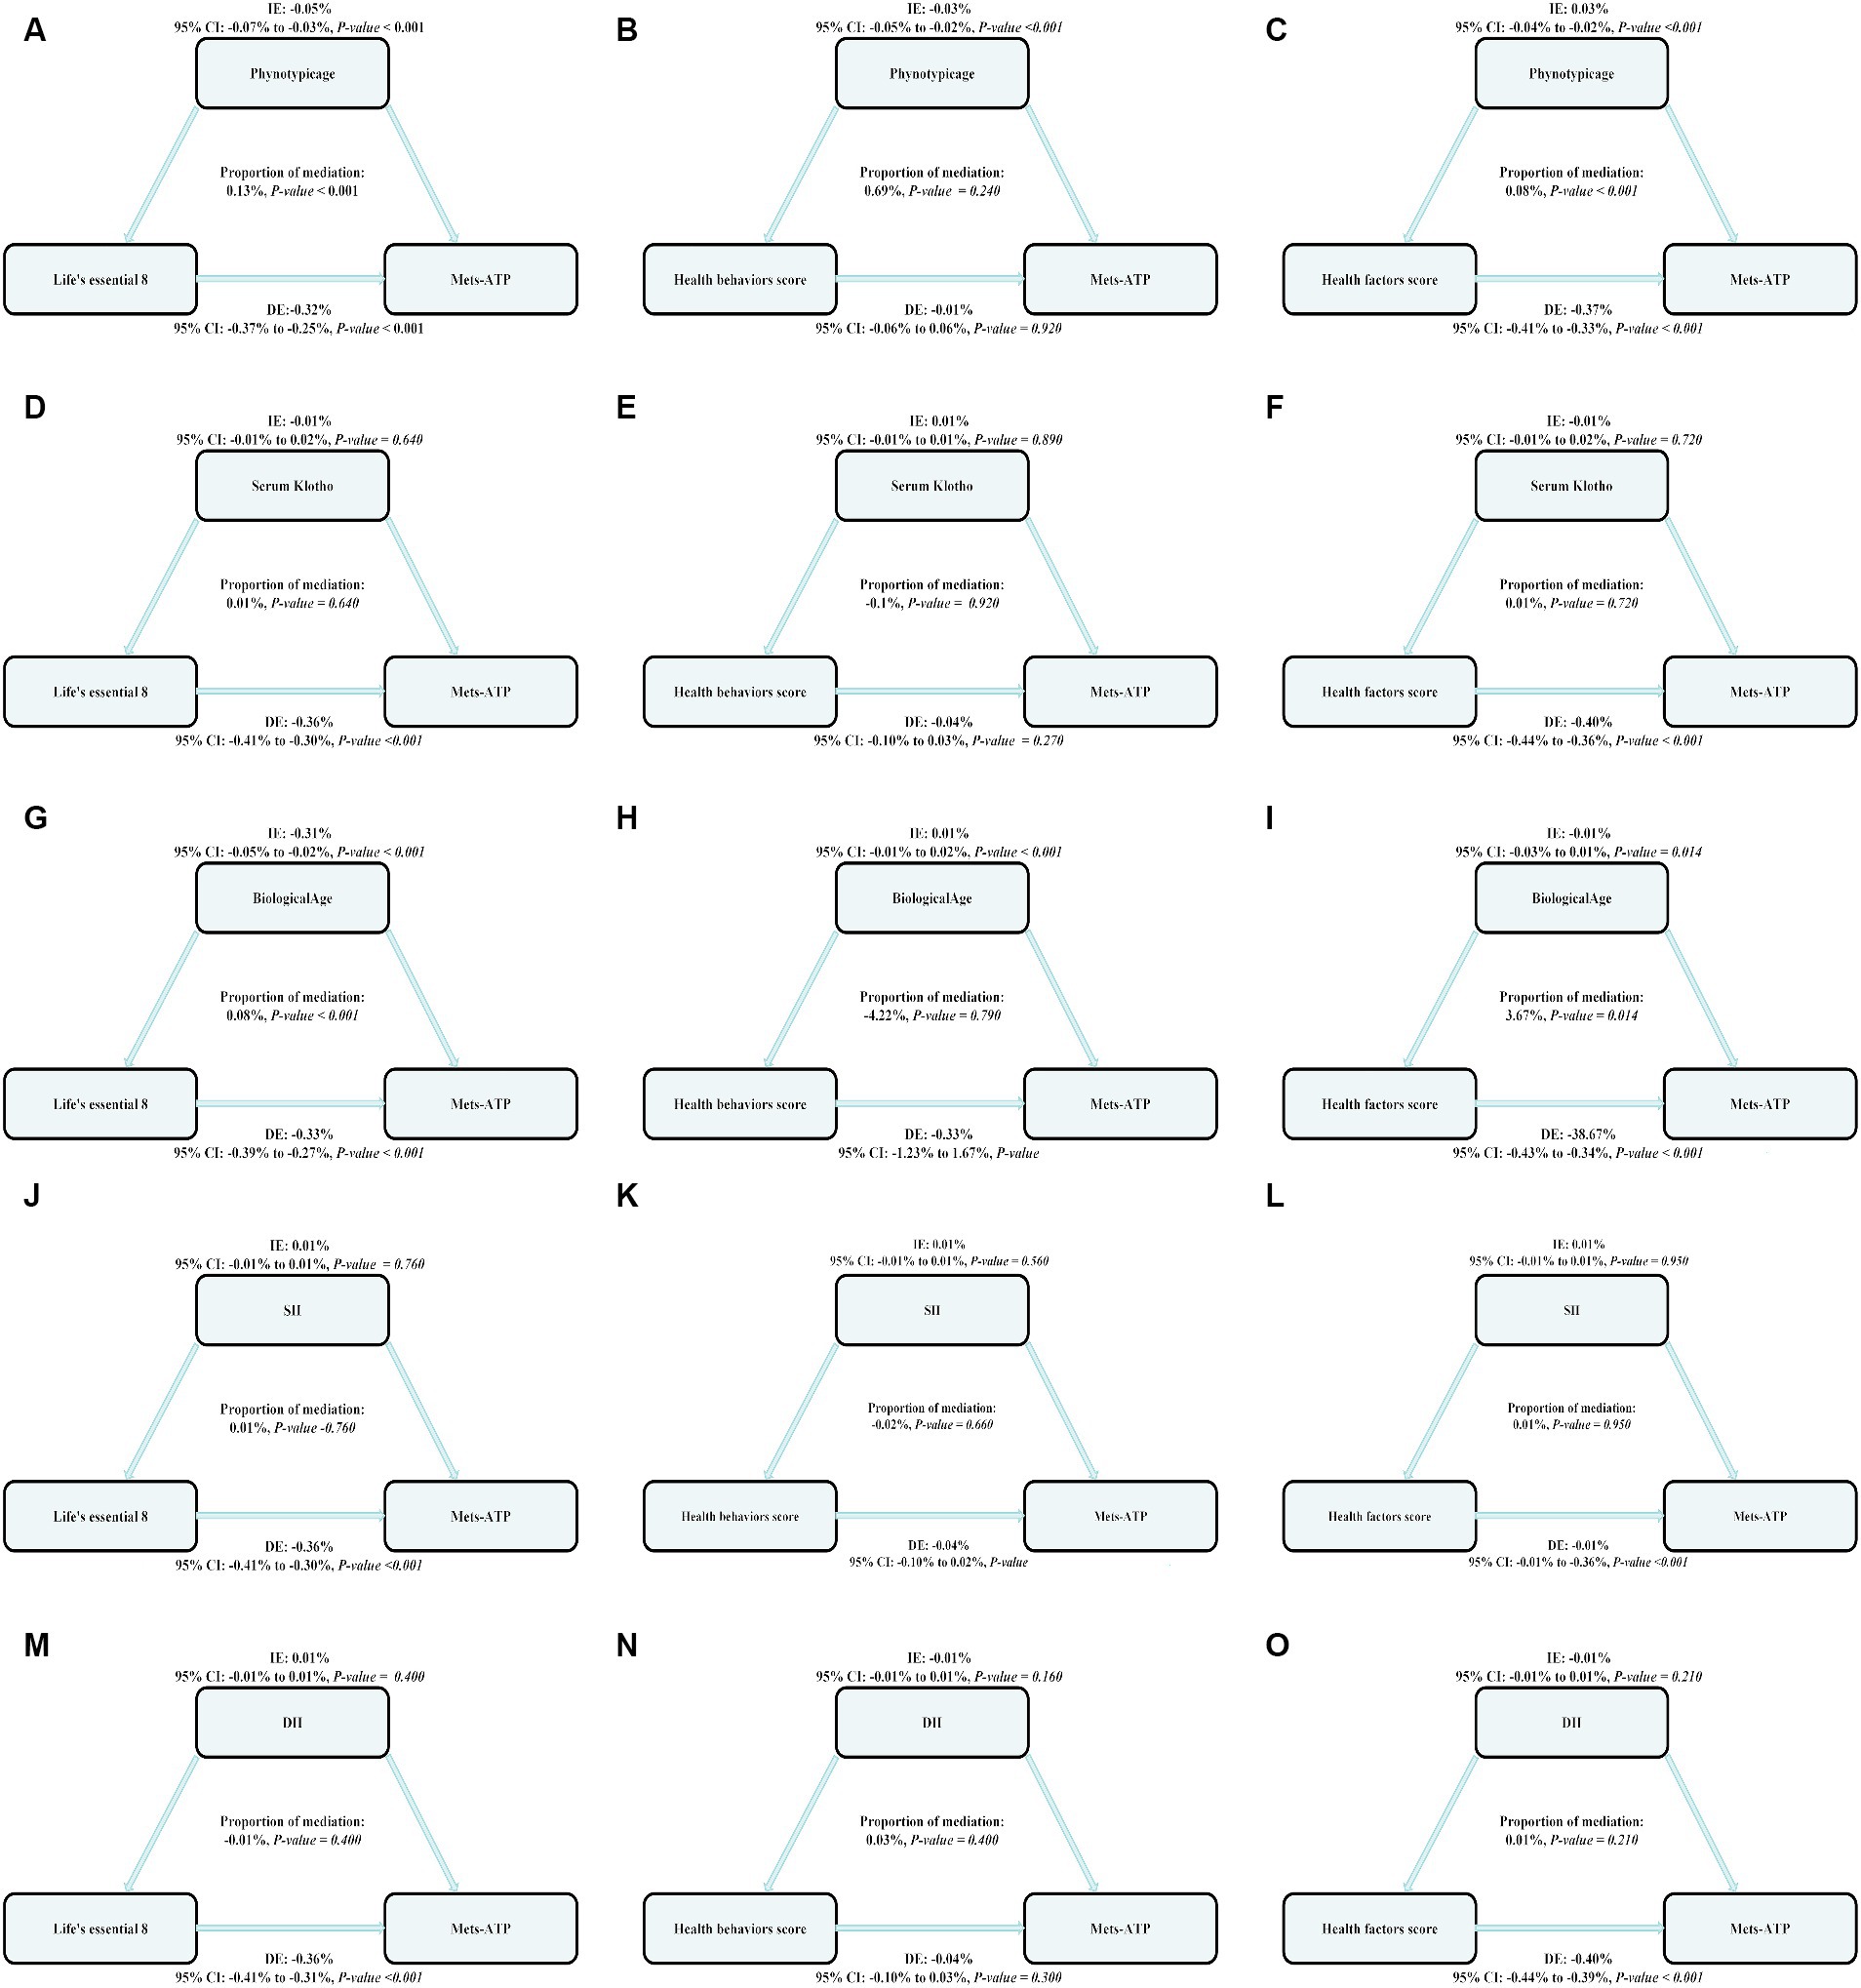
Figure 3. The estimated proportions of the associations between LE8, health behavior score, health factor score and MetS mediated effect by the Biological aging (Phenotypic age, Serum Klotho, Biological age) and inflammation index (SII, DII). Model adjusted for Sex, Age, Ethnic/race, Marital, Family income-to-poverty ratio Education levels and Alcohol consumption status. IE, the estimate of the indirect effect; DE, the estimate of the direct effect; Proportion of mediation = IE/DE + IE, OR, odds ratio. Panels (A–C) show the relationship between LE8, health behavior, and health factor scores and MetS: the mediating effect of Phenotypic age. Panels (D–F) show the relationship between LE8, health behavior, and health factor scores and MetS: the mediating effect of Serum Klotho. Panels (G–I) show the relationship between LE8, health behavior, and health factor scores and MetS: the mediating effect of Biological age. Panels (J–L) show the relationship between LE8, health behavior, and health factor scores and MetS: the mediating effect of SII. Panels (M–O) show the relationship between LE8, health behavior, and health factor scores and MetS: the mediating effect of DII.
4 Discussion
In the current study, we provide two main novel findings based on the US general population; first, increasing LE8 scores in middle-aged and older adults (≥40 years old) reduces the risk of developing MetS. In addition, two aging indicators, Phenotypic age and Biological age, were identified as mediators of the positive association between LE8 and MetS risk.
Herein, we employed the National Cholesterol Education Program (NCEP)-based ATPIII criteria to diagnose MetS. In short, a participant was diagnosed with MetS if ≥3 out of the following 5 metabolic abnormalities were present: central obesity, increased TG content, diminished HDL-cholesterol contents, increased BP, and high fasting glucose levels (25). The aforementioned factors are also robust hazard factors for cardiovascular disease, Based on previous studies, indicating a strong link between MetS and cardiovascular disease risk (26). With rising economic development and a rapidly increasing elderly population, the MetS incidence is also rising, which poses a substantial health challenge to individuals and the public. MetS has multiple risk factors. At present, it is linked with lifestyle (27), aging (28) and low-grade inflammation (29). Among the aforementioned risk factors, unhealthy lifestyle namely, unhealthy diet (increased high-fat and high-sugar food intake), sedentary, and lack of exercise are modifiable factors that contribute to various lipid metabolic disorders, insulin resistance and liver steatosis, which, in turn, accelerates MetS development (25). LE8 is a quantifiable cardiovascular health (CVH) evaluation index, and it is otherwise known as “healthy eating, more activity, smoking cessation, adequate sleep, weight control, cholesterol management, BP control and diabetes hypoglycemia management,” in prior investigations, however, an LE8 and MetS correlation was hardly examined. The conclusions from this investigation are follows: a rise in LE8 scores among middle-aged and older adults is highly protective against MetS. Moreover, enhanced LE8 and health factor scores drastically decreased MetS risk. However, the relationship between LE8 and MetS has rarely been mentioned in previous studies. Our study provides the first epidemiologic evidence that LE8 scores are negatively associated with MetS among middle-aged and older adults. A recent study provided similar findings in a recent investigation (30), it was revealed that improvements in the 4 health factors in LE8 can profoundly diminish hypertension and diabetes risks among the general population, BP and blood sugar control can highly benefit (i.e., reduce) MetS risk. An IDF consensus (31) states that MetS is easily managed by encouraging healthy lifestyle choices, such as, healthy eating and proper increases in physical activity, which, in turn, enhance LE8 scores. Hence, MetS risk can potentially be diminished by enhancing LE8 scores, which, in turn, CVH.
In case of MetS mechanism, we focused on inflammatory. MetS is typically marked with reduced-grade chronic inflammation in all energy homeostasis-related tissues, such as, adipose tissue, islets and liver (32). Hotamisligil et al. (33) reported that an inflammatory cytokine TNF-α is highly expressed in the fat tissues of obese animal models. This was the first report that linked inflammation to obesity. In subsequent investigations, it was revealed that TNF-α is also upregulated in the fat and muscle tissues of obese individuals (34). SII is a newly discovered inflammatory biomarker that integrates 3 principal blood cell lineages and accurately represents inflammation complexity (15). Considering the association between inflammation and metabolic diseases, SII is gaining much interest in predicting metabolic diseases like cardiovascular diseases. An analysis of the NHANES database (35) suggested a strong correlation between augmented SII (abdominal obesity, hypertension and HDL-C) and MetS risk. In another study, diet was reported to be key in developing chronic inflammation (36). DII is a highly dependable biomarker that measures the impact of dietary factors on individual inflammatory response. Several investigations demonstrated an intricate link between DII and MetS, however, there is controversy in the results. One survey from the Korean KNHANES database (37) revealed that DII is strongly related to MetS frequency in men and postmenopausal women. However, an emerging study reported no marked association between inflammatory potential of DII-evaluated diets and MetS risk. Herein, we demonstrated a strong direct association between augmented DII scores and MetS risk among middle-aged and older adults, thereby indicating that decreasing DII scores (using diet adjustments) can potentially prevent the onset and progression of MetS among middle-aged and older populations.
Based on the aforementioned statistical results, we next performed mediation analysis for the two inflammatory biomarkers. We revealed that both SII and DII did not modulate the relationship between MetS and 4 health behaviors and 4 health factors in LE8. This indicated that LE8 may modulate MetS using other channels.
Aging is a possible mechanism linked with MetS. Aging occurs as a result of several multifaceted and complicated factors that cannot solely be explained by the physiological decline over time. In fact, this alteration is strongly associated with several age-associated human chronic diseases, and not the actual age of the individual. Distinct from the real age, certain Biological aging indicators, namely, Biological age, Phenotypic age and circulating Klotho as reliable aging indicators, as reported in multiple clinical studies (38–40). However, no prior investigations associated the aforementioned 3 aging bioindicators with MetS risk. Herein, We first linked phenotypic age, Serum Klotho, and biological age to MetS among middle-aged and elderly individuals. Using single factor analysis, it was revealed that both phenotypic and biological ages were intricately linked to MetS. Following confounding factors adjustment, namely, patient sex, age, ethnicity/race, marital status, family income to poverty ratio, education status, alcohol consumption status, phenotypic age and biological age were still directly associated with MetS risk among the middle-aged and elderly population in various subgroups. In addition, we observed no marked correlation between circulating Klotho and MetS risk among middle-aged and elderly patients. We further performed mediation analyses for the phenotypic age, circulating Klotho levels, and biological age. We revealed that the phenotypic age mediated strong associations between LE8, health behavior, and health factor scores and MetS risk, with proportions 0.13%, p ≤ 0.001;0.0.69%, p = 0.240;0.08%; and p ≤ 0.001, respectively. The biological age also mediated the relationship between LE8 scores and MetS risk, with 0.08% ratio, p ≤ 0.001. A study involving the NHANES US population (41) reported a marked inverse association between LE8 score and phenotypic age progression rate. In particular, they observed a substantial decrease in phenotypic age of 1.14 years for every 10-point rise in the LE8 score. These results were strongly corroborated in another investigation, indicating that the LE8, health behavior and health factor scores were inversely proportional to the phenotypic age, biological age, with evidences of stronger correlations between health factors and MetS risk, and the correlation was stronger for health factors, which is similar to our findings (42). Improving health factors and healthy behaviors, such as, good BMI, lipids, blood sugar and BP can significantly enhance the LE8 scores, and assist in slowing down the aging process. According to emerging reports (43), maintaining a proper BMI can significantly enhance physical function among older adults, reduce metabolic diseases, and related medical costs, while increasing healthy life expectancy. Another investigation (44) revealed that human lipids are critical modulators of longevity, and maintaining ideal lipid status is a robust anti-aging strategy. Additionally, in a cross-sectional investigation involving 288 adults aged ≥ 50 years (45), it was reported that hypertension is strongly related to a rapidly increased epigenetic age, and this followed a dose-dependent pattern, confirming that BP management is an efficacious anti-aging approach. The correlation between hyperglycemia and aging has been validated in multiple studies: a 2-year prospective cohort investigation (46) revealed that MetS, prediabetic, and diabetic patients were at an enhanced cognitive impairment risk. In conclusion, the above evidence supports our finding that improved LE8 may regulate aging. In addition, studies have pointed out that MetS is profiled as a series of distinct metabolic abnormalities related to oxidative stress and significantly diminished antioxidant protection mechanisms. These conditions reduce telomere lengths, Telomere length is exacerbated by the cumulative effects of its components, such as obesity, high blood sugar and high blood pressure, and in presence of extremely short telomere lengths in ≥1 chromosomes, the genomic integrity is lost, which increases cell proliferation restriction via processes like senescence and apoptosis (47, 48). This, in turn, worsens MetS progression. Improving LE8 health behaviors, for example, jogging, increasing consumption of fiber diet, and adequate sleep, can significantly increase endogenous antioxidant expressions, which may delay telomere attrition, reduces oxidative stress and mitochondrial dysfunction (49–51), thereby delaying MetS progression. According to the above, our findings provide a better understanding of the role of aging in the relationship between LE8 and MetS.
As the understanding of MetS deepens, the diagnostic criteria for MetS are constantly being updated. The MetS definition was renewed at the IDF workshop in 2006, by emphasizing central obesity as a prerequisite to MetS (5). In 2009, IDF again revised the MetS definition, reducing the relevance of waist measurement. The waist size was only used as a preliminary screening tool, with discreet waist circumference cut-offs for people of different ethnic origins (52). To verify whether the different diagnostic criteria affected the results of this study, we performed a sensitivity analysis, We found a significant inverse association between LE8 and health factors and risk of MetS whether using the diagnostic criteria for 2006 or 2009 IDF.
Among the strengths of this investigation is that this was the first to analyze the link between augmented LE8 scores and MetS in a relatively large patient population. Secondly, we demonstrated that 2 inflammatory and 3 aging markers strongly modulated the relationship between LE8 scores and MetS risk. Nonetheless, this research has certain limitations. Firstly, this was a cross-sectional investigation involving United States adult residents over 40 years of age. Thus, it is nearly impossible to establish a precise chronological order or eliminate cases involving reverse causality and internal bias. Secondly, the NHANES trial has multiple internal biases. Thirdly, it is likely that there were residual and unconsidered confounding factors and test errors that may have affected the outcomes of this study. Fourthly, despite adjusting the survey cycle, the duration of our analysis was insufficient and may have introduced bias in our results. Lastly, we conducted mediation analysis using a cross-sectional study design, therefore, it was challenging to infer causality. Considering the aforementioned limitations, our conclusions must be perceived with caution, and additional investigation is necessary to further support our findings.
5 Conclusion
This study showed a negative correlation between LE8 score and MetS among middle-aged and elderly individual, and the negative association of both is partly mediated by biological aging.
A rise in the LE8 score s protects against MetS. In fact, elevated LE8 and health factor scores strongly diminish MetS risk. Furthermore, biological aging-associated markers, such as, Phenotypic age, Biological age and MetS incidence were directly correlated among middle-aged and elderly individuals. Moreover, using mediation analyses, we revealed that the LE8 and MetS risk association was potentially modulated by biological aging. Thus, we identified aging as a risk factor for MetS, and highlighted anti-aging approaches as a potential way to increase LE8 and protect against MetS incidence.
Data availability statement
The datasets presented in this study can be found in online repositories. The names of the repository/repositories and accession number(s) can be found in the article/Supplementary material.
Ethics statement
The studies involving humans were approved by the NCHS Research Ethics Review Board. The studies were conducted in accordance with the local legislation and institutional requirements. The participants provided their written informed consent to participate in this study.
Author contributions
RG: Conceptualization, Data curation, Visualization, Writing – review & editing. SX: Resources, Software, Supervision, Writing – original draft. XL: Validation, Writing – original draft. HW: Visualization, Writing – original draft. SQ: Data curation, Investigation, Writing – original draft. BL: Formal analysis, Writing – original draft. CL: Conceptualization, Funding acquisition, Project administration, Writing – review & editing. JC: Methodology, Project administration, Resources, Visualization, Writing – review & editing.
Funding
The author(s) declare that financial support was received for the research, authorship, and/or publication of this article. This work was supported by the National Natural Science Foundation of China (grant no. 82360052).
Acknowledgments
The authors thank the National Health and Nutrition Examination Survey participants and staff and the National Center for Health Statistics for their valuable contributions.
Conflict of interest
The authors declare that the research was conducted in the absence of any commercial or financial relationships that could be construed as a potential conflict of interest.
Publisher’s note
All claims expressed in this article are solely those of the authors and do not necessarily represent those of their affiliated organizations, or those of the publisher, the editors and the reviewers. Any product that may be evaluated in this article, or claim that may be made by its manufacturer, is not guaranteed or endorsed by the publisher.
Supplementary material
The Supplementary material for this article can be found online at: https://www.frontiersin.org/articles/10.3389/fmed.2024.1380464/full#supplementary-material
References
1. Saklayen, MG . The global epidemic of the metabolic syndrome. Curr Hypertens Rep. (2018) 20:12. doi: 10.1007/s11906-018-0812-z
2. Gustavo de Sousa Barbalho, Y, Morato Stival, M, Ramos de Lima, L, Cristina Rodrigues da Silva, I, de Oliveira Silva, A, Vieira Gomes da Costa, M, et al. Impact of metabolic syndrome components in high-risk cardiovascular disease development in older adults. Clin Interv Aging. (2020) 15:1691–700. doi: 10.2147/CIA.S252589
3. Rus, M, Crisan, S, Andronie-Cioara, FL, Indries, M, Marian, P, Pobirci, OL, et al. Prevalence and risk factors of metabolic syndrome: a prospective study on cardiovascular health. Medicina. (2023) 59:1711. doi: 10.3390/medicina59101711
4. Ma, H, Wang, X, Xue, Q, Li, X, Liang, Z, Heianza, Y, et al. Cardiovascular health and life expectancy among adults in the United States. Circulation. (2023) 147:1137–46. doi: 10.1161/CIRCULATIONAHA.122.062457
5. Sherling, DH, Perumareddi, P, and Hennekens, CH. Metabolic syndrome. J Cardiovasc Pharmacol Ther. (2017) 22:365–7. doi: 10.1177/1074248416686187
6. Tilg, H, and Moschen, AR. Inflammatory mechanisms in the regulation of insulin resistance. Mol Med. (2008) 14:222–31. doi: 10.2119/2007-00119.Tilg
7. Nishimura, S, Manabe, I, Nagasaki, M, Eto, K, Yamashita, H, Ohsugi, M, et al. CD8+ effector T cells contribute to macrophage recruitment and adipose tissue inflammation in obesity. Nat Med. (2009) 15:914–20. doi: 10.1038/nm.1964
8. Chawla, A, Nguyen, KD, and Goh, YPS. Macrophage-mediated inflammation in metabolic disease. Nat Rev Immunol. (2011) 11:738–49. doi: 10.1038/nri3071
9. Li, L, and Dai, F. Comparison of the associations between life’s essential 8 and life’s simple 7 with depression, as well as the mediating role of oxidative stress factors and inflammation: NHANES 2005-2018. J Affect Disord. (2024) 351:31–9. doi: 10.1016/j.jad.2024.01.200
10. Zipf, G, Chiappa, M, Porter, KS, Ostchega, Y, Lewis, BG, and Dostal, J. National health and nutrition examination survey: plan and operations, 1999-2010. Vital Health Stat 1. (2013) 56:1–37.
11. Borrud, L, Chiappa, MM, Burt, VL, Gahche, J, Zipf, G, Johnson, CL, et al. National health and nutrition examination survey: national youth fitness survey plan, operations, and analysis, 2012. Vital Health Stat 2. (2014) 163:1–24.
12. von Elm, E, Altman, DG, Egger, M, Pocock, SJ, Gøtzsche, PC, and Vandenbroucke, JP. The strengthening the reporting of observational studies in epidemiology (STROBE) statement: guidelines for reporting observational studies. Lancet. (2007) 370:1453–7. doi: 10.1016/S0140-6736(07)61602-X
13. Lloyd-Jones, DM, Allen, NB, Anderson, CAM, Black, T, Brewer, LC, Foraker, RE, et al. Life’s essential 8: updating and enhancing the American heart association’s construct of cardiovascular health: a presidential advisory from the american heart association. Circulation. (2022) 146:e18–43. doi: 10.1161/CIR.0000000000001078
14. Krebs-Smith, SM, Pannucci, TE, Subar, AF, Kirkpatrick, SI, Lerman, JL, Tooze, JA, et al. Update of the healthy eating index: HEI-2015. J Acad Nutr Diet. (2018) 118:1591–602. doi: 10.1016/j.jand.2018.05.021
15. Hu, B, Yang, XR, Xu, Y, Sun, YF, Sun, C, Guo, W, et al. Systemic immune-inflammation index predicts prognosis of patients after curative resection for hepatocellular carcinoma. Clin Cancer Res. (2014) 20:6212–22. doi: 10.1158/1078-0432.CCR-14-0442
16. Shivappa, N, Steck, SE, Hurley, TG, Hussey, JR, and Hébert, JR. Designing and developing a literature-derived, population-based dietary inflammatory index. Public Health Nutr. (2014) 17:1689–96. doi: 10.1017/S1368980013002115
17. Wang, H, Qin, S, Li, F, Zhang, H, and Zeng, L. A cross-sectional study on the association between dietary inflammatory index and hyperuricemia based on NHANES 2005-2018. Front Nutr. (2023) 10:1218166. doi: 10.3389/fnut.2023.1218166
18. Klemera, P, and Doubal, S. A new approach to the concept and computation of biological age. Mech Ageing Dev. (2006) 127:240–8. doi: 10.1016/j.mad.2005.10.004
19. Levine, ME, Lu, AT, Quach, A, Chen, BH, Assimes, TL, Bandinelli, S, et al. An epigenetic biomarker of aging for lifespan and healthspan. Aging. (2018) 10:573–91. doi: 10.18632/aging.101414
20. Kuro-O, M . The klotho proteins in health and disease. Nat Rev Nephrol. (2019) 15:27–44. doi: 10.1038/s41581-018-0078-3
21. Rattan, P, Penrice, DD, Ahn, JC, Ferrer, A, Patnaik, M, Shah, VH, et al. Inverse association of telomere length with liver disease and mortality in the US population. Hepatol Commun. (2022) 6:399–410. doi: 10.1002/hep4.1803
22. Mahemuti, N, Jing, X, Zhang, N, Liu, C, Li, C, Cui, Z, et al. Association between systemic immunity-inflammation index and hyperlipidemia: a population-based study from the NHANES (2015-2020). Nutrients. (2023) 15:1177. doi: 10.3390/nu15051177
23. Seidell, JC, Deurenberg, P, and Hautvast, JG. Obesity and fat distribution in relation to health—current insights and recommendations. World Rev Nutr Diet. (1987) 50:57–91. doi: 10.1159/000414170
24. Alberti, KGMM, Eckel, RH, Grundy, SM, Zimmet, PZ, Cleeman, JI, Donato, KA, et al. Harmonizing the metabolic syndrome: a joint interim statement of the international diabetes federation task force on epidemiology and prevention; National Heart, Lung, and Blood Institute; American Heart Association; world heart federation; international atherosclerosis society; and International Association for the Study of obesity. Circulation. (2009) 120:1640–5. doi: 10.1161/CIRCULATIONAHA.109.192644
25. Grundy, SM, Cleeman, JI, Daniels, SR, Donato, KA, Eckel, RH, Franklin, BA, et al. Diagnosis and management of the metabolic syndrome: an American heart association/national heart, lung, and blood institute scientific statement. Circulation. (2005) 112:2735–52. doi: 10.1161/CIRCULATIONAHA.105.169404
26. Rochlani, Y, Pothineni, NV, Kovelamudi, S, and Mehta, JL. Metabolic syndrome: pathophysiology, management, and modulation by natural compounds. Ther Adv Cardiovasc Dis. (2017) 11:215–25. doi: 10.1177/1753944717711379
27. Niu, M, Chen, J, Hou, R, Sun, Y, Xiao, Q, Pan, X, et al. Emerging healthy lifestyle factors and all-cause mortality among people with metabolic syndrome and metabolic syndrome-like characteristics in NHANES. J Transl Med. (2023) 21:239. doi: 10.1186/s12967-023-04062-1
28. Meng, Y, Eirin, A, Zhu, XY, Tang, H, Hickson, LJ, Lerman, A, et al. Micro-RNAS regulate metabolic syndrome-induced senescence in porcine adipose tissue-derived mesenchymal stem cells through the p16/MAPK pathway. Cell Transplant. (2018) 27:1495–503. doi: 10.1177/0963689718795692
29. Wensveen, FM, Jelenčić, V, Valentić, S, Šestan, M, Wensveen, TT, Theurich, S, et al. NK cells link obesity-induced adipose stress to inflammation and insulin resistance. Nat Immunol. (2015) 16:376–85. doi: 10.1038/ni.3120
30. Chen, D, Zhang, H, Wu, J, Xue, E, Guo, P, Tang, L, et al. Effects of an individualized mHealth-based intervention on health behavior change and cardiovascular risk among people with metabolic syndrome based on the behavior change wheel: quasi-experimental study. J Med Internet Res. (2023) 25:e49257. doi: 10.2196/49257
31. Alberti, KGMM, Zimmet, P, and Shaw, J. Metabolic syndrome--a new world-wide definition. A consensus statement from the international diabetes federation. Diabet Med. (2006) 23:469–80. doi: 10.1111/j.1464-5491.2006.01858.x
32. Hotamisligil, GS . Inflammation, metaflammation and immunometabolic disorders. Nature. (2017) 542:177–85. doi: 10.1038/nature21363
33. Hotamisligil, GS, Shargill, NS, and Spiegelman, BM. Adipose expression of tumor necrosis factor-alpha: direct role in obesity-linked insulin resistance. Science. (1993) 259:87–91. doi: 10.1126/science.7678183
34. Saghizadeh, M, Ong, JM, Garvey, WT, Henry, RR, and Kern, PA. The expression of TNF alpha by human muscle. Relationship to insulin resistance. J Clin Invest. (1996) 97:1111–6. doi: 10.1172/JCI118504
35. Zhao, Y, Shao, W, Zhu, Q, Zhang, R, Sun, T, Wang, B, et al. Association between systemic immune-inflammation index and metabolic syndrome and its components: results from the national health and nutrition examination survey 2011-2016. J Transl Med. (2023) 21:691. doi: 10.1186/s12967-023-04491-y
36. Santa, K . Healthy diet, grape phytochemicals, and vitamin D: preventing chronic inflammation and keeping good microbiota. Endocr Metab Immune Disord Drug Targets. (2023) 23:777–800. doi: 10.2174/1871530323666221017151705
37. Kim, HY, Lee, J, and Kim, J. Association between dietary inflammatory index and metabolic syndrome in the general korean population. Nutrients. (2018) 10:648. doi: 10.3390/nu10050648
38. Wang, K, Mao, Y, Lu, M, Liu, X, Sun, Y, Li, Z, et al. Association between serum klotho levels and the prevalence of diabetes among adults in the United States. Front Endocrinol. (2022) 13:1005553. doi: 10.3389/fendo.2022.1005553
39. Ma, Q, Li, BL, Yang, L, Zhang, M, Feng, XX, Li, Q, et al. Association between phenotypic age and mortality in patients with multivessel coronary artery disease. Dis Markers. (2022) 2022:4524032. doi: 10.1155/2022/4524032
40. Wu, JW, Yaqub, A, Ma, Y, Koudstaal, W, Hofman, A, Ikram, MA, et al. Biological age in healthy elderly predicts aging-related diseases including dementia. Sci Rep. (2021) 11:15929. doi: 10.1038/s41598-021-95425-5
41. Liu, W, Wang, J, Wang, M, Hou, H, Ding, X, Ma, L, et al. Oxidative stress factors mediate the association between life’s essential 8 and accelerated phenotypic aging: NHANES 2005-2018. J Gerontol A Biol Sci Med Sci. (2024) 79:240. doi: 10.1093/gerona/glad240
42. Zhang, R, Wu, M, Zhang, W, Liu, X, Pu, J, Wei, T, et al. Association between life’s essential 8 and biological ageing among US adults. J Transl Med. (2023) 21:622. doi: 10.1186/s12967-023-04495-8
43. Edwards, CH, Aas, E, and Kinge, JM. Body mass index and lifetime healthcare utilization. BMC Health Serv Res. (2019) 19:696. doi: 10.1186/s12913-019-4577-0
44. Handee, W, Li, X, Hall, KW, Deng, X, Li, P, Benning, C, et al. An energy-independent pro-longevity function of triacylglycerol in yeast. PLoS Genet. (2016) 12:e1005878. doi: 10.1371/journal.pgen.1005878
45. Xiao, L, Zan, G, Liu, C, Xu, X, Li, L, Chen, X, et al. Associations between blood pressure and accelerated DNA methylation aging. J Am Heart Assoc. (2022) 11:e022257. doi: 10.1161/JAHA.121.022257
46. Gómez-Martínez, C, Babio, N, Júlvez, J, Becerra-Tomás, N, Martínez-González, MÁ, Corella, D, et al. Glycemic dysregulations are associated with worsening cognitive function in older participants at high risk of cardiovascular disease: two-year follow-up in the PREDIMED-plus study. Front Endocrinol. (2021) 12:754347. doi: 10.3389/fendo.2021.754347
47. Bree, RT, Stenson-Cox, C, Grealy, M, Byrnes, L, Gorman, AM, and Samali, A. Cellular longevity: role of apoptosis and replicative senescence. Biogerontology. (2002) 3:195–206. doi: 10.1023/a:1016299812327
48. Gavia-García, G, Rosado-Pérez, J, Arista-Ugalde, TL, Aguiñiga-Sánchez, I, Santiago-Osorio, E, and Mendoza-Núñez, VM. Telomere length and oxidative stress and its relation with metabolic syndrome components in the aging. Biology. (2021) 10:253. doi: 10.3390/biology10040253
49. Blackmon, CM, Tucker, LA, Bailey, BW, and Davidson, LE. Time spent jogging/running and biological aging in 4458 U.S. adults: an NHANES investigation. Int J Environ Res Public Health. (2023) 20:872. doi: 10.3390/ijerph20196872
50. Tucker, LA . Dietary fiber and telomere length in 5674 U.S. adults: an NHANES study of biological aging. Nutrients. (2018) 10:400. doi: 10.3390/nu10040400
51. Carroll, JE, Esquivel, S, Goldberg, A, Seeman, TE, Effros, RB, Dock, J, et al. Insomnia and telomere length in older adults. Sleep. (2016) 39:559–64. doi: 10.5665/sleep.5526
Keywords: middle-aged and elderly people, metabolic syndrome, Life’s Essential 8, biological aging, inflammation
Citation: Gou R, Xiong S, Liang X, Wu H, Qin S, Li B, Luo C and Chen J (2024) Relationship between Life’s Essential 8 and metabolic syndrome among older Americans (NHANES, 2007–2010): navigating biological aging and inflammation. Front. Med. 11:1380464. doi: 10.3389/fmed.2024.1380464
Edited by:
Senthil Kumaran Satyanarayanan, Hong Kong Institute of Innovation and Technology, Hong Kong SAR, ChinaReviewed by:
Muthu Raj Salaikumaran, Baylor College of Medicine, United StatesKaijian Hou, Shantou University, China
Copyright © 2024 Gou, Xiong, Liang, Wu, Qin, Li, Luo and Chen. This is an open-access article distributed under the terms of the Creative Commons Attribution License (CC BY). The use, distribution or reproduction in other forums is permitted, provided the original author(s) and the copyright owner(s) are credited and that the original publication in this journal is cited, in accordance with accepted academic practice. No use, distribution or reproduction is permitted which does not comply with these terms.
*Correspondence: Changjun Luo, luochangjun@gxmu.edu.cn; Junan Chen, 261782062@qq.com
†These authors have contributed equally to this work