Association of plasma lactoferrin levels with disease severity in glaucoma patients
 Zuo Wang1,2†
  Donghua Liu2† Hang Yuan3 An Li2 Jinxia Wang2 Xiong Zhu4 Wenbo Xiu2 Gao Zhang2 Yang Chen2 Lingling Chen3 Xiao Xiao2
  Chong He2,5*
  Fang Lu2,5,6*
- 1Department of Clinical Laboratory, Sichuan Clinical Research Center for Cancer, Sichuan Cancer Hospital & Institute, Sichuan Cancer Center, Affiliated Cancer Hospital of University of Electronic Science and Technology of China, Chengdu, China
- 2Clinical Immunology Translational Medicine Key Laboratory of Sichuan Province, Sichuan Provincial People’s Hospital, University of Electronic Science and Technology of China, Chengdu, China
- 3Department of Immunology, West China School of Basic Medical Sciences & Forensic Medicine, Sichuan University, Chengdu, China
- 4Department of Prenatal Diagnosis, Chengdu Women’s and Children’s Central Hospital, School of Medicine, University of Electronic Science and Technology of China, Chengdu, China
- 5Medico-Engineering Cooperation on Applied Medicine Research Center, University of Electronic Science and Technology of China, Chengdu, China
- 6Health Management Center, Sichuan Provincial People’s Hospital, University of Electronic Science and Technology of China, Chengdu, China
Objective: To explore the relationship between plasma lactoferrin (Lf) and glaucoma, assessing the clinical utility of Lf in glaucoma.
Methods: A cross-sectional study involved 161 glaucoma patients and 115 healthy controls, with a follow-up of 14 subjects after approximately 2 years. Plasma Lf markers were quantified using ELISA, comparing levels between glaucoma patients and healthy controls, and analyzing plasma Lf across different glaucoma severity grades.
Results: Glaucoma patients had significantly elevated plasma Lf levels compared to healthy controls (p < 0.001). Higher plasma Lf levels correlated with more severe disease stages (HPA grades showed ρ = 0.435, p < 0.001; AGIS grades showed ρ = 0.436, p < 0.001) and reduced retinal nerve fiber layer (RNFL) thickness (RNFL thickness showed ρ = −0.204, p = 0.024). ROC curve analysis demonstrated the efficacy of glaucoma markers in differentiating early-stage from advanced glaucoma.
Conclusion: Plasma Lf levels are significantly associated with glaucoma severity and may be involved in the pathogenic progression of the disease.
1 Introduction
Glaucoma is a chronic, progressive and irreversible neurodegenerative disease and one of the major causes of blindness globally with characteristic loss of retinal ganglion cell (RGCs) and damage of the optic nerve (1). Glaucoma is a complex disease caused by multiple factors, the pathogenesis and exact mechanism have remained obscure and debatable. Among its numerous evidence-based risk factors, elevated intraocular pressure (IOP) has been recognized as the most critical. Recent studies have elucidated that heightened intraocular pressure disrupts the normal iron homeostasis, subsequently inducing ferroptosis in the retinal ganglion cells in glaucoma (2). In patients diagnosed with acute primary angle-closure glaucoma (APACG), the levels of serum total iron and ferric iron were higher than those in healthy control subjects (3). Besides, epidemiological investigations have demonstrated a positive correlation between a diet rich in iron and increased serum ferritin levels with a higher incidence of glaucoma (4–6). These findings indicate a close association between iron metabolism and the pathogenesis of glaucoma.
Lactoferrin (Lf), a member of the transferrin family, has been recognized as a new key regulator in iron metabolism and homeostasis (7). This iron-binding glycoprotein is predominantly found in biological fluids and neutrophil granules. Lf plays a crucial role in controlling intestinal iron absorption and in iron transport, and it has the capacity to chelate iron, both directly and indirectly. It facilitates iron binding and transfer through various receptors among cells, serum, bile, and cerebrospinal fluid, thereby playing an essential role in maintaining iron equilibrium. Lf is implicated in a variety of pathologies related to iron dysregulation (8). For example, Lf concentrations are notably elevated in individuals with Proliferative Diabetic Retinopathy (PDR) as compared to those in normal subjects (9). However, there are few studies exploring the association between plasma Lf and glaucoma.
The objective of this research is to elucidate the potential correlations between plasma Lf levels and glaucoma. We conducted a comparative analysis of plasma Lf levels in glaucoma patients versus healthy controls, further examining these levels in correlation with varying degrees of glaucoma severity. Additionally, we assessed the relationship between plasma Lf levels and patient stratification based on retinal nerve fiber layer (RNFL) thickness and vertical cup-to-disc ratio (VCDR). Our objective was to find the potential clinical significance of plasma Lf in glaucoma.
2 Materials and methods
2.1 Subjects
Our study enrolled 161 patients, all of whom were enrolled from the Sichuan Provincial People’s Hospital. Adhering strictly to the Declaration of Helsinki guidelines, this study received full approval from the Institutional Review Board for Clinical Research at the Sichuan Provincial People’s Hospital (No. 201968). All individuals who are hospitalized to Sichuan Provincial People’s Hospital provided their written, informed permission for the use of their clinical data in this study. Between January 2021 and July 2023, comprehensive information was acquired from the medical records of the patients. As previously documented, ophthalmologists with specialized expertise employed ophthalmic examinations in conjunction with factors such as age, family history, and clinical manifestations indicative of glaucoma to establish a diagnosis. The following ocular tests were performed on each participant: IOP, mean deviation (MD), vertical cup-to-disk ratio (VCDR), thickness of the retinal nerve fiber layer (RNFL), and VF loss. To determine IOP, Goldmann applanation tonometry was employed. MD, RFNL, and VCDR were measured using OCT. VF was measured using automated perimetry as is customary. The following conditions had to be met in order for glaucoma patients to be included in the study: they had to be clinically diagnosed with the condition and be free of any autoimmune, inflammatory, or neurodegenerative illnesses (such as AD or PD). Additionally, this study involved an approximately two-year follow-up of 14 glaucoma patients, during which a series of ocular assessments were conducted on each individual. A total of 115 healthy controls who were matched for age and gender were included. The following were included as exclusion criteria: having glaucoma or a family history of glaucoma, complaining of eye pain, having an elevated IOP (>21 mmHg), having undergone recent surgery, or having any other neurological illnesses.
2.2 Collection of blood samples and ELISA
After patients had fasted for 8 h, blood samples were taken in the morning from the anterior elbow veins using EDTA-anticoagulated Vacutainer CPT tubes. Plasma was collected by centrifuging tubes for 10 min at 3,000 revolutions per minute. The plasma Lf level was determined using commercially Human LF ELISA kits (FineTest Batch No: FN230925). The experiment was carried out exactly as instructed.
2.3 Determination of glaucoma severity
Two methods were employed to ascertain the severity of glaucoma: the Hodapp, Parish, and Anderson (H-P-A) classification system and the advanced glaucoma intervention study scoring (AGIS) system (10). The H-P-A classification system primarily relied on the mean deviation (MD) of the visual field to determine the severity of glaucoma. An MD of greater than −6 dB indicated an early stage, while an MD ranging from −12 dB to −6 dB denoted a moderate stage, and an MD of no greater than −12 dB indicated a severe stage. Additional criteria for mild glaucoma stipulate that all points within the central 5 degrees must exhibit a sensitivity of at least 15 dB. Conversely, criteria for severe glaucoma require that points within the central 5 degrees demonstrate a sensitivity of less than 15 dB. On the other hand, the AGIS system determined the severity of glaucoma based on VF scores. A visual field score ranging from 3 to 5 indicated an early stage, a score ranging from 6 to 12 represented a moderate stage, a score ranging from 13 to 18 indicated a severe stage, and a score ranging from 18 to 20 was classified as end-stage glaucoma. Points were assigned to the score according to the following criteria: (1) If there was a nasal defect or nasal step, one point was added to the score. Additionally, if four or more of the six nasal test locations exhibited a depression of 12 dB or more, an additional point was added to the score. (2) In each hemifield, if there were one or more clusters of three or more adjacent depressed test locations (hemifield defects), one point was added to the score if there were 3 to 5 depressed test sites in the clusters; two points were added if there were 6 to 12 depressed test sites; three points were added if there were 13 to 20 depressed test sites; and four points were added if there were more than 20 depressed test sites. (3) If half or more of the adjacent defective locations in a hemifield exhibited a depression of 28 dB or more, five points were added to the score. Similarly, if half or more of the adjacent defective locations were depressed 24 dB or more, four points were added; if depressed 20 dB or more, three points were added; if depressed 16 dB or more, two points were added; and if depressed 12 dB or more, one point was added. This series of steps could potentially add up to five points to the score for each hemifield containing a deep defect. (4) If a hemifield lacked a cluster of three adjacent depressed test sites but contained at least two adjacent depressed sites, with one site having a depression of 12 dB or more, one point was added to the score. (5) The scores for each hemifield and for the nasal area were then summed. The maximum achievable score was 20, with 2 points for the nasal field and 9 points for each hemifield.
2.4 Statistics analysis
For the statistical study, R (version 4.1.3) was utilized. The Kolmogorov–Smirnov test was performed to determine the normality of the distribution. For properly distributed data, the unpaired student’s t-test (two-tailed) was performed. For non-parametric statistical testing, the Mann–Whitney U test was utilized. For non-normally distributed paired comparisons of clustered data, the Wilcoxon signed-ranks test was utilized. For categorical data analysis, the chi-square test was performed. The study employs Spearman’s rank correlation coefficient for the analysis of correlations. The diagnostic capabilities were determined using receiver operating characteristics (ROC) curve analysis and the computation of the area under the ROC curve (AUC). p < 0.05 was regarded as statistically significant.
3 Results
3.1 Demographics of the participants
The demographics of these participants are shown in Table 1. Our study included 161 patients affected by glaucoma and 115 healthy controls who were age and gender matched. The glaucoma group showed a mean age of 54.73 years while the control group showed a mean age of 51.99 years (p = 0.07). In the glaucoma group, there were 75 men (46.58%) and 62 (53.91%) in the control group (p = 0.8213). we categorized patients with glaucoma into 3 (early, n = 40; moderate, n = 26; severe, n = 89) and 4 subgroups (early, n = 55; moderate, n = 33; severe, n = 9; end-stage: n = 57) each based on their severity of damage using the HPA classification system and the AGIS system.
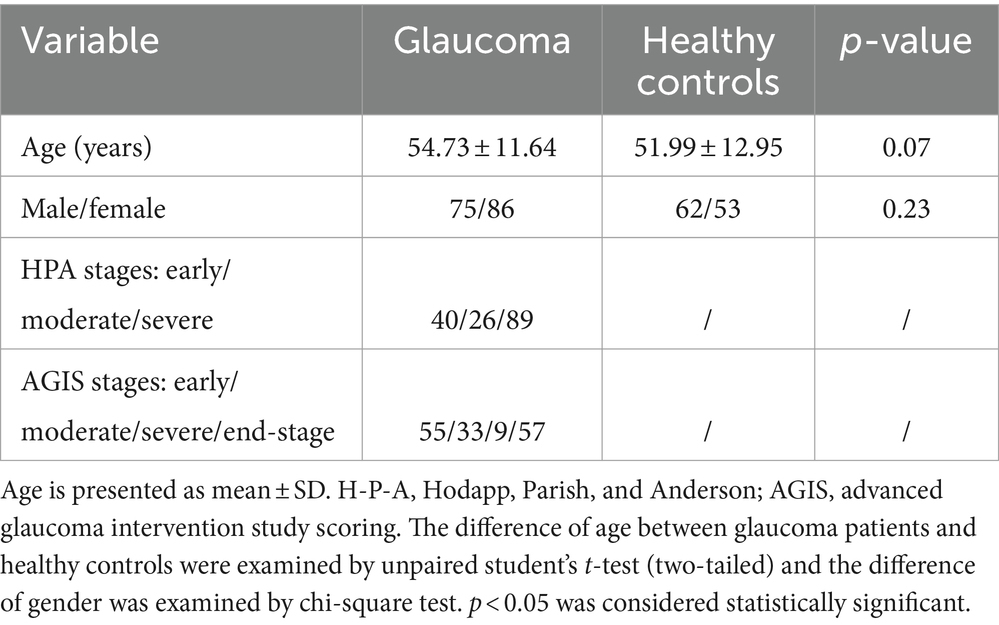
Table 1. Demographics of glaucoma patients and healthy controls.
3.2 Increased plasma Lf level in glaucoma patients
This study aimed to examine the variations in plasma Lf levels in glaucoma. We compared the prevalence of Lf between glaucoma patients and a cohort of healthy controls. The findings revealed a statistically significant elevation in plasma Lf levels among patients with glaucoma in contrast to the healthy control group (Figure 1A). Among the various glaucoma types, primary open-angle glaucoma (POAG) and primary angle-closure glaucoma (PACG) are the most common. In our study, we compared plasma Lf levels in PACG and POAG groups with those in healthy controls. The median plasma Lf levels were significantly higher in both PACG, and POAG groups compared to the control group. However, there was no significant difference in plasma Lf levels between the POAG and PACG groups (Figure 1B).
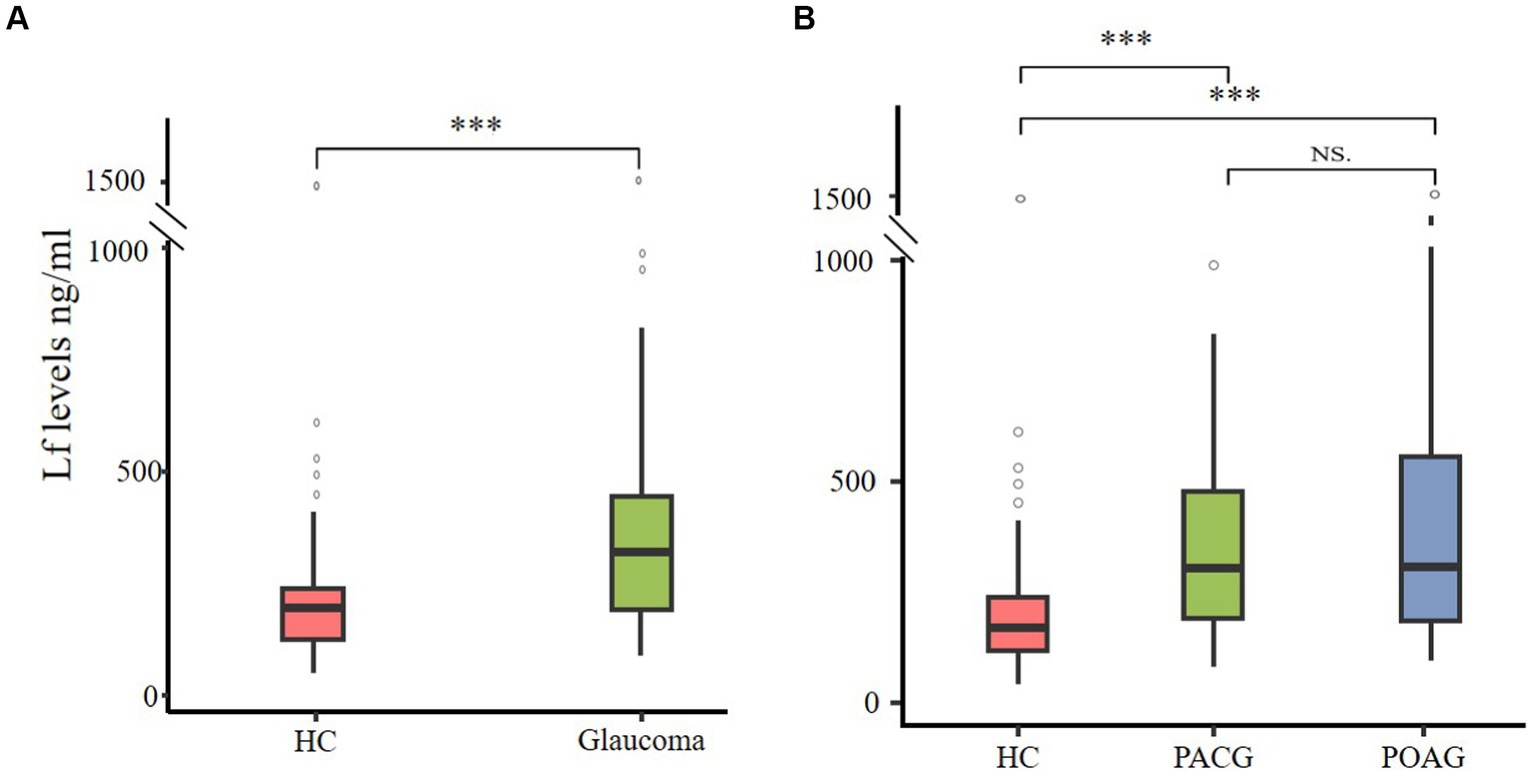
Figure 1. Plasma Lf levels in glaucoma patients. (A) Elevated plasma Lf in glaucoma patients. (B) Comparing plasma Lf levels among healthy controls (HC), primary angle-closure glaucoma (PACG) and primary open-angle glaucoma (POAG) subgroups. Group differences were evaluated using the Mann–Whitney U test for between-group comparisons, and the Kruskal–Wallis test was utilized to determine variations among primary angle-closure glaucoma (PACG), primary open-angle glaucoma (POAG), and healthy controls. NS (not significant) indicates no statistical significance; ∗∗∗p < 0.001.
3.3 The association between plasma Lf level and glaucoma neural damage and glaucoma severity
Then we utilized two disease staging systems to compare the plasma Lf level among patients with different disease severity in glaucoma. Based on the H-P-A classification system and the AGIS system, patients were categorized into three (early, moderate, and severe) and four (early, moderate, severe, and end-stage) subgroups. The severity of glaucoma was associated with an increased level of Lf in both classification systems, which suggests its potential use in discriminating advanced stage from early stage. Notably, patients with different disease severity levels differed in the amount of LF compared to healthy controls according to the H-P-A classification system (Figure 2A) and the AGIS method (Figure 2B), At the same time, we grouped patients based on their RNFL thickness and VCDR to examine the correlation between plasma Lf levels and optic nerve damage (11, 12). According to the findings, RNFL thinning (Figure 2C) and VCDR increasing (Figure 2D) were associated with an increase in LF levels. Lf levels were unaffected by the IOP (Supplementary Figure S1A), age (Supplementary Figure S1B), or gender (Supplementary Figure S1C).
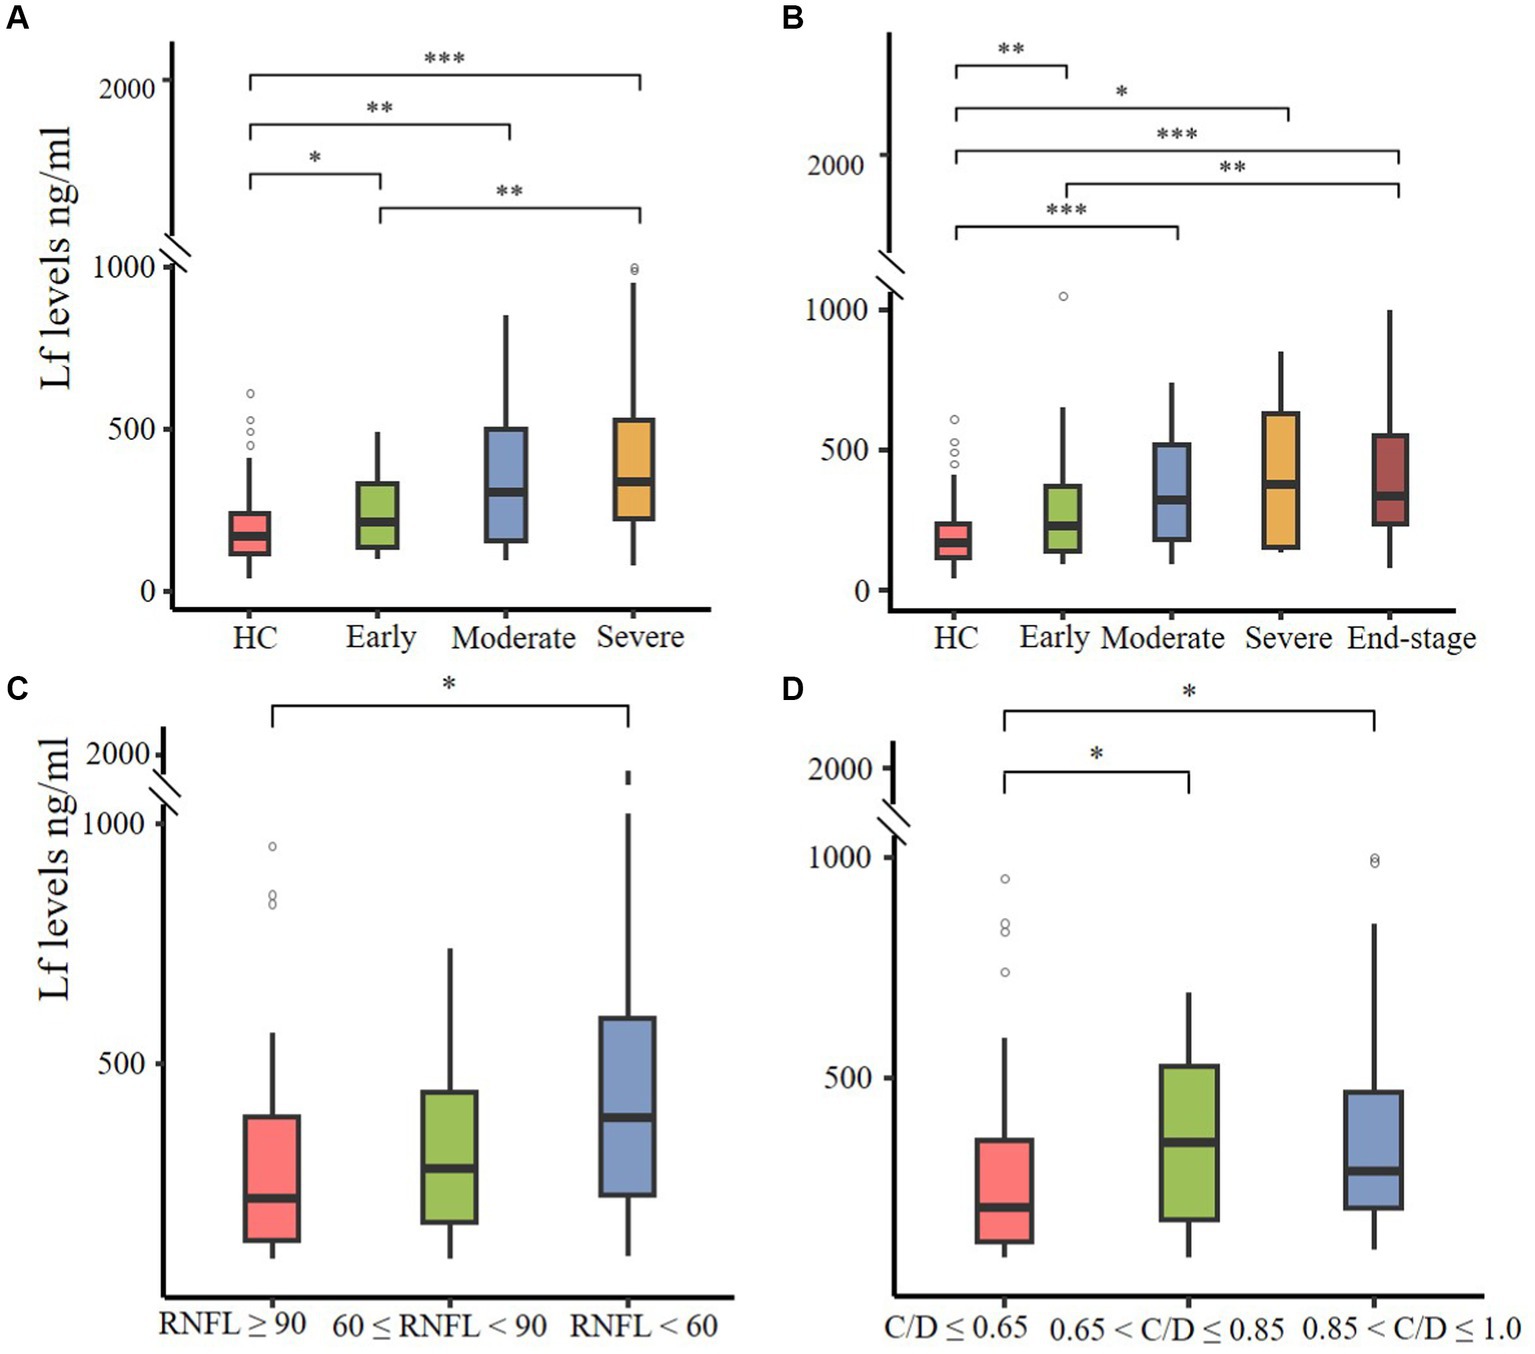
Figure 2. The correlation between plasma Lf levels, glaucoma severity, and optic nerve damage. (A,B) Plasma Lf levels in various glaucoma patient groups, stratified by disease severity using the Hodapp–Parrish–Anderson (H-P-A) classification system (A) and the advanced glaucoma intervention study (AGIS) system (B). (C,D) Plasma Lf levels were evaluated in groups stratified by retinal nerve fiber layer (RNFL) thickness (C) and vertical cup-to-disc ratio (C/D) (D). The differences in all parameters were assessed using the unpaired Wilcoxon rank-sum test. Significance levels are indicated as *p < 0.05, **p < 0.01 and, ***p < 0.001.
To further elucidate the relationship between plasma lactoferrin (Lf) levels and glaucoma severity, we conducted Spearman correlation analyses using various indicators: HPA, AGIS scores, RNFL thickness, and VCDR. The results indicated significant correlations: HPA grades showed ρ = 0.435, p < 0.001; AGIS grades showed ρ = 0.436, p < 0.001; RNFL thickness showed ρ = −0.204, p = 0.024; and VCDR showed ρ = 0.127, p = 0.145 (no statistical significance). These findings suggest a positive association between higher plasma Lf levels and increased severity of glaucoma, as well as greater neural damage.
To evaluate the association between plasma Lf levels and the dynamic progression of glaucoma, we assembled a cohort of 14 subjects prior to their undergoing ocular hypotensive surgery. Over a follow-up period of approximately two years, we analyzed ophthalmological examination data, using a decline in retinal nerve fiber layer (RNFL) thickness of −2 μm/year as an indicator of glaucoma progression (13). We established a cutoff at 477 ng/mL for plasma Lf levels to correlate with changes in RNFL thickness. Our findings revealed that 6 out of 14 patients exhibited abnormally high baseline plasma Lf levels (>477 ng/mL), while the remaining 8 patients had normal or elevated baseline plasma Lf levels (<477 ng/mL). During the study, 5 of the 6 subjects with high baseline plasma Lf levels demonstrated a reduction in RNFL thickness. In contrast, only 1 of the 8 subjects with normal or elevated baseline plasma Lf levels showed a decrease in RNFL thickness (p = 0.026, Fisher’s exact test).
3.4 Analysis of receiver operating characteristic curves
ROC curves were generated, and the area under the curve (AUC) was measured to evaluate Lf ability to distinguish healthy controls from glaucoma patients (AUC = 0.738, Sensitivity = 68.9%, Specificity = 71.3%). We then assessed disease severity degrees. The AUC of Lf in the H-P-A classification system was 0.630, 0.703, and 0.787 for identifying healthy controls from patients with early, moderate, and severe glaucoma, respectively (Table 2). In the advanced glaucoma intervention study (AGIS) system, the AUC for Lf was 0.651, 0.738, 0.727, and 0.808 for differentiating healthy controls from patients with early, moderate, severe, and end-stage glaucoma, respectively (Table 2). The results showed an increase in LF’s discriminative ability with escalating glaucoma severity. Further analysis revealed Lf’s efficacy in differentiating between early and advanced stages of glaucoma. As indicated in Table 2, Lf demonstrated satisfactory precision (early vs. severe: AUC = 0.665, Youden index = 0.318; early vs. end-stage: AUC = 0.670, Youden index = 0.299, according to the H-P-A and AGIS systems, respectively) in distinguishing between early and advanced glaucoma, suggesting its utility in identifying disease severity.
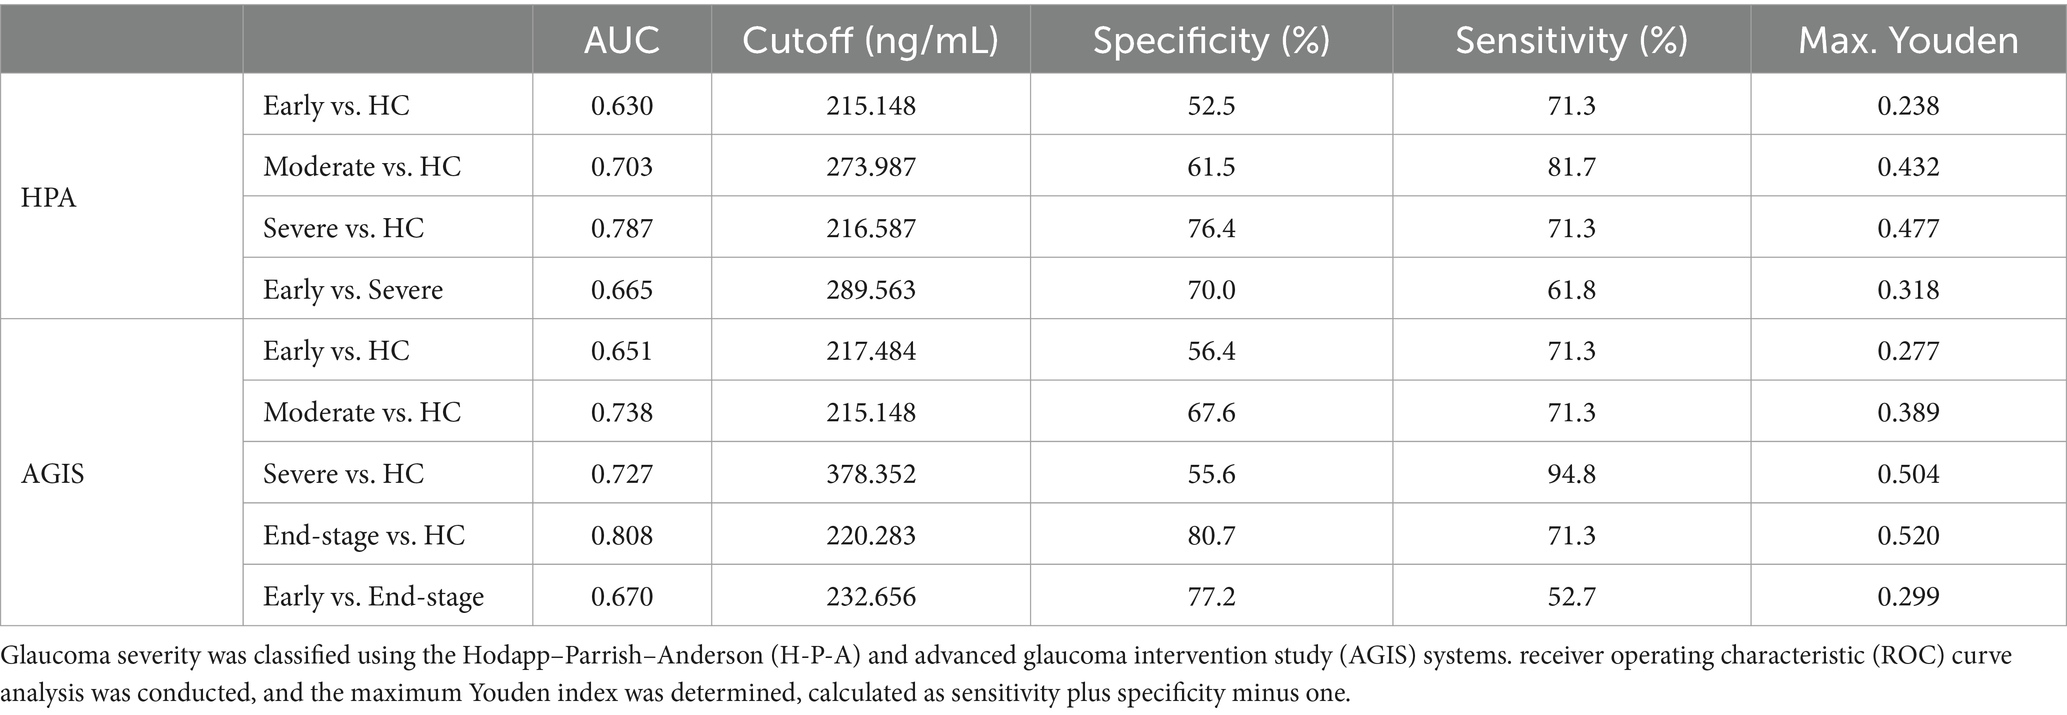
Table 2. Independent diagnostic value of plasma Lf in different stages of glaucoma.
4 Discussion
Iron metabolism is a complex and intricately co-regulated process, mediated by a network of essential proteins including transferrin, ferritin, and iron responsive element-binding proteins (14). Within this network, lactoferrin, a member of the transferrin family, has been identified as a crucial regulator in iron metabolism and homeostasis, demonstrating a capacity to mitigate iron-related disorders across various pathologies (7, 8). Recent studies have highlighted the role of disrupted iron homeostasis in the pathogenesis of glaucoma (3, 15, 16). In vitro studies have demonstrated that LF can traverse the blood–brain barrier (BBB) as an intact protein via LfR-mediated transcytosis (17). The retina is regarded as an extension of the central nervous system (CNS). Its neurodegenerative processes and immune responses exhibit significant parallels to those observed in Parkinson’s disease (PD) and Alzheimer’s disease (AD). In PD, immunohistochemical analysis of post-mortem brain tissues has demonstrated elevated Lf expression in PD patients compared to control subjects (18). In AD, there is a notable upregulation of Lf in the cerebral tissues, implicating its function as an iron scavenger. This upregulation likely signifies a defensive response in AD-afflicted brain tissue (19). Correspondingly, our research reveals heightened plasma Lf levels in individuals with glaucoma, which may indicate Lf’s involvement in mitigating iron-associated pathologies via iron chelation in this condition.
Lf is pivotal not only in regulating iron metabolism but also in exerting antioxidant effects. Notably, elevated serum ferritin levels, indicative of higher iron stores, were significantly observed in patients with primary open-angle glaucoma (POAG) compared to healthy controls, alongside a markedly reduced total iron binding capacity (5). Additionally, another study underscores the association between increased serum ferritin levels and an elevated risk of glaucoma in the South Korean population (6). Ferritin served as a surrogate indicator of the body’s iron stores. Therefore, the elevated ferritin suggests iron overload in glaucoma. Iron overload exacerbates retinal pathologies through mechanisms such as oxidative stress, inflammation, and cellular apoptosis. Excess tissue iron, a potent facilitator of free radical generation, markedly heightens the risk of degenerative diseases like Parkinson’s, Alzheimer’s, and glaucoma (17). Recent research has increasingly acknowledged the significant role of oxidative stress in the pathogenesis of glaucoma (20). Oxidative stress, associated with factors such as elevated intraocular pressure and aging, is implicated in the progression of glaucoma, offering insights into the mechanisms underlying these risk factors. The antioxidant properties of Lf are predominantly attributed to its iron-binding capacity, which reduces the generation of reactive oxygen species (ROS) (8). Additionally, Lf acts as a ROS scavenger, thereby protecting DNA from oxidative damage. Consequently, Lf may play a role as an antioxidant in the pathogenesis of glaucoma.
Recent evidence highlights systemic inflammation’s potential role in glaucoma pathogenesis. Complete blood count (CBC) indicators such as neutrophil count, neutrophil-to-lymphocyte ratio (NLR), platelet-to-lymphocyte ratio (PLR), lymphocyte-to-monocyte ratio (LMR), and systemic immune-inflammation index (SII) may serve as inflammatory biomarkers in various diseases. Notably, NLR, PLR, and SII values were significantly higher in the POAG group compared to controls, with NLR and SII escalating with disease severity (21). PLR was notably higher in the progression group than in the non-progression group, demonstrating a significant correlation between elevated PLR and heightened risk of VF loss progression in glaucoma patients (22). In our previous study, parameters including neutrophil-to-albumin ratio (NAR), neutrophil-to-total bilirubin ratio (NTBR), and neutrophil-to-indirect bilirubin ratio (NIBR) were significantly higher in glaucoma patients compared to healthy controls, showing a positive correlation with clinical visual impairment (23). Additionally, local inflammatory processes in the retinal tissue have been identified, extending beyond systemic inflammation. Research using the chronic ocular hypertension glaucoma model and DBA/2J mice model demonstrated significant elevations of pro-inflammatory cytokines IL-6 and IL-1β in the retina (24). Emerging evidence indicates that elevated plasma or serum Lf levels are linked to the development of inflammatory diseases, exhibiting anti-inflammatory and immunomodulatory effects. Lf significantly reduces pro-inflammatory cytokines IL-6, IL-8, and IL-1β (25). In pediatric inflammatory bowel disease (IBD) patients, characterized by recurrent, persistent intestinal inflammation, Lf levels were significantly higher than in healthy controls (26). Similar elevations in Lf were observed in serum or plasma of patients with rheumatoid arthritis (RA) (27). Consequently, Lf’s anti-inflammatory properties might also play a role in glaucoma progression.
Advanced glaucoma is a major risk factor for blindness. Diagnosis and monitoring traditionally depend on structural and functional assessments, including IOP, OCT, and standard automatic perimetry. However, these methods can be impractical for some patients due to their time-consuming and costly nature, coupled with the coordination required during examinations, particularly challenging for elderly patients. Fortunately, Recent studies have established a notable link between peripheral blood biomarkers and the severity and progression of visual field (VF) loss in glaucoma patients (21, 22). Given the observed differences in Lf levels between glaucoma patients and healthy controls, alongside its simplicity, cost-effectiveness, and accessibility as a peripheral blood biomarker, we further explored Lf levels in patients with varying stages of glaucoma and in healthy individuals. This highlights Lf’s potential as a novel tool for glaucoma detection, screening, and severity assessment. Notably, Lf exhibited high diagnostic accuracy in distinguishing between early and advanced stages of glaucoma, as well as between healthy individuals and patients with severe glaucoma. Additionally, other studies across various diseases have linked plasma Lf levels with disease activity and severity; for instance, in severe sepsis in children, high plasma Lf concentrations were associated with the onset of organ failure. Furthermore, Lf has been reported to correlate with the severity of PD (28). Therefore, Plasma Lf levels are indicative of glaucoma severity and may be implicated in the disease’s pathogenic progression.
Our study has several limitations. First, while Lf shows promise in differentiating glaucoma patients from healthy controls, future research with larger sample sizes is needed to enhance its diagnostic accuracy. Second, our study’s design, combining cross-sectional case–control with follow-up, did not explore the potential mechanisms linking Lf and glaucoma, which will be a primary focus in subsequent research. Third, the follow-up phase included a limited number of glaucoma patients, indicating a need for more comprehensive, long-term longitudinal studies. Finally, as this study was conducted at a single center, further multicenter research across diverse ethnic groups is essential to validate our findings.
In conclusion, this study is the initial evaluation of plasma lactoferrin in glaucoma, revealing its potential clinical value in reflecting the disease’s severity.
Data availability statement
The original contributions presented in the study are included in the article/Supplementary material, further inquiries can be directed to the corresponding authors.
Ethics statement
The studies involving humans were approved by the Sichuan Provincial People’s Hospital. The studies were conducted in accordance with the local legislation and institutional requirements. The human samples used in this study were acquired from gifted from another research group. Written informed consent for participation was not required from the participants or the participants’ legal guardians/next of kin in accordance with the national legislation and institutional requirements.
Author contributions
ZW: Conceptualization, Data curation, Formal analysis, Funding acquisition, Investigation, Methodology, Project administration, Resources, Software, Supervision, Validation, Visualization, Writing – original draft, Writing – review & editing. DL: Conceptualization, Data curation, Formal analysis, Investigation, Methodology, Project administration, Resources, Software, Supervision, Validation, Visualization, Writing – original draft, Writing – review & editing. HY: Data curation, Formal analysis, Investigation, Methodology, Validation, Visualization, Writing – review & editing. AL: Data curation, Formal analysis, Investigation, Methodology, Supervision, Validation, Visualization, Writing – review & editing. JW: Data curation, Formal analysis, Investigation, Methodology, Supervision, Validation, Writing – review & editing. XZ: Data curation, Formal analysis, Investigation, Methodology, Writing – review & editing. WX: Data curation, Investigation, Methodology, Supervision, Validation, Writing – review & editing. GZ: Data curation, Investigation, Methodology, Supervision, Validation, Writing – review & editing. YC: Data curation, Investigation, Methodology, Supervision, Writing – review & editing. LC: Data curation, Investigation, Methodology, Supervision, Writing – review & editing. XX: Data curation, Investigation, Methodology, Supervision, Writing – review & editing. CH: Conceptualization, Data curation, Formal analysis, Funding acquisition, Investigation, Methodology, Project administration, Resources, Software, Supervision, Validation, Visualization, Writing – original draft, Writing – review & editing. FL: Conceptualization, Data curation, Formal analysis, Funding acquisition, Investigation, Methodology, Project administration, Resources, Software, Supervision, Validation, Visualization, Writing – original draft, Writing – review & editing.
Funding
The author(s) declare that financial support was received for the research, authorship, and/or publication of this article. This work is financially supported by grants from the National Natural Science Foundation of China (U19A2004, 81970803, and 82370560) and Open Project of Sichuan Provincial Key Laboratory for Clinical Immunology Translational Medicine (LCMYZHYX-KFKT202204).
Conflict of interest
The authors declare that the research was conducted in the absence of any commercial or financial relationships that could be construed as a potential conflict of interest.
Publisher’s note
All claims expressed in this article are solely those of the authors and do not necessarily represent those of their affiliated organizations, or those of the publisher, the editors and the reviewers. Any product that may be evaluated in this article, or claim that may be made by its manufacturer, is not guaranteed or endorsed by the publisher.
Supplementary material
The Supplementary material for this article can be found online at: https://www.frontiersin.org/articles/10.3389/fmed.2024.1385358/full#supplementary-material
SUPPLEMENTARY FIGURE S1 | Correlation of plasma Lf and glaucoma. (A) Comparisons of plasma Lf levels were conducted between male and female patients. Correlation analysis of plasma Lf with (B) intraocular pressure (IOP) and (C) age in glaucoma patient and spearman correlation r values were displayed. Statistical comparisons were performed using (A) Mann–Whitney test; (B,C) Spearman correlation.
References
1. Artero-Castro, A, Rodriguez-Jimenez, FJ, Jendelova, P, VanderWall, KB, Meyer, JS, and Erceg, S. Glaucoma as a neurodegenerative disease caused by intrinsic vulnerability factors. Prog Neurobiol. (2020) 193:101817. doi: 10.1016/j.pneurobio.2020.101817
2. Jayaram, H, Kolko, M, Friedman, DS, and Gazzard, G. Glaucoma: now and beyond. Lancet. (2023) 402:1788–801. doi: 10.1016/S0140-6736(23)01289-8
3. Yao, F, Peng, J, Zhang, E, Ji, D, Gao, Z, Tang, Y, et al. Pathologically high intraocular pressure disturbs normal iron homeostasis and leads to retinal ganglion cell ferroptosis in glaucoma. Cell Death Differ. (2023) 30:69–81. doi: 10.1038/s41418-022-01046-4
4. Wang, SY, Singh, K, and Lin, SC. The association between glaucoma prevalence and supplementation with the oxidants calcium and iron. Investig Ophthalmol Vis Sci. (2012) 53:725–31. doi: 10.1167/iovs.11-9038
5. Seyyar, SA, Tokuc, EO, and Güngör, K. Evaluation of serum iron status indicators in patients with primary open angle glaucoma. Eur J Ophthalmol. (2023) 34:175–80. doi: 10.1177/11206721231187427
6. Lin, SC, Wang, SY, Yoo, C, Singh, K, and Lin, SC. Association between serum ferritin and glaucoma in the South Korean population. JAMA Ophthalmol. (2014) 132:1414–20. doi: 10.1001/jamaophthalmol.2014.2876
7. Hao, L, Shan, Q, Wei, J, Ma, F, and Sun, P. Lactoferrin: major physiological functions and applications. Curr Protein Pept Sci. (2018) 20:139–44. doi: 10.2174/1389203719666180514150921
8. Ianiro, G, Rosa, L, Bonaccorsi di Patti, MC, Valenti, P, Musci, G, and Cutone, A. Lactoferrin: from the structure to the functional orchestration of iron homeostasis. Biometals. (2023) 36:391–416. doi: 10.1007/s10534-022-00453-x
9. Csosz, É, Boross, P, Csutak, A, Berta, A, Tóth, F, Póliska, S, et al. Quantitative analysis of proteins in the tear fluid of patients with diabetic retinopathy. J Proteome. (2012) 75:2196–204. doi: 10.1016/j.jprot.2012.01.019
10. He, C, Xiu, W, Chen, Q, Peng, K, Zhu, X, Wang, Z, et al. Gut-licensed β7+ CD4+ T cells contribute to progressive retinal ganglion cell damage in glaucoma. Sci Transl Med. (2023) 15:eadg1656–14. doi: 10.1126/scitranslmed.adg1656
11. Anton, A, Moreno-Montañes, J, Blázquez, F, Álvarez, A, Martín, B, and Molina, B. Usefulness of optical coherence tomography parameters of the optic disc and the retinal nerve fiber layer to differentiate glaucomatous, ocular hypertensive, and normal eyes. J Glaucoma. (2007) 16:1–8. doi: 10.1097/01.ijg.0000212215.12180.19
12. Keltner, JL, Johnson, CA, Anderson, DR, Levine, RA, Fan, J, Cello, KE, et al. The association between glaucomatous visual fields and optic nerve head features in the ocular hypertension treatment study. Ophthalmology. (2006) 113:1603–12. doi: 10.1016/j.ophtha.2006.05.061
13. Miki, A, Medeiros, FA, Weinreb, RN, Jain, S, He, F, Sharpsten, L, et al. Rates of retinal nerve fiber layer thinning in glaucoma suspect eyes. Ophthalmology. (2014) 121:1350–8. doi: 10.1016/j.ophtha.2014.01.017
14. Andrews, NC, and Schmidt, PJ. Iron homeostasis. Annu Rev Physiol. (2007) 69:69–85. doi: 10.1146/annurev.physiol.69.031905.164337
15. Cui, QN, Bargoud, AR, Ross, AG, Song, Y, and Dunaief, JL. Oral administration of the iron chelator deferiprone protects against loss of retinal ganglion cells in a mouse model of glaucoma. Exp Eye Res. (2021) 193:107961–10. doi: 10.1016/j.exer.2020.107961
16. Guo, M, Zhu, Y, Shi, Y, Meng, X, Dong, X, Zhang, H, et al. Inhibition of ferroptosis promotes retina ganglion cell survival in experimental optic neuropathies. Redox Biol. (2022) 58:102541. doi: 10.1016/j.redox.2022.102541
17. Ward, RJ, Zucca, FA, Duyn, JH, Crichton, RR, and Zecca, L. The role of iron in brain ageing and neurodegenerative disorders. Lancet Neurol. (2017) 13:1045–60. doi: 10.1016/S1474-4422(14)70117-6
18. Faucheux, BA, Nillesse, N, Damier, P, Spik, G, Mouatt-Prigent, A, Pierce, A, et al. Expression of lactoferrin receptors is increased in the mesencephalon of patients with Parkinson disease. Proc Natl Acad Sci USA. (1995) 92:9603–7. doi: 10.1073/pnas.92.21.9603
19. Kawamata, T, Tooyama, I, Yamada, T, Walker, DG, and McGeer, PL. Lactotransferrin immunocytochemistry in Alzheimer and normal human brain. Am J Pathol. (1993) 142:1574–85.
20. Fan Gaskin, JC, Shah, MH, and Chan, EC. Oxidative stress and the role of NADPH oxidase in glaucoma. Antioxidants. (2021) 10:1–17. doi: 10.3390/antiox10020238
21. Tang, B, Li, S, Han, J, Cao, W, and Sun, X. Associations between blood cell profiles and primary open-angle glaucoma: a retrospective case-control study. Ophthalmic Res. (2020) 63:413–22. doi: 10.1159/000504450
22. Li, S, Qiu, Y, Yu, J, Shao, M, Li, Y, Cao, W, et al. Association of systemic inflammation indices with visual field loss progression in patients with primary angle-closure glaucoma: potential biomarkers for 3P medical approaches. EPMA J. (2021) 12:659–75. doi: 10.1007/s13167-021-00260-3
23. He, C, Zhang, G, Fu, J, Zhang, R, Li, A, Liu, D, et al. Clinical significance of albumin- and bilirubin-based biomarkers in glaucoma: a retrospective case-control study. Oxidative Med Cell Longev. (2022) 2022:1–9. doi: 10.1155/2022/8063651
24. Wilson, GN, Inman, DM, Denger-Crish, CM, Smith, MA, and Crish, SD. Early pro-inflammatory cytokine elevations in the DBA/2J mouse model of glaucoma. J Neuroinflammation. (2015) 12:176–13. doi: 10.1186/s12974-015-0399-0
25. Legrand, D. Overview of lactoferrin as a natural immune modulator. J Pediatr. (2016) 173:S10–5. doi: 10.1016/j.jpeds.2016.02.071
26. Titus, ASCLS, Vanarsa, K, Soomro, S, Patel, A, Prince, J, Kugathasan, S, et al. Resistin, elastase, and lactoferrin as potential plasma biomarkers of pediatric inflammatory bowel disease based on comprehensive proteomic screens. Mol Cell Proteomics. (2023) 22:100487. doi: 10.1016/j.mcpro.2022.100487
27. Miyauchi, S, Umekita, K, Hidaka, T, Umeki, K, Aratake, Y, Takahashi, N, et al. Increased plasma lactoferrin levels in leucocytapheresis therapy in patients with rheumatoid arthritis. Rheumatology. (2014) 53:1966–72. doi: 10.1093/rheumatology/keu219
Keywords: plasma lactoferrin, glaucoma, iron dysregulation, disease severity, pathogenic progression
Citation: Wang Z, Liu D, Yuan H, Li A, Wang J, Zhu X, Xiu W, Zhang G, Chen Y, Chen L, Xiao X, He C and Lu F (2024) Association of plasma lactoferrin levels with disease severity in glaucoma patients. Front. Med. 11:1385358. doi: 10.3389/fmed.2024.1385358
Edited by:
Ana Raquel Santiago, University of Coimbra, PortugalReviewed by:
Caterina Gagliano, University of Catania, ItalyUshasree Pattamatta, The University of Sydney, Australia
Copyright © 2024 Wang, Liu, Yuan, Li, Wang, Zhu, Xiu, Zhang, Chen, Chen, Xiao, He and Lu. This is an open-access article distributed under the terms of the Creative Commons Attribution License (CC BY). The use, distribution or reproduction in other forums is permitted, provided the original author(s) and the copyright owner(s) are credited and that the original publication in this journal is cited, in accordance with accepted academic practice. No use, distribution or reproduction is permitted which does not comply with these terms.
*Correspondence: Chong He, herrickhoo@163.com; Fang Lu, lufangfang@126.com
†These authors have contributed equally to this work