 Chen-Yu Wan1†
 Yu-Xuan Liu1†
 Su-Gang Gong2
 Qin-Hua Zhao2
 Ci-Jun Luo2
 Hong-Lin Qiu2
 Wen-Hui Wu2
 Yun-Bo Wei3
 Lei Du3Ming-Feng Gu3
 Lan Wang2*
 Rong Jiang4*
 Ze-Pu Li3*
- 1Tongji University School of Medicine, Shanghai, China
- 2Department of Cardio-Pulmonary Circulation, Shanghai Pulmonary Hospital, Tongji University School of Medicine, Shanghai, China
- 3Department of Cardiology, Affiliated Renhe Hospital of Shanghai University (Renhe Hospital, Baoshan District), Shanghai, China
- 4Department of Cardiology, Shanghai General Hospital, Shanghai Jiao Tong University School of Medicine, Shanghai, China
Background: Combined post-capillary pulmonary hypertension (Cpc-PH) is a severe form of pulmonary hypertension associated with high morbidity and mortality. Early identification and intervention are crucial but challenging due to the invasive right heart catheterization (RHC). This study aimed to develop and validate a non-invasive diagnostic model, the Predictive Echocardiography Cpc-PH Score (PECS), using echocardiographic parameters to facilitate detection of Cpc-PH.
Methods: A retrospective analysis encompassing 198 patients with suspected PH-LHD, admitted from July 2010 through December 2023, was executed. Patients were divided into Cpc-PH and Ipc-PH/No-PH groups based on RHC in accordance with the 7th World Symposium on Pulmonary Hypertension criteria for PECS model construction. Chi-square and L1-regularized backward elimination refined predictive indicators. Model efficacy and stability were appraised via receiver operating characteristic and 5-fold cross-validation.
Results: The PECS model, incorporating a suite of indicators including valvular heart disease, left atrial systolic diameter, interventricular septal thickness, mitral valve E/Em ratio, left ventricular fractional shortening, and tricuspid regurgitation velocity, demonstrated good predictive performance, achieving an area under characteristic (AUC) of 0.761 (95% CI: 0.692–0.823, P < 0.001). It demonstrated a sensitivity of 66.7%, specificity of 72.0%, a positive predictive value of 72.9%, a negative predictive value of 65.7%, and an overall accuracy of 69.2%. A total of 5-fold cross-validation confirmed these findings, yielding an AUC of 0.752 ± 0.070.
Conclusion: The PECS model provides a non-invasive and precise approach to diagnosing Cpc-PH, potentially acting as a practical screening tool.
Introduction
Post-capillary pulmonary hypertension (pcPH) represents a significant clinical challenge, particularly in combined post-capillary PH (Cpc-PH), which is associated with a poorer prognosis. Prompt identification and intervention are crucial for effective management (1, 2). The distinction between isolated post-capillary PH (Ipc-PH) and Cpc-PH has been emphasized in the evolving guidelines set forth by the European Society of Cardiology (ESC) and the European Respiratory Society (ERS) (3, 4). According to the 2015 ESC/ERS guidelines, Cpc-PH is defined by specific hemodynamic criteria, including a mean pulmonary arterial pressure (mPAP) exceeding 25 mmHg, a pulmonary arterial wedge pressure (PAWP) greater than 15 mmHg, a diastolic pressure gradient (DPG) over 7 mmHg, or a pulmonary vascular resistance (PVR) exceeding three Wood units (WU) (1, 5–7). Recent updates in the 2022 guidelines and the 7th World Symposium on Pulmonary Hypertension (WSPH) have further refined these diagnostic thresholds, notably lowering the mPAP and PVR criterion to greater than 20 mmHg and 2 WU, respectively (1).
Given the invasive nature of right heart catheterization (RHC) (8), traditionally employed to confirm the diagnosis of Cpc-PH, there is a pressing need for non-invasive diagnostic alternatives. Heart failure (HF) patients, especially those with PH, often present with advanced age, frailty, and multiple comorbidities (9).
Echocardiography, a non-invasive diagnostic tool, has demonstrated great potential in screening and predicting PH due to its convenience, and cost-effectiveness (10). However, studies utilizing a PVR cutoff of 3 WU have shown limitations in the accuracy of echocardiography when predicting Cpc-PH (11). Furthermore, the ability of echocardiography to predict Cpc-PH in HF patients under the 7th WSPH criterion has not been fully investigated.
This study aims to address these critical gaps by establishing the Predictive Echocardiography Cpc-PH Score (PECS), providing clinicians with an improved non-invasive framework for therapeutic decision-making.
Materials and methods
Study population
This study retrospectively enrolled patients suspected of having pcPH at Shanghai Pulmonary Hospital between July 2010 and December 2023. All patients received a thorough evaluation by experienced clinicians and underwent RHC and echocardiography. Both examinations were completed during the same hospitalization, with an interval of no more than 7 days between transthoracic echocardiography and RHC, and no hemodynamically relevant therapies were initiated or modified in this period. The classification of Cpc-PH was based on the 7th WSPH criterion. This criterion includes an mPAP > 20 mmHg and a PAWP > 15 mmHg. In this framework, a PVR greater than 2 WU classifies the condition as Cpc-PH, while a PVR less than or equal to 2 WU designates it as Ipc-PH (1). To compare the 2015 ESC/ERS and 7th WSPH criteria, patients with Cpc-PH who met the 2015 ESC/ERS criteria (mPAP > 25 mmHg, PAWP > 15 mmHg, and PVR > 3 WU) were also identified (12). Other forms of PH (Group 1, Group 3, Group 4, and Group 5 PH) were excluded from the study. All participants provided written informed consent, and the study was approved by the Ethics Committee of Shanghai Pulmonary Hospital (K16-317).
Hemodynamic assessment
Right heart catheterization, deemed the gold standard for diagnosing and classifying Group 2 PH (13), was employed to obtain key hemodynamic parameters, including mPAP, right atrial pressure (RAP), and PAWP. Cardiac output (CO) was measured using the indirect Fick method, while cardiac index (CI) was calculated by dividing CO by body surface area. PVR was derived by calculating the difference between mPAP and PAWP divided by CO. Hemodynamic data were interpreted by investigators blinded to the echocardiographic results.
Transthoracic echocardiography
The echocardiographic measurement methods used in this study were consistent with those in previous studies to assess cardiac structure and function (General Electric Company, United States, Vivid 7 Dimension system) (14).
To assess left heart remodeling, left atrial end-systolic diameter (LAD), left ventricular end-diastolic diameter (LVEDD), left ventricular end-systolic diameter (LVESD), interventricular septum (IVS) and left ventricular posterior wall thickness (LVPWT). Left heart systolic function was assessed by ventricular ejection fraction (LVEF), left ventricular fractional shortening (LVFS) and mitral valve systolic wave velocity (MV Sm) (9). Right ventricular remodeling was assessed through the right atrial transverse diameter (RATD), right atrial longitudinal diameter (RALD), right ventricular end-diastolic longitudinal dimension (RVEDLD), right ventricular end-diastolic transverse dimension (RVEDTD) and right ventricular free wall thickness (RVFWT) (15). Right ventricular systolic function was assessed as tricuspid annular plane systolic excursion (TAPSE), and right ventricular S’ wave TV-Sm (16). The RAP was evaluated semi-quantitatively by assessing the maximum inferior vena cava diameter and its collapsibility (16). Systolic pulmonary artery pressure (PASP) was calculated by the sum of RAP and the systolic pressure gradient, obtained from peak tricuspid regurgitation velocity (TR Vmax) using the simplified Bernoulli’s equation (17). The TAPSE/PASP ratio serves as a valuable indicator of the coupling between the right ventricle (RV) and pulmonary artery (18). The end-diastolic eccentricity index of the left ventricle (ENDSEI) was measured as the compression of the RV on left ventricle. All echocardiographic image acquisitions and interpretations were performed by sonographers who were blinded to patients’ clinical data and to the results of RHC.
Statistical analysis
Categorical variables were summarized using counts and percentages [n (%)]. Continuous variables were assessed for normality using Shapiro-Wilk or Kolmogorov-Smirnov tests, after which they were categorized into normally distributed and skewed distributed variables. Normally distributed variables were described using mean ± standard deviation, while skewed variables were characterized using median (interquartile range).
Prior to model construction, continuous echocardiographic parameters were dichotomized using the Youden Index to minimize the potential impact of multicollinearity among variables (19). Chi-square tests were conducted on medical history data and dichotomized echocardiographic parameters, with a significance level set at P < 0.1, to retain as many candidate variables related to Cpc-PH diagnosis as possible (20).
During the construction of the multivariate logistic regression model, L2 regularization (with a regularization coefficient C = 1) was initially employed to screen out variables with regression coefficients close to zero (21). Subsequently, the stepwise backward method was utilized to further optimize the model by eliminating the variable with the highest P-value that was not statistically significant until all variables in the model had P-values < 0.1. The regression coefficients of the final model variables were retained to one decimal place to serve as weights for the PECS model. The model’s performance was evaluated using the receiver operating characteristic (ROC) curve and the area under the curve (AUC) with corresponding 95% confidence intervals (22). The optimal cutoff value was determined based on the maximum Youden Index, and sensitivity, specificity, positive predictive value (PPV), negative predictive value (NPV), and overall accuracy were calculated to comprehensively reflect the model’s diagnostic discrimination ability. We further evaluated the model’s performance with 5-fold cross-validation. The dataset was randomly divided into five equal parts; in each fold, four-fifths of the data were used for training and one-fifth for validation (23). The AUC, sensitivity, and specificity were calculated for each fold, and their average values were reported to assess model generalizability. Missing data were minimal and were imputed by linear interpolation (24). Finally, to facilitate clinical application, a nomogram based on the final model was constructed to allow easy estimation of an individual patient’s Cpc-PH risk.
All statistical analyses were conducted using IBM SPSS Statistics for Windows (Version 29.0.2.0, IBM Corp., Armonk, NY, United States) and Python version 3.9.
Results
Demographic characteristics of the derivation cohort
A total of 198 patients were enrolled in the derivation cohort (Figure 1). As this was a retrospective study, all 198 consecutive eligible patients were included, and the sample size was therefore not derived from a formal a priori power calculation. According to the 7th WSPH criteria, the cohort included 105 patients with Cpc-PH and 93 patients classified as Ipc-PH or No-PH patients. No significant differences were observed between the two groups with regard to demographic characteristics, diagnostic basis, or etiological distribution. No procedure-related adverse events were observed during either the echocardiographic examinations or the right-heart-catheterization procedures. However, Cpc-PH patients exhibited a higher prevalence of valvular heart disease (VHD) and mitral regurgitation, but a lower prevalence of bronchial asthma. Hemodynamic assessments revealed that Cpc-PH patients had higher RAP, mPAP, and PVR, whereas CO and CI were relatively lower (Table 1).

Figure 1. Flow diagram for the main derivation cohort. RHC, right heart catheterization; PECS, Predictive Echocardiography Cpc-PH Score; Ipc-PH, isolated post-capillary pulmonary hypertension; Cpc-PH, combined post-capillary pulmonary hypertension.
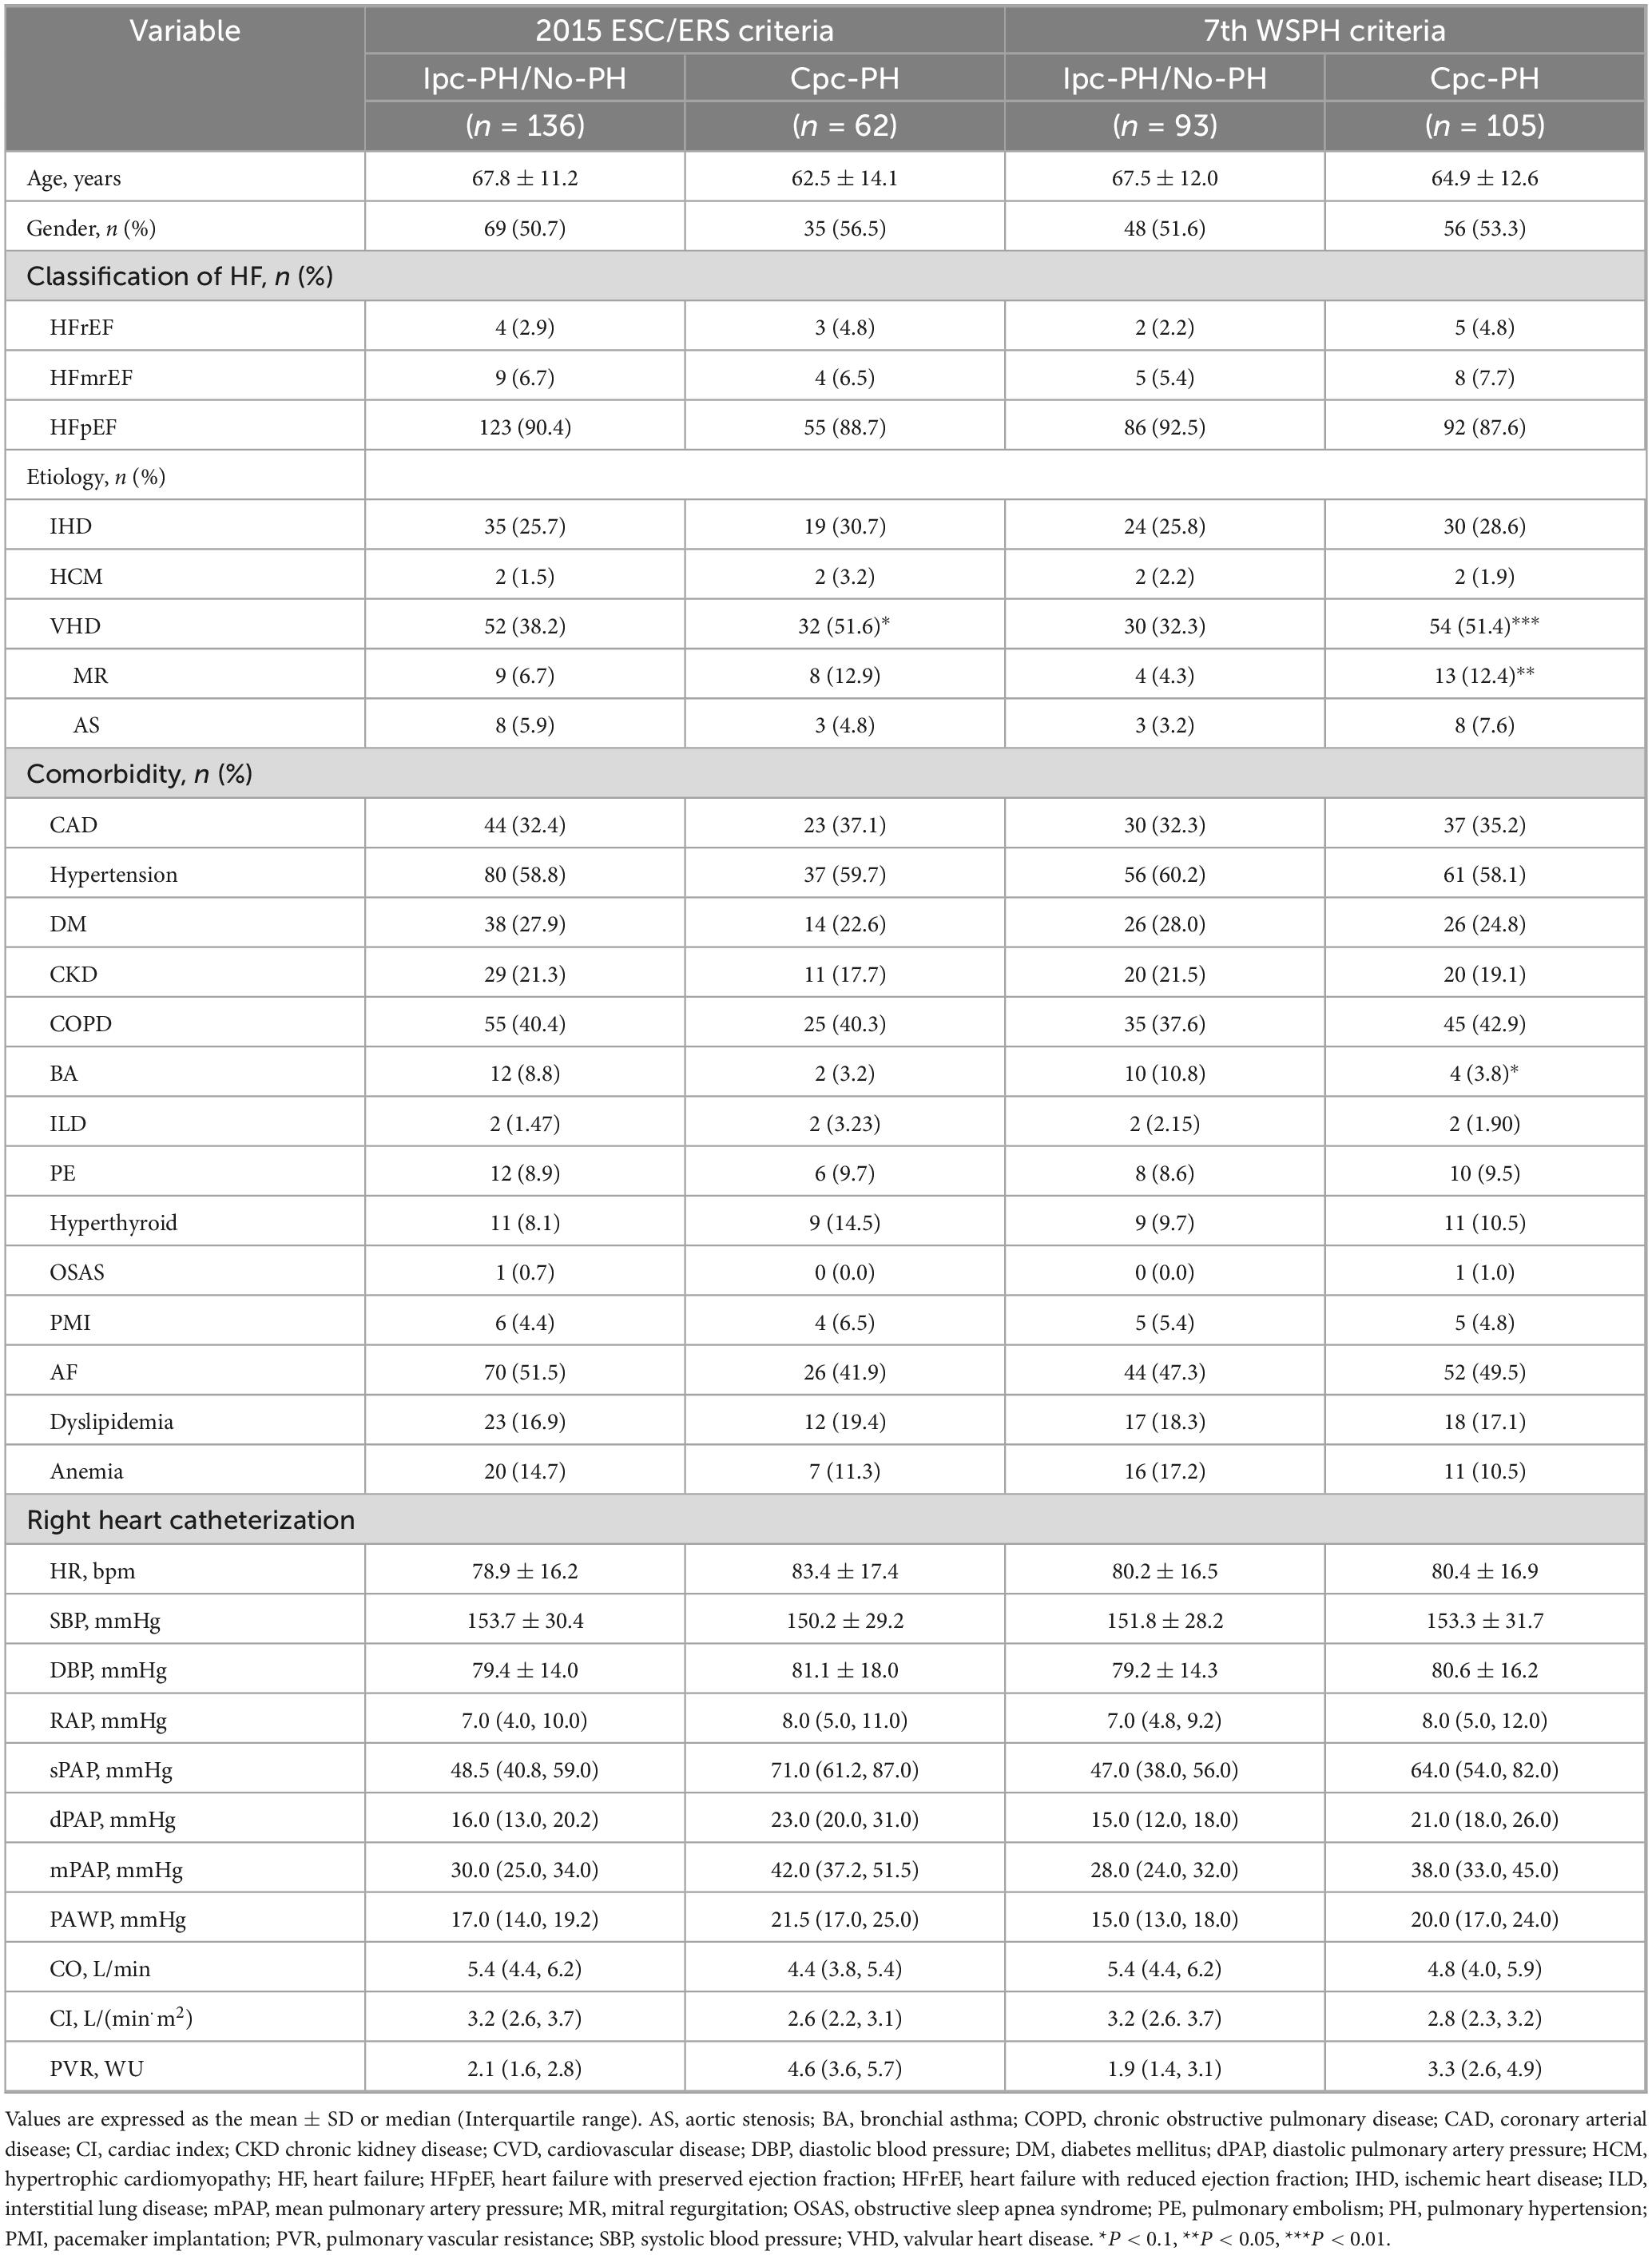
Table 1. Demographic characteristics and hemodynamic parameters of patients based on the 7th World Symposium on Pulmonary Hypertension (WSPH) criteria vs. 2015 European Society of Cardiology/European Respiratory Society (ESC/ERS) criteria.
In accordance with the 2015 ESC/ERS criteria, the cohort included 136 patients with Cpc-PH and 62 patients with Ipc-PH or No-PH patients. Demographic, diagnostic, and etiological comparisons between the two groups were consistent with those observed based on the 7th WSPH criteria, with no significant differences noted. However, Ipc-PH patients exhibited a higher prevalence of VHD. The hemodynamic differences were also aligned with those observed based on the 7th WSPH criteria (Table 1).
Characteristics of the derivation cohort
In accordance with the 7th WSPH criteria, patients diagnosed with Cpc-PH demonstrated significantly elevated measurements for LAD, RVEDTD, mitral valve E/Em ratio, LVFS, PASP, and TR Vmax. Notably, although the mean values for RALD, IVS and RVFWT were comparable between the two groups, minor discrepancies persisted (Table 2).

Table 2. Echocardiographic parameters of patients: a comparison between the 7th World Symposium on Pulmonary Hypertension (WSPH) criteria and the 2015 European Society of Cardiology/European Respiratory Society (ESC/ERS) criteria.
Per the 2015 ESC/ERS criteria, the differences in echocardiographic parameters between patients with Cpc-PH and Ipc-PH were less marked compared to those noted within the 7th WSPH criteria cohort. Specifically, Cpc-PH patients exhibited higher values for right RATD, RVEDTD, mitral valve E/Em ratio, PASP, and TR Vmax (Table 2).
Development of the PECS model
In accordance with the 7th WSPH criteria, within the cohort analysis of the 7th WSPH group, although bronchial asthma, RALD, and RVEDTD achieved statistical significance or marginal significance in univariate analysis (p-values of 0.068, 0.051, and 0.059, respectively), they failed to meet the L2 regularization and stepwise backward logistic regression screening and were therefore excluded. A total of six variables were identified as statistically significant in multivariate analysis: VHD (P = 0.012), LAD (P = 0.057), IVS (P = 0.026), mitral valve E/Em ratio (P = 0.026), LVFS (P = 0.015), and TR Vmax (P < 0.001). The PECS was derived from the regression coefficients of these variables in the final model, with the following weighted scores: PECS7th WSPH = 0.9 × PECSVHD + 1.2 × PECSLAD + 1.6 × PECSIVS + 0.8 × PECSMV E/Em + 1.2 × PECSLVFS + 1.4 × PECSTR Vmax (Table 3).

Table 3. Logistic regression analysis of echocardiographic parameters according to the 7th World Symposium on Pulmonary Hypertension (WSPH) criteria.
In the derivation cohort of the 2015 ESC/ERS criteria, multivariate logistic regression revealed four significant variables: VHD (P = 0.095), RVEDTD (P = 0.087), mitral valve E/Em ratio (P = 0.037), and TR Vmax (P < 0.001). The PECS2015ESC/ERS model formula was established based on their β-coefficient values: PECS2015ESC/ERS = 0.6 × PECSVHD + 0.6 × PECSRVEDTD + 0.7 × PECSMV E/Em + 1.3 × PECSTR Vmax (Table 4).
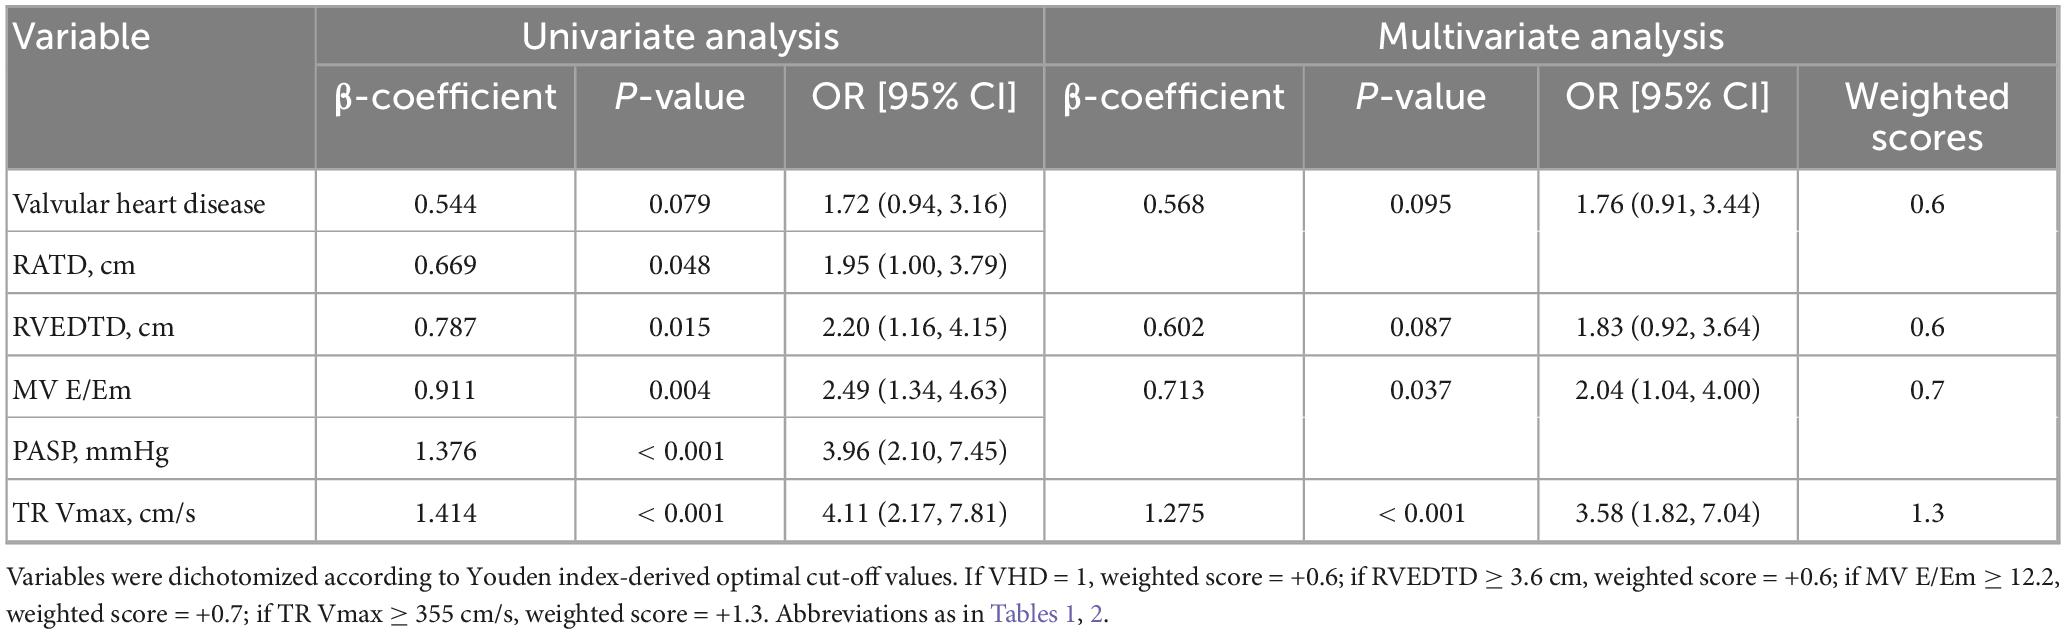
Table 4. Logistic regression analysis of echocardiographic Parameters based on the 2015 European Society of Cardiology/European Respiratory Society (ESC/ERS) criteria.
Evaluation of the PECS model
The PECS7th WSPH model was evaluated using ROC curve analysis. At a cutoff score of ≥ 2.2, the model exhibited diagnostic efficacy characterized by a sensitivity of 66.7%, specificity of 72.0%, PPV of 72.9%, NPV of 65.7%, accuracy of 69.2%, and an AUC of 0.761 (95% CI: 0.692–0.823, P < 0.001) (Supplementary Table 1).
The PECS2015ESC/ERS model was assessed using ROC curve analysis. With a cutoff score of ≥ 1.3, the model exhibited sensitivity of 64.50%, specificity of 72.8%, PPV of 51.9%, NPV of 81.8%, accuracy of 70.2%, and an AUC of 0.733 (95% CI: 0.657–0.808, P < 0.001) (Supplementary Table 2).
Under the 2015 ESC/ERS criteria, the AUC of PASP was 0.662 (95% CI: 0.494–0.65), while the model achieved an AUC of 0.733 (95% CI: 0.657–0.808, P < 0.001), marking an AUC improvement of 10.73% (95% CI: 1.47%–21.27%, P < 0.001) (Figure 2). Under the 7th WSPH criteria, the AUC of PASP was 0.629 (95% CI: 0.566–0.695), while the model achieved an AUC of 0.761 (95% CI: 0.692–0.823, P < 0.001), with an AUC improvement of 20.99% (95% CI: 9.54%–33.73%, P < 0.001) (Figure 3). However, the Z-test showed no significant difference between the models under the two criteria (P = 0.521) (Supplementary Figure 1).
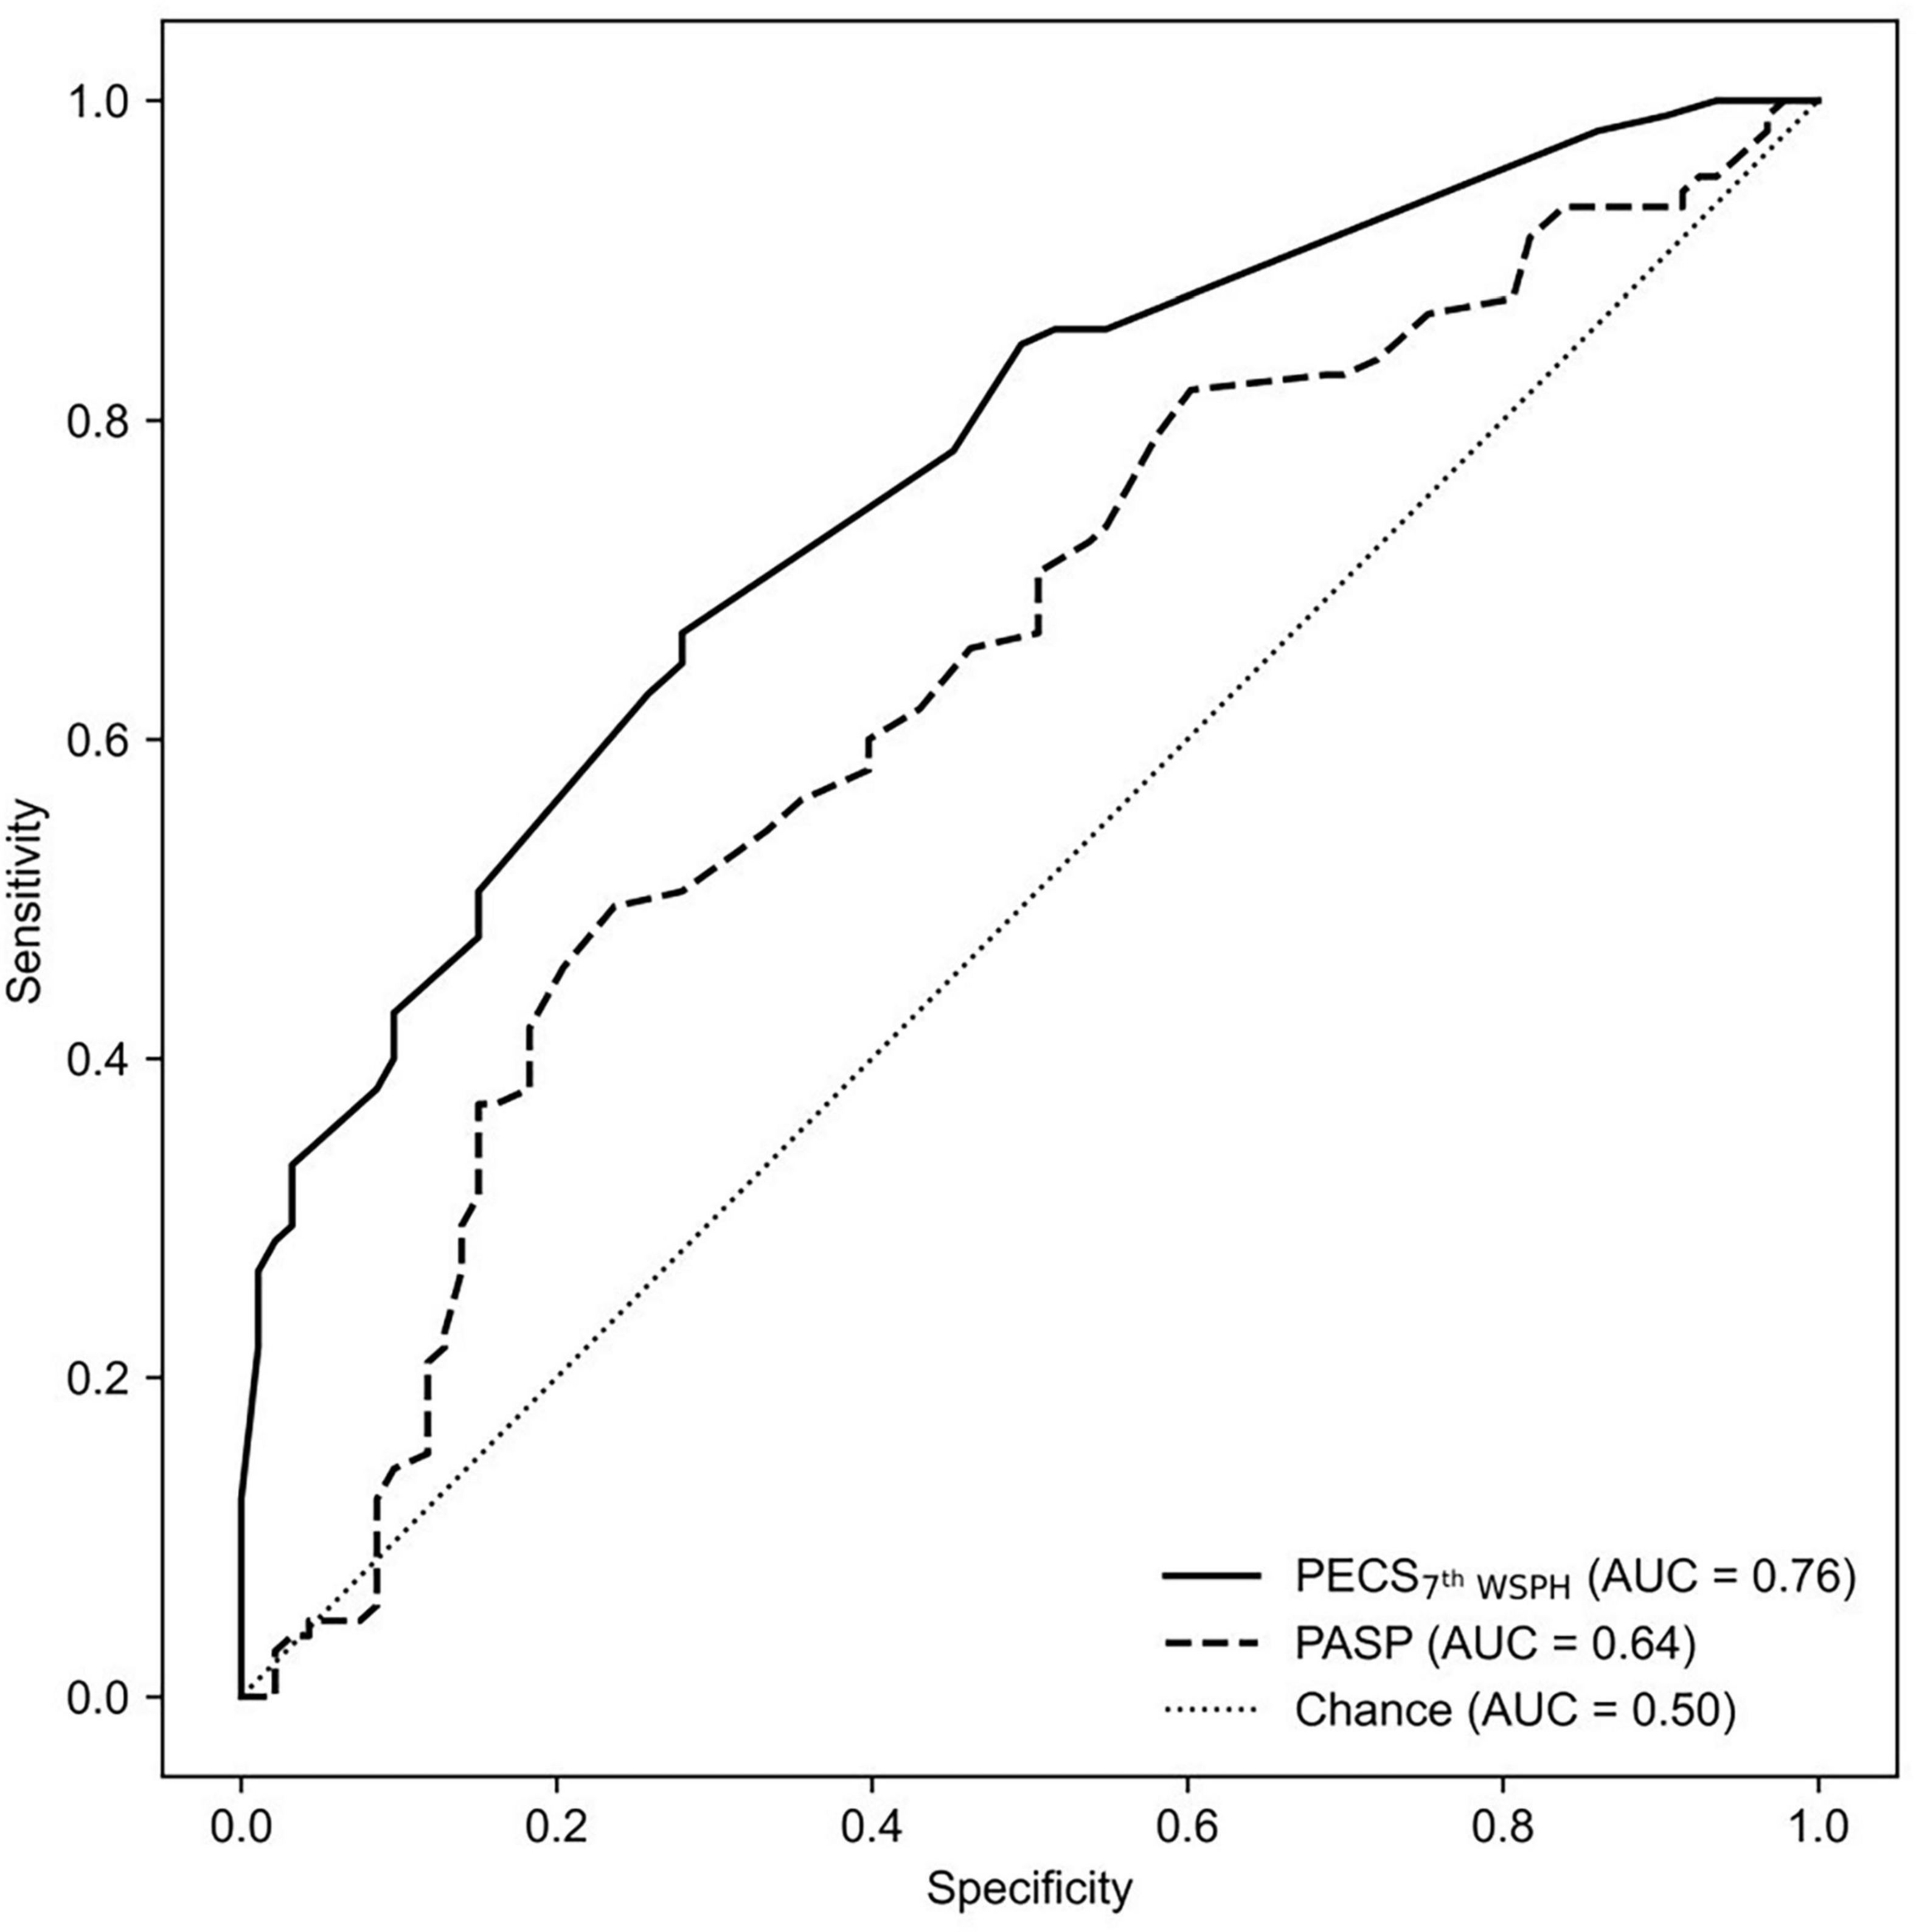
Figure 2. The ROC curve is shown for PECS7th WSPH and for PASP alone as determined by echocardiography variables in predicting Cpc-PH. AUC, area under the curve; PECS, Predictive Echocardiography Cpc-PH Score; PASP, pulmonary arterial systolic pressure; Cpc-PH, combined post-capillary pulmonary hypertension; ROC, receiver-operator characteristic.

Figure 3. The ROC curve is shown for PECS2015ESC/ERS and for PASP alone as determined by echocardiography variables in predicting Cpc-PH. AUC, area under the curve; PECS, Predictive Echocardiography Cpc-PH Score; PASP, pulmonary arterial systolic pressure; Cpc-PH, combined post-capillary pulmonary hypertension; ROC, receiver-operator characteristic.
5-fold cross-validation analysis
Following the constructing prediction models based on both the 2015 ESC/ERS and the 7th WSPH criteria, a 5-fold cross-validation approach was utilized to assess the efficacy of the two models. The performance metrics for the PECS7th WSPH model, were as follows: AUC, 0.752 ± 0.070; sensitivity, 0.657 ± 0.097; specificity, 0.653 ± 0.170; PPV, 0.693 ± 0.089; NPV, 0.623 ± 0.078; accuracy, 0.656 ± 0.081 (Supplementary Table 3).
For the PECS2015ESC/ERS model, the performance metrics from 5-fold cross-validation were as follows: AUC, 0.694 ± 0.082; sensitivity, 0.276 ± 0.086; specificity, 0.883 ± 0.084; PPV, 0.575 ± 0.284; NPV, 0.727 ± 0.039; accuracy, 0.692 ± 0.076 (Supplementary Table 4).
Nomograms
To facilitate clinical decision-making, nomograms were developed based on both the 7th WSPH and the 2015 ESC/ERS criteria. The 7th WSPH-based nomogram includes variables such as VHD, LAD, IVS, MV E/Em ratio, LVFS, and TR Vmax. PECS7th WSPH ≥ 2.2 strongly predicts the presence of Cpc-PH (Figure 4). The nomogram based on the 2015 ESC/ERS criteria uses variables including VHD, RVEDTD, MV E/Em ratio, and TR Vmax. PECS2015ESC/ERS ≥ 1.3 predicts Cpc-PH (Figure 5).
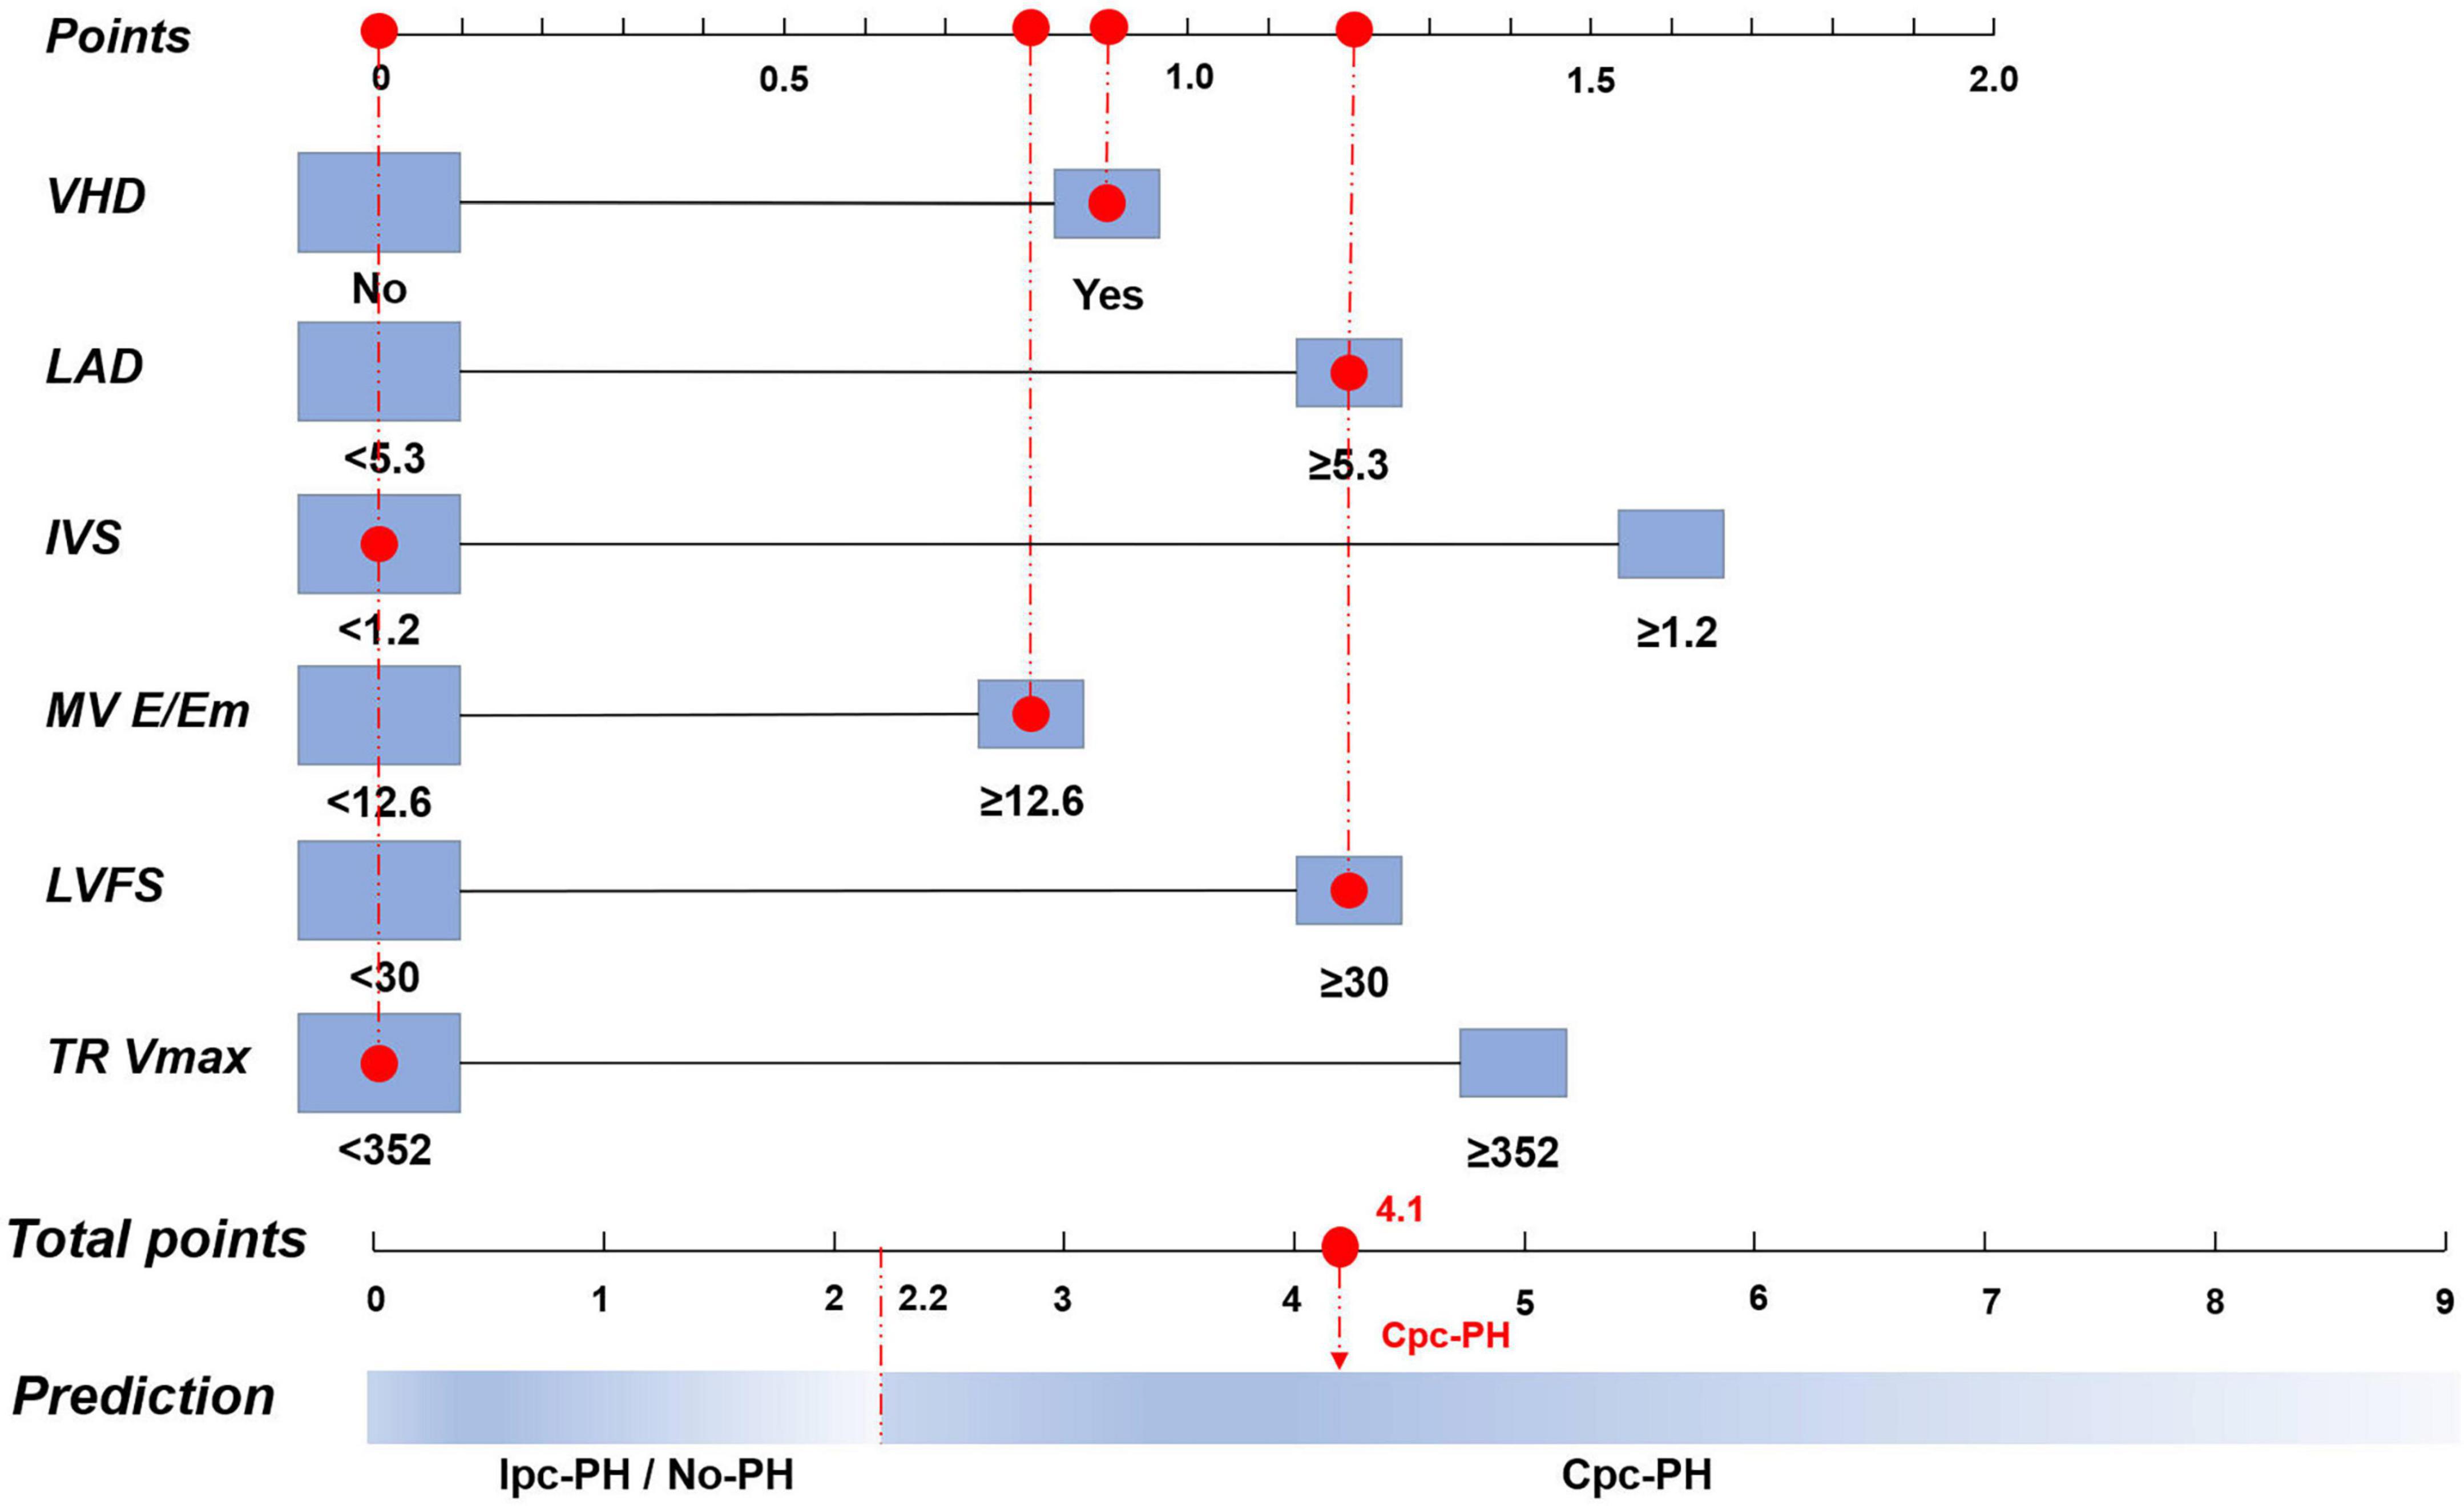
Figure 4. Nomogram of the logistic regression model based on the 7th World Symposium on Pulmonary Hypertension (WSPH) criteria. VHD, valvular heart disease; LAD, left atrial diameter; IVS, interventricular septum; MV E/Em, mitral valve early diastolic to early diastolic annular velocity ratio; LVFS, left ventricular fractional shortening; TR Vmax, tricuspid regurgitation peak velocity; Cpc-PH, combined post-capillary pulmonary hypertension; Ipc-PH, isolated post-capillary pulmonary hypertension.
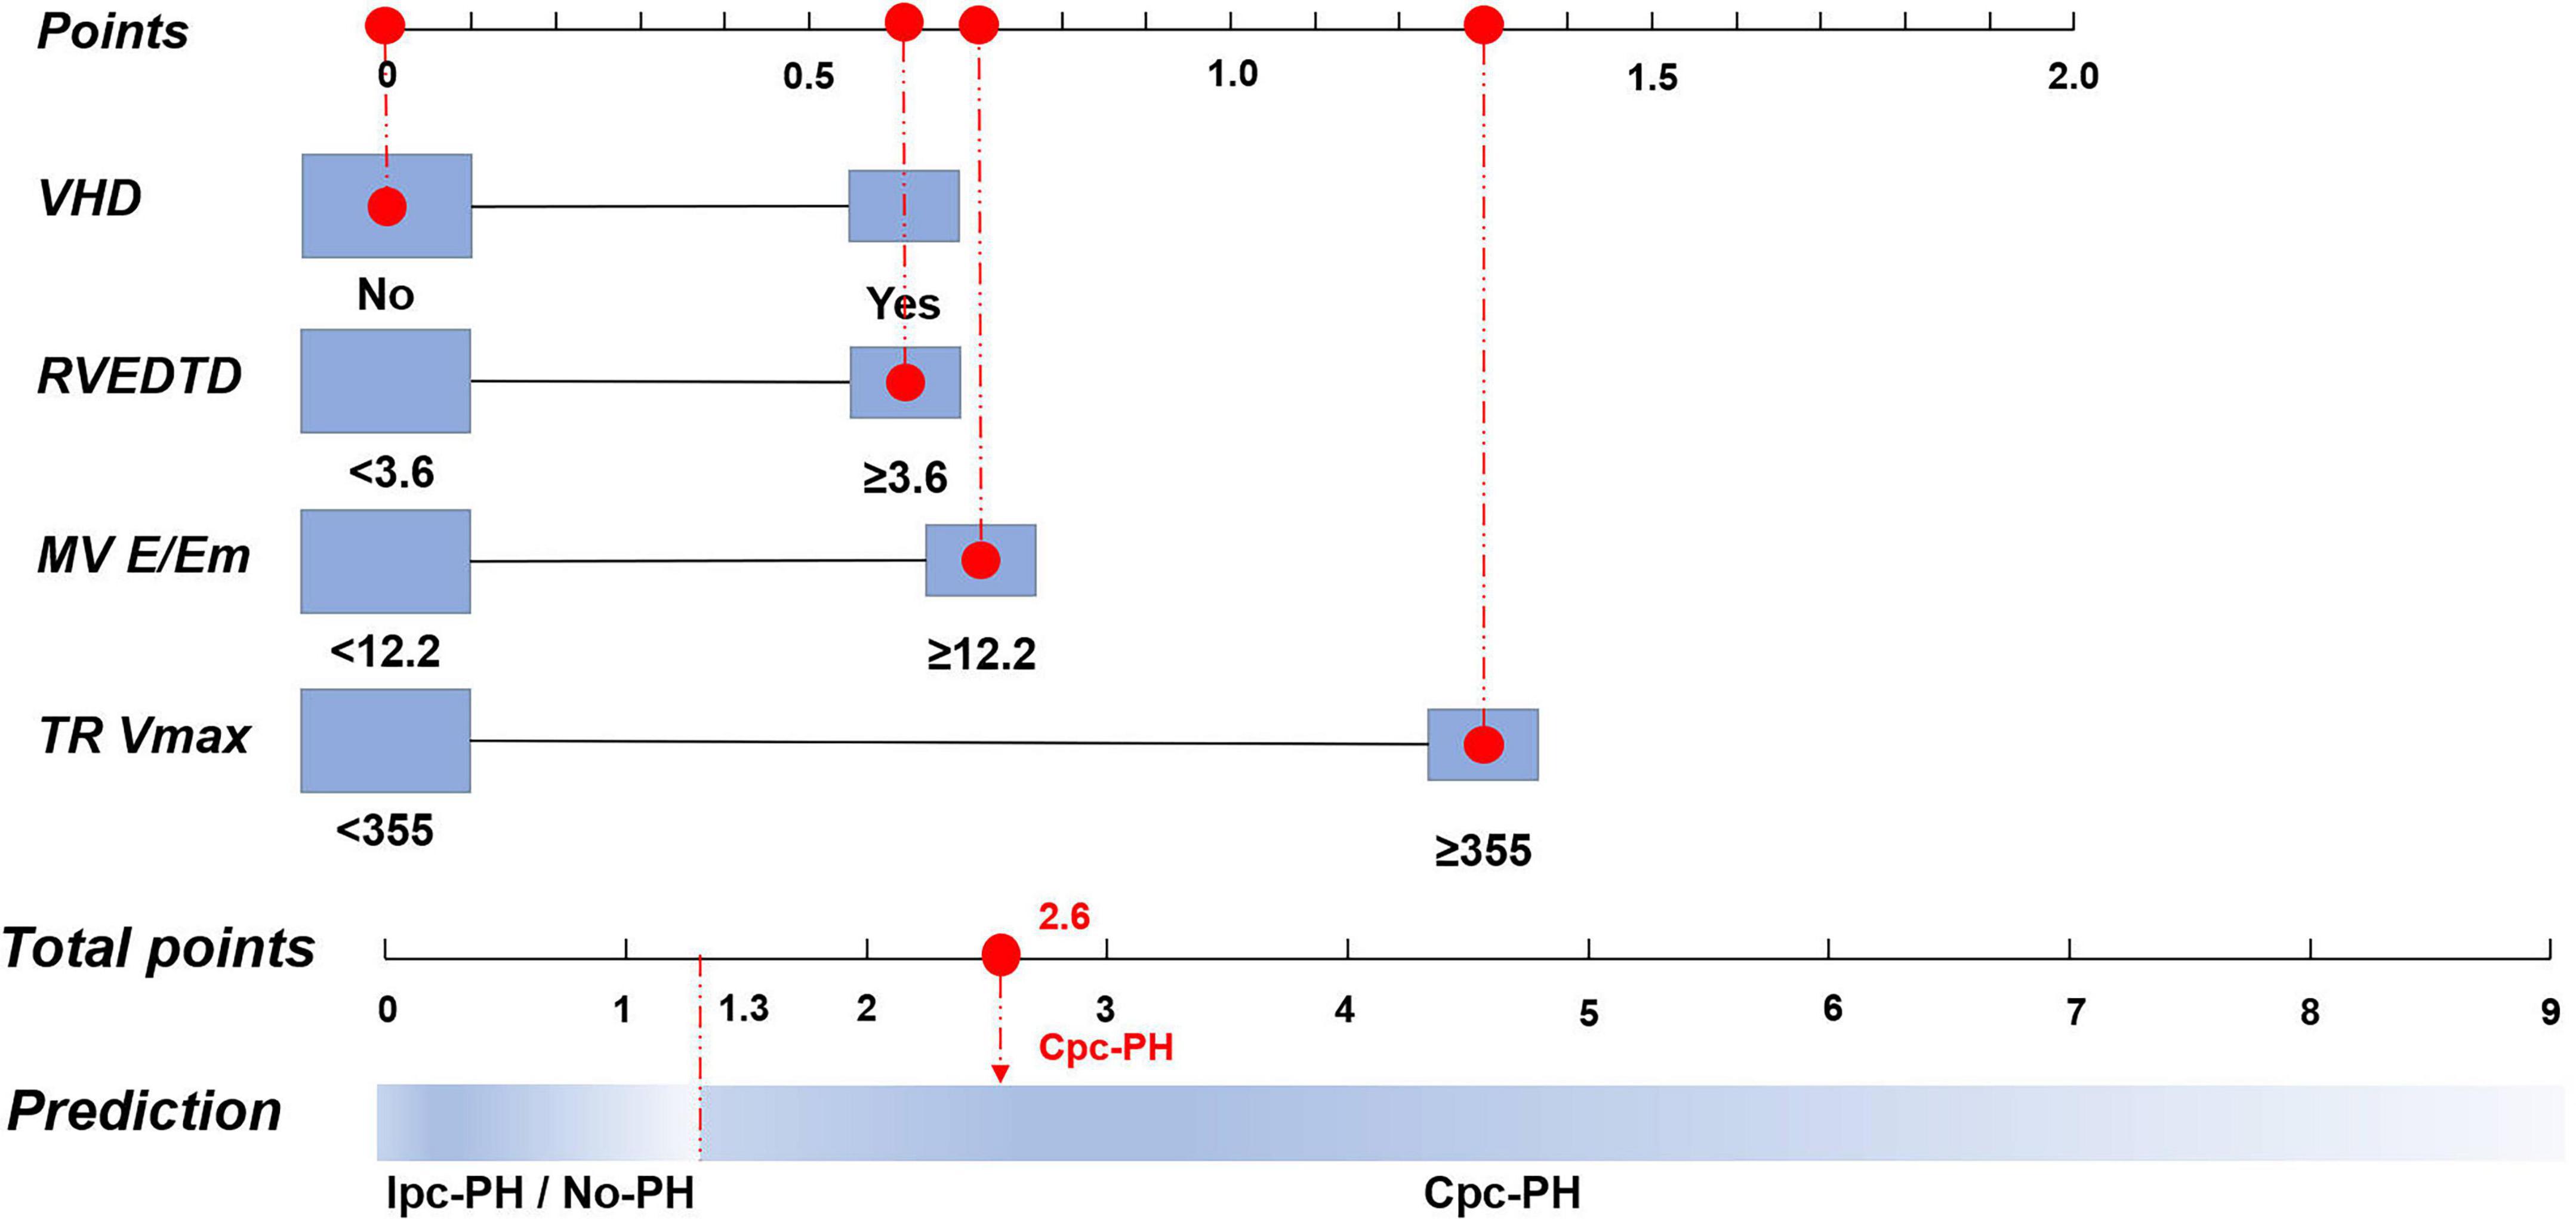
Figure 5. Nomogram of the logistic regression model based on the 2015 European Society of Cardiology/European Respiratory Society (ESC/ERS) Criteria. VHD, valvular heart disease; RVEDTD, right ventricular end-diastolic transverse dimension; MV E/Em, mitral valve early diastolic to early diastolic annular velocity ratio; TR Vmax, tricuspid regurgitation peak velocity; Cpc-PH, combined post-capillary pulmonary hypertension; Ipc-PH, isolated post-capillary pulmonary hypertension.
Discussion
In this study, the PECS model was developed and validated against both the 7th WSPH and the 2015 ESC/ERS criteria. It proved more effective than PASP for detecting Cpc-PH. Facilitating clinical decisions with a risk score indicates substantial innovation and practical value. However, there was no significant difference between the diagnostic performance of the PECS7th WSPH and the PECS2015ESC/ERS models.
In this study, we did not separately analyze no-PH and lpc-PH patients. The primary reason is that Cpc-PH, as a severe form of PH caused by left heart disease, has different treatment strategies compared to lpc-PH and no-PH (1, 7, 25).
The 2015 ESC/ERS criteria for Cpc-PH included PAWP > 15 mmHg, mPAP ≥ 25 mmHg, and PVR ≥ 3 WU, while the 7th WSPH and 2022 ESC/ERS criteria reduced these to PAWP > 15 mmHg, mPAP > 20 mmHg, and PVR > 2 Wood units. This shift in thresholds significantly affected the diagnostic landscape for Cpc-PH patients. Studies have indicated that reducing the PVR threshold from 3 to 2 WU could increase the identification rate of Cpc-PH patients by approximately 60% (26). In this study, we developed the PECS models based on the 7th WSPH and 2015 ESC/ERS criteria. Findings revealed that both models exhibited similar discriminative accuracy, with AUC values of 0.761 and 0.727, respectively, and the difference between them was not statistically significant. However, discrepancies were observed in the balance between sensitivity and specificity for the models. The PECS model adopting the updated criteria placed greater emphasis on enhancing sensitivity, achieving an average sensitivity of approximately 66% in 5-fold cross-validation, markedly higher than the 28% of the previous criteria model; correspondingly, the specificity of the new model was around 65%, slightly lower than that of the old model at 88%. This suggests that as diagnostic thresholds are lowered, the model must recognize a greater number of patients with relatively milder Cpc-PH, thereby enhancing the detection rate of potential cases, but also resulting in an increase in false positives. Under the previous criteria, the model was more stringent, primarily identifying typical Cpc-PH cases with higher PVR, hence exhibiting higher specificity but also a greater risk of failing to diagnose. Furthermore, the PECS7th WSPH model demonstrated greater stability in cross-validation, indicating that the model’s applicability across various population was instead strengthened.
The PECS model in this study provides innovative and superior non-invasive predictive capabilities compared to prior methods. PECS7th WSPH achieved an AUC of 0.761, clearly exceeding routine PASP estimation (AUC: 0.629) and performing competitively against representative non-invasive indices (Supplementary Table 5) (27, 28). In this study, we utilized regularized logistic regression to identify six salient parameters: VHD, LAD, IVS, mitral valve E/Em ratio, LVFS, and TV max. This approach culminated in the development of the novel PECS7th WSPH scoring system. Furthermore, given its inclusion of medical history and multi-scale echocardiographic parameters, the PECS model provides a more reliable assessment in the screening of Cpc-PH, demonstrating a certain degree of innovation and practical value.
Clinically, the PECS 7th WSPH model offers a promising avenue for early detection and intervention of Cpc-PH. Although RHC remains the gold standard for diagnosing PH, it is an invasive procedure associated with potential complications (29). Elderly, frail patients or those with multiple comorbidities often cannot tolerate RHC, which can result in delayed diagnosis and consequently, delayed treatment of manageable PH (29). In contrast, echocardiography is a non-invasive, safe, and widely accessible diagnostic modality that serves as an essential tool for the screening of PH (10). The PECS model, based on conventional ultrasound parameters, offers a practical solution for identifying Cpc-PH. Scores are easily calculated through routine ultrasound assessments and medical history collection. For patients suspected of Group 2 PH, this model can guide decisions on whether to proceed with invasive diagnostic procedures. A high PECS score supports the need for RHC to confirm diagnosis and initiate intervention, while a low score allows for close monitoring without unnecessary invasive tests. The PECS model is poised to enhance prognostic evaluation and guide therapy for pcPH patients, particularly those at risk of Cpc-PH. It underscores the need for rigorous management of underlying conditions and close monitoring of pulmonary vascular factors. The ultrasound-based PECS model emerges as a valuable non-invasive screening tool, boosting detection rates in high-risk groups and holding significant promise for clinical application.
A multicenter prospective study has confirmed that this classification method holds considerable prognostic value for the outcomes of patients with pcPH (26).
This study is subject to several limitations that delineate directions for future research. Firstly, the retrospective, single-center nature of the study results in a limited sample size, and the sensitivity/specificity of the model is modest. The RHC is an invasive diagnostic procedure, which poses practical challenges, especially when performed in elderly patients with multiple comorbidities. These challenges directly restrict the number of patients that can be included in our study. Despite these constraints, we have included all patients who met the criteria for this study, totaling 198 cases, of which 105 were confirmed as Cpc-PH. Our model incorporates six predictive factors, and the ratio of events to variables is approximately 17.5, which exceeds the generally accepted minimum threshold of 10. From a statistical perspective, we deem the current sample size to be adequate for model construction. Secondly, the model’s predictive factors are predominantly derived from echocardiographic and clinical history data, excluding serum biomarkers (e.g., BNP, NT-proBNP) and cardiopulmonary exercise test results. This exclusion may limit the model’s comprehensive assessment of Cpc-PH. To fully establish the model’s clinical utility, external validation in multicenter cohorts with diverse patient demographics is essential. Thirdly, in our study, there is a lack of external validation. Ongoing prospective validation and refinement of the model are anticipated to enhance its robustness and accuracy, ultimately positioning it as a valuable non-invasive screening tool for Cpc-PH. We have employed five-fold cross-validation as an internal validation method to assess the model’s stability. The cross-validation yielded an average AUC of approximately 0.75, which is very close to the model’s AUC on the entire derivation cohort (0.761), indicating that the model has good stability. This internal validation has strengthened our confidence in the model’s reliability and, to some extent, compensates for the current lack of external validation.
Conclusion
The study results indicate that the PECS is a valid and effective tool for identifying Cpc-PH, and it performs better than PASP. The PECS can be useful for clinicians in the diagnosis and management of patients with Cpc-PH.
Data availability statement
The raw data supporting the conclusions of this article will be made available by the authors, without undue reservation.
Ethics statement
The studies involving humans were approved by the Ethics Committee of Shanghai Pulmonary Hospital. The studies were conducted in accordance with the local legislation and institutional requirements. The participants provided their written informed consent to participate in this study.
Author contributions
C-YW: Validation, Formal analysis, Data curation, Writing – original draft, Software. Y-XL: Formal analysis, Data curation, Writing – original draft, Validation, Software. S-GG: Writing – review & editing, Supervision. Q-HZ: Writing – review & editing, Supervision. C-JL: Writing – review & editing, Resources, Visualization. H-LQ: Visualization, Writing – review & editing, Resources. W-HW: Resources, Writing – review & editing, Visualization. Y-BW: Writing – review & editing, Validation. LD: Writing – review & editing, Formal analysis. M-FG: Formal analysis, Writing – review & editing. LW: Writing – review & editing, Supervision, Visualization. RJ: Investigation, Resources, Writing – review & editing, Validation, Methodology, Conceptualization. Z-PL: Writing – review & editing, Validation, Supervision, Funding acquisition.
Funding
The author(s) declare that financial support was received for the research and/or publication of this article. This work was funded by the Medical and Health Project of Baoshan District in 2022 (2023-E-30).
Conflict of interest
The authors declare that the research was conducted in the absence of any commercial or financial relationships that could be construed as a potential conflict of interest.
Generative AI statement
The authors declare that no Generative AI was used in the creation of this manuscript.
Any alternative text (alt text) provided alongside figures in this article has been generated by Frontiers with the support of artificial intelligence and reasonable efforts have been made to ensure accuracy, including review by the authors wherever possible. If you identify any issues, please contact us.
Publisher’s note
All claims expressed in this article are solely those of the authors and do not necessarily represent those of their affiliated organizations, or those of the publisher, the editors and the reviewers. Any product that may be evaluated in this article, or claim that may be made by its manufacturer, is not guaranteed or endorsed by the publisher.
Supplementary material
The Supplementary Material for this article can be found online at: https://www.frontiersin.org/articles/10.3389/fmed.2025.1660387/full#supplementary-material
Supplementary Figure 1 | The ROC curve is shown for PECS7th WSPH and for PECS2015 ESC/ERS in predicting Cpc-PH. AUC: area under the curve; PECS: Predictive Echocardiography Cpc-PH Score; Cpc-PH, combined post-capillary pulmonary hypertension; ROC: receiver-operator characteristic.
References
1. Humbert M, Kovacs G, Hoeper M, Badagliacca R, Berger R, Brida M, et al. 2022 ESC/ERS Guidelines for the diagnosis and treatment of pulmonary hypertension. Eur Respir J. (2023) 61:2200879. doi: 10.1183/13993003.00879-2022
2. Rosenkranz S, Gibbs J, Wachter R, De Marco T, Vonk-Noordegraaf A, Vachiéry J. Left ventricular heart failure and pulmonary hypertension. Eur Heart J. (2016) 37:942–54. doi: 10.1093/eurheartj/ehv512
3. Assad T, Hemnes A, Larkin E, Glazer A, Xu M, Wells Q, et al. Clinical and biological insights into combined post- and pre-capillary pulmonary hypertension. J Am Coll Cardiol. (2016) 68:2525–36. doi: 10.1016/j.jacc.2016.09.942
4. Rezaee M, Nichols E, Sidhu M, Brown J. Combined post- and precapillary pulmonary hypertension in patients with heart failure. Clin Cardiol. (2016) 39:658–64. doi: 10.1002/clc.22579
5. Galiè N, Humbert M, Vachiery J, Gibbs S, Lang I, Torbicki A, et al. 2015 ESC/ERS guidelines for the diagnosis and treatment of pulmonary hypertension. Rev Esp Cardiol. (2016) 69:177. doi: 10.1016/j.rec.2016.01.002
6. Nakanishi N, European Society of Cardiology, European Respiratory Society. 2009 ESC/ERS pulmonary hypertension guidelines and connective tissue disease. Allergol Int. (2011) 60:419–24. doi: 10.2332/allergolint.11-RAI-0362
7. Vachiéry J, Adir Y, Barberà J, Champion H, Coghlan J, Cottin V, et al. Pulmonary hypertension due to left heart diseases. J Am Coll Cardiol. (2013) 62:D100–8. doi: 10.1016/j.jacc.2013.10.033
8. Moles V, Grafton G. Pulmonary hypertension in heart failure with preserved ejection fraction. Cardiol Clin. (2022) 40:533–40. doi: 10.1016/j.ccl.2022.06.007
9. Virani S, Alonso A, Aparicio H, Benjamin E, Bittencourt M, Callaway C, et al. Heart disease and stroke statistics-2021 update: a report from the American heart association. Circulation. (2021) 143:e254–743. doi: 10.1161/CIR.0000000000000950
10. Dong T, Zhu Q, Wang S, Wang Y, Li G, Kong F, et al. Diagnostic and prognostic value of echocardiography in pulmonary hypertension: an umbrella review of systematic reviews and meta-analyses. BMC Pulm Med. (2023) 23:253. doi: 10.1186/s12890-023-02552-y
11. Venkateshvaran A, Hamade J, Kjellström B, Lund L, Manouras A. Doppler estimates of pulmonary vascular resistance to phenotype pulmonary hypertension in heart failure. Int J Cardiovasc Imaging. (2019) 35:1465–72. doi: 10.1007/s10554-019-01591-z
12. Simonneau G, Montani D, Celermajer D, Denton C, Gatzoulis M, Krowka M, et al. Haemodynamic definitions and updated clinical classification of pulmonary hypertension. Eur Respir J. (2019) 53:1801913. doi: 10.1183/13993003.01913-2018
13. Jiang R, Ai Z, Jiang X, Yuan P, Liu D, Zhao Q, et al. Intravenous fasudil improves in-hospital mortality of patients with right heart failure in severe pulmonary hypertension. Hypertens Res. (2015) 38:539–44. doi: 10.1038/hr.2015.33
14. Jiang R, Wu C, Pudasaini B, Wang L, Zhao Q, Zhang R, et al. A novel scoring index by Doppler echocardiography for predicting severe pulmonary hypertension due to chronic lung diseases: a cross-sectional diagnostic accuracy study. Int J Chron Obstruct Pulmon Dis. (2017) 12:1741–51. doi: 10.2147/COPD.S133854
15. Jiang R, Wang L, Zhao Q, Wu C, Yuan P, Wang S, et al. Echocardiography nomogram for predicting survival among chronic lung disease patients with severe pulmonary hypertension. J Clin Med. (2022) 11:1603. doi: 10.3390/jcm11061603
16. Rudski L, Lai W, Afilalo J, Hua L, Handschumacher M, Chandrasekaran K, et al. Guidelines for the echocardiographic assessment of the right heart in adults: a report from the American Society of echocardiography endorsed by the european association of echocardiography, a registered branch of the European society of cardiology, and the canadian society of echocardiography. J Am Soc Echocardiogr. (2010) 23:685–713; quiz 786–8. doi: 10.1016/j.echo.2010.05.010
17. Lancellotti P, Galderisi M, Edvardsen T, Donal E, Goliasch G, Cardim N, et al. Echo-Doppler estimation of left ventricular filling pressure: results of the multicentre EACVI euro-filling study. Eur Heart J Cardiovasc Imaging. (2017) 18:961–8. doi: 10.1093/ehjci/jex067
18. Ruiz A, Ortiz M, Irache C, Almodovar A, Ortega M, Martinez F, et al. Right ventricular-pulmonary arterial coupling as a predictor of death or heart failure admission in patients with severe tricuspid regurgitation. Rev Esp Cardiol. in press. (2025). doi: 10.1016/j.rec.2025.04.009
19. Youden W. Index for rating diagnostic tests. Cancer. (1950) 3:32–5. doi: 10.1002/1097-0142(1950)3:1<32::aid-cncr2820030106>3.0.co;2-3
20. Pearson K. On the criterion that a given system of deviations from the probable in the case of a correlated system of variables is such that it can be reasonably supposed to have arisen from random sampling. In: Kotz S, Johnson N editors. Breakthroughs in statistics: Methodology and distribution. New York, NY: Springer New York (1992). p. 11–28.
21. Friedman J, Hastie T, Tibshirani R. Regularization paths for generalized linear models via coordinate descent. J Stat Softw. (2010) 33:1–22. doi: 10.18637/jss.v033.i01
22. Hanley J, McNeil B. The meaning and use of the area under a receiver operating characteristic (ROC) curve. Radiology. (1982) 143:29–36. doi: 10.1148/radiology.143.1.7063747
23. Allgaier J, Pryss R. Cross-validation visualized: a narrative guide to advanced methods. Machine Learn Knowledge Extract. (2024) 6:1378–88. doi: 10.3390/make6020065
24. Galbraith S. Applied missing data analysis by Craig K Enders. Aust N Z J Stat. (2012) 54:251–1. doi: 10.1111/j.1467-842X.2012.00656.x
25. Lau E, Tamura Y, McGoon M, Sitbon O. The 2015 ESC/ERS guidelines for the diagnosis and treatment of pulmonary hypertension: a practical chronicle of progress. Eur Respir J. (2015) 46:879–82. doi: 10.1183/13993003.01177-2015
26. Fauvel C, Damy T, Berthelot E, Bauer F, Eicher J, de Groote P, et al. Post-capillary pulmonary hypertension in heart failure: impact of current definition in the PH-HF multicentre study. Eur Heart J. (2024) 45:3274–88. doi: 10.1093/eurheartj/ehae467
27. Venkateshvaran A, Manouras A, Kjellström B, Lund L. The additive value of echocardiographic pulmonary to left atrial global strain ratio in the diagnosis of pulmonary hypertension. Int J Cardiol. (2019) 292:205–10. doi: 10.1016/j.ijcard.2019.05.025
28. He M, Jiang R, Fei-Sun, Cao JX, Wang L, Shi JY. Cardiac magnetic resonance imaging-derived septum swing index detects pulmonary hypertension: a diagnostic study. J Transl Int Med. (2023) 11:459–67. doi: 10.2478/jtim-2023-0114
Keywords: pulmonary hypertension, combined post-Capillary pulmonary hypertension, non-invasive diagnostics, echocardiography, right heart catheterization
Citation: Wan C-Y, Liu Y-X, Gong S-G, Zhao Q-H, Luo C-J, Qiu H-L, Wu W-H, Wei Y-B, Du L, Gu M-F, Wang L, Jiang R and Li Z-P (2025) Non-invasive PECS model for detection of combined post-capillary pulmonary hypertension. Front. Med. 12:1660387. doi: 10.3389/fmed.2025.1660387
Received: 06 July 2025; Accepted: 07 October 2025;
Published: 22 October 2025.
Edited by:
Jing Zhang, Fudan University, ChinaReviewed by:
Maria Chiara Grimaldi, Catholic University of the Sacred Heart, ItalyDheyaa Alkhanfar, Sheffield Teaching Hospitals NHS Foundation Trust, United Kingdom
Copyright © 2025 Wan, Liu, Gong, Zhao, Luo, Qiu, Wu, Wei, Du, Gu, Wang, Jiang and Li. This is an open-access article distributed under the terms of the Creative Commons Attribution License (CC BY). The use, distribution or reproduction in other forums is permitted, provided the original author(s) and the copyright owner(s) are credited and that the original publication in this journal is cited, in accordance with accepted academic practice. No use, distribution or reproduction is permitted which does not comply with these terms.
*Correspondence: Ze-Pu Li, bGl6ZXB1QGhvdG1haWwuY29t; Rong Jiang, bGlzdGVuaW5nMzlAMTYzLmNvbQ==; Lan Wang, bGFud2FuZ0B0b25namkuZWR1LmNu
†These authors have contributed equally to this work and share first authorship