Arousal detection by using ultra-short-term heart rate variability (HRV) analysis
 Mahtab Mohammadpoor Faskhodi
 Mireya Fernández-Chimeno
 - Department of Electronic Engineering, Universitat Politècnica de Catalunya, Barcelona, Spain
Introduction: The study of arousal is crucial as it helps to understand the role of increased physiological and psychological activation in emotions, motivation, cognitive performance, stress responses, sleep-wake cycles, and clinical application. Recent studies have shown that arousal is commonly associated with physiological changes including heart rate variability (HRV) as indicated by RR intervals. In some applications, the analysis requires analyzing short segments of RR time series, shorter than the usual 5 min HRV. The objective of this study is to check the performance of ultra-short-term HRV indices to track changes in arousal.
Method: In this study, to follow arousal changes, 31 healthy subjects were examined in both non-arousal (relaxed) and aroused states. Two states of 5 minutes each are used to measure the relaxed and arousal states. After data collection, RR time series segments were obtained randomly for each subject in arousal and relaxed states in the 30s, 60s, 120s, and 240s time windows. Next, 17 ultra-short-term HRV indices were computed for each time window for RR intervals in relaxed and aroused states.
Results and Discussion: Due to the findings, novel indices such as ACI and fnQ may aid in the recognition of arousal from relaxed status. The odds of ACI being higher for the same subject during a randomly selected arousal interval than during a randomly selected relax interval are 78%, 79%, 84%, and 89% for the 30s, 60s, 120s, and 240s time windows respectively. Similarly, the odds of fnQ being higher during arousal than during a relaxed state are 79%, 81%, 84%, and 85% for the 30s, 60s, 120s, and 240s time windows respectively. Therefore, ACI and fnQ provided the best performances in intra-individual arousal detection by using ultra-short-term HRV analysis among all of the obtained indices. Nevertheless, when pooling the indices for all the subjects, the inter-subject variability causes a moderate classification performance for all indices. In this case, the best performing index is fnQ with an area under the receiver operator curve (AUC) of 75%, 77%, 79%, and 80% for the 30s, 60s, 120s, and 240s time windows respectively.
1 Introduction
In experimental psychology and behavioral neuroscience, arousal has taken on several forms as a generic condition of central nervous system activity (Robbins, 1997). The level of activation is regulated by the ascending reticular activating system (ARAS) in the brain that simulates cortical activation represented by high-frequency gamma and low-frequency rhythmic theta activity, and descending networks, which trigger sensory-motor activation, represented by high electromyographic activity that is transmitted to the spinal cord. The arousal components which use a variety of neurotransmitters are located within the brainstem reticular formation, thalamus, posterior hypothalamus, and basal forebrain. The widespread projecting glutamate-using neurons of the non-specific thalamocortical projection system and the ventral extra-thalamic relay systems found in the basal forebrain and posterior hypothalamus are simulated by neurons of the reticular formation, which primarily uses glutamate as a neurotransmitter, to promote cortical activation (Jones, 2003). Formerly, electroencephalography (EEG) was used to capture arousal since it defines as frequency shifts in the electrical activity of the human brain. However, recent studies have shown that arousal is rather frequently related to physiological changes such as heart rate, pulse transit time, blood pressure, and respiratory rate. The desire for employing these physiological markers for arousal diagnosis has grown because they are more convenient to quantify than EEG signals (Goldie et al., 2010). For instance, Basner et al. (Basner et al., 2007) report that the heart rate immediately rises at the beginning of arousal and gradually returns to normal values (rebound effect) depending on how long arousal lasts. Consequently, they created an algorithm that computes beat-by-beat likelihood ratios to identify arousal, showing the probability that a certain heartbeat will coincide with the onset of the arousal state. Heart rate variability (HRV), defined as the change in the time intervals between adjacent heartbeats, is considered a measure of neurocardiac function that reflects heart-brain interactions and dynamic non-linear autonomic nervous system (ANS) processes. Consequently, studies of the fundamental connections between psychological processes and physiological functions, evaluations of cognitive development, and basic investigations of the central regulation of autonomic controls are growingly using measures of HRV (Berntson et al., 1997). The afferent nerves have a significant impact on the rhythm of the heart and are essential for physiological regulation. The heart’s intrinsic nervous system activity, which includes afferent signals from the mechanosensory and chemosensory neurons, integrates efferent sympathetic and parasympathetic activity (Shaffer et all., 2014). The balance between the sympathetic and parasympathetic nervous systems, which are two essential branches of the ANS, affects how steadily the interval between heartbeats varies. ANS implies a bridge between HRV and arousal activation. For instance, the parasympathetic nervous system predominates in a relaxed state, increasing HRV, whereas the sympathetic nervous system predominates in an arousal state, decreasing HRV (Acharya et al., 2006). According to the diagnostic value of HRV, various techniques have been developed to quantify this beat-to-beat variability to provide parameters of cardiac autonomic regulation. There are three primary categories for the analysis of HRV: time domain, frequency domain, and non-linear approaches. The time domain methods employ either statistical or geometric approaches. For the analysis of HRV, time domain methods allow determining both instant heart rate and intervals between subsequent normal QRS complexes (normal-to-normal R-R interval, NN), as well as other variables derived from NN intervals, such as mean NN interval, mean heart rate, the difference between the longest and shortest NN interval, and the difference between night and day heart rate. More clinically relevant HRV parameters include the root mean square of successive RR interval differences (RMSSD), the standard deviation of normal RR intervals (SDNN), the standard deviation of the average normal RR intervals (SDANN), and the percentage of normal RR intervals that differ by 50 ms (pNN50). Except for pNN50, all HRV indices are provided in units of time (ms) (Xhyheri et al., 2012). Using frequency domain data, the amount of signal energy inside component bands can be determined either absolutely or relatively. The main frequency components in HRV analysis are, high-frequency (HF) (0.15–0.4 Hz): a marker of the parasympathetic tone, low-frequency (LF) (0.04–0.15 Hz): related to sympathetic tone or autonomic balance, very-low-frequency (VLF), (0.0033–0.04 Hz), LF/HF ratio: index of the interaction between sympathetic and vagal activity (Heathers, 2014). Non-linear approach the unpredictability of a time series, which results from the complexity of the systems that regulate HRV. SD1, SD2, SD1/SD2, approximate entropy (ApEn), sample entropy (SampEn), detrended fluctuation analysis (DFA) α1, and DFA α2 are considered the main non-linear indices. The HRV indices that are used in this study are provided in Table 1. In recent studies, since traditional HRV recording systems, involve expensive equipment that also is not comfortable for daily usage, alternative methods have been utilized such as wearable sensors. Wearable technologies are characterized in the healthcare industry as non-invasive and autonomous devices that collect, process, and aggregate physiological data to enhance individual health status. Recent achievements provide added value for healthcare concentrating on prevention, diagnosis, treatment, and monitoring (Krey et al., 2020). In the HRV study, ultra-short-term analysis refers to recordings that are less than 5 min (Berntson et al., 1997). In recent years, the demand for ultra-short HRV analysis is widely increasing, especially in wearable sensors such as smartwatches and cellphones, to monitor heart rate and health status (Athavale and Krishnan, 2017; Nabih-Ali et al., 2017). Moreover, ultra-short HRV analysis is widely demanded in medicine, performance, and daily fitness (Shaffer et al., 2020). The main reason for the remarkable attention to the use of this metric in recent studies is that the conventional 5 min HRV recordings are not appropriate, due to the real-time (from 10 s to 1 min) requirements of certain applications. Hence, ultra-short recordings may allow continuous and real-time monitoring of wellbeing status (such as mood, attention, stress, and arousal levels (Pecchia et al., 2018)). Previous studies reported that features that effectively remove slow trends in the RR time series were more reliable and could be more accurately estimated from very short segments (McNames and Aboy, 2006). Although, HRV features sensitive to low-frequency components of HRV have poor repeatability and cannot be estimated accurately from electrocardiogram (ECG) segments shorter than 10 min (Sandercock et al., 2005) since the spectral analysis must be performed on stationary recordings lasting at least 10 times more than the slower significant oscillation period. Hence, some HRV features lose significance if computed in an ultra-short-term (Castaldo et al., 2019). In light of this, one of the main objectives of this study is to explore the validity of novel HRV measures in tracking physiological changes in the human body, specifically arousal activation, through ultra-short-term assessment. By applying some novel approaches along with conventional HRV methods, the study aims to determine if these indices might accurately monitor changes associated with arousal in a real-time setting.
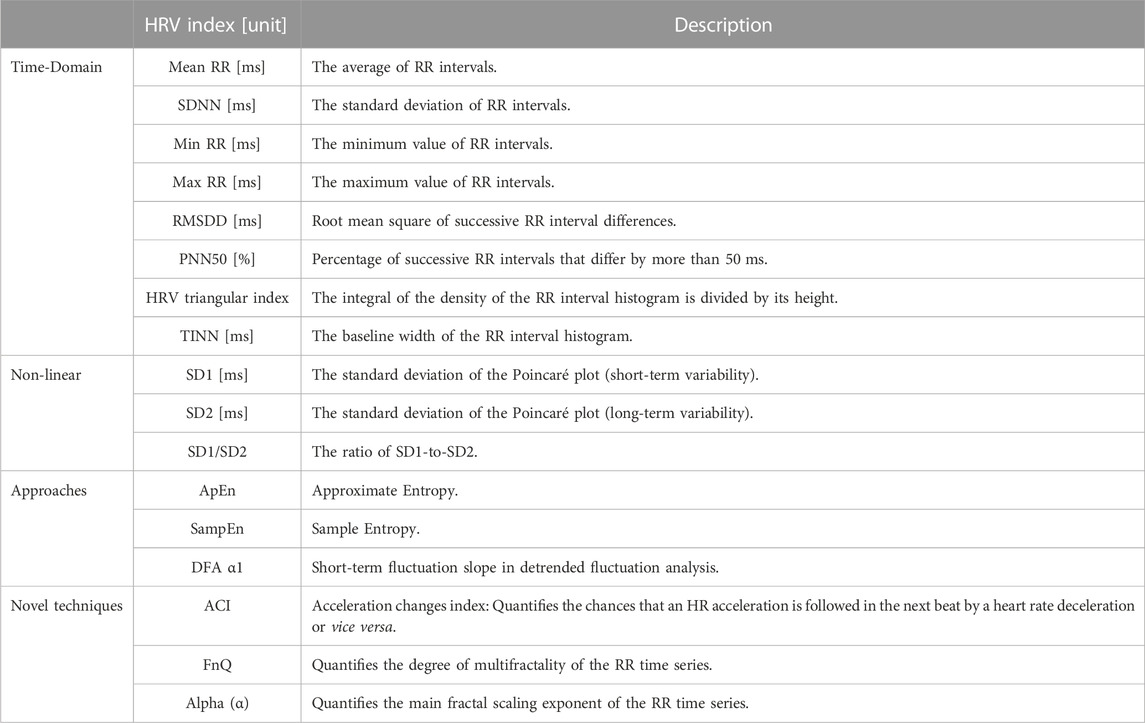
TABLE 1. Ultra-short-term HRV indices were used in this study.
2 Materials and methods
The methodology for detecting arousal via ultra-short-term HRV analysis is described in this section. Figure 1 shows a block diagram of the processing steps helping to grasp the basic notion. The experimental setup to induce arousal to generate the dataset, data analysis, and statistical tests are extendedly described. All data and codes are publicly accessible at https://osf.io/j98ey.
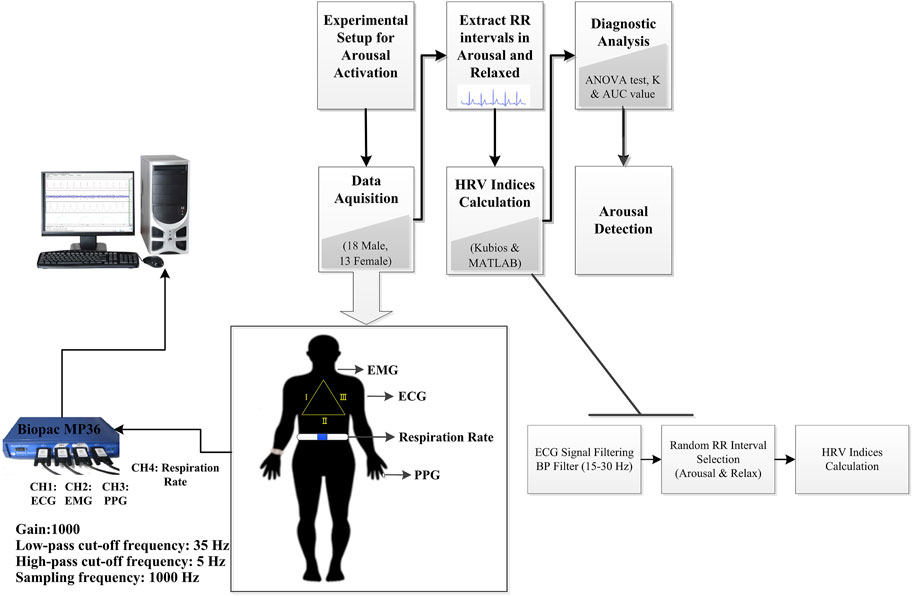
FIGURE 1. Block diagram of arousal detection by using ultra-short-term HRV analysis in this study. BP Filter, band-pass filter.
2.1 Data acquisition
In this attempt, 31 healthy subjects (18 male and 13 female) with a mean of 31.80 years and standard deviation age of 10.80 years were chosen to participate in the experiment. In research studies conducted in laboratory settings, participants are typically individuals associated with the university. These participants, who are researchers, scientists, students, or academic staff, volunteer to take part in the study. None had a history of neurological disorders or cardiac disease or a family history of early death in cardiovascular disease and all exhibited normal ECG signals without any sign of arrhythmia. The subjects included in the study were individuals who were either sedentary or moderately physically active with a body mass index (BMI) of 25.04 ± 3.0 kg m-2 in men and 23.35 ± 3.1 kg m-2 in women. All subjects in this investigation provided informed consent before participating, and the study was carried out by the Declaration of Helsinki and approved by the local Ethics Commission for Human Experimentation (protocol code CEEAH-5745). The experiment was started at the beginning of May 2022 and it was conducted till the end of June 2022.
2.2 Experimental setup
The experimental setup is designed to cause variations in arousal by employing the following stages in a laboratory setting to measure the impact of arousal in the human body. We asked the participants to seat in front of the monitor screen and put the headphone on to hear the sounds that are played during each phase of the experiment. To activate the arousal state, the Stroop test task was used which was implemented in MATLAB ® Software (Figure 2). In the Stroop test, participants name the written word color of incongruent words (word condition) or rectangles (color condition). The word condition involves selecting the color which corresponds to the word’s meaning, while the color condition focuses only on naming the ink color of rectangles, providing insights into cognitive processes and interference effects.
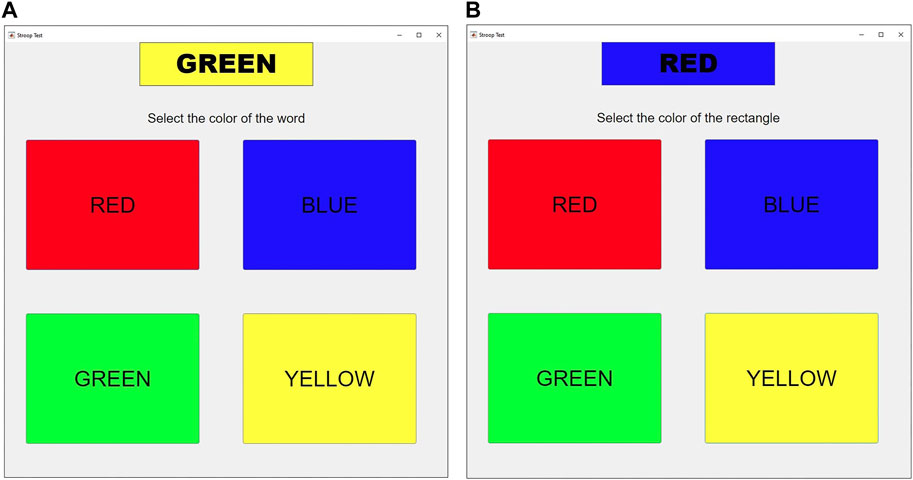
FIGURE 2. (A) The Stroop color-word interface is used for the first arousal state (A1) which participants name the written word color of incongruent words (word condition). Here, the participant is instructed to select the color “green” that corresponds to the written word’s meaning. (B) The Stroop color-word interface is used for the second arousal state (A2) which participants name the ink color of incongruent rectangles (color condition). In this case, the participant is expected to choose the color “blue” which corresponds to the ink color of the rectangle, disregarding the actual color word written.
2.2.1 Seated resting
The study does not include this stage, which comprises recording for 2 min to allow for physiological adaption. The subject is yet seated and the sensors are attached before recording begins, which ushers in this level.
2.2.2 Non-arousal state (relaxing status (R1))
At this level, subjects were advised to breathe on their own but try to maintain a slow breathing rate while listening to nature sounds for 5 min with their eyes closed. Paced breathing is frequently used to increase respiratory sinus arrhythmia, which is linked to lower heart rate and higher vagally mediated HRV measures (Vaschillo et al., 2006). However, it has not been widely used because the task of synchronizing breathing with an external stimulus can cause unintentional arousal.
2.2.3 Arousal state (Stroop test task (A1))
At this level, the Stroop test of word condition has been conducted. During the test, the subject is listening to traffic jam noise. They are taught to quickly choose the color (either red, blue, green, or yellow) that corresponds to a displayed word on a computer screen while using a mouse with their dominant hand (Figure 2A). The word that is printed is enclosed in a rectangle whose color can either match the word (color-word match) or not (color-word mismatch). During the 5 min that makes up this level, the selection task is repeated. The likelihood of a color-word mismatch grows as time since the start of this stage increases.
2.2.4 Non-arousal state (relaxing state (R2))
Subjects in this level, like those in state R1, were instructed to breathe slowly with closed eyes while listening to nature sounds for 5 min time duration.
2.2.5 Arousal state (Stroop test task (A2))
At this level, the Stroop test of the color condition has been conducted. As mentioned above, this stage and stage 3 are simply different in that the subject should choose the color of the rectangle rather than the color of the written word (Figure 2B). The activity is performed for 5 min, and the probability of a color-word mismatch increases as time goes on. At this level, the volunteers are required to listen to death metal music while the test is performed (The reason for using various acoustic simulators during A1 and A2 is to check if the different simulators such as traffic jam noise or death metal can activate the arousal differently or not).
2.3 Setup configuration
This investigation collects relevant bio-signals using a Biopac MP36 acquisition unit the electrocardiogram (ECG), photoplethysmography (PPG), electromyogram (EMG), and respiration rate were all simultaneously sampled at 1 kHz. Here, we concentrate on the ECG signal that is applied to detect the arousal state. To capture the ECG signal, the standard lead II and consequently, the right arm (RA), left leg (LL), and right leg (RL) have all been attached with three electrodes (see Figure 3). By lowering the P and T wave amplitudes and preventing slow drifts related to baseline wander, the high-pass, cut-off frequency of 0.5 Hz conducts a pre-enhancement of the QRS complex at a relatively high value (compared to clinical ECG). On the contrary, interference, and noise are minimized by the low value of the low-pass cut-off frequency of 35 Hz. The interval fluctuation between successive QRS complexes is considered to be accurately captured at a sampling frequency of 1 kHz and gain of 1,000.
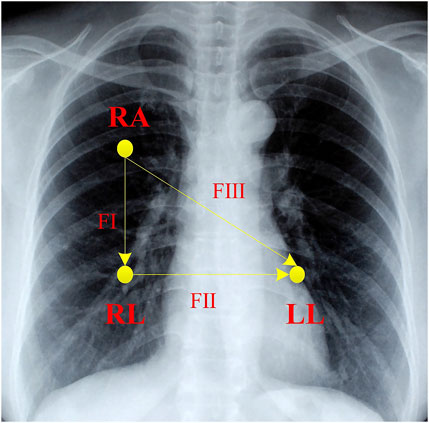
FIGURE 3. The schematic placement of electrodes for ECG monitoring. RA is right arm lead, LA is left arm lead, and LL is left leg lead. FІ, FІІ, and FІІІ correspond to lead І, lead ІІ, and lead ІІІ, respectively.
2.4 Diagnostic power analysis
The first step for an accurate ECG analysis, is signal filtering, since the ECG signal has low frequency and amplitude. Consequently, here the ECG has been filtered using a second-order band-pass filter with a cut-off frequency between 15 and 30 Hz to enhance the QRS complex by using Kubios® software. After ECG signal filtering, the RR time series are detected by using Kubios. To initiate analysis, for each arousal state, two segments of the RR time series with a fixed time window length (T) were extracted. To extract them, first, the target state was chosen at random (A1 or A2 for arousal and R1 or R2 for relaxation) as well as the subject. Then, from all the RR time intervals included in the 5 min of the chosen state, a starting interval was randomly selected (at sample nstart of the RR time series) considering all intervals from the beginning of the state to 5 min minus T. Once this interval is allocated, the segment is extracted by considering the consecutive RR intervals from nstart to the nend where nend is the maximum sample number that meets RR(nend)-RR(nstart)<T. For each T and state (either arousal or relaxed), this procedure is repeated 1,000 times to have a large number of ultra-short-term RR time series realizations. We have considered four different values for T: 30s, 60s, 120s, and 240s. After RR time series segment extraction 17 ultra-short-term HRV parameters either in the time domain, based on non-linear dynamics approaches, or novel techniques were calculated in the different randomly extracted time series (applied HRV indices are summarized in Table 1). The reason for not using the frequency domain as earlier described is that indices in the power spectrum cannot be properly applied in the ultra-short-term analysis. In this study, to compute the HRV triangular index, the number of successive values for the local measure was considered 0 which means that this parameter is calculated retrospectively. Moreover, the bin size of the histogram in the HRV triangular index and TINN was taken 1/128. For ApEn and SampEn, an embedding dimension of 2 and 3 beats was employed, respectively. To calculate these two entropy indices, the tolerance 0.2 multiplied by the standard deviation of the RR time series was used. Further, to determine the ApEn index the delay time for down-sampling is considered 1. Since the fluctuations in this attempt are short-term, scales between 4 and 12 beats For DFA α1 were applied. In addition to the conventional HRV parameters some novel indices have also been employed because it was thought that they would be sensitive to arousal fluctuations; ACI, fnQ, and alpha (α) which are all presented by García-González et al. (García-González et al., 2003; García-González et al., 2013) are outlined here.
2.4.1 Acceleration change index (ACI)
A new, quick, and simple-to-use index for HRV analysis that captures the dynamics of the RR time series (García-González et al., 2003). This index identified the direction of the variations in a time series. The ACI measures how frequently a local maximum or minimum follows a local minimum or vice versa.
2.4.2 Fractional differ-integration index (fnQ)
Fractional differ-integration has recently been used as a new method in HRV studies. A novel effective index called the fnQ measures how the time series adapt to a mono-fractal time series model. It is derived from the fractional differ-integration operator. This parameter focuses on how the standard deviation of the fractionally differ-integrated RR time series changes with the differ-integration operator’s order (García-González et al., 2013). Significant fnQ alterations are brought on by aging, postural changes, and timed breathing.
2.4.3 Alpha (α)
As the sequence that minimizes the standard deviation of the fractionally differ-integrated RR time series, the alpha (α) index was suggested. A high association between this index and the short-term exponent derived by regularly used HRV measures including DFA, LF/HF, and RMSDD was found based on the data obtained (García-González et al., 2013). The challenge of determining which category an observation (or series of observations) belongs to in statistics is known as classification. Here to classify arousal and non-arousal (relaxed) in an ultra-short-term HRV study, various statistical analyses have been used which are described as follows.
2.4.3.1 ANOVA test
In the initial stage to recognize arousal by using HRV analysis, HRV indicators were compared using the analysis of variance (ANOVA) test (Relaxing (R) and Arousal (A) where states relaxed 1 (R1) and relaxed 2 (R2) are pooled and state arousal 1 (A1) and arousal 2 (A2) are pooled as well). The index has proper sensitivity to determine arousal if the one-way ANOVA test results show significant differences between arousal states since the observed differences between indices in the various arousal states are large enough to not be obscured by the inter-subject variability. In addition to the one-way ANOVA, a two-way analysis of variance can look at data that are divided into categories based on two independent variables (X1 = Arousal state, X2 = Subject). One of the main disadvantages of the ANOVA test is that it compares samples based on their means. It means that ANOVA examines the means of various samples to determine the influence of one or more factors on the outcome. Consequently, in this survey, more than the ANOVA test we applied techniques that can compare the certain value of each HRV index instead of their mean value which can cause more reliable classification results. To achieve this, the two following markers are calculated for each HRV index.
2.4.3.2 K value
The K value for an HRV index is computed from the 1,000 pairs of short-term RR time series randomly extracted for the different subjects. If Indna(i) is the index computed during the non-arousal (relaxed) state for realization i and Inda(i) is the value of the index during the arousal state, the K value is:
where
2.4.3.3 AUC (the area under the ROC curve) value
The area under the Receiver Operating Characteristic (ROC) curve (AUC) is a regularly used metric to assess classification algorithms ranking quality which is connected with the quantity calculated in the Wilcoxon or Mann-Whitney statistical test. The ROC was initially discussed in the context of radio waves in signal detection theory (Hanley et al., 1982). The true positive rate (TPR) is plotted as a function of the false positive rate (FPR) on the ROC curve for a binary classification problem. Sweeping the classification threshold from the most positive classification value to the most negative yields the curve’s points. The ROC curve for a categorization that is entirely random is a line that runs from (0, 0) to (1, 1). Any gain in classification accuracy over random sampling yields a ROC curve that is at least partially above this line. The area under the ROC curve is referred to as the AUC (Cortes and Mohri, 2005) and it can be considered as an index based on pairwise comparisons between classifications of the two classes. By comparing HRV index values across subjects, AUC evaluated the classificatory performance of HRV indicators. In this work, we computed the AUC without the need to evaluate FPR or TPR for the different classification thresholds by directly applying the Wilcoxon-Mann-Whitney U-Statistic that counts how many times an index in a certain state is higher than the pooled indices in the other state for all subjects (Yan et al., 2003). Regardless of which categorization threshold is selected, AUC evaluates how accurately the indicator can classify between arousal or relaxed states. Because each index in one state is compared with the pooled indices for the other state, this parameter is affected by inter-subject variability. As a result, it is anticipated that the value produced from this parameter will be lower than the K value (keep in mind that similar to the K value, this indicator fluctuates between 50% and 100%).
3 Results
In this study, the ECG signals of 31 healthy subjects in arousal and relaxed states are examined by the research methodology formerly stated. To detect the arousal state by using ultra-short-term HRV analysis statistical analysis was applied for various HRV indicators (Table 1). To establish that there is a remarkable difference between arousal and non-arousal (relaxed) states, several statistical analyses such as calculating the one- and two-way ANOVA test (including p values), K value (%), AUC value (%), and median [25th—75th percentile], have been provided for the less than 1 min–4 min time windows. As determined by the outcomes, one-way ANOVA using the state of arousal as the main factor (only considering X1) indicated that the mean value of all the HRV indices which are studied here show very significant differences (p-value<0.001) when comparing the arousal state with the relaxed state except for min RR, ApEn, SampEn, and DFA α1 for equal or less than 1 min time windows. Additionally, the SD1/SD2 ratio and DFA α1 perform poorly in detecting arousal states in time windows lasting more than 1 min. In a two-way ANOVA test by considering the X1 variable, SD1/SD2 ratio in 240s, SampEn in 30s, and DFA α1 in 30s and 240s time windows could not provide a promising result (The p-value of these indices in the provided time windows were higher than 0.001). In a two-way ANOVA test by considering the X2 variable, all indices show very significant differences between the two groups (p-value<0.001). The reason for this is that in two-way ANOVA, the inter-subject variability is considered and corrected while examining the other factor (Arousal state). The result of ANOVA tests is provided in Table 2. The K value (%), AUC value (%), and median [25th—75th percentile] of arousal and relaxed states are presented for HRV indices in the different time windows in Figure 4, Figure 5, and Table 2 respectively. According to the obtained outcomes, among all of the HRV indices that were determined in this investigation, the ACI and fnQ have provided the best performance. The percentage of the K value for the ACI index varied between almost 76% for less than 1 min and 88% for the 4 min time windows. Also, by determining the percentage of AUC value, the achieved rate ranged between approximately 74% and 79% for the ACI index in the 30s–240s time windows. The percentage of K value, in the fnQ index ranged from 78% for the 30s to roughly 87% for the 240s time window size. Additionally, by using an AUC, the achieved value for the fnQ index ranged between roughly 75% and 80% for the 30s–240s time windows. Further than this result, the odds of ACI being higher for the same individual during randomly chosen arousal intervals compared to randomly chosen relaxation intervals is as follows, 78%, 79%, 84%, and 89% for the time windows of 30s, 60s, 120s, and 240s, respectively. Similarly, the odds of fnQ being higher during arousal than during a relaxed state are 79%, 81%, 84%, and 85% for the corresponding time windows. However, when combining the indices for all subjects, the variability between individuals leads to a moderate classification performance for all indices. In this scenario, fnQ demonstrates the best performance, with an AUC value of 75%, 77%, 79%, and 80% for the 30s, 60s, 120s, and 240s time windows, respectively.
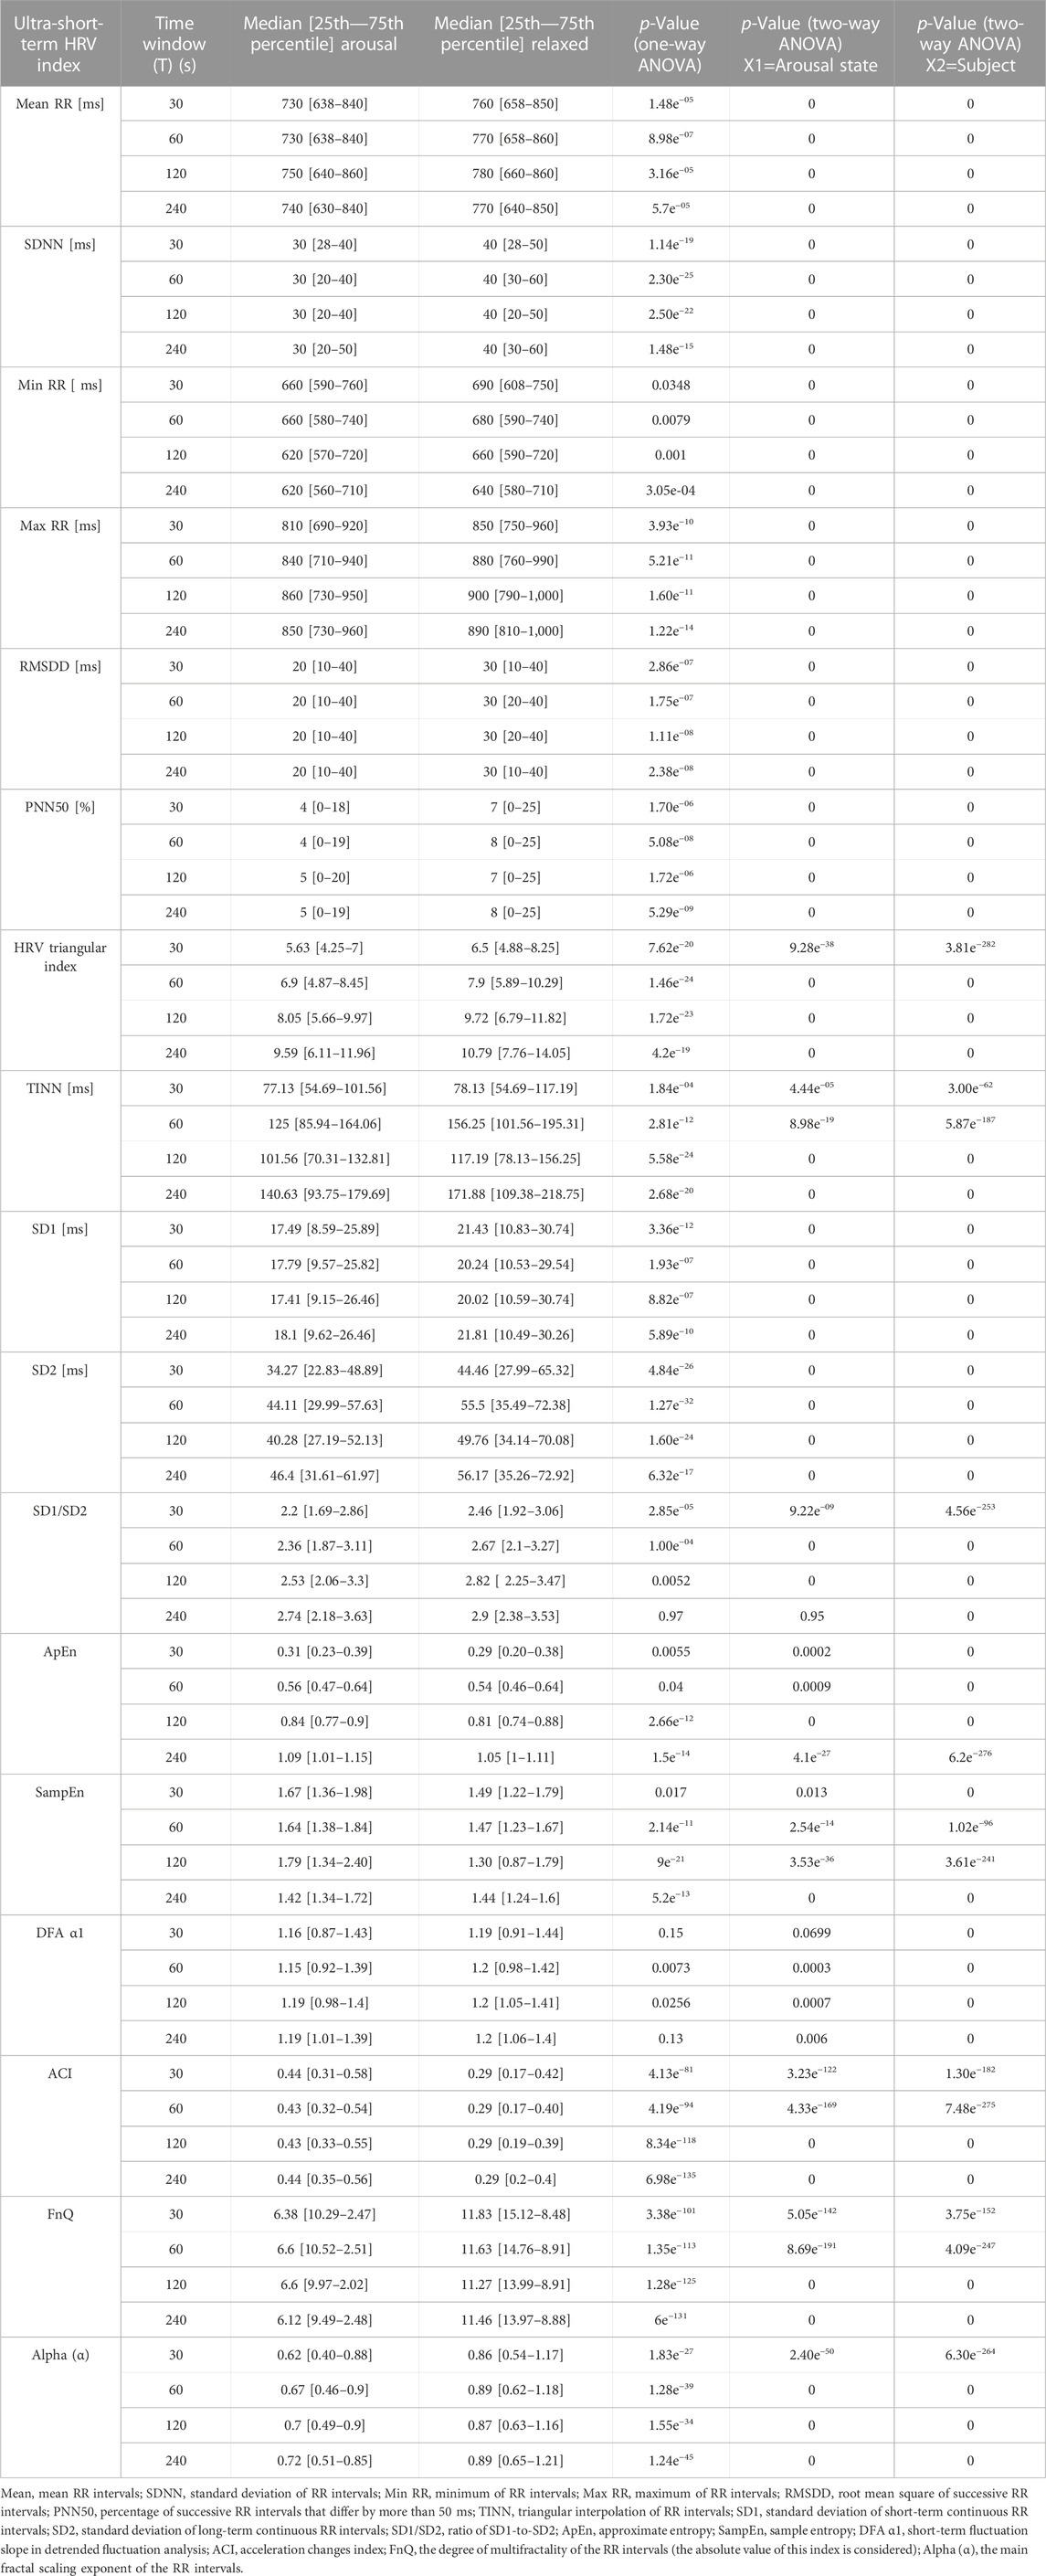
TABLE 2. Statistical analysis result of ultra-short-term HRV indices for arousal and relaxed states.
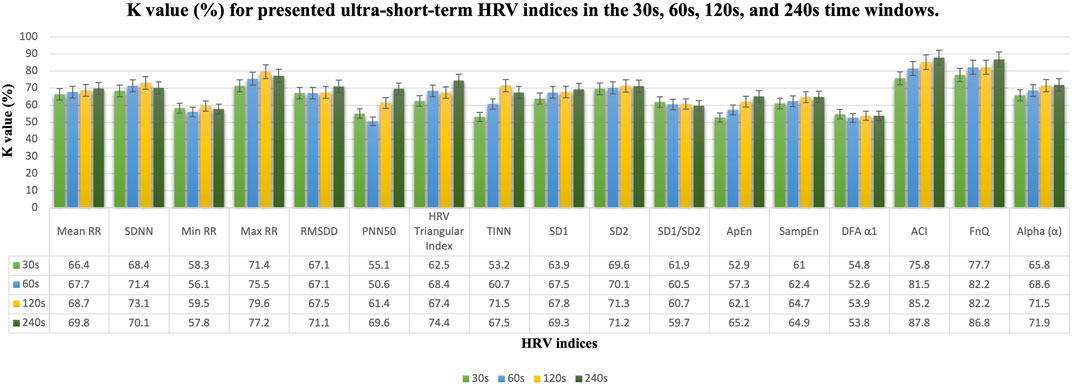
FIGURE 4. K value (%) results in the 30s, 60s, 120s, and 240s time windows for presented ultra-short-term HRV indices. Mean, mean RR intervals; SDNN, standard deviation of RR intervals; Min RR, minimum of RR intervals; Max RR, maximum of RR intervals; RMSDD, root mean square of successive RR intervals; PNN50, percentage of successive RR intervals that differ by more than 50 ms; TINN, triangular interpolation of RR intervals; SD1, standard deviation of short-term continuous RR intervals; SD2, standard deviation of long-term continuous RR interval; SD1/SD2, ratio of SD1-to-SD2; ApEn, approximate entropy; SampEn, sample entropy; DFA α1, short-term fluctuation slope in detrended fluctuation analysis; ACI, acceleration changes index; FnQ, the degree of multifractality of the RR intervals; Alpha (α), the main fractal scaling exponent of the RR intervals.
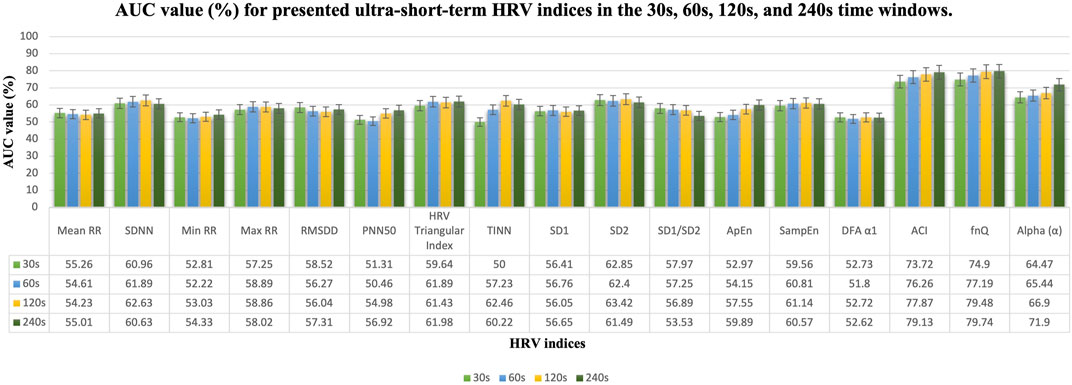
FIGURE 5. AUC value (%) results in the 30s, 60s, 120s, and 240s time windows for presented ultra-short-term HRV indices. Mean, mean RR intervals; SDNN, standard deviation of RR intervals; Min RR, minimum of RR intervals; Max RR, maximum of RR intervals; RMSDD, root mean square of successive RR intervals; PNN50, percentage of successive RR intervals that differ by more than 50 ms; TINN, triangular interpolation of RR intervals; SD1, standard deviation of short-term continuous RR intervals; SD2, standard deviation of long-term continuous RR interval; SD1/SD2, ratio of SD1-to-SD2; ApEn, approximate entropy; SampEn, sample entropy; DFA α1, short-term fluctuation slope in detrended fluctuation analysis; ACI, acceleration changes index; FnQ, the degree of multifractality of the RR intervals; Alpha (α), the main fractal scaling exponent of the RR intervals.
4 Discussion
In recent years, arousal has been extensively studied in the fields of psychology and neuroscience, as it provides insights into the influence of increased physiological and physiological activation in emotions, motivation, cognitive performance, stress responses, sleep-wake cycles, and clinical implications. Hence, researchers contend that distinct arousal systems would be indicated by the physiological differences that appear among distinct neurochemical and neuronal pathways (Frohlich et al., 2001). Moreover, the study of arousal is important since when arousal is activated, we experience heart palpitations, shortness of breath, and perspiration. In addition, it can reduce concentration, impair the ability to perform, and increase the probability of making errors. Consequently, arousal monitoring in daily life by using wearable devices is possibly helpful. The technological advances in wearable systems have caused a paradigm shift as a result of the increased interest in health and wellbeing. Because they provide subjects with individualized health status and become an attractive option in the healthcare industry. Moreover, users of wearables now have access to comforts and expenses that are not currently available from conventional healthcare products and services due to health management devices. Nevertheless, it is unclear which traits are used to assess the health of wearable products. Arousal was previously recorded using EEG, which describes it as frequency variations in the electrical activity of the human brain. Recent research has however revealed that physiological variables such as ECG (including using RR time series) are usually related to arousal. These physiological markers are easier to measure than EEG signals, which has increased interest in using them for arousal detection. For instance, HRV can be used as a proper approach to track arousal changes since when parasympathetic nerve control exceeds sympathetic control, lower levels of arousal occur. The detection of heartbeats initiates the HRV analysis. For the ultra-short HRV study (recording less than 5 min) to be useful, wearable (or at the very least ambulatory) sensors must be primarily used. Therefore, using heartbeat monitors reliable enough for ambulatory situations is the key challenge here. In addition, one of the critical issues of the ultra-short-term analysis is that some HRV features are sensitive to low-frequency components have poor repeatability, and cannot be evaluated accurately from ECG measurements shorter than 10 min. Therefore, several HRV parameters in the frequency domain cannot be calculated in extremely brief time intervals. In this study, various acoustic simulators during A1 and A2 were used to check if the different simulators such as traffic jam noise or death metal can activate the arousal differently or not. A two-way analysis of ANOVA using factors A1 and A2 and the subject showed that there are no differences between arousal activation when the different acoustic simulator is used. Moreover, the result of this attempt revealed that for most of the ultra-short-term HRV indices, there was an increase in performance by increasing the time length of RR intervals. However, the improvement was not spectacular. Our study found that during arousal activation, several ultra-short-term HRV indices showed a decrease, including mean RR, SDNN, min RR, max RR, RMSDD, pNN50, HRV triangular index, TINN, SD1, SD2, SD1/SD2, DFA α1, fnQ (since the value of fnQ is negative, the absolute value of this index is considered), and alpha (α). This reduction can be attributed to the activation of the sympathetic nervous system (Shaffer and Ginsberg, 2017). Additionally, Schaaff et al. (Schaaff and Adam, 2013) suggested that a higher level of arousal might cause a decrease in ultra-short-term HRV indices such as mean RR, SDNN, RMSDD, pNN50, SD1, SD2, and SD1/SD2 which potentially indicates increased sympathetic ANS activity and reduced parasympathetic modulation. Moreover, the reduced min RR and max RR in arousal activation were reported by Galland et al. (1998). In contrast, our study revealed that certain HRV indicators, such as ApEn, SampEn, and ACI showed increased values during arousal activation. Entropy indices indicate higher irregularity, and complexity which cause a more chaotic and adaptable heart rate pattern during arousal, potentially influenced by sympathetic activation. Although Valenza et al. (2012) examined the non-linear complexity in short time series during emotional visual elicitation. They found that the mean ApEn decreased during arousal which is not compatible with our finding. Further, Tanev et al. (2014) observed that ApEn, and SampEn, are increased, conversely, DFA α1 is decreased in arousal activation by various simulators. Due to the findings, ACI and fnQ emerged as the most effective HRV indices for detecting arousal in ultra-short-term HRV analysis. Consequently, ACI and fnQ can be considered robust indicators for identifying changes in HRV caused by arousal in real-time systems. While both ACI and fnQ demonstrate strong performance, there are some practical considerations to consider. Calculating fnQ is a complex process, which can cause computational challenges or additional time requirements. On the other hand, ACI requires a lower number of samples for evaluation, making it a more attractive option to detect arousal changes. The obtained observation here is compatible with several previous studies in which the ultra-short HRV measurement can be applied to arousal activity detection. As an example, two features that can be used in real-time processing for arousal detection were introduced by Goldie et al. (2010). These features are RRV3 values (the variance of the past 3 RR intervals) measured in milliseconds and RRV8-3 values (the variance of the past 8 RR intervals minus RRV3 values). Furthermore, Schaaff and Adam (Schaaff and Adam, 2013) demonstrated the suitability of HRV indices such as pNN12, pNN20, RMSSD, and SD1 for the evaluation of ultra-short windows (the 30s). Due to the study of Ferdinando et al. (2016), the achieved accuracy of arousal detection by using a short ECG signal was almost 60%. Also, Alexandratos et al. (2014) provided a mobile system with real-time arousal detection based on electrocardiogram (ECG), and electrodermal activity (EDA). According to their result, Small-scale user tests show 84% 10-fold, 83% between-subject, and 68% new-subject arousal detection accuracy. However, more studies in real-time data processing approaches are required to use this application in daily measurement instruments such as wearables.
5 Conclusion
The main aim of this study was to capture arousal activity by using ultra-short-term HRV analysis. As a result of the statistical analysis, all of the provided indices correctly recognized arousal from non-arousal status except min RR, SD1/SD2 ratio, ApEn, SampEn, and DFA α1. However, the best results among these characteristics were related to the novel indices; ACI and fnQ, which they can serve as reliable markers to find arousal changes in the human body. Consequently, arousal detection can effectively use ultra-short-term HRV studies. It is important to acknowledge one of the main limitations of this study which is the sample consists of participants associated with the university, which may not be representative of the broader population. The gender in our sample was not balanced (18 male and 13 female). The classification of participants as sedentary or moderately active may not capture the effects of physical activity for individuals with different activity levels. The short duration of the study limits understanding of long-term effects. The specific location potentially limits the applicability of findings to other populations. Therefore, more research is undoubtedly necessary to determine age- and sex-dependent values as well as to standardize acquisition protocols and analytical methods to obtain reliable and accurate results, allowing these methods to serve as an acceptable substitute for HRV parameters as the availability of wearable devices increases. In a future study, we aim to enhance the generalizability and validity of our findings to a broader population. As a result of this study, the proposed indices, ACI and fnQ have practical implications in different fields. In sleep medicine, they can improve the detection and monitoring of arousal states, aiding in the treatment of sleep disorders including sleep apnea. Some HRV indices such as SDNN, RMSDD, HF, LF/HF, and SampEn were found to be significantly (p-value<0.001) different during obstructive sleep apnea (Khandoker et al., 2011). Although, here one of the main challenges was that the use of spectral analysis in the ultra-short-term study might be limited due to the short duration of recorded signal and the reduced accuracy and reliability of frequency domain measurements, such as LF and HF bandwidths, which can make interpretation challenging. Moreover, these measures can be used to monitor stress levels. The results of (Salahuddin et al., 2007) suggest that ultra-short-term analysis of HRV and RR intervals within 10s, RMSDD and pNN50, LF/HF, normalized LF, and normalized HF within 50s can be practically used for monitoring mental stress in mobile settings. This indicates these indices can accurately assess stress levels in real-world situations, making them applicable for practical use in wearable devices. Overall, ACI and fnQ have the potential to optimize interventions, personalize treatments, and improve overall performance and wellbeing status in real-life scenarios. However, further studies are needed to validate the reproducibility and reliability of these parameters in ultra-short-term HRV analysis. Additionally, future research should focus on exploring the HRV in real-time assessments by using wearable devices in real-life monitoring and automatizing the classification of arousal. These advancements would contribute to a better understanding and wider applicability of these indices in practical settings. In contrast with a clinical (repeatable) environment, measures in an ambulatory setting (wearables) present more noise and artifact problems. Moreover, the measured signal usually does not use conventional ECG electrodes but other surrogate signals such as two dry metallic electrode ECGs (as in the Apple Watch) or PPG. Improved algorithms to better detect and identify errors that may occur during exercise and higher-intensity motion have been developed for wearable devices to increase accuracy, reduce motion artifacts, and better detect errors would be another aim of upcoming work. Moreover, the study of different levels of arousal are not considered in this study, thus it looks likely that future attempt might focus on developing subject-dependent classifiers that can distinguish between more than one level of arousal. Finally, robust classifiers that may even be suitable for usage in wearable technology can be built by combining the outcomes with HRV-based arousal recognition.
Data availability statement
The datasets presented in this study can be found in online repositories. The names of the repository/repositories and accession number(s) can be found below: https://osf.io/j98ey.
Ethics statement
The studies involving human participants were reviewed and approved by Ethics Committee on Animal and Human Experimentation (CEEAH) of the Universitat Autònoma de Barcelona protocol code CEEAH-5745. The patients/participants provided their written informed consent to participate in this study.
Author contributions
MM and MG-G: provided the study design. MM, MG-G, and MF-C: performed the data acquisition. MM and MF-C: contributed to the discussion. MM and MG-G: analyzed the data. MM: wrote the manuscript. MG-G and MF-C: critically revised the manuscript. All authors contributed to the article and approved the submitted version.
Funding
This work was supported by the Spanish Ministerio de Ciencia e Innovación, project number: PID2019- 107473RB-C2.
Conflict of interest
The authors declare that the research was conducted in the absence of any commercial or financial relationships that could be construed as a potential conflict of interest.
Publisher’s note
All claims expressed in this article are solely those of the authors and do not necessarily represent those of their affiliated organizations, or those of the publisher, the editors and the reviewers. Any product that may be evaluated in this article, or claim that may be made by its manufacturer, is not guaranteed or endorsed by the publisher.
References
Alexandratos, V., Bulut, M., and Jasinschi, R. (2014). Mobile real-time arousal detection. 2014 IEEE Int. Conf. Acoust. Speech Signal Process. (ICASSP), 4394–4398. doi:10.1109/ICASSP.2014.6854432
Athavale, Y., and Krishnan, S. (2017). Biosignal monitoring using wearables: observations and opportunities. Biomed. Signal Process. Control 38, 22–33. doi:10.1016/j.bspc.2017.03.011
Basner, M., Griefahn, B., Müller, U., Plath, G., and Samel, A. (2007). An ECG-based algorithm for the automatic identification of autonomic activations associated with cortical arousal. Sleep 30 (10), 1349–1361. doi:10.1093/sleep/30.10.1349
Berntson, G. G., Thomas Bigger, J., Eckberg, D. L., Grossman, P., Kaufmann, P. G., Malik, M., et al. (1997). Heart rate variability: origins methods, and interpretive caveats. Psychophysiology 34, 623–648. doi:10.1111/j.1469-8986.1997.tb02140.x
Castaldo, R., Montesinos, L., Melillo, P., James, C., and Pecchia, L. (2019). Ultra-short term HRV features as surrogates of short term HRV: A case study on mental stress detection in real life. BMC Med. Inf. Decis. Mak. 19 (1), 12–13. doi:10.1186/s12911-019-0742-y
Cortes, C., and Mohri, M. (2005). “Confidence intervals for the area under the ROC Curve,” in Advances in neural information processing systems.
Ferdinando, H., Seppanen, T., and Alasaarela, E. (2016). “Comparing features from ECG pattern and HRV analysis for emotion recognition system,” in CIBCB 2016 - annual IEEE international conference on computational intelligence in bioinformatics and computational biology, 2142. Preprint. doi:10.1109/CIBCB.2016.7758108
Frohlich, J., Morgan, M., Ogawa, S., Burton, L., and Pfaff, D. (2001). Statistical analysis of measures of arousal in ovariectomized female mice. Hormones Behav. 39 (1), 39–47. doi:10.1006/hbeh.2000.1632
Galland, B. C., Reeves, G., Taylor, B. J., and Bolton, D. P. G. (1998). Sleep position, autonomic function, and arousal. Archives Dis. Child. Fetal Neonatal Ed. 78 (3), 189–194. doi:10.1136/fn.78.3.F189
Garc a-Gonz lez, M. A., Ramos-Castro, J., and Fern ndez-Chimeno, M. (2003). A new index for the analysis of heart rate variability dynamics: characterization and application. Physiol. Meas. 24 (4), 819–832. doi:10.1088/0967-3334/24/4/301
García-González, M. A., Fernández-Chimeno, M., Capdevila, L., Parrado, E., and Ramos-Castro, J. (2013). An application of fractional differintegration to heart rate variability time series. Comput. Methods Programs Biomed. 111 (1), 33–40. doi:10.1016/j.cmpb.2013.02.009
Goldie, J., McGregor, C., and Murphy, B. (2010). “Determining levels of arousal using electrocardiography: a study of HRV during transcranial magnetic stimulation,” in 2010 annual international conference of the IEEE engineering in medicine and biology society (EMBC’10), Buenos Aires, Argentina, 1198–1201. doi:10.1109/IEMBS.2010.5625966
Heathers, J. A. J. (2014). Everything Hertz: methodological issues in short-term frequency-domain HRV. Front. Physiology 5 (5), 177. doi:10.3389/fphys.2014.00177
Khandoker, A. H., Karmakar, C. K., and Palaniswami, M. (2011). Comparison of pulse rate variability with heart rate variability during obstructive sleep apnea. Med. Eng. Phys. 33 (2), 204–209. doi:10.1016/j.medengphy.2010.09.020
Krey, M., Schlatter, U., Mahadevan, D. A., Derungs, K., and Oehler, J. K. (2020). Wearable technology in healthcare. J. Adv. Inf. Technol. 11 (3), 172–180. doi:10.12720/jait.11.3.172-180
McNames, J., and Aboy, M. (2006). Reliability and accuracy of heart rate variability metrics versus ECG segment duration. Med. Biol. Eng. Comput. 44 (9), 747–756. doi:10.1007/s11517-006-0097-2
Nabih-Ali, M., El-Dahshan, E.-S. A., and Yahia, A. S. (2017). Heart diseases diagnosis using intelligent algorithm based on PCG signal analysis. Circuits Syst. 08 (7), 184–190. doi:10.4236/cs.2017.87012
Pecchia, L., Castaldo, R., Montesinos, L., and Melillo, P. (2018). Are ultra-short heart rate variability features good surrogates of short-term ones? State-of-the-art review and recommendations. Healthc. Technol. Lett. 5 (3), 94–100. doi:10.1049/htl.2017.0090
Rajendra Acharya, U., Paul Joseph, K., Kannathal, N., Lim, C. M., and Suri, J. S. (2006). Heart rate variability: A review. Med. Biol. Eng. Comput. 44 (12), 1031–1051. doi:10.1007/s11517-006-0119-0
Robbins, T. W. (1997). Arousal systems and attentional processes. Biol. Psychol. 45 (1–3), 57–71. doi:10.1016/S0301-0511(96)05222-2
Salahuddin, L., Cho, J., Jeong, M. G., and Kim, D. (2007). Ultra short term analysis of heart rate variability for monitoring mental stress in mobile settings. Annu. Int. Conf. IEEE Eng. Med. Biol. Soc. IEEE Eng. Med. Biol. Soc. Annu. Int. Conf. 2007, 4656–4659. doi:10.1109/IEMBS.2007.4353378
Sandercock, G. R. H., Bromley, P. D., and Brodie, D. A. (2005). The reliability of short-term measurements of heart rate variability. Int. J. Cardiol. 103 (3), 238–247. doi:10.1016/j.ijcard.2004.09.013
Schaaff, K., and Adam, M. T. P. (2013). “Measuring emotional arousal for online applications: evaluation of ultra-short term heart rate variability measures,” in Proceedings - 2013 humaine association conference on affective computing and intelligent interaction, Geneva, Switzerland, ACII 2013, 362–368. doi:10.1109/ACII.2013.66
Shaffer, F., and Ginsberg, J. P. (2017). An overview of heart rate variability metrics and norms. Front. Public Health 5 (9), 258. doi:10.3389/fpubh.2017.00258
Shaffer, F., McCraty, R., and Zerr, C. L. (2014). A healthy heart is not a metronome: an integrative review of the heart’s anatomy and heart rate variability. Front. Psychol. 5 (9), 1040. doi:10.3389/fpsyg.2014.01040
Shaffer, F., Meehan, Z. M., and Zerr, C. L. (2020). A critical review of ultra-short-term heart rate variability norms research. Front. Neurosci. 14 (11), 594880. doi:10.3389/fnins.2020.594880
Tanev, G., Saadi, D. B., Hoppe, K., and Sorensen, H. B. (2014). Classification of acute stress using linear and non-linear heart rate variability analysis derived from sternal ECG. Annu. Int. Conf. IEEE Eng. Med. Biol. Soc. 2014, 3386–3389. doi:10.1109/EMBC.2014.6944349
Towers, J. D. (2009). Finite difference methods for approximating Heaviside functions. J. Comput. Phys. 228 (9), 3478–3489. doi:10.1016/j.jcp.2009.01.026
Valenza, G., Allegrini, P., Lanatà, A., and Scilingo, E. P. (2012). Dominant Lyapunov exponent and approximate entropy in heart rate variability during emotional visual elicitation. Front. Neuroengineering 5 (2), 1–7. doi:10.3389/fneng.2012.00003
Vaschillo, E. G., Vaschillo, B., and Lehrer, P. M. (2006). Characteristics of resonance in heart rate variability stimulated by biofeedback. Appl. Psychophysiol. Biofeedback 31 (2), 129–142. doi:10.1007/s10484-006-9009-3
Xhyheri, B., Manfrini, O., Mazzolini, M., Pizzi, C., and Bugiardini, R. (2012). Heart rate variability today. Prog. Cardiovasc. Dis. 55 (3), 321–331. doi:10.1016/j.pcad.2012.09.001
Keywords: heart rate variability (HRV), physiological and psychological changes, arousal state, ultra-short-term HRV analysis, Stroop test
Citation: Mohammadpoor Faskhodi M, Fernández-Chimeno M and García-González MA (2023) Arousal detection by using ultra-short-term heart rate variability (HRV) analysis. Front. Med. Eng. 1:1209252. doi: 10.3389/fmede.2023.1209252
Received: 24 May 2023; Accepted: 24 July 2023;
Published: 16 August 2023.
Edited by:
Rihui Li, Stanford University, United StatesReviewed by:
Dalin Yang, Washington University in St. Louis, United StatesJiuxing Liang, South China Normal University, China
Copyright © 2023 Mohammadpoor Faskhodi, Fernández-Chimeno and García-González. This is an open-access article distributed under the terms of the Creative Commons Attribution License (CC BY). The use, distribution or reproduction in other forums is permitted, provided the original author(s) and the copyright owner(s) are credited and that the original publication in this journal is cited, in accordance with accepted academic practice. No use, distribution or reproduction is permitted which does not comply with these terms.
*Correspondence: Mahtab Mohammadpoor Faskhodi, Mahtab.mohammadpoorfaskhodi@upc.edu