Deep learning-based denoising streamed from mobile phones improves speech-in-noise understanding for hearing aid users
 Peter Udo Diehl1,2*
  Hannes Zilly1
  Felix Sattler1 Yosef Singer1 Kevin Kepp1 Mark Berry1 Henning Hasemann1 Marlene Zippel3 Müge Kaya4 Paul Meyer-Rachner1
  Annett Pudszuhn2 Veit M. Hofmann2 Matthias Vormann4 Elias Sprengel1
- 1Audatic, Berlin, Germany
- 2Department of Otorhinolaryngology, Head and Neck Surgery, Campus Benjamin Franklin, Charité–Universitätsmedizin Berlin, Corporate Member of Freie Universität Berlin, Humboldt-Universität zu Berlin, and Berlin Institute of Health, Berlin, Germany
- 3Sonova AG, Stäfa, Switzerland
- 4Hörzentrum Oldenburg GmbH, Oldenburg, Germany
The hearing loss of almost half a billion people is commonly treated with hearing aids. However, current hearing aids often do not work well in real-world noisy environments. We present a deep learning based denoising system that runs in real time on iPhone 7 and Samsung Galaxy S10 (25 ms algorithmic latency). The denoised audio is streamed to the hearing aid, resulting in a total delay of around 65–75 ms, depending on the phone. In tests with hearing aid users having moderate to severe hearing loss, our denoising system improves audio across three tests: 1) listening for subjective audio ratings, 2) listening for objective speech intelligibility, and 3) live conversations in a noisy environment for subjective ratings. Subjective ratings increase by more than 40%, for both the listening test and the live conversation compared to a fitted hearing aid as a baseline. Speech reception thresholds, measuring speech understanding in noise, improve by 1.6 dB SRT. Ours is the first denoising system that is implemented on a mobile device, streamed directly to users’ hearing aids using only a single channel as audio input while improving user satisfaction on all tested aspects, including speech intelligibility. This includes overall preference of the denoised and streamed signal over the hearing aid, thereby accepting the higher latency for the significant improvement in speech understanding.
1 Introduction
Approximately 5% of the world population currently suffers from hearing loss, with associated side-effects ranging from social isolation, dementia, depression, cortical thinning and increased mortality (Fisher et al., 2014; Cunningham and Tucci, 2017; Ha et al., 2020). Hearing aids and cochlear implants have been shown to mitigate many of these negative effects. Nevertheless, a persistent complaint of hearing aid users is that current devices do not work well in noisy environments (Hartley et al., 2010; Hougaard and Ruf, 2011). One solution is to improve the speech intelligibility and subjective quality of the sound that is output to the user by employing denoising systems on the device. This has proven difficult to do effectively given the limited processing power available on these devices, and previous filterbank-based denoising systems on hearing aids have not been shown to offer improvements in speech intelligibility in noisy environments without depending on spatial knowledge of the scene (Boymans and Dreschler, 2000; Alcántara et al., 2003; Mueller et al., 2006; Zakis et al., 2009; Brons et al., 2014; Völker et al., 2015; Chong and Jenstad, 2018).
The rise of deep learning and especially its increased use in audio, e.g., for speech recognition and speech synthesis, offers a new approach to denoising audio. Deep-learning-based systems achieve state of the art denoising performance (Cao et al., 2022; Tzinis et al., 2022), with some systems offering large improvements in intelligibility, while only using a single channel of audio (i.e., without the need for spatial information) (Goehring et al., 2016; Zhao et al., 2018; Healy et al., 2021; Diehl et al., 2022a). The next step is to downscale these systems, which typically have large computational requirements and can only be used offline, so that they can be used in real-time on mobile and portable systems, such as smartphones and hearing aids. Since deep learning systems scale well with number of parameters and therefore in computing power (Tay et al., 2022), this reduction in size typically causes a reduction in the systems’ output quality. Ultimately, hearing aids should be able to provide the computational resources to house powerful denoising systems themselves but currently, mobile phones’ advanced processors give them an edge in how computationally expensive, and therefore how good, their denoising systems can be.
However, until now, even with the more powerful mobile phones, no improvements in speech intelligibility on such platforms have been published and it has been unclear when the computational power of the hardware will be sufficient for the deep learning system to contribute meaningfully to speech understanding. Specifically, so far no studies using denoising based on single-channel deep learning models on compact mobile systems (phones or hearing aids) have shown any speech intelligibility improvements, although a few studies have shown improvement in offline computational metrics (Panahi et al., 2016; Hansen et al., 2019; Baby et al., 2021). The largest improvements in speech intelligibility that have been shown on mobile systems are around 0.5 dB SRT (Asger Heidemann et al., 2021) but require multi-channel input.
In this study, we present a deep learning based single channel denoising system, which retrieves clean speech from a noisy mixed signal. The entire system runs on older-generation commercially available smartphones, which stream the resulting (cleaned) audio to a hearing aid or cochlear implant. The system improves speech intelligibility and overall audio quality without using spatial information. We test the system with hearing aid users across three different tests, including 1) rating the subjective denoising quality (overall, noise, intelligibility, speech quality), 2) objective speech intelligibility, and 3) comparing the phone-based denoising to a hearing aid only in a live setup where the subjects have a conversation with the experimenter. In all three tests, our denoising system achieves significant improvements over the baseline (where only the hearing aid, but no denoising system is used) in overall impression and in speech intelligibility.
2 Materials and methods
2.1 Denoising system
The presented denoising system was implemented on an iPhone 7, utilizing only a single processor core, and on a Samsung Galaxy S10. Our denoising system is identical on both phones; we chose two different phone manufacturers to ensure that despite the differences in the respective microphones and audio processing paths, both are compatible with our denoising system.
From an input short time Fourier transform (Hann window with 25 ms length, 6 ms hop size, and 22 kHz sampling rate) of mixed speech and noise, the network is trained to predict the complex ideal ratio mask (Wang and Chen, 2018). The input samples are single-channel mixtures of speech (e.g., Librispeech, Panayotov et al., 2015) and noise drawn from multiple publicly available databases with ca. 10,000 h of audio (e.g., Gemmeke et al., 2017; Afouras et al., 2018; Wang et al., 2021); target samples are the speech samples without any noise added.
We use a closed-loop evolutionary search that optimizes the network parameters and its structure via a custom speech quality metric in combination with the measured execution time of the network on an iPhone 7 (Figure 1). The speech metric (predicted mean opinion score, pMOS in Figure 1) predicts mean opinion scores (MOS) and the improvement in predicted MOS scores is used for optimization. We target MOS scores rather than Signal to Noise Ratio (SNR) or other conventional objective speech quality metrics such Perceptual Evaluation of Speech Quality (PESQ) or Signal to Distortion Ratio (SDR) because MOS has been shown to correlate much more strongly with human speech quality ratings (Reddy et al., 2021; Diehl et al., 2022b). The speech metric is publicly available at https://metric.audatic.ai/(Diehl et al., 2022b). The closed-loop evolutionary search allows the co-optimization of denoising performance together with the limited resources on the mobile device. We limit the maximum execution time to 25 ms, while searching for the model with the best possible denoising performance. This upper bound was chosen because preliminary tests had shown processing delays above 25 ms were noticeable, but acceptable to internal testers. Latency limitations have strong effects on denoising performance, since higher latencies allow more computation to be done and the possibility to provide more temporal context for the neural networks. See section 2.3 for a detailed breakdown of the total end-to-end latency.
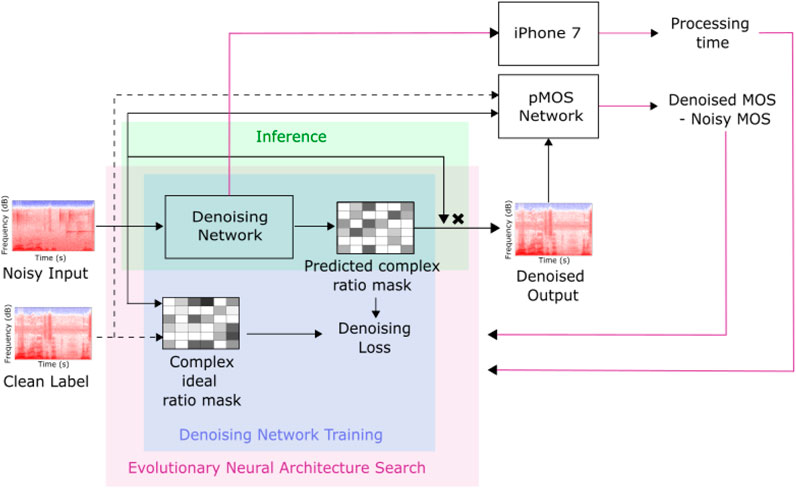
FIGURE 1. Training pipeline of the denoising system, based on a mean opinion score (MOS)-estimator-guided neural architecture search. The denoising network predicts denoised outputs, given mixed speech and noise input STFTs. Network parameters, such as number of layers or type of filters, are optimized by an evolutionary neural architecture search. This search minimizes the remaining errors for human acoustic perception by using a MOS estimator, which is a deep neural network trained on a dataset generated from over 1,000,000 human rated audio files.
The basic network architecture is inspired by the U-Net (Ronneberger et al., 2015), with parameters such as layer type (convolutional, Long-Short Term Memory (LSTM), Gated Recurrent Units (GRU), Convolutional Recurrent Network (CRNN) etc.), possible skip connection locations, temporal and spectral down- and up-sampling, number of layers, as well as their size left unspecified to be then optimized by the evolutionary search. Note that the Conv-TasNet (Luo and Mesgarani, 2019) is a model that operates directly on the waveform using dilated temporal convolutions to perform speaker separation, where the number of target speakers is known in advance. For speech enhancement, where the number and identity of speakers are not known in advance, U-Net style networks (such as the one we use in this study) that operate directly on the waveform or on the STFT are more commonly used and have been shown to perform well on several benchmarks (Defossez et al., 2020; Zhao et al., 2021; Diehl et al., 2022a; Liu et al., 2023). The resulting best performing network architecture is then retrained using Population Based Training (PBT) (Jaderberg et al., 2017), which jointly optimizes the network weights and hyperparameters such as the learning rate. To further reduce the computational footprint of the network and to prevent thermal throttling during continuous execution on the phone, we apply structured magnitude pruning. More specifically, we iteratively prune a small fraction of low-magnitude output channels in each layer, starting in the final layers of the network and progressing to the input layers. The pruning focused on reducing output channels of convolutional layers in contrast to encouraging low-magnitude weights and high sparsity. Thus, we slightly decreased the number of weights (∼3%) but targeted mainly a reduction in multiply-accumulate operations, which correlate stronger with execution time. We then fine-tune the network weights through additional training between each pruning operation in order to recover lost performance. This iterative pruning procedure (Li et al., 2017) is repeated several times. The final model is again fine-tuned using PBT. With this procedure we achieve a reduction in MAC (multiply-accumulate) operations of 22% from the original model chosen through the neural architecture search with 37.9ms–29.5 ms while only suffering a minor degradation in speech quality performance. Aside from pruning we also experimented with matrix and tensor decomposition techniques (Lebedev et al., 2015; Kim et al., 2016; Kuchaiev and Ginsburg, 2018) which resulted in a similar reduction in the number of model parameters. However, the resulting factorized architectures, where large layers are replaced with a series of smaller layers, did not lead to reduced execution time on the phone hardware.
The amount of filtering performed by the denoising system can be set by the user from 0% to 100% in increments of 1% (101 steps). This value is referred to as the “mixing ratio”. The mixing ratio linearly interpolates between the original input signal and the denoised audio generated by the denoising system. Therefore, a mixing value of 0% passes the unchanged input signal to the streamer, while a mixing value of 100% only passes the denoised audio without mixing any of the original noisy input signal back into the output. Mixing allows the subject to reintroduce environmental clues, reduce effects of isolation and increase environmental awareness and can improve perceived sound quality compared to using the fully denoised signal. No additional postprocessing is applied on the audio.
2.2 Subjects and inclusion criteria
The experimental protocols employed were approved by the ethics committee (“Kommission für Forschungsfolgenabschätzung und Ethik”) of the University of Oldenburg, Oldenburg, Germany and concur with the Helsinki Declaration. All subjects gave their informed consent, were selected from the Hörzentrum Oldenburg subject database, and were paid an expense reimbursement of 12€ per hour. Their participation was voluntary.
In total, 26 German speaking hearing impaired subjects (19 male, 7 female) aged between 46 and 85 (median 75) and an average hearing loss of 65 dB HL at 1 kHz (Figure 2) participated. All participants had been using hearing aids for at least 3 years prior to their participation in the study. Additionally, three pilot-subjects were included before the actual study to ensure feasibility of the tests and procedures. Inclusion criteria for all participants were: 1) to be at least 18 years old, 2) to have moderate to severe sensorineural hearing loss (in the range of hearing profiles between N4 and N6 (Bisgaard et al., 2010)) to be experienced hearing aid users (>3 years experience). Exclusion criteria were 1) suspected dementia, indicated by DemTect (Kalbe et al., 2004) values of 8 and below, since this will likely influence performance on the tasks.
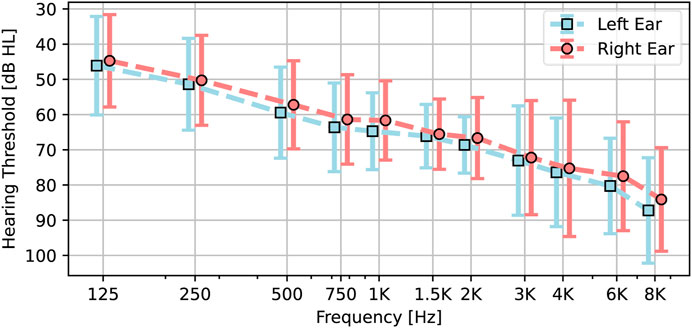
FIGURE 2. Mean audiogram of the subjects. Bars show the standard deviation for each frequency. The Phonak Marvel 90 hearing aids were bilaterally fitted to the measured audiogram of each subject.
2.3 Experimental setup
We tested our system with three different procedures (see Figure 3A)) subjective ratings of a variety of sound scenes, done with offline processing on a PC, enabling a double-blind setting, B) single-blind speech intelligibility tests, with live processing (performed only on the Android phone), C) live conversations with the experimenter, with live processing (performed on both Android and Apple phones). The experiments were conducted over a timespan of 3 days. Before measurements, all subjects were fitted with hearing aids (Phonak Marvel 90, the top-of-the line hearing aid of the largest hearing aid manufacturer) and customized earmolds (Phonak SlimTip). The earmolds are sealing the ear canal similar to a closed or power dome, which limits the amount of direct sound coming in.
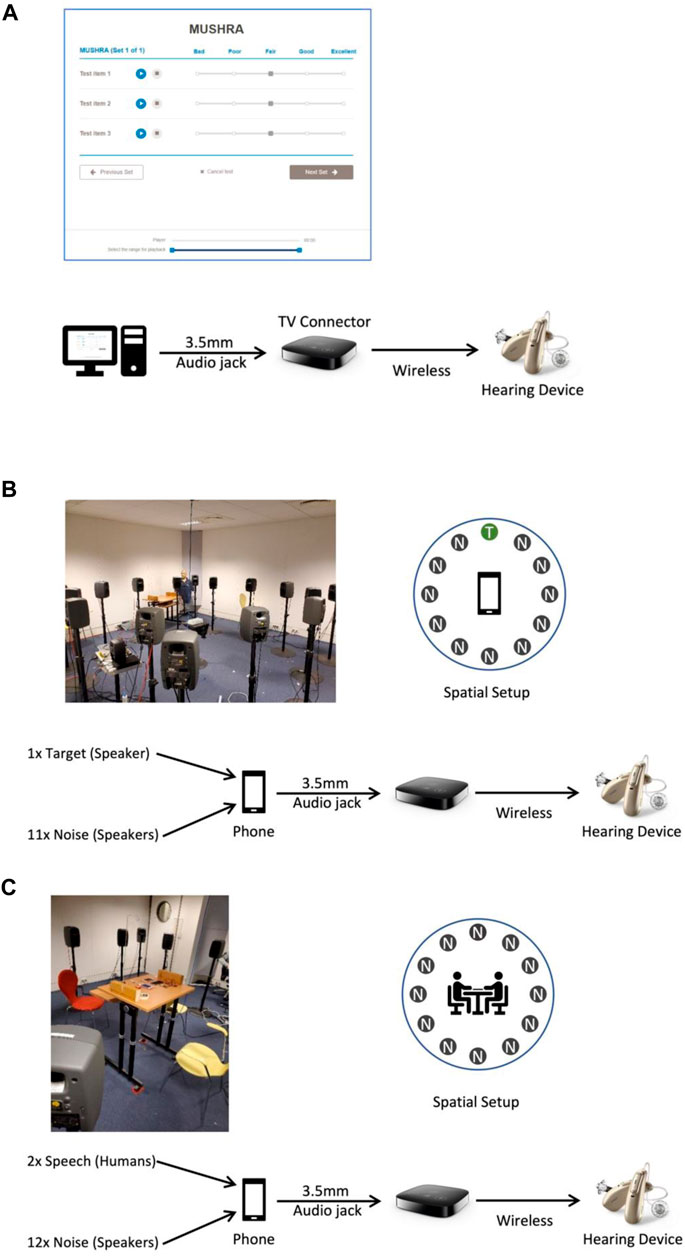
FIGURE 3. Testing setups for the 26 hearing-aid user subjects. (A) Computer-based subjective listening test (MUSHRA). Ratings of presented audio samples are collected across the categories overall, noise, sound quality, and intelligibility. (B) Objective intelligibility is tested using the OLSA. 12 loudspeakers are arranged in a circle with the target loudspeaker presented away from the phone microphone and all 11 other loudspeakers playing noise. (C) Live conversations are also held with 12 surrounding loudspeakers, all of which are playing noise. The phone is placed in the middle of the table. In all three setups the audio that was denoised with our system is transmitted to a TV connector which then transmits wirelessly to the hearing aid.
In the live tests B and C, the audio signals are recorded with the smartphone microphone, then using the smart phones audio stack, transferred to the CPU, where they are processed by the denoising system. In test A, the signals were pre-processed on a PC using the same denoising system as for tests B and C, since all sound samples were known before the test and thereby they can be processed identically. The resulting denoised signal is sent from the output device (computer in the sound sample rating, and phone in speech intelligibility and live conversation) to a “streamer”, the Phonak TV Connector. Streamers are available as an accessory for modern hearing aid systems produced by all large manufacturers and relay a signal from a source to a hearing aid wirelessly. The hearing aid applies no additional sound processing on relayed signals. The streamer uses a proprietary transmission protocol, with a latency of approximately 20 ms. In tests live-processing settings, the total audio delay of the pipeline from signal recording to arrival at the listeners ear via the hearing aid is 65–75 ms (ca. 10 ms on iPhone 7; 20 ms on Samsung Galaxy S10), streamer (ca. 10 ms), wireless link (ca. 20 ms), processing 25 ms, which is noticeable for most listeners in form of a slight echo. However, this should not impact lip reading, which typically requires latencies of 100 ms or more to create an audio-visual disconnect. Therefore, the advantage of the speech denoising must outweigh the disadvantage of a noticeable latency to achieve positive overall ratings.
2.4 Subjective ratings using MUSHRA
To assess the subjective improvement using our denoising system in an offline setting, we use a version of Multi-Stimulus test with Hidden Reference and Anchor (MUSHRA) (ITU-R BS.1534-3 Recommendation) without repeating the reference sound. Specifically, an unprocessed sound (“reference signal”) is presented, along with two processed versions of the same signal with different mixing ratios. The subject rates each sample, while being able to switch back and forth between them without interrupting the signal.
During the measurements, participants are seated in front of a computer and asked to rate the samples. The output of the PC is transferred via digital-analog conversion (RME Fireface UC) directly to the streamer which relays it to the hearing aid (Figure 3A). At the beginning, the presentation volume of the MUSHRA test is set to a subjectively comfortable volume for the subject, such that the subject is able to perceive both speech and background noise clearly in all scenes without being affected by too loud noise or too quiet speech components. Ratings are evaluated on a scale from 0 to 100 (101 steps) in the following four categories: 1) Speech Intelligibility, 2) Sound quality of the speech, 3) Background noise, 4) Overall impression.
The sound samples used in this offline test were recorded with an iPhone 7 and then processed by the same denoising system that is implemented on the phones. This ensures a double-blind comparison without adjusting the mixing ratio, neither by the experimenter nor by the subjects. For each sound sample, the unprocessed sample is presented together with the denoised sound at two mixing ratios: 80% and individual preference. The individual mixing ratio was chosen by the subjects during an automated procedure (similar to a binary search) that determines the preferred ratio for each subject with a step size of 5%. The individual mixing ratio is kept constant throughout the experiment. Six different acoustic scenes/sound samples with different signal-to-noise ratios (SNR in the range of approximately −6.6 to 5 dB) were tested: 1) Busy restaurant (low SNR) with a single speaker; 2) Bistro (moderate SNR) with a single speaker; 3) Bistro (moderate SNR) with multiple speakers in the same conversation; 4) Lounge/bar with background music (moderate to high SNR) with a single speaker; 5) Street scene with a single speaker; 6) Street scene with multiple speakers in the same conversation. This results in a total of 24 sound samples (18 processed by the denoising system and 6 unprocessed). The six scenes are presented in random order, for each of the four rating categories, which have a fixed order (Speech Intelligibility, Sound quality of the speech, Background noise, and then Overall impression).
2.5 Measuring objective speech intelligibility using the oldenburg sentence test (OLSA)
For objective measurement of speech intelligibility in noise, the Oldenburg Sentence Test (OLSA) was used (Wagener et al., 1999; Wagener et al., 1999). Participants repeat as many words as possible from a 5-word sentence presented to them in the presence of background noise. During the experiment, the noise level remains constant whereas the speech level is adaptively adjusted in a two-up/one-down procedure such that the subject is able to understand approximately 70% of the words.
The final SNR of the speech compared to the noise is referred to as the Speech Reception Threshold (SRT). To reduce training effects during measurements, two lists of sentences (20 sentences each) are presented before the actual test. One of the two training lists is presented with a mixing ratio of 0%, the other with 80% with order balanced across participants. The loudness of the streamer is calibrated during the first list, such that the noise is clearly perceptible, but the overall presentation is not perceived as uncomfortably loud. Subsequent measurements are completed with this setting. Here, the noise consisted of many-talker babble noise, recorded in a crowded cafeteria, with an overall level of 65 dBA.
For the OLSA measurements, the system runs on a Samsung Galaxy S10 smartphone (Android), which sends the processed signals to the streamer, that forwards the signals to the hearing aids of the subject, who sits in an adjacent room (Figure 3B). The noise is played from 12 loudspeakers that are identically spaced around the smartphone on which the denoising system is running. The loudspeaker in front of the phone, i.e., opposite of the smartphone’s microphone, plays the OLSA sentences. To activate the streamer, a sentence is played that announces the beginning of the listening test.
Tests are performed in four different mixing ratios: 0%, 50%, 80%, and individual preference. The individual mixing ratio for this test is determined by playing OLSA sentences in noise and asking the subject to determine their favorite setting. The measurements are conducted in a balanced order (latin square design) of mixing ratios. A break of at least 10 min is taken following the initial procedure.
2.6 Live conversation subjective ratings
The goal of the live conversation setup is to simulate a typical situation at a busy cafeteria and compare the subjects’ satisfaction using the hearing aid and using the denoising system (which includes the latency caused by the wireless link). To this end, noise is presented from 12 equally spaced loudspeakers, centered around a table where the subject and the experimenter sit, facing each other at a distance of about 1.25 ms (Figure 3C). The phone is placed on the table at equal distance to subject and experimenter. The 12 loudspeakers play a bistro scene at a total level of 68 dBA, that is comprised of noises like babbling noise, water faucets, and sounds of clearing plates. Due to hygiene concerns related to the COVID pandemic, a shield was placed between the subject and experimenter with a window at the bottom (similar to shields used at cashiers). During the conversation, the experimenter tried to maintain an equal duration of speaking himself and letting the subject speak to also allow them to judge the sound of their own voice.
The live conversation starts off with normal usage of the hearing aid without streaming (contrary to MUSHRA and OLSA). After 5–10 min of conversation, the streamer and denoising system are activated with the mixing ratio set to 0% (no processing) so the subject can calibrate the loudness such that it matches the hearing aid. This adjustment is done for both smartphones and maintained for all subsequent measurements. The experimenter and the subject conduct a dialogue for at least 5 min and then rate each of the following four categories: overall preference, own voice, experimenter’s voice, and noise reduction. The subject selects ratings on a scale from 1 to 100 using an app on a tablet (Figure 3C, bottom). Finally, the subjects’ task is to compare the subjective quality of the hearing aid vs. denoising on the iPhone 7 vs. denoising on the Samsung Galaxy S10. Both denoising implementations on both phones work identically and are set to a mixing ratio of 80% but use the respective audio processing stack of the phones (i.e., the operating system dependent pre- and post-processing of the audio, since there is no direct access to the raw audio without going through the operating systems audio framework). The hearing aids used the speech in noise program (default setting).
3 Results
We first tested the subjective impact of our denoising system (Figure 4). The ratings from the MUSHRA test show a strong improvement for the overall and noise categories when using our denoising system, with 42.3 points and 54.7 points of mean improvement respectively, on a 1 to 100 scale, using individual mixing ratios. Subjects are presented the 1 to 100 scale in words to express how much they like a sample (German: “Gefällt mir”) with 5 anchors: 100–very good (“sehr gut”), 75 - good (“gut”), 50 - neutral (“weder noch”), 25 - dislike (“nicht”), 0 - strongly dislike (“gar nicht”). There is also an improvement of 21.5 points in perceived sound quality with our denoising system (for the individual mixing ratio setting). The perceived intelligibility also improved by 37.6 points using the individual mixing ratio. The individual mixing ratio of the MUSHRA (mean 81.15% processed, median 100%, range from 0% to 100%, STD of 27.6%) is kept the same over the four different rating categories. The improvement in overall rating due to our denoising is independent of the users’ hearing loss as measured by PTA Combined (r = −0.02 for individual mixing ratio, r = −0.003 for 80% mixing ratio). Improvements in subjective experience of our denoising sysyem over the reference are highly significant, as measured by a paired Wilcoxon signed rank test (p < 0.0001 in all categories).
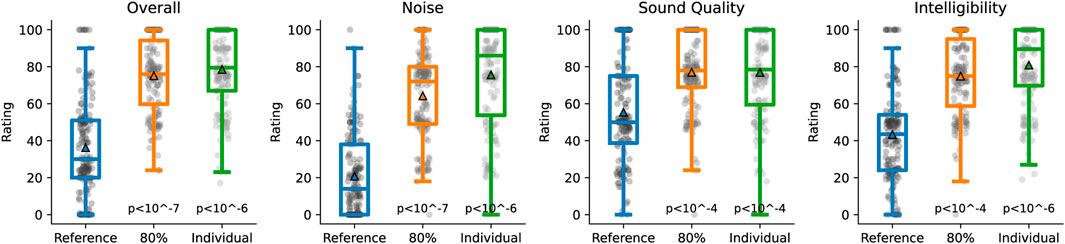
FIGURE 4. MUSHRA results of hearing-impaired subjects comparing the reference signal to the deep learning processed signal with self-adjusted mixing ratio (mean mixing ratio is 81.15%, n=26). Subjective ratings on the categories overall, noise, sound quality, and intelligibility. Bars indicate 75, 50, and 25 percentiles. Triangles represent the mean. p-values are according to paired Wilcoxon signed rank test.
Another key aspect of hearing aids is their ability to provide the user with an objectively measurable increase in speech understanding. We test for this using the OLSA speech in noise intelligibility test (Figure 5). For the OLSA, the mean individual mixing ratio was 71.25% with a standard deviation between subjects of 20.27%. The reduction of the mixing ratio compared to the MUSHRA test is likely because the OLSA operates at lower SNRs (up to -8 dB) compared to the MUSHRA, which we performed in the range of −5 to 5 dB SNR. At such low SNRs, the denoising system produces more artifacts than at higher SNRs. Without any denoising, the average SRT for the 26 subjects is at −4.3 dB (std. 1.69 dB) SRT (Figure 5A). When using our denoising system, this improved to −5.45 (std. 1.39 dB) SRT, −5.51 (std. 1.22 dB) SRT, and −5.53 (std. 1.29 dB) SRT with mixing ratios of 50%, 80%, and individual preference, respectively. The resulting increases in SRTs are 1.14 (std 0.9 dB) SRT, 1.20 (std. 1.08 dB) SRT, and 1.22 (std. 0.83 dB) SRT (Figure 5B). These increases in SRT are highly significant (p < 0.0001) according to a paired Wilcoxon signed rank test. When visiting the hearing care professional who fits the hearing aid, it is possible to choose the most beneficial setting for each hearing aid user. Similarly, when choosing the best mixing ratio for each subject (excluding a mixing ratio of 0%, since none of the results were optimal without using our denoising), it improves to a mean of −5.95 (std. 1.17 dB SRT), thereby enabling the subjects to maintain their speech understanding at a 1.64 dB lower speech level than without denoising (Figure 5B). Furthermore, choosing the best mixing ratio, the system always increases the SRT without any negative SRT changes among the 26 subjects. Additionally, we observe a correlation between initial SRT and SRT improvement with our denoising system of r=0.62 (Figure 5C). This indicates that subjects with more severe hearing loss (as measured by the unprocessed SRT), benefited more strongly from our denoising system.
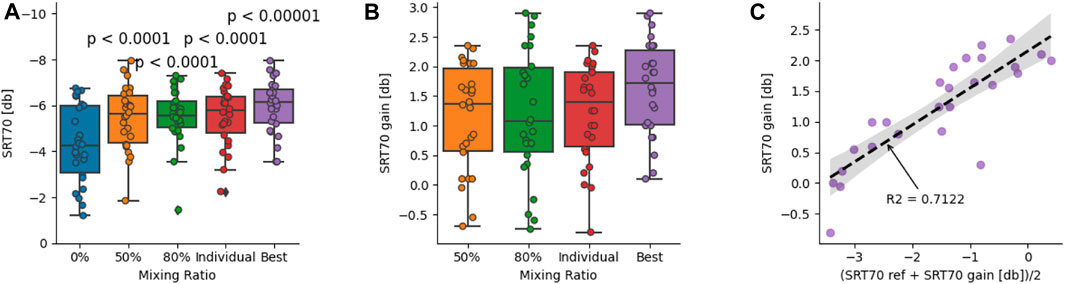
FIGURE 5. Reducing speech reception thresholds (SRT) on the Oldenburg Sentence Test using our denoising system for hearing impaired (n=26) subjects at 70% speech intelligibility (SRT70). (A) Distribution of SRT70 for different mixing ratios (0%, 50%, 80%, ind.). p-values are based on the t-test between 0% mixing ratio and the displayed mixing ratios. (B) Improvements over 0% mixing ratio for all other mixing ratios. (C) Relationship between SRT gains in the best mixing ratio setting (besides 0%) and baseline SRTs without denoising (0% mixing), adjusted to avoid spurious correlations. p-values are according to paired Wilcoxon signed rank test.
The denoising system or similar versions are intended to be used in real-life scenarios and as such, tests in front of the computer or via pre-recorded and standardized sentences do not fully reflect how these systems perform in the real world. To bridge the gap between a laboratory setting and a real-life scenario, we performed a live conversation experiment where we asked the participants for their subjective preference between a standard hearing aid and our denoising systems on the two phones (Figure 6). The implementations of our denoising system on the two phones did not differ algorithmically and showed similar improvements of 38/43 points better on average for the overall category than the hearing aid on a 1–100 scale (Figure 6), for the iPhone 7 (“iOS”) and the Samsung Galaxy S10 (“Android”), respectively (statistically significant at p < 0.0001 according to paired Wilcoxon signed rank test).
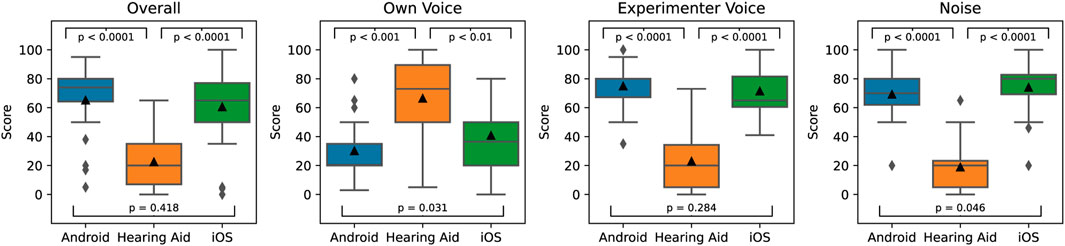
FIGURE 6. Live conversation ratings for hearing impaired subjects (n=26) comparing our denoising system on an iPhone 7 (iOS), a Samsung Galaxy S10 (Android), and a fitted hearing aid. Responses for overall ratings are asked first, own voice, experimenter voice and noise are asked in that order afterwards. p-values are according to paired Wilcoxon signed rank test.
The overall impression of the system includes multiple factors. We therefore also asked subjects for their ratings in three other categories: own voice, experimenter voice, and noise (Figure 6). While the experimenters voice and noise ratings are in line with the overall ratings, the own voice ratings are significantly worse than the hearing aid when using the phone-based denoising system. This is likely because of the ca. 65 ms (iPhone) resp. Ca. 75 ms (Samsung) delay caused by the wireless link and audio processing stack on the phone. It is well known that own voice perception is strongly impacted by latency, which is audible for most people in the form of a slight echo but should not impair audio and visual lip-synchronization, which typically occurs at 100 ms or more. Participants preferred the iPhone setup (median rating of 36.5) over the Samsung setup (median rating of 20.5) for the own voice category, likely due to the 10 ms lower latency. The difference in distribution is statistically significant at p < 0.05. Note that in the “Overall” category the distributions of scores are not significantly different between Samsung and iPhone (p-value of 0.418), implying that the additional 10 ms difference in delay seem to have a relatively minor effect on overall perception. When we asked subjects for the reasons of their low own-voice ratings many reported an “echo” in their voice. Given that the scene was chosen to be a challenging acoustic environment with the experimenters intentionally maintaining a normal conversational speech-level without raising their voice, subjects still showed a strong overall preference for the denoising model despite the delay and poor own-voice perception because they could better understand the experimenter. We do not expect this preference to be maintained in situations with little-to-no background noise.
4 Discussion
We tested a deep-learning based denoising system, implemented on two different phone platforms, with 26 hearing aid users in three different test setups. In the MUSHRA test, overall impression ratings increased by 42 points (on a 0 to 100 scale); in the OLSA test the speech reception threshold improved by 1.6 dB; and in the live conversation, overall impression compared to a hearing aid improved by 54.7 points (on a 0 to 100 scale). Using this comprehensive test suite, we are the first to show improvements across all tests (and especially speech intelligibility), using a single-channel denoising system.
In the MUSHRA test, noise ratings improved the most, likely driving the strong improvement in the overall rating category. The OLSA test showed that our system provides higher intelligibility improvement for individuals with worse baseline intelligibility. Additionally, the variance of the intelligibility is reduced when choosing a mixing ratio of at least 80%. This is mostly achieved by improving the worst speech intelligibility results, while moderately increasing the rest. The OLSA test also revealed that it might be useful to adjust the mixing ratio in a real-world environment depending on the estimated SNR. Lower mixing ratios (e.g., the 73% average individual mixing ratio preferred by the subjects in the OLSA test) might lead to better intelligibility in extreme situations (−5 dB to −10 dB) and higher mixing ratios (80%+ preferred by the users in the MUSHRA test) improve the noise reduction and comfort. Finally, the live conversation experiment shows that the system is preferred over existing top-of-the line hearing aids in the given high-noise situations. This is despite the noticeable latency, which was commented on by the subjects. However, the improvements in understanding in noise outweigh the disadvantage of the higher latency on average for the subjects. Note that in this study, custom ear-molds were used, which are preferred for medium to severe hearing loss to be able to achieve the required amplification of the sound. Those ear-molds also reduce the loudness of the environment, which presumably leads to a slightly higher acceptance of latency, since the first part of the echo (the original sound) is less audible.
Nevertheless, latency remains an issue, which is most apparent in own-voice ratings, where latency is more noticeable, since it impacts the hearing aid wearers perception of own speech. Latency could further be improved in two ways: One option would be to use more recent generations of smartphones with dedicated AI accelerators and faster communication protocols, such as aptX by Qualcomm or Apple’s Made for iPhone audio processing stack. These would allow for a significant reduction in both algorithmic and communication latency. The fastest existing communication protocols typically add around 20 ms latency to the system, in addition to (at least) 10 ms latency caused by the audio processing stack of the phone. Thus, a total latency of around 40 ms could be achieved using this approach. Reducing latency beyond this would require a direct implementation of the system on the hearing aid. We intentionally implemented our system on the CPU of two older-generation phones to be as close as possible to such an implementation and test how the denoising system performs under severe limits of power consumption. A hearing aid implementation could reduce latency down to the algorithmic latency and have other benefits like potential integration with spatial algorithms. However, due to the limited battery capacity of hearing devices, such an implementation would likely require dedicated optimization of energy efficiency. This could be achieved using techniques proposed, e.g., in (Speckhard et al., 2023) or by activating the DNN only in the most challenging situations.
In summary, the presented system already improves upon current hearing aids in high-noise situations and benefits the user across multiple dimensions that include objective intelligibility and subjective preference. The biggest current shortcoming of the proposed system is the latency caused by using a wireless connection via the streaming device (TV Connector). However, despite the noticeable levels of latency and the obvious need for improvement, in highly noisy environments the presented solution is still clearly preferred and leads to better speech understanding compared to using the existing hearing aids.
Data availability statement
The datasets presented in this study can be found in online repositories. The names of the repository/repositories and accession number(s) can be found below: https://metric.audatic.ai/.
Ethics statement
The studies involving humans were approved by ethics committee (“Kommission für Forschungsfolgenabschätzung und Ethik”) of the University of Oldenburg, Oldenburg, Germany. The studies were conducted in accordance with the local legislation and institutional requirements. The participants provided their written informed consent to participate in this study.
Author contributions
PD: Conceptualization, Investigation, Methodology, Project administration, Resources, Supervision, Writing–original draft, Writing–review and editing. HZ: Data curation, Formal Analysis, Investigation, Software, Supervision, Visualization, Writing–original draft, Writing–review and editing. FS: Data curation, Investigation, Methodology, Software, Visualization, Writing–original draft, Writing–review and editing. YS: Formal Analysis, Software, Visualization, Writing–original draft, Writing–review and editing. KK: Formal Analysis, Investigation, Software, Writing–review and editing. MB: Formal Analysis, Investigation, Methodology, Software, Supervision, Writing–review and editing. HH: Investigation, Methodology, Software, Supervision, Writing–review and editing. MZ: Data curation, Formal Analysis, Investigation, Methodology, Project administration, Resources, Validation, Writing–review and editing. MK: Data curation, Investigation, Methodology, Resources, Writing–review and editing. PM-R: Data curation, Formal Analysis, Methodology, Software, Supervision, Visualization, Writing–original draft, Writing–review and editing. AP: Conceptualization, Methodology, Writing–review and editing. VH: Conceptualization, Methodology, Writing–review and editing. MV: Data curation, Formal Analysis, Investigation, Methodology, Writing–original draft, Writing–review and editing. ES: Conceptualization, Methodology, Project administration, Software, Supervision, Writing–review and editing.
Funding
The author(s) declare that no financial support was received for the research, authorship, and/or publication of this article.
Acknowledgments
We thank Matthias Latzel, Volker Kühnel, Hannes Wüthrich, and Sascha Liebe for fruitful discussions during the conception and development phase and helpful ongoing exchanges about the project.
Conflict of interest
Authors UD, HZ, FS, YS, KK, MB, HH, PM-R, and, ES were employed by audatic GmbH. Author MZ are employed by Sonova AG. Authors MK, and MV were employed by Hörzentrum Oldenburg GmbH.
The remaining authors declare that the research was conducted in the absence of any commercial or financial relationships that could be construed as a potential conflict of interest.
Publisher’s note
All claims expressed in this article are solely those of the authors and do not necessarily represent those of their affiliated organizations, or those of the publisher, the editors and the reviewers. Any product that may be evaluated in this article, or claim that may be made by its manufacturer, is not guaranteed or endorsed by the publisher.
References
Afouras, T., Chung, J. S., and Zisserman, A. (2018). LRS3-TED: a large-scale dataset for visual speech recognition. Available at: http://arxiv.org/abs/1809.00496 (Accessed March 20, 2023).
Alcántara, J. I., Moore, B. C. J., Kühnel, V., and Launer, S. (2003). Evaluation of the noise reduction system in a commercial digital hearing aid: evaluación del sistema de reducción de ruido en un auxiliar auditivo digital comercial. Int. J. Audiology 42, 34–42. doi:10.3109/14992020309056083
Andersen, A. H., Santurette, S., Pedersen, M. S., Alickovic, E., Fiedler, L., Jensen, J., et al. (2021). Creating clarity in noisy environments by using deep learning in hearing aids. Seminars Hear. 42, 260–281. doi:10.1055/s-0041-1735134
Baby, D., Van Den Broucke, A., and Verhulst, S. (2021). A convolutional neural-network model of human cochlear mechanics and filter tuning for real-time applications. Nat. Mach. Intell. 3, 134–143. doi:10.1038/s42256-020-00286-8
Bisgaard, N., Vlaming, M. S. M. G., and Dahlquist, M. (2010). Standard audiograms for the IEC 60118-15 measurement procedure. Trends Amplif. 14, 113–120. doi:10.1177/1084713810379609
Boymans, M., and Dreschler, W. A. (2000). Field Trials Using a Digital Hearing Aid with Active Noise Reduction and Dual-Microphone Directionality: estudios de campo utilizando un audifono digital con reduccion activa del ruido y micrófono de direccionalidad dual. Int. J. Audiology 39, 260–268. doi:10.3109/00206090009073090
Brons, I., Houben, R., and Dreschler, W. A. (2014). Effects of noise reduction on speech intelligibility, perceived listening effort, and personal preference in hearing-impaired listeners. Trends Hear. 18, 233121651455392. doi:10.1177/2331216514553924
Cao, R., Abdulatif, S., and Yang, B. (2022). CMGAN: conformer-based metric gan for speech enhancement. Available at: http://arxiv.org/abs/2203.15149 (Accessed August 5, 2022).
Chong, F. Y., and Jenstad, L. M. (2018). A critical review of hearing-aid single-microphone noise-reduction studies in adults and children. Disabil. Rehabilitation Assistive Technol. 13, 600–608. doi:10.1080/17483107.2017.1392619
Cunningham, L. L., and Tucci, D. L. (2017). Hearing loss in adults. N. Engl. J. Med. 377, 2465–2473. doi:10.1056/nejmra1616601
Defossez, A., Synnaeve, G., and Adi, Y. (2020). Real time speech enhancement in the waveform domain. Available at: http://arxiv.org/abs/2006.12847 (Accessed September 28, 2023).
Diehl, P. U., Singer, Y., Zilly, H., Schönfeld, U., Meyer-Rachner, P., Berry, M., et al. (2023). Restoring speech intelligibility for hearing aid users with deep learning. Sci. Rep. 13 (1), 2719. doi:10.1038/s41598-023-29871-8
Diehl, P. U., Thorbergsson, L., Singer, Y., Skripniuk, V., Pudszuhn, A., Hofmann, V. M., et al. (2022b). Non-intrusive deep learning-based computational speech metrics with high-accuracy across a wide range of acoustic scenes. PLOS ONE 17, e0278170. doi:10.1371/journal.pone.0278170
Fisher, D., Li, C.-M., Chiu, M. S., Themann, C. L., Petersen, H., Jónasson, F., et al. (2014). Impairments in hearing and vision impact on mortality in older people: the AGES-Reykjavik Study. Age Ageing 43, 69–76. doi:10.1093/ageing/aft122
Gemmeke, J. F., Ellis, D. P. W., Freedman, D., Jansen, A., Lawrence, W., Moore, R. C., et al. (2017). “Audio Set: an ontology and human-labeled dataset for audio events,” in Proceedings of the 2017 IEEE International Conference on Acoustics, Speech and Signal Processing (ICASSP), New Orleans, LA, March 2017 (IEEE), 776–780. doi:10.1109/ICASSP.2017.7952261
Goehring, T., Yang, X., Monaghan, J. J. M., and Bleeck, S. (2016). “Speech enhancement for hearing-impaired listeners using deep neural networks with auditory-model based features,” in Proceedings of the 2016 24th European Signal Processing Conference (EUSIPCO), Budapest, Hungary, September 2016, 2300–2304.
Ha, J., Cho, Y. S., Kim, S. J., Cho, S. H., Kim, J. P., Jung, Y. H., et al. (2020). Hearing loss is associated with cortical thinning in cognitively normal older adults. Eur. J. Neurology 27, 1003–1009. doi:10.1111/ene.14195
Hansen, J. H. L., Ali, H., Saba, J. N., Charan, M. C. R., Mamun, N., Ghosh, R., et al. (2019). “CCi-MOBILE: design and evaluation of a cochlear implant and hearing aid research platform for speech scientists and engineers,” in Proceedings of the 2019 IEEE EMBS International Conference on Biomedical & Health Informatics (BHI), Chicago, IL, USA, May 2019, 1–4. doi:10.1109/BHI.2019.8834652
Hartley, D., Rochtchina, E., Newall, P., Golding, M., and Mitchell, P. (2010). Use of hearing AIDS and assistive listening devices in an older Australian population. J. Am. Acad. Audiology 21, 642–653. doi:10.3766/jaaa.21.10.4
Healy, E. W., Tan, K., Johnson, E. M., and Wang, D. (2021). An effectively causal deep learning algorithm to increase intelligibility in untrained noises for hearing-impaired listeners. J. Acoust. Soc. Am. 149, 3943–3953. doi:10.1121/10.0005089
Hougaard, S., and Ruf, S. (2011). EuroTrak I: a consumer survey about hearing aids in Germany, France, and the UK. Hear. Rev. 9.
ITU-R BS.1534-3 Recommendation (2015). Method for the subjective assessment of intermediate quality level of audio systems.
Jaderberg, M., Dalibard, V., Osindero, S., Czarnecki, W. M., Donahue, J., Razavi, A., et al. (2017). Population based training of neural networks. Available at: http://arxiv.org/abs/1711 (Accessed August 3, 2022).
Kalbe, E., Kessler, J., Calabrese, P., Smith, R., Passmore, A. P., Brand, M., et al. (2004). DemTect: a new, sensitive cognitive screening test to support the diagnosis of mild cognitive impairment and early dementia. Int. J. Geriatric Psychiatry 19, 136–143. doi:10.1002/gps.1042
Kim, Y.-D., Park, E., Yoo, S., Choi, T., Yang, L., and Shin, D. (2016). Compression of deep convolutional neural networks for fast and low power mobile applications. Available at: http://arxiv.org/abs/1511.06530 (Accessed April 8, 2020).
Kuchaiev, O., and Ginsburg, B. (2018). Factorization tricks for LSTM networks. Available at: http://arxiv.org/abs/1703 (Accessed April 8, 2020).
Lebedev, V., Ganin, Y., Rakhuba, M., Oseledets, I., and Lempitsky, V. (2015). Speeding-up convolutional neural networks using fine-tuned CP-decomposition. Available at: http://arxiv.org/abs/1412.6553 (Accessed April 8, 2020).
Li, H., Kadav, A., Durdanovic, I., Samet, H., and Graf, H. P. (2017). Pruning filters for efficient ConvNets. Available at: http://arxiv.org/abs/1608.08710 (Accessed April 8, 2020).
Liu, L., Guan, H., Ma, J., Dai, W., Wang, G., and Ding, S. (2023). A mask free neural network for monaural speech enhancement. Available at: http://arxiv.org/abs/2306.04286 (Accessed September 28, 2023).
Luo, Y., and Mesgarani, N. (2019). Conv-TasNet: surpassing ideal time-frequency magnitude masking for speech separation. IEEE/ACM Trans. Audio Speech Lang. Process. 27, 1256–1266. doi:10.1109/TASLP.2019.2915167
Mueller, H. G., Weber, J., and Hornsby, B. W. Y. (2006). The effects of digital noise reduction on the acceptance of background noise. Trends Amplif. 10, 83–93. doi:10.1177/1084713806289553
Panahi, I., Kehtarnavaz, N., and Thibodeau, L. (2016). “Smartphone-based noise adaptive speech enhancement for hearing aid applications,” in Proceedings of the 2016 38th Annual International Conference of the IEEE Engineering in Medicine and Biology Society (EMBC), Orlando, FL, USA, August 2016, 85–88. doi:10.1109/EMBC.2016.7590646
Panayotov, V., Chen, G., Povey, D., and Khudanpur, S. (2015). “Librispeech: an ASR corpus based on public domain audio books,” in Proceedings of the 2015 IEEE International Conference on Acoustics, Speech and Signal Processing (ICASSP), South Brisbane, Queensland, Australia (IEEE), 5206–5210. doi:10.1109/ICASSP.2015.7178964
Reddy, C. K. A., Gopal, V., and Cutler, R. (2021). “DNSMOS: a non-intrusive perceptual objective speech quality metric to evaluate noise suppressors,” in Proceedings of the 2021 IEEE International Conference on Acoustics, Speech and Signal Processing (ICASSP), Toronto, ON, Canada, June 2021.
Ronneberger, O., Fischer, P., and Brox, T. (2015). U-net: convolutional networks for biomedical image segmentation. Available at: http://arxiv.org/abs/1505 (Accessed March 10, 2020).
Speckhard, D. T., Misiunas, K., Perel, S., Zhu, T., Carlile, S., and Slaney, M. (2023). Neural architecture search for energy efficient always-on audio models. Available at: http://arxiv.org/abs/2202.05397 (Accessed September 26, 2023).
Tay, Y., Dehghani, M., Abnar, S., Chung, H. W., Fedus, W., Rao, J., et al. (2022). Scaling laws vs model architectures: how does inductive bias influence scaling? Available at: http://arxiv.org/abs/2207.10551 (Accessed July 26, 2022).
Tzinis, E., Adi, Y., Ithapu, V. K., Xu, B., Smaragdis, P., and Kumar, A. (2022). RemixIT: continual self-training of speech enhancement models via bootstrapped remixing. Available at: http://arxiv.org/abs/2202.08862 (Accessed May 23, 2022).
Völker, C., Warzybok, A., and Ernst, S. M. A. (2015). Comparing binaural pre-processing strategies III: speech intelligibility of normal-hearing and hearing-impaired listeners. Trends Hear. 19, 233121651561860. doi:10.1177/2331216515618609
Wagener, K., Brand, T., and Kol, B. (1999a). Entwicklung und Evaluation eines Satztests für die deutsche Sprache Teil III: evaluation des Oldenburger Satztests. Z. für Audiolgy 38, 86–95.
Wagener, K. C., Brand, T., and Kollmeier, B. (1999b). Entwicklung und Evaluation eines Satztests für die deutsche Sprache II: optimierung des Oldenburger Satztests. Audiologie/Audiological Acoust. 38, 44–56.
Wang, C., Rivière, M., Lee, A., Wu, A., Talnikar, C., Haziza, D., et al. (2021). VoxPopuli: a large-scale multilingual speech corpus for representation learning, semi-supervised learning and interpretation. Available at: http://arxiv.org/abs/2101.00390 (Accessed March 20, 2023).
Wang, D., and Chen, J. (2018). Supervised speech separation based on deep learning: an overview. Available at: http://arxiv.org/abs/1708.07524 (Accessed March 10, 2020).
Zakis, J. A., Hau, J., and Blamey, P. J. (2009). Environmental noise reduction configuration: effects on preferences, satisfaction, and speech understanding. Int. J. Audiology 48, 853–867. doi:10.3109/14992020903131117
Zhao, S., Nguyen, T. H., and Ma, B. (2021). Monaural speech enhancement with complex convolutional block attention module and joint time frequency losses. Available at: http://arxiv.org/abs/2102 (Accessed September 28, 2023).
Keywords: denoising, deep learning, hearing aid, speech-in-noise, low-power
Citation: Diehl PU, Zilly H, Sattler F, Singer Y, Kepp K, Berry M, Hasemann H, Zippel M, Kaya M, Meyer-Rachner P, Pudszuhn A, Hofmann VM, Vormann M and Sprengel E (2023) Deep learning-based denoising streamed from mobile phones improves speech-in-noise understanding for hearing aid users. Front. Med. Eng. 1:1281904. doi: 10.3389/fmede.2023.1281904
Received: 23 August 2023; Accepted: 02 November 2023;
Published: 15 November 2023.
Edited by:
Hafiz Tayyab Rauf, Staffordshire University, United KingdomCopyright © 2023 Diehl, Zilly, Sattler, Singer, Kepp, Berry, Hasemann, Zippel, Kaya, Meyer-Rachner, Pudszuhn, Hofmann, Vormann and Sprengel. This is an open-access article distributed under the terms of the Creative Commons Attribution License (CC BY). The use, distribution or reproduction in other forums is permitted, provided the original author(s) and the copyright owner(s) are credited and that the original publication in this journal is cited, in accordance with accepted academic practice. No use, distribution or reproduction is permitted which does not comply with these terms.
*Correspondence: Peter Udo Diehl, peter.u.diehl@gmail.com