 Xiao Yang
 Chuanxue Hong
- Hampton Roads Agricultural Research and Extension Center, Virginia Tech, Virginia Beach, VA, United States
The genus Phytophthora is agriculturally and ecologically important. As the number of Phytophthora species continues to grow, identifying isolates in this genus has become increasingly challenging even by DNA sequencing. This study evaluated nine commonly used genetic markers against 154 formally described and 17 provisionally named Phytophthora species. These genetic markers were the cytochrome-c oxidase 1 (cox1), internal transcribed spacer region (ITS), 60S ribosomal protein L10, beta-tubulin (β-tub), elongation factor 1 alpha, enolase, heat shock protein 90, 28S ribosomal DNA, and tigA gene fusion protein (tigA). As indicated by species distance, cox1 had the highest genus-wide resolution, followed by ITS, tigA, and β-tub. Resolution of these four markers also varied with (sub)clade. β-tub alone could readily identify all species in clade 1, cox1 for clade 2, and tigA for clades 7 and 8. Two or more genetic markers were required to identify species in other clades. For PCR consistency, ITS (99% PCR success rate) and β-tub (96%) were easier to amplify than cox1 (75%) and tigA (71%). Accordingly, it is recommended to take a two-step approach: classifying unknown Phytophthora isolates to clade by ITS sequences, as this marker is easy to amplify and its signature sequences are readily available, then identifying to species by one or more of the most informative markers for the respective (sub)clade.
Introduction
The genus Phytophthora currently consists of approximately 200 formal and provisional species with many high-impact plant pathogens (Erwin and Ribeiro, 1996; Yang et al., 2017). For example, P. infestans and P. sojae are major threats to potato and soybean production, respectively (Erwin and Ribeiro, 1996). Phytophthora ramorum (Goheen et al., 2002; Rizzo et al., 2002, 2005) and P. cinnamomi (Zentmyer, 1980; Shearer et al., 2004) are destructive forest pathogens causing tree decline in the U.S. and Australia, respectively.
Identifying Phytophthora isolates to species is the first and critical step to support plant biosecurity. This process is now done primarily by DNA sequencing. Concerted efforts have been made to identify genetic markers and improve the accuracy of DNA sequence-based identification. As a result, a variety of markers have been identified and utilized (Cooke et al., 2000; Martin and Tooley, 2003; Kroon et al., 2004; Blair et al., 2008; Robideau et al., 2014). Meanwhile, many signature sequences from ex-types (type-derived cultures) and authentic isolates (representative isolates designated by the originators of the respective species) have been generated (Cooke et al., 2000; Kroon et al., 2004; Blair et al., 2008; Martin et al., 2014; Yang et al., 2017), although their availability in public repositories depends upon species (Kang et al., 2010). These two lines of advancement have raised several questions of practical importance. What genetic markers are most useful? Is their resolution dependent upon (sub)clade? How many markers are required to identify Phytophthora isolates within a respective (sub)clade to species?
Answers to the above and other related questions will help identifying Phytophthora species accurately in the timeliest fashion and at the lowest cost. To this end, Martin et al. (2012) indicated that a set of genetic markers may be required for the most accurate identification. These included the internal transcribed spacer region (ITS), 60S ribosomal protein L10 (60S), beta-tubulin (β-tub), elongation factor 1 alpha (EF-1α), enolase (ENL), heat shock protein 90 (Hsp90), 28S ribosomal DNA (28S), tigA gene fusion protein (tigA), cytochrome-c oxidase 1 and 2 (cox1 and cox2), subunit 9 of NADH dehydrogenase (nad9), ribosomal protein S10 (rps10), and SecY protein (secY) coding regions. Correspondingly, reference sequences from various markers have been compiled for many known Phytophthora species (Cooke et al., 2000; Kroon et al., 2004; Blair et al., 2008; Grünwald et al., 2011; Park et al., 2013; Martin et al., 2014; Yang et al., 2017). In separate studies, Martin et al. (2014) and Martin and Tooley (2003) provided the average pairwise species distances for the concatenated nuclear and mitochondrial genes, and five mitochondrial markers, namely cox1&2, nad9, rps10, and secY.
The objectives of this study were to evaluate nine commonly used genetic markers against more than 170 Phytophthora taxa and identify the most informative markers for individual (sub)clades.
Materials and Methods
Sequence Selection
Nine common genetic markers, namely ITS, cox1, 60S, β-tub, EF-1α, ENL, Hsp90, 28S, and tigA, were evaluated. Sequences of 180 Phytophthora isolates representing 154 described and 17 provisionally named species were analyzed. These included 116 ex-types and 28 authentic isolates (Table 1). Eight taxa were represented by two or three isolates due to the lack of sequence data for all regions of individual isolates. The majority of 60S, β-tub, EF-1α, ENL, Hsp90, 28S, and tigA sequences originated from two previous studies (Blair et al., 2008; Yang et al., 2017). ITS and cox1 sequences of 90 and 79 Phytophthora species, respectively, were downloaded from GenBank (Benson et al., 2018). Sequences from P. sp. ohioensis (ST18-37) were obtained from the Phytophthora Database (Park et al., 2013). Seventy-nine and 86 isolates were sequenced for ITS and cox1, respectively in this study as described below to fill the signature sequence gaps in current public repositories.
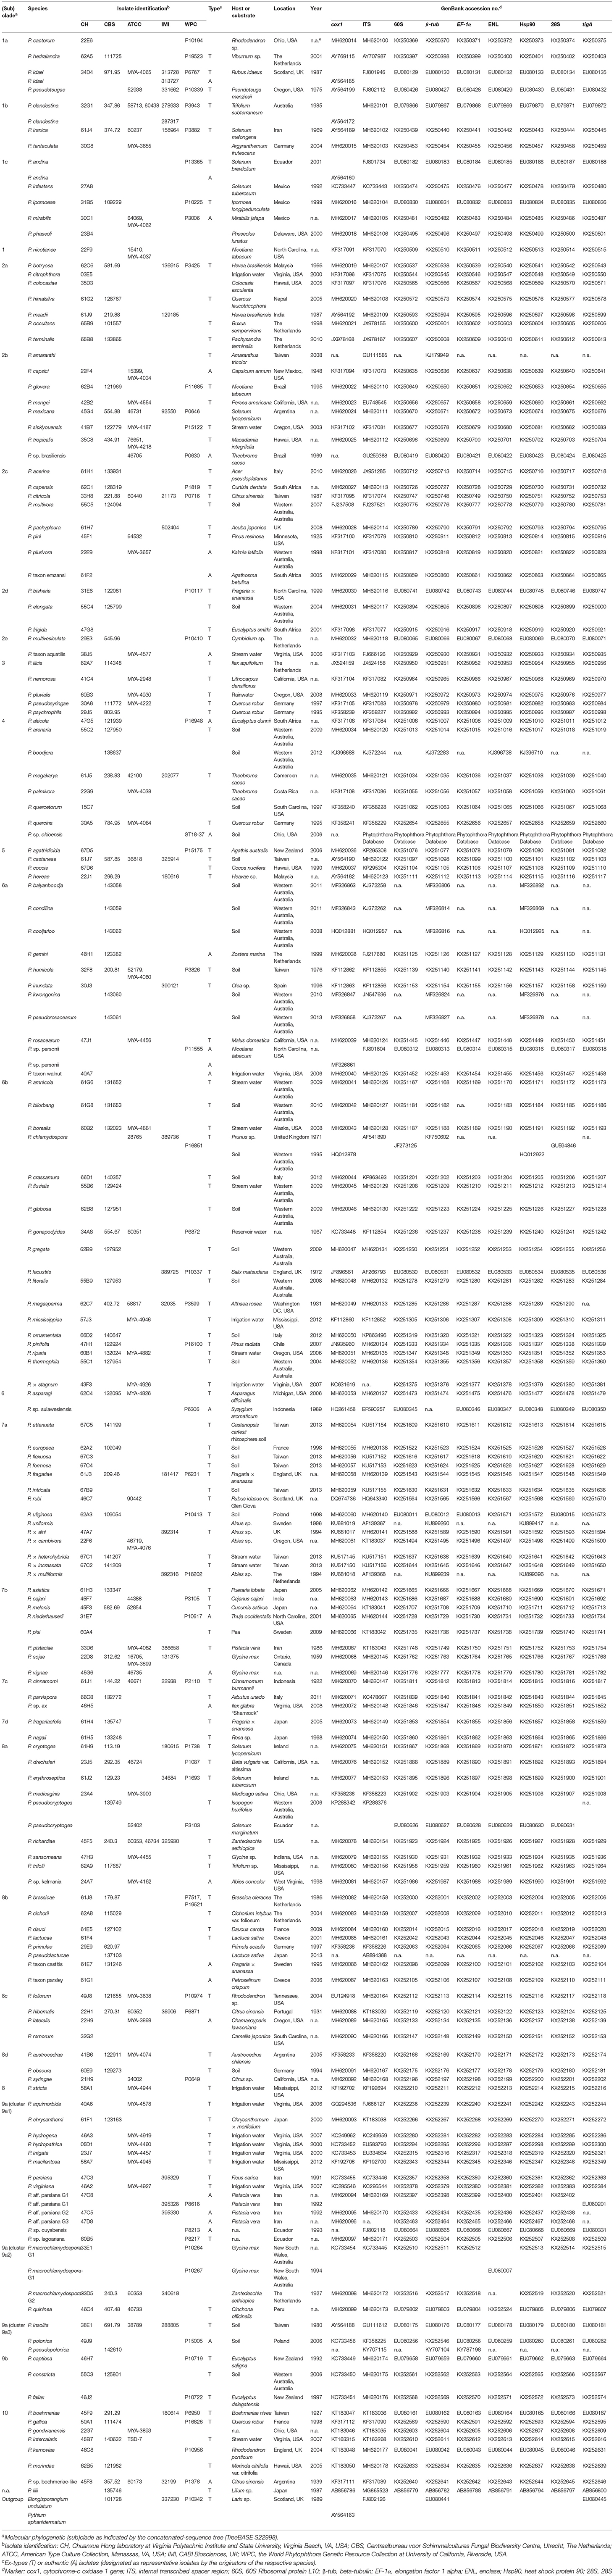
Table 1. Information and GenBank accession numbers of isolates used in this study.
DNA Extraction, Amplification, and Sequencing
To extract genomic DNA (gDNA), a 5 × 5 mm agar plug was cut from the actively growing edge of a fresh culture and transferred to 20% clarified V8 broth. Cultures were incubated at room temperature (c. 23°C) for 7–14 d to produce a mycelial mass. The mass was blotted dry on sterile tissue paper, transferred to a garnet bead tube and lysed in a FastPrep®-24 (MP Biomedicals, Santa Ana, CA). gDNA was purified using a custom Maxwell® 16 FFS nucleic acid extraction kit in combination with a Maxwell® Rapid Sample Concentrator (Promega, Madison, WI).
A pair of primers including the forward primer ITS6 and reverse primer ITS4 (Cooke et al., 2000) was used to amplify the ITS region. The cox1 fragment was amplified with the primer pair COXF4N and COXR4N (Kroon et al., 2004). PCR reaction mixtures were prepared with Takara Taq DNA polymerase (Takara Shuzo, Shiga, Japan) according to the manufacturer's instructions. Each cox1 PCR reaction mixture contained an additional 2-μL 25 mM MgCl2 and 0.25-μL Bovine serum albumin (BSA) per 25-μL. Thermal cycling protocols were described previously (Cooke et al., 2000; Kroon et al., 2004). All PCR products were evaluated for successful amplification using agarose gel electrophoresis. Sequencing reactions were run in both directions with the same primer pairs used for amplification at the University of Kentucky Advanced Genetic Technologies Center (Lexington, KY) or Eton Bioscience Inc. (Durham, NC). Results were viewed in Finch TV version 1.4.0 (Geospiza, Seattle, WA), aligned using Clustal X (Larkin et al., 2007), and edited manually to correct obvious sequencing errors and code ambiguous sites according to the International Union of Pure and Applied Chemistry (IUPAC) nucleotide ambiguity codes to produce a consensus sequence. All sequences produced in this study have been deposited in GenBank (Table 1).
Rates of PCR success for all nine genetic markers were estimated by calculating the percentage of successful amplifications over all PCR reactions performed by the authors for each marker during the past 6 years.
Genus-Wide Distance Analyses
All nine genetic markers were analyzed for overall species distances resolved across the genus Phytophthora. Sequence datasets of each marker were aligned using the MUSCLE version 3.7 (Edgar, 2004) in MEGA version 7.0.26 (Kumar et al., 2016). Alignments were manually modified when obvious errors were present. The alignment of each marker was then trimmed to an equal size and question marks were inserted to represent missing data at both ends of short sequences. DNA sequence distances were calculated using the Kimura 2-parameter (K2P) distance model (Kimura, 1980) to explore the maximum, minimum and mean distances across the genus.
Distance Analyses Within Individual (Sub)Clades
Four selected markers that had relatively high mean species distances across the genus (cox1, ITS, tigA, and β-tub) were analyzed for distances within individual (sub)clades. Phylogenetic (sub)clade assignments for each species were identified according to the recent study by Yang et al. (2017). Sequence datasets within individual (sub)clades of each marker were aligned and edited as described above. Maximum, minimum, and mean distances within individual (sub)clades of each marker were calculated as described above.
Comparison of Individual-Marker Trees With Concatenated-Sequence Tree
Each marker tree for all four selected markers (cox1, ITS, tigA, and β-tub) included a set of identical 150 Phytophthora taxa, plus two outgroup taxa: Elongisporangium undulatum (basionym: Pythium undulatum) was used as the outgroup taxon for ITS, tigA, and β-tub, while Pythium aphanidermatum (Uzuhashi et al., 2010) was used for the mitochondrial marker cox1. The sequence dataset of each marker was aligned in MEGA 7 and edited as described above. Then, the four alignments were combined in MEGA 7 to produce a concatenated sequence alignment. Phylogeny reconstructions including four individual-marker trees and a concatenated-sequence tree were carried out using both Maximum likelihood (ML) and Neighbor joining (NJ) methods with the K2P model and 1000 bootstrap replications in MEGA 7. Alignments and phylogenetic trees have been deposited in TreeBASE (S22998).
To validate the accuracy of the concatenated-sequence trees, the clade affiliation of individual species was compared with those presented in previous phylogenetic studies. The overall topological scores between the concatenated-sequence trees and individual-marker trees were calculated using Compare2Trees version September 2011 (Nye et al., 2006).
Results
PCR Consistency, Amplifications, and Sequence Alignments
The ITS region was the easiest genetic marker to amplify (Table 2). The rates of PCR amplification success for β-tub, 28S, 60S, Hsp90, and EF-1α were also high (>90%; Table 2). Markers tigA, ENL, and cox1 (using primer pair COXF4N and COXR4N) had relatively low success rates (≤ 80%) with the tigA being the most difficult (Table 2).
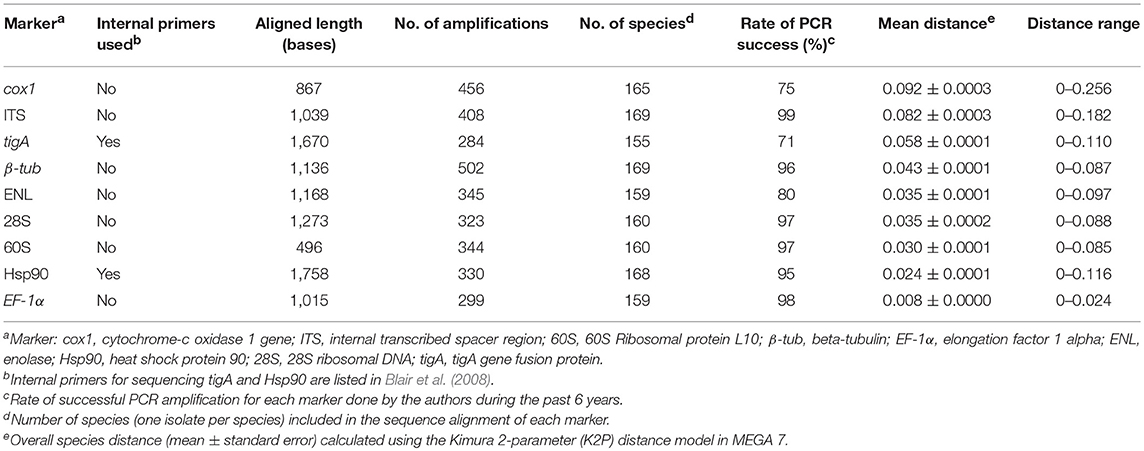
Table 2. PCR consistency and overall species distance across the genus Phytophthora by genetic marker.
Sequences could not be obtained from 11 taxa for 60S, 2 for β-tub, 12 for EF-1α, 12 for ENL, 3 for Hsp90, 11 for 28S, 16 for tigA, 2 for ITS, and 6 for cox1 (Table 2). These taxa were excluded from distance analyses of individual markers. Eleven taxa missing any of cox1, ITS, tigA, or β-tub sequences were also excluded in the comparison of individual-marker trees with concatenated-sequence tree.
Sequence lengths were consistent for all markers except for the ITS, in spite of missing data at either or both ends of short sequences. Length of ITS sequences varied from 744 bases (P. hydrogena in cluster 9a1 of subclade 9a) to 848 bases (P. intercalaris in clade 10).
Among the nine markers, the aligned length was the shortest for 60S and longest for Hsp90 (Table 2). The aligned length of concatenated sequences (cox1, ITS, tigA, and β-tub) of 150 Phytophthora taxa plus the outgroup was 4,714 bases.
Genus-Wide Distance Analyses
The mean species distance of cox1 was the highest among the nine markers (Table 2). ITS had the highest genus-wide resolution among the nuclear markers, followed by tigA and β-tub (Table 2). ENL, 28S, 60S, Hsp90, and EF-1α had lower species distances (mean distance < 0.04). EF-1α had the lowest resolution across the genus (Table 2). Species pairs with identical sequences (distance = 0) were found for all markers.
Distances Within Individual (Sub)Clades
Four markers including cox1, ITS, tigA, and β-tub, were selected for distance analyses within individual (sub)clades. Species distances (mean values and ranges) for 10 Phytophthora clades and 20 subclades according to previously assigned numbers (Yang et al., 2017) are listed in Table 3.
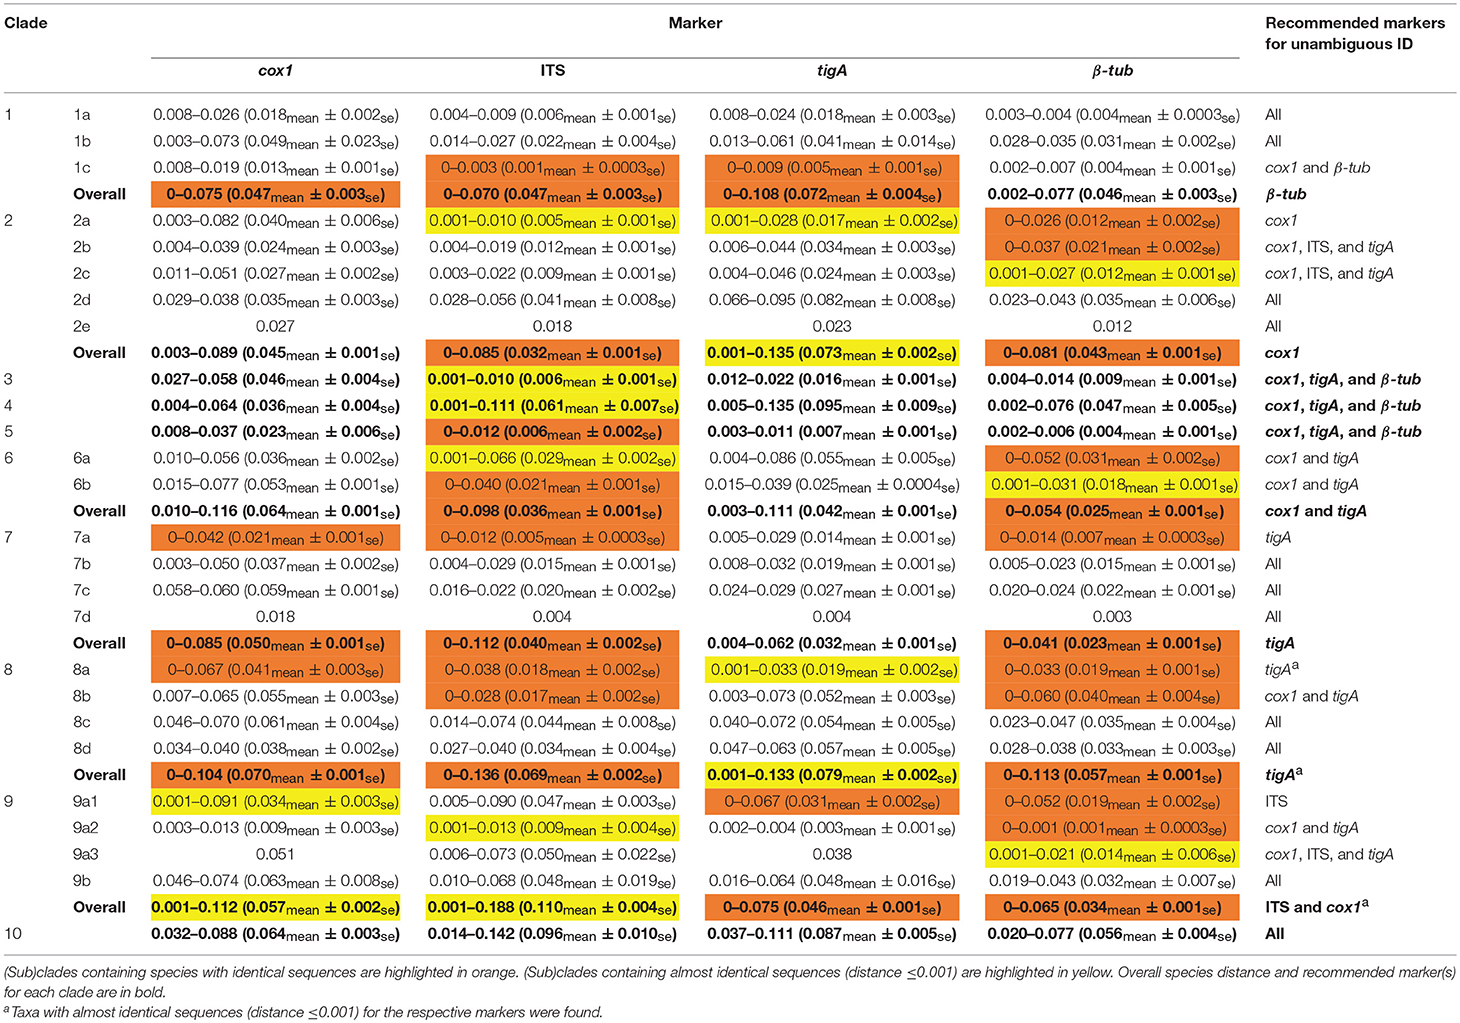
Table 3. Species distance of the four most informative genetic markers with recommendations for identifying isolates in each Phytophthora (sub)clade.
Among the four markers, tigA and cox1 had relatively high distances within most (sub)clades. Species with identical sequences were found in 3 clades and 2 subclades for cox1, 2 clades and 2 subclades for tigA, 5 clades, and 8 subclades for β-tub, and 6 clades and 5 subclades for ITS (Table 3). Species pairs with identical sequences of each marker in individual (sub)clades are listed in Table 4.
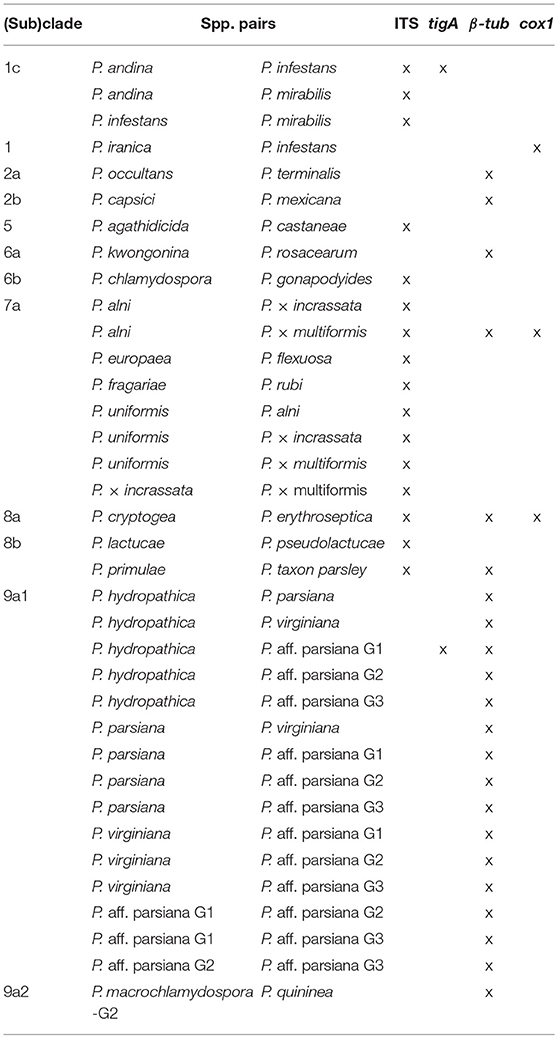
Table 4. Species pairs with identical sequences for four genetic markers.
For clade 1, there were no identical β-tub sequences, while identical species pairs were found for the other three markers (Table 3). No identical sequences of cox1 or tigA were found in clades 2 and 6. All markers except for the ITS had acceptable to high (minimum distance = 0.002–0.027) resolution within clade 3, 4, and 5. Identical ITS sequences were found in clade 5. Almost identical ITS sequences (distance ≤ 0.001) were found in clades 3 and 4. tigA was the only marker of unambiguity for clade 8, although almost identical tigA sequences were present in that clade (Table 3). No identical sequences of cox1 or ITS were found in clade 9. All markers provided high resolution among clade-10 species.
Comparison of Individual-Marker Trees With Concatenated-Sequence Tree
The resulted clade assignments and clade affiliation of individual species (Table 1) based on the concatenated-sequence tree (TreeBASE S22998) were nearly identical to those generated in previous phylogenetic studies (Blair et al., 2008; Martin et al., 2014; Yang et al., 2017) except that the placement of P. quercina was ambiguous.
All trees from sequences of the three nuclear markers had similar topologies (score = 75.3–81.7%) to those of the concatenated-sequences trees in both ML and NJ analyses. In contrast, cox1 sequences produced trees of distinct topologies (TreeBASE S22998). The overall topological similarities to the concatenated-sequences trees were approximately 45% lower than those of nuclear markers in both analyses (Table 5).
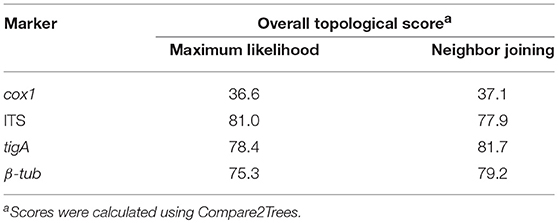
Table 5. Similarity of individual-marker trees to concatenated-sequence tree.
Discussion
This study identified four most informative genetic markers for identifying Phytophthora species: cox1, ITS, tigA, and β-tub. The resolution of each marker depended on (sub)clade. These results along with the signature sequences generated by Cooke et al. (2000), Kroon et al. (2004), Blair et al. (2008), Martin et al. (2014), and Yang et al. (2017) enable first responders, diagnosticians, and researchers to identify Phytophthora isolates with confidence at minimal cost in the briefest time possible.
ITS
Using the ITS sequence to identify Phytophthora isolates has several advantages. First, the ITS region has the most comprehensive sequence database when compared to other markers. As this marker has been proposed as the barcode for fungi and oomycetes (Seifert, 2009) and later designated as the barcode for all fungi (Schoch et al., 2012), almost all known Phytophthora taxa have been sequenced for the ITS region. Subsequently, sequencing the ITS region of unknown Phytophthora isolates has become a common practice in research labs and plant disease clinics. Second, the ITS region amplified by the primer pair ITS6/ITS4 has the best universality across the genus and the highest PCR consistency among markers evaluated in this study (Table 1). Third, the clade affiliations of individual species based on the ITS sequences mostly accord with those based on multilocus sequence data (Table 5).
Despite the above merits, ITS alone is not sufficient to identify all Phytophthora isolates to the species level. Identical ITS sequences have been observed in 16 pairs of species in clades 1, and 5–8, more than any of tigA, β-tub, and cox1 (Table 4). These identical and other almost identical ITS sequences (distance ≤ 0.001 or difference between sequences ≤ 10 bases) were found in clades 1–9, while those for tigA, β-tub, and cox1 only occurred in 4, 5, and 4 clades, respectively (Table 3). This result indicates that it is important to use additional markers to identify Phytophthora isolates in all clades, perhaps with the exception of clade 10.
Due to its high universality, availability, and PCR consistency, the ITS region is an ideal first genetic marker for identifying Phytophthora isolates to clade.
cox1 Amplified by the Primer Pair COXF4N/COXR4N
The cox1 has the highest genus-wide resolution among the evaluated markers (Table 2). Only three species pairs with identical cox1 sequences were found (Table 4). However, using cox1 alone for identifying Phytophthora isolates presents a few problems. First, cox1 had the second lowest PCR success rate (Table 2). In cases, adjusting MgCl2 and BSA concentrations, and annealing temperature were required for a successful amplification. However, it is important to note that the presented PCR success rates (Table 2) were calculated based on all PCR amplifications done by the two authors in the past 6 years, while many other factors could influence the PCR success rate, such as the quality of DNA templates and primers, and different PCR operators and thermocyclers. Second, (sub)clade-classification solely by cox1 may conflict with those assigned by multi-locus analyses (Table 5). Thus, using cox1 alone may lead to misidentification of unknown Phytophthora isolates at the (sub)clade-level. Third, due to the uniparental inheritance of mitochondria, it is impossible to separate a hybrid Phytophthora species from its maternal parent based on the cox1 sequence. This is increasingly important as Phytophthora hybrids have been commonly found in many ecosystems (Nirenberg et al., 2009; Man in't Veld et al., 2012; Nagel et al., 2013; Yang et al., 2014; Husson et al., 2015; Jung et al., 2017). This problem not only occurs for cox1, but also for other mitochondrial markers that were not evaluated in this study.
tigA
The tigA has moderately high genus-wide resolution (Table 1). High similarity in topology between the tigA tree and the multi-locus tree (Table 5) makes this marker useful in assigning Phytophthora isolates to (sub)clades. Additionally, it had excellent resolution within most individual (sub)clades. Species with identical tigA sequences were found only in subclades 1c and 9a1 (Table 3). However, this marker has the lowest PCR success rate of 71%. In addition, internal primers were usually required for sequencing (Table 1), which increases the cost. Both factors potentially compromise the usefulness of the tigA marker.
β-tub
The marker β-tub had the fourth highest genus-wide resolution. High similarity in topology between the β-tub tree and the multi-locus tree (Table 5) makes this marker also useful for assigning Phytophthora taxa to (sub)clades. Like ITS, β-tub is easy to amplify (Table 2), which further adds to its usefulness. However, 22 species pairs in clades 2, and 6–9 have identical β-tub sequences (Table 3). Thus, β-tub does not have the resolution required for identifying Phytophthora isolates to species in these clades.
Conclusions
Among the nine genetic markers evaluated in this study, cox1, ITS, tigA, and β-tub were the most informative for the genus Phytophthora. Both ITS and β-tub were easy to amplify but had limited species distance within some (sub)clades. Comparatively, cox1 and tigA had high resolution within most (sub)clades but they were relatively difficult to amplify. In addition, cox1 was not useful for assigning species to (sub)clades nor for identifying hybrid taxa. Taken together, a two-step approach is recommended: identifying unknown Phytophthora isolates to clade level with ITS sequences then to species level with one or more additional markers (Table 3). For example, β-tub can be used to readily identify all species in clade 1, cox1 for clade 2, and tigA for clades 7 and 8 (Table 3).These recommendations along with available signature sequences enable first responders, diagnosticians, and researchers to identify Phytophthora isolates with confidence at reduced time and cost.
Author Contributions
XY and CH conceived and designed the experiments, contributed reagents, materials, analysis tools, and wrote the paper. XY performed the experiments and analyzed the data.
Conflict of Interest Statement
The authors declare that the research was conducted in the absence of any commercial or financial relationships that could be construed as a potential conflict of interest.
Acknowledgments
This research was supported in part by grants from the USDA-NIFA-Specialty Crop Research Initiative (Agreement no. 2010-51181-21140). The authors would like to thank Mrs. Patricia Richardson for her assistance in submitting PCR products for DNA sequencing during the study and her proofreading of this manuscript. We thank Virginia Tech's Open Access Subvention Fund (OASF) for financial support of publication fees.
References
Benson, D. A., Cavanaugh, M., Clark, K., Karsch-Mizrachi, I., Ostell, J., Pruitt, K. D., et al. (2018). GenBank. Nucleic Acids Res. 46, D41–D47. doi: 10.1093/nar/gkx1094
Blair, J. E., Coffey, M. D., Park, S.-Y., Geiser, D. M., and Kang, S. (2008). A multi-locus phylogeny for Phytophthora utilizing markers derived from complete genome sequences. Fungal Genet. Biol. 45, 266–277. doi: 10.1016/j.fgb.2007.10.010
Cooke, D. E. L., Drenth, A., Duncan, J. M., Wagels, G., and Brasier, C. M. (2000). A molecular phylogeny of Phytophthora and related oomycetes. Fungal Genet. Biol. 30, 17–32. doi: 10.1006/fgbi.2000.1202
Edgar, R. C. (2004). MUSCLE: a multiple sequence alignment method with reduced time and space complexity. BMC Bioinformatics 5, 1–19. doi: 10.1186/1471-2105-5-113
Goheen, E. M., Hansen, E. M., Kanaskie, A., McWilliams, M. G., Osterbauer, N., and Sutton, W. (2002). Sudden oak death caused by Phytophthora ramorum in Oregon. Plant Dis. 86:441. doi: 10.1094/PDIS.2002.86.4.441C
Grünwald, N. J., Martin, F. N., Larsen, M. M., Sullivan, C. M., Press, C. M., Coffey, M. D., et al. (2011). Phytophthora-ID.org: a sequence-based Phytophthora identification tool. Plant Dis. 95, 337–342. doi: 10.1094/PDIS-08-10-0609
Husson, C., Aguayo, J., Revellin, C., Frey, P., Ioos, R., and Marcais, B. (2015). Evidence for homoploid speciation in Phytophthora alni supports taxonomic reclassification in this species complex. Fungal Genet. Biol. 77, 12–21. doi: 10.1016/j.fgb.2015.02.013
Jung, T., Jung, M. H., Scanu, B., Seress, D., Kovács, G. M., Maia, C., et al. (2017). Six new Phytophthora species from ITS Clade 7a including two sexually functional heterothallic hybrid species detected in natural ecosystems in Taiwan. Persoonia 38, 100–135. doi: 10.3767/003158517X693615
Kang, S., Mansfield, M. A., Park, B., Geiser, D. M., Ivors, K. L., Coffey, M. D., et al. (2010). The promise and pitfalls of sequence-based identification of plant-pathogenic fungi and oomycetes. Phytopathology 100, 732–737. doi: 10.1094/PHYTO-100-8-0732
Kimura, M. (1980). A simple method for estimating evolutionary rate of base substitutions through comparative studies of nucleotide sequences. J. Mol. Evol. 16, 111–120. doi: 10.1007/BF01731581
Kroon, L. P., Bakker, F. T., van den Bosch, G. B. M., Bonants, P. J. M., and Flier, W. G. (2004). Phylogenetic analysis of Phytophthora species based on mitochondrial and nuclear DNA sequences. Fungal Genet. Biol. 41, 766–782. doi: 10.1016/j.fgb.2004.03.007
Kumar, S., Stecher, G., and Tamura, K. (2016). MEGA7: molecular evolutionary genetics analysis version 7.0 for bigger datasets. Mol. Biol. Evol. 33, 1870–1874. doi: 10.1093/molbev/msw054
Larkin, M. A., Blackshields, G., Brown, N. P., Chenna, R., McGettigan, P. A., McWilliam, H., et al. (2007). Clustal W and Clustal X version 2.0. Bioinformatics 23, 2947–2948. doi: 10.1093/bioinformatics/btm404
Man in't Veld, W. A., Rosendahl, K. C. H. M., and Hong, C. (2012). Phytophthora × serendipita sp. nov. and P. × pelgrandis, two destructive pathogens generated by natural hybridization. Mycologia 104, 1390–1396. doi: 10.3852/11-272
Martin, F. N., Abad, Z. G., Balci, Y., and Ivors, K. (2012). Identification and detection of Phytophthora: reviewing our progress, identifying our needs. Plant Dis. 96, 1080–1103. doi: 10.1094/PDIS-12-11-1036-FE
Martin, F. N., Blair, J. E., and Coffey, M. D. (2014). A combined mitochondrial and nuclear multilocus phylogeny of the genus Phytophthora. Fungal Genet. Biol. 66, 19–32. doi: 10.1016/j.fgb.2014.02.006
Martin, F. N., and Tooley, P. W. (2003). Phylogenetic relationships among Phytophthora species inferred from sequence analysis of mitochondrially encoded cytochrome oxidase I and II genes. Mycologia 95, 269–284. doi: 10.1080/15572536.2004.11833112
Nagel, J. H., Gryzenhout, M., Slippers, B., Wingfield, M. J., Hardy, G. E. S. J., Stukely, M. J. C., et al. (2013). Characterization of Phytophthora hybrids from ITS clade 6 associated with riparian ecosystems in South Africa and Australia. Fungal Biol. 117, 329–347. doi: 10.1016/j.funbio.2013.03.004
Nirenberg, H. I., Gerlach, W. F., and Graefenhan, T. (2009). Phytophthora × pelgrandis, a new natural hybrid pathogenic to Pelargonium grandiflorum hort. Mycologia 101, 220–231. doi: 10.3852/06-157
Nye, T. M. W., Lio, P., and Gilks, W. R. (2006). A novel algorithm and web-based tool for comparing two alternative phylogenetic trees. Bioinformatics 22, 117–119. doi: 10.1093/bioinformatics/bti720
Park, B., Martin, F., Geiser, D. M., Kim, H. S., Mansfield, M. A., Nikolaeva, E., et al. (2013). Phytophthora database 2.0: update and future direction. Phytopathology 103, 1204–1208. doi: 10.1094/PHYTO-01-13-0023-R
Rizzo, D. M., Garbelotto, M., Davidson, J. M., Slaughter, G. W., and Koike, S. T. (2002). Phytophthora ramorum as the cause of extensive mortality of Quercus spp. and Lithocarpus densiflorus in California. Plant Disease 86, 205–214. doi: 10.1094/PDIS.2002.86.3.205
Rizzo, D. M., Garbelotto, M., and Hansen, E. A. (2005). Phytophthora ramorum: integrative research and management of an emerging pathogen in California and Oregon forests. Annu. Rev. Phytopathol. 43, 309–335. doi: 10.1146/annurev.phyto.42.040803.140418
Robideau, G. P., Rodrigue, N., and André Levesque, C. (2014). Codon-based phylogenetics introduces novel flagellar gene markers to oomycete systematics. Mol. Phylogenet. Evol. 79, 279–291. doi: 10.1016/j.ympev.2014.04.009
Schoch, C. L., Seifert, K. A., Huhndorf, S., Robert, V., Spouge, J. L., Levesque, C. A., et al. (2012). Nuclear ribosomal internal transcribed spacer (ITS) region as a universal DNA barcode marker for Fungi. Proc. Natl. Acad. Sci. USA. 109, 6241–6246. doi: 10.1073/pnas.1117018109
Seifert, K. A. (2009). Progress towards DNA barcoding of fungi. Mol. Ecol. Resour. 9, 83–89. doi: 10.1111/j.1755-0998.2009.02635.x
Shearer, B. L., Crane, C. E., and Cochrane, A. (2004). Quantification of the susceptibility of the native flora of the South-West Botanical Province, Western Australia, to Phytophthora cinnamomi. Aust. J. Bot. 52, 435–443. doi: 10.1071/BT03131
Uzuhashi, S., Tojo, M., and Kakishima, M. (2010). Phylogeny of the genus Pythium and description of new genera. Mycoscience 51, 337–365. doi: 10.1007/S10267-010-0046-7
Yang, X., Richardson, P. A., and Hong, C. (2014). Phytophthora × stagnum nothosp. nov., a new hybrid from irrigation reservoirs at ornamental plant nurseries in Virginia. PLoS ONE 9:e103450. doi: 10.1371/journal.pone.0103450
Yang, X., Tyler, B. M., and Hong, C. (2017). An expanded phylogeny for the genus Phytophthora. IMA Fungus 8, 355–398. doi: 10.5598/imafungus.2017.08.02.09
Keywords: oomycetes, plant disease diagnosis, plant pathology, genetics, plant destroyers
Citation: Yang X and Hong C (2018) Differential Usefulness of Nine Commonly Used Genetic Markers for Identifying Phytophthora Species. Front. Microbiol. 9:2334. doi: 10.3389/fmicb.2018.02334
Received: 03 August 2018; Accepted: 12 September 2018;
Published: 03 October 2018.
Edited by:
Hector Mora Montes, Universidad de Guanajuato, MexicoReviewed by:
Henrik R. Nilsson, University of Gothenburg, SwedenBernardo Franco, Universidad de Guanajuato, Mexico
Copyright © 2018 Yang and Hong. This is an open-access article distributed under the terms of the Creative Commons Attribution License (CC BY). The use, distribution or reproduction in other forums is permitted, provided the original author(s) and the copyright owner(s) are credited and that the original publication in this journal is cited, in accordance with accepted academic practice. No use, distribution or reproduction is permitted which does not comply with these terms.
*Correspondence: Xiao Yang, yxiao9@vt.edu