 Smarajit Chakraborty1†
 Linda J. Kenney1,2,3,4,5*
- 1Mechanobiology Institute, National University of Singapore, Singapore, Singapore
- 2Department of Biochemistry, National University of Singapore, Singapore, Singapore
- 3Departments of Microbiology and Immunology, University of Illinois at Chicago, Chicago, IL, United States
- 4Bioengineering, University of Illinois at Chicago, Chicago, IL, United States
- 5Jesse Brown Veterans Administration Medical Center, Chicago, IL, United States
Bacteria survive and respond to diverse environmental conditions and during infection inside the host by systematic regulation of stress response genes. E. coli and S. Typhimurium can undergo large changes in intracellular osmolality (up to 1.8 Osmol/kg) and can tolerate cytoplasmic acidification to at least pHi 5.6. Recent analyses of single cells challenged a long held view that bacteria respond to extracellular acid stress by rapid acidification followed by a rapid recovery. It is now appreciated that both S. Typhimurium and E. coli maintain an acidic cytoplasm through the actions of the outer membrane protein regulator OmpR via its regulation of distinct signaling pathways. However, a comprehensive comparison of OmpR regulons between S. Typhimurium and E. coli is lacking. In this study, we examined the expression profiles of wild-type and ompR null strains of the intracellular pathogen S. Typhimurium and a commensal E. coli in response to acid and osmotic stress. Herein, we classify distinct OmpR regulons and also identify shared OmpR regulatory pathways between S. Typhimurium and E. coli in response to acid and osmotic stress. Our study establishes OmpR as a key regulator of bacterial virulence, growth and metabolism, in addition to its role in regulating outer membrane proteins.
Introduction
Eukaryotic cells maintain strict pH homeostasis between pH 7.0–7.4 by ion transport mechanisms and a high buffering capacity of the cytosol (see (Madshus, 1988; Casey et al., 2010) for reviews). Recent advances in fluorophores, imaging technology and the ability to examine single cell behavior has led to a new view of the bacterial response to acid and osmotic stress (Chakraborty et al., 2015, 2017). Unlike eukaryotes, it is now appreciated that bacteria can survive and respond to diverse environmental conditions both inside and outside of the host by systematic regulation of stress response genes (Boor, 2006; Krulwich et al., 2011). The long held view was that Gram negative bacteria such as E. coli and S. Typhimurium were neutralophiles, i.e., they maintain their intracellular pH between 7.2 and 7.8 (see Slonczewski et al., 2009; De Biase and Lund, 2015 for reviews). For strong acids and pH values down to ∼5.0, it was reported that the periplasm rapidly equilibrated with the external medium, but the cytoplasm showed only transient acidification before returning to its normal pH of ∼7.4 (Wilks and Slonczewski, 2007; Slonczewski et al., 2009). In contrast, recent studies in single cells using fluorescence microscopy and the pH-sensitive fluorophore BCECF-AM reported that E. coli and S. Typhimurium were acidified in response to both acid and osmotic stress and acidification was maintained for > 90 min (Chakraborty et al., 2017). In vivo measurements of S. Typhimurium inside macrophage vacuoles using a FRET DNA biosensor termed the I-switch, also reported prolonged acidification (Chakraborty et al., 2015). The mechanism is now established: the global regulator OmpR (best known for its regulation of outer membrane proteins) plays a central role in the bacterial response to acid and osmotic stress (Stincone et al., 2011; Quinn et al., 2014; Chakraborty et al., 2015, 2017), resulting in a substantial reprograming of the bacterial transcriptome. The observation that the cytoplasm was acidified as a consequence of both acid and osmotic stress (Chakraborty et al., 2017), also explains why previous studies reported that acid-induced genes were also induced in response to osmotic stress (De Biase et al., 1999; Kitko et al., 2010).
Environmental stress pathways in bacteria, including acid and osmotic stress, are regulated by two-component regulatory systems (TCRS). These TCRSs employ a sensor histidine kinase, which is most often embedded in the cytoplasmic membrane. The second component is a response regulator, which usually functions as a transcription factor that binds DNA and regulates transcription. The two components communicate via a series of phosphorylation reactions involving autophosphorylation of the kinase on a conserved histidine residue, followed by phosphoryl transfer to an aspartate on the response regulator. The EnvZ/OmpR TCRS is best known for its role in regulating expression of outer membrane porins OmpF and OmpC in response to osmotic stress (Walthers et al., 2005; Anand and Kenney, unpublished).
In most cases, the signaling process by histidine kinases is not well understood. However, in the case of the EnvZ kinase, previous studies using hydrogen-deuterium exchange mass spectrometry established that the sensor was a seventeen amino acid peptide that flanked the phosphorylated histidine (Wang et al., 2012). It was surprising that the sensor was located in the cytoplasm and the cytoplasmic domain alone (EnvZc) was capable of sensing without being in the membrane (Wang et al., 2012), although the presence of the transmembrane domains increased the dynamic range of the response (Ghosh et al., 2017). These studies provided a new view of cytoplasmic signaling by histidine kinases (Wang et al., 2012; Foo et al., 2015a), which led to the proposal that intracellular acid stress was a driver of metabolic reprogramming in response to both acid and osmotic stress (Chakraborty et al., 2015, 2017). More recently, others have shown that additional histidine kinases are capable of intracellular signaling, although most studies are still lacking in mechanistic detail (Eguchi and Utsumi, 2014; Choi and Groisman, 2016; Sen et al., 2017).
During acid stress in S. Typhimurium and E. coli, OmpR contributes to cytoplasmic acidification by repressing the cadC/BA operon (Chakraborty et al., 2015, 2017). CadC is in the OmpR subfamily of response regulators and normally it activates transcription of cadBA. CadA is a lysine decarboxylase, which consumes a proton during decarboxylation. The product, cadaverine, is then transported out of the cell by the CadB antiporter. Repression of cadC/BA by OmpR thus prevents neutralization. Because the pH optima of the CAD system is 6.1–6.5 (Cheeseman and Fuller, 1968), it is the most important acid stress system when S. Typhimurium is in the vacuole during infection inside the host (Chakraborty et al., 2015).
OmpR also promotes acidification in response to osmotic stress, but different pathways are involved. In S. Typhimurium, OmpR represses the alternative stationary phase sigma factor, rpoS, relieving RpoS repression of yghA. YghA is a putative oxidoreductase that is predicted to produce protons (Chakraborty et al., 2017). In E. coli, the intracellular pH was less acidic and OmpR regulated different pathways. In E. coli, OmpR represses speF, the ornithine decarboxylation system, which has a higher pH optimum of 7 (Vivijs et al., 2016) compared to the glutamate and arginine decarboxylation systems (pH optima 4 and 5, respectively) (Bearson et al., 2009). Normally, ornithine decarboxylase decarboxylates arginine, consumes protons and produces putrescine, which allows for recovery from acidification. Repression of speF by OmpR prevents recovery at high osmolality (Chakraborty et al., 2017).
In E. coli MG1655, whole-genome expression profiling identified acid-responsive genes including: chaperones, regulators and genes involved in metabolism (e.g., glutamine decarboxylase) and some genes associated with the cell envelope. (Tucker et al., 2002). In another study, the E. coli response to mild and strong acidic conditions was compared, revealing a complex transcriptional program that was dependent on OmpR and the switch between aerobic and anaerobic growth (Stincone et al., 2011). OmpR was connected to genes involved in pyruvate metabolism and glycolysis, signal transduction and transport and some components of the glutamate decarboxylation (GAD) system. Direct OmpR targets were not identified, most likely because OmpR regulation of acid stress pathways occurs most commonly via repression of transcription, which has less precise DNA recognition requirements (Chakraborty et al., 2015, 2017). Identification of OmpR binding sites by sequence gazing is difficult, because OmpR has a high non-specific DNA binding component, and makes more phosphate backbone contacts and fewer DNA base contacts than other response regulators (Rhee et al., 2008). Since OmpR showed distinct and differential regulation in response to exogenous stresses, in the present work, we set out to elucidate a comprehensive network of OmpR regulons. We compared the gene expression profiles of wild-type and ompR null strains between the pathogen S. Typhimurium and a non-pathogenic E. coli in response to both acid and osmotic stress. Our analysis of OmpR-regulated genes indicates that it drives a major reprogramming in bacteria in response to acid and osmotic stress.
Materials and Methods
Bacterial Strains and Growth Conditions
Salmonella enterica serovar Typhimurium 14028s and E. coli MG1655 were used throughout this study. To determine the acid and osmotic stress response, bacterial strains were grown in a modified N-minimal medium (MgM), buffered with either 100 mM Tris (pH 7.2 ± 15% (w/v) sucrose) or 100 mM MES (pH 5.6), containing 7.5 mM (NH4)2SO4, 5 mM KCl, 0.5 mM K2SO4, 1 mM KH2PO4, 10 mM MgCl2, 2 mM glucose, and 0.1% Casamino acids. To obtain the growth profiles, cultures of S. Typhimurium and E. coli in Luria Broth (LB) were grown overnight and sub-cultured (1:100) in 5 ml of MgM pH 7.2 for 24 h. The cultures were then sub-cultured (1:50) in either MgM pH 5.6 or pH 7.2 and incubated for an additional 10 h. The optical density at 600 nm was measured hourly and plotted as a function of time (n = 3). The doubling time (Td) was determined by the exponential curve fitting function to generate an equation in the form y = AeBx, where A, B are numbers and x is the time between doubling of y(A600nm). The equation simplifies to Td = ln2/B = 0.693/B.
RNA Isolation and qRT-PCR
Wild-type strains of E. coli and S. Typhimurium were grown in MgM pH 7.2 for 24 h, then sub-cultured (1:50) in MgM pH 5.6, 7.2, and 7.2 with 15% (w/v) sucrose for 5–6 h until the optical density at 600 nm was ∼0.6. Total RNA was isolated, followed by cDNA synthesis and quantification. The mRNA expression level of the target genes was normalized relative to 16S rRNA.
Construction of a gltA Mutant and Over-Expression Strain
The chromosomal copy of gltA from wild-type or an ompR null strain of S. Typhimurium and E. coli was replaced by tetRA using λ-Red recombination techniques (Karlinsey, 2007). The gltA over-expressed strains were generated by cloning gltA into plasmid pMPMA5omega placed under control of the arabinose-inducible pBAD promoter by using primer pairs: gltA EcoR1#1F and gltA HindIII#1R. The primers used are listed in Supplementary Table S5.
Fluorescence Measurements of BCECF in S. Typhimurium and E. coli
Cultures of S. Typhimurium and E. coli were pre-incubated with 20 μM BCECF-AM for 60 min before the shift to acidic pHe 5.6, neutral pHe 7.2, or high osmolality pHe 7.2 plus 15% (w/v) sucrose as described in Chakraborty et al. (2015, 2017). Cells were placed on microscope slides (Marienfeld) coated with 1% (w/v) agarose and images were analyzed by ImageJ version 1.42.
Microarray
100 ng of total RNA was labeled with Low Input Quick AMP WT Labeling Kit (Agilent; One-color) following the manufacturer’s instructions. Briefly, 100 ng of total RNA was converted into double-stranded cDNA by priming with an oligo-dT primer containing the recognition site for T7 RNA polymerase. In vitro transcription with T7 RNA polymerase was used to produce cyanine 3-CTP labeled cRNA. 600 ng of labeled cRNA was hybridized onto an Agilent SurePrint HD GE 8X15 Microarray (E. coli) or Agilent SurePrint G3 custom GE 8X60 Microarray (S. Typhimurium) for 17 h at 65°C, 10 rpm in an Agilent hybridization oven. After hybridization, the microarray slide was washed in gene expression buffer 1 (Agilent wash buffer kit) for 1 min at RT and another minute in gene expression buffer 2 (Agilent wash buffer kit) at 37°C before scanning on an Agilent High Resolution Microarray Model C Scanner. The results of gene expression profiles are accessible on the Gene Expression Omnibus (GEO) platform with accession number Microarray data GEO submission GSE106629.
Data Analysis
DAVID Functional Annotation was used to identify gene clusters, which measures relationships among the annotation terms based on the degrees of their co-association genes to different groups. The “Category” column in Supplementary Table S2B represents the original database or resource where the term originates. DAVID consists of a total of 14 annotation categories, which are all collected in the DAVID knowledgebase such as Gene ontology, Biological process, Molecular function, Cellular component, KEGG pathway, Biocarta pathway, Up keywords, BBID pathway, SMART domain, NIH genetic association, UNIPROT sequence feature, KOG ontology, NCBI OMIM and the Interpro domain. The Kyoto Encyclopedia of Genes and Genome (KEGG) is one such database. The next column in Supplementary Table S2B, “Term,” represents the pathway maps to facilitate biological interpretation in a network context. “Count” signifies the number of genes involved in the process. The P-value indicates the threshold of EASE Score, a modified Fisher Exact P-Value, for gene-enrichment analysis. Fisher Exact P-Value = 0 represents perfect enrichment. P-Value ≤ 0.05 is considered to be strongly enriched. “Benjamini” is one of the multiple testing correction techniques used to control family-wide false discovery rate. Functional Annotation Clustering integrates the same techniques of Kappa statistics to measure the degree of the common genes between two annotations. Based on Kappa statistics, more common genes are likely to be grouped together in one cluster. Thus, the presence of genes in more than one cluster represents multiple functions or association between two networks. The non-cluster category in Supplementary Table S2B represents multiple genes having varying biological functions, which cannot be put under one single cluster. The non-cluster generally represents the total pool of genes. Significance analysis was performed using Student’s t-test with Benjamini-Horchberg False Discovery Rate (FDR) correction and fold change analysis. The comparison involving 3 conditions was analyzed with the Analysis of Variance (ANOVA) with FDR correction, followed by a post hoc testing (Turkey HSD test) and fold change analysis.
Atomic Force Microscopy
A 703 base pair (bp) region from the gltA promoter was gel-purified using the QIAquick Gel Extraction Kit (Qiagen) by using primer pairs gltA F and gltA R for S. Typhimurium (-689 bp to + 14 bp) and for E. coli (-694 bp to + 9 bp), respectively. A glutaraldehyde-modified mica surface was prepared as described in Chakraborty et al. (2017). Ten nanograms of the gltA regulatory region was incubated with 30 nM OmpR for 15 min at RT. This mixture was then deposited on the mica for 15 min. Images were acquired on a Bruker Dimension FastScan AFM system using the tapping mode with a silicon nitride cantilever (FastScan C, Bruker). Raw AFM images were processed using Gwyddion software1.
Results
Acid Stress Does Not Affect Cell Growth
We were interested in understanding the role of OmpR in the acid stress response. To address this, we first examined whether loss of OmpR led to a growth defect during acid stress. In Figure 1, the growth profiles of S. Typhimurium and E. coli wild-type and isogenic ompR null strains at neutral and acid pH were compared. At neutral pH, the growth of the wild-type and the ompR null strain of S. Typhimurium was nearly identical (ΔompR Td = 94% of wild-type, Figure 1C). At acid pH, the growth of the ompR null strain was similar to the wild-type growth at neutral pH. However, the wild-type strain grew more slowly (Td = 87% of Td at neutral pH, Figure 1C) at acid pH (top panel). In E. coli the differences were similar to S. Typhimurium, although the Tds were all slightly faster (Figures 1B,C). Under these growth conditions, we previously measured the intracellular pH of wild-type S. Typhimurium (pHi = 6.15) and E. coli (pHi = 6.55) after 90 min exposure to pHe 5.6 (see Supplementary Table S1). Thus, acid stress has only minor effects on S. Typhimurium and E. coli growth.
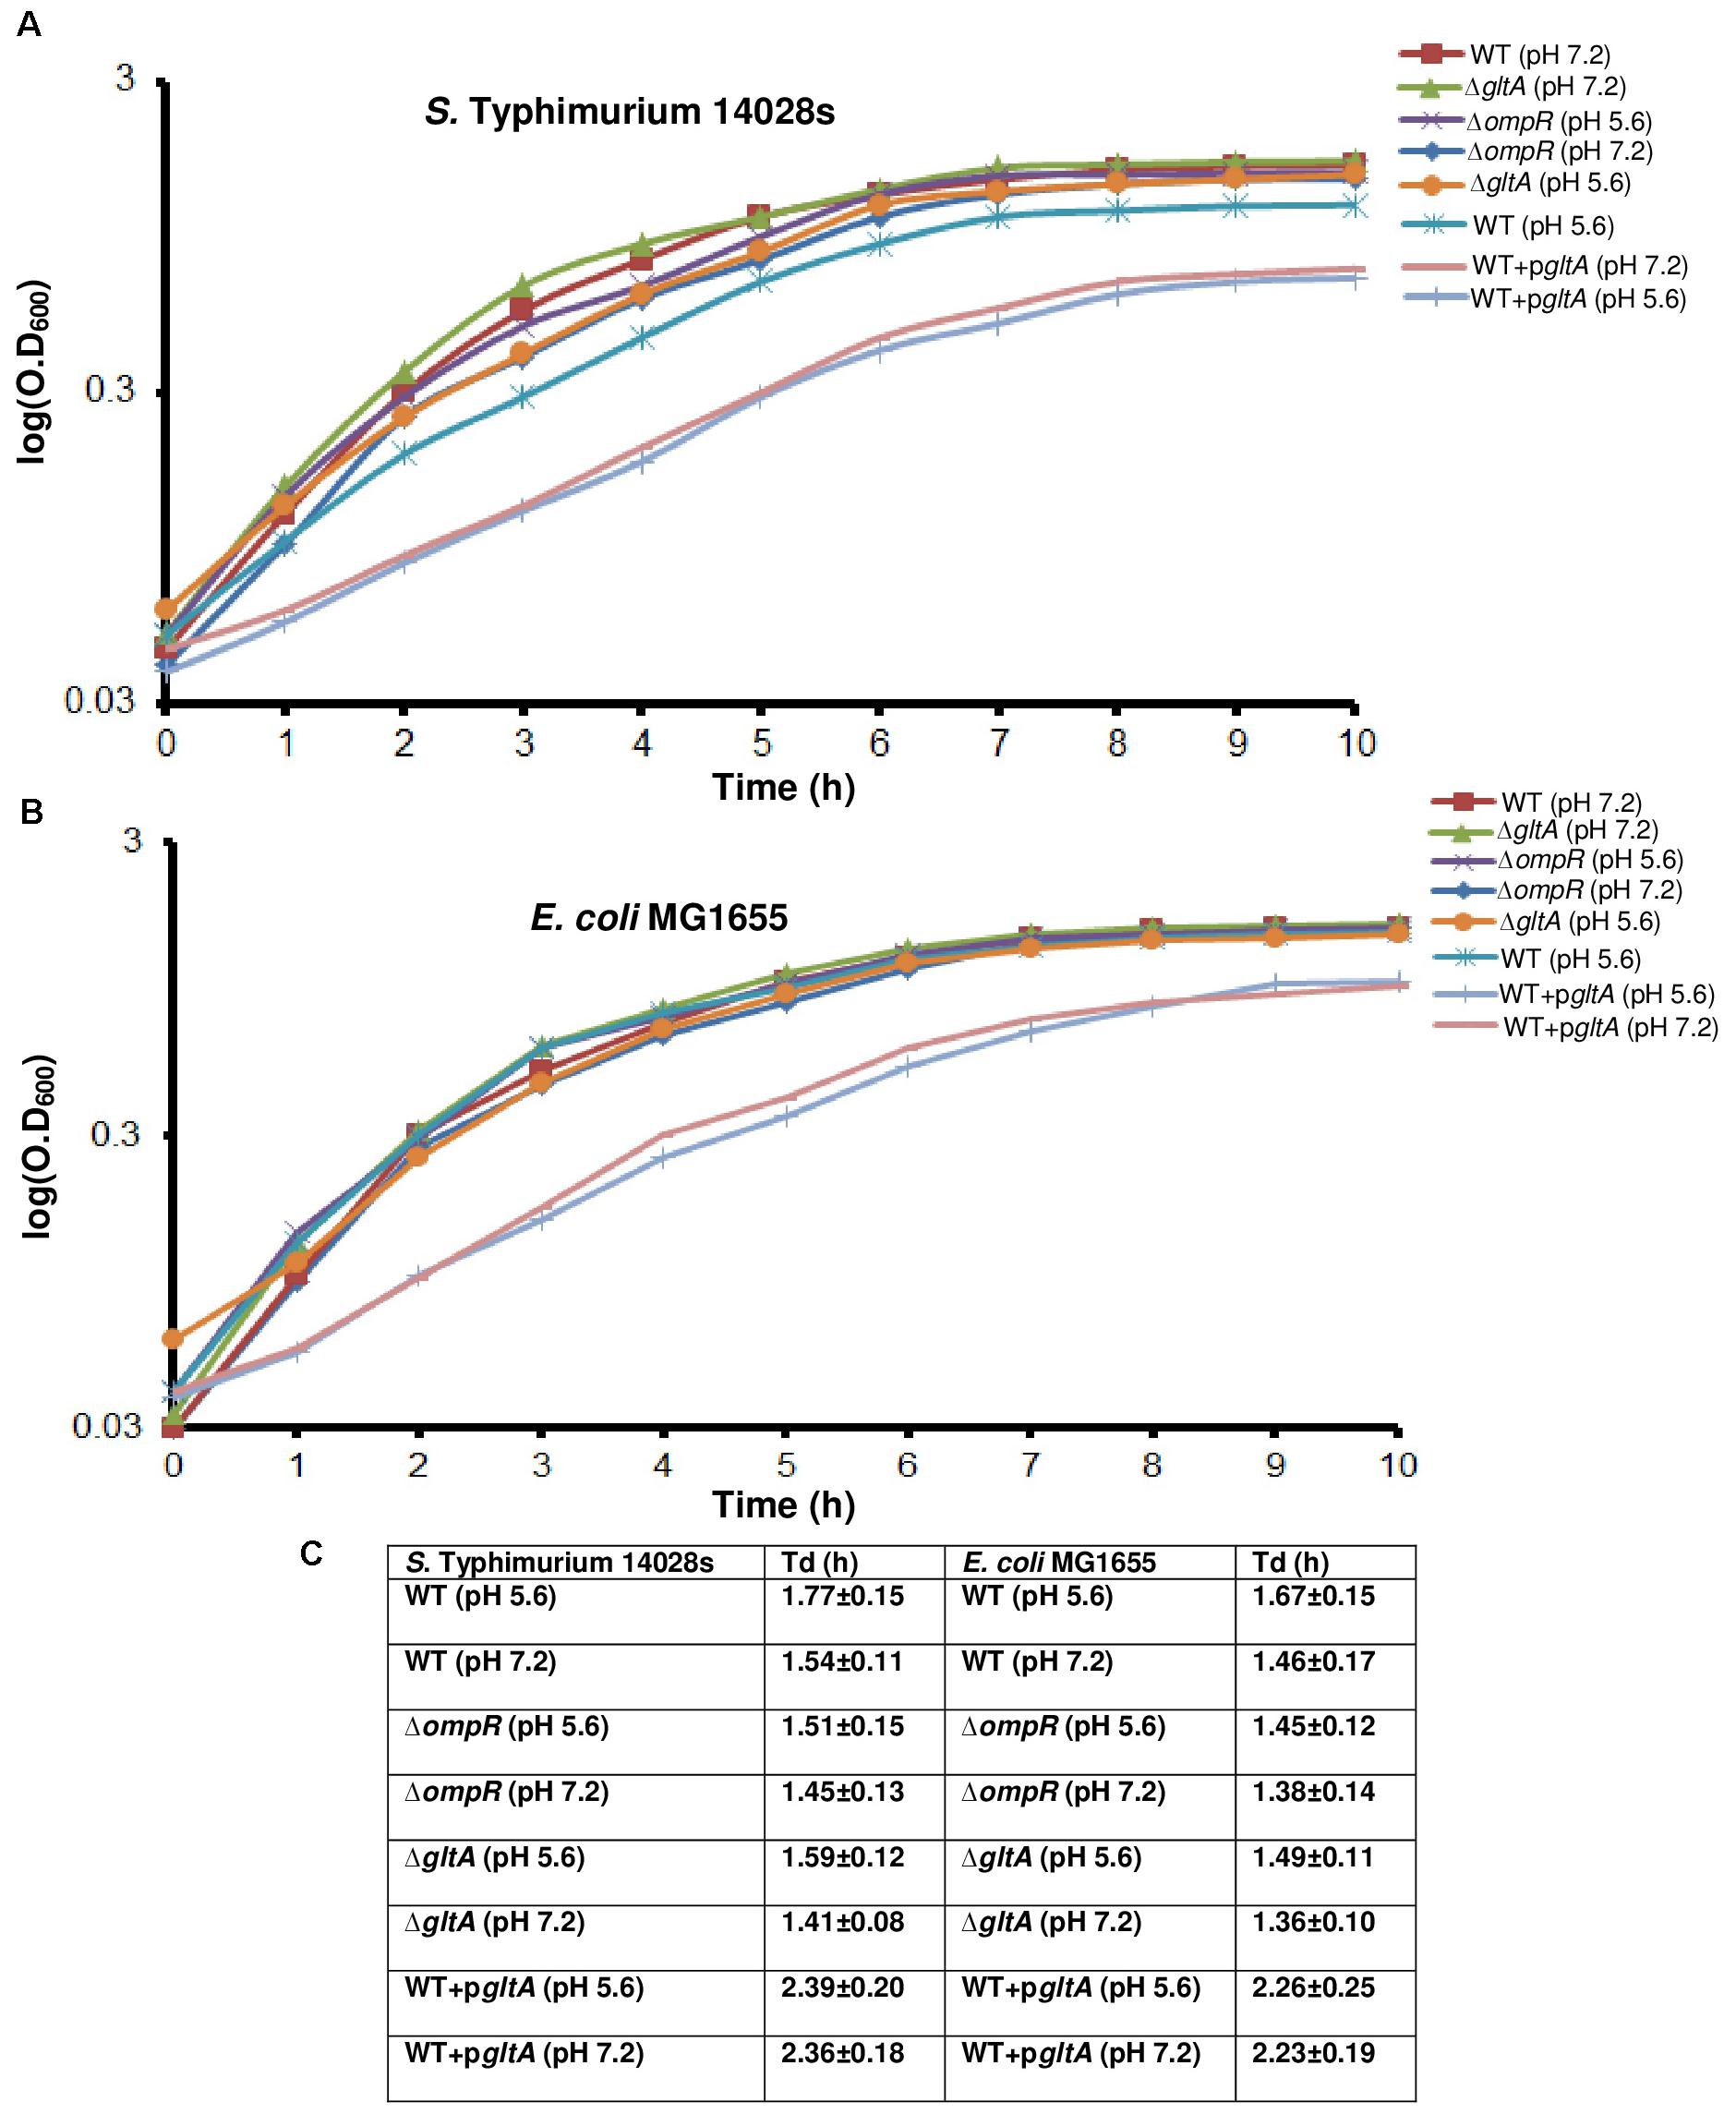
FIGURE 1. The effect of acid pH on growth curves of S. Typhimurium and E. coli. Wild-type, an ompR null mutant, a gltA null mutant and a gltA over-expressed strain of (A) Overnight cultures of S. Typhimurium and (B) E. coli grown in LB were sub-cultured (1:100) in MgM pH 7.2 for 24 h. The cultures were then sub-cultured again (1:50) in MgM pH 5.6 or pH 7.2 for an additional 10 h as described in Materials and Methods. The optical density at 600 nm (O.D.600) was measured hourly to monitor bacterial growth (n = 3). Strains in which gltA was over-expressed exhibited growth defects at neutral and acid pH compared to the wild-type and ompR null strains in both S. Typhimurium and E. coli. The error bars were removed to make the graphs legible. (C) The doubling time (Td) was plotted as determined from the exponential curve fitting function as described in Materials and Methods. Error bars represent the mean ± standard deviation (n = 3).
Acid Stress Does Not Affect ompR Transcript Levels
Because cytoplasmic acidification during acid and osmotic stress was dependent upon OmpR, we first examined whether ompR was up-regulated during these stress conditions (Figure 2). We measured the ompR transcript levels by quantitative real-time polymerase chain reaction (qRT-PCR) in S. Typhimurium and E. coli after growth in acid or at high osmolality and compared ompR, ompC and ompF levels in the wild-type strains. The levels of ompR were insensitive to an acid pH shift, but increased at high osmolality in S. Typhimurium (2.3-fold) and in E. coli (1.8-fold) (Figure 2). The known ompR-regulated transcripts responded as predicted: ompC levels increased in response to acid pH, but were even higher at high osmolality, whereas ompF was repressed under acid stress compared to neutral pH. At high osmolality, ompF levels decreased in S. Typhimurium and E. coli, but ompF levels in E. coli were similar at acid and neutral pH (Figure 2). The observation that ompR transcripts did not change in acid pH was consistent with our previous studies, where we counted OmpR molecules by PALM imaging of an OmpR-PAmCherry photoactivatable fluorescent protein fusion. There was no difference in OmpR molecules in acidic conditions compared to neutral pH in S. Typhimurium (Liew et al., unpublished), and in E. coli, OmpR numbers were slightly lower at acid pH (Foo et al., 2015b) (see section “Discussion”).
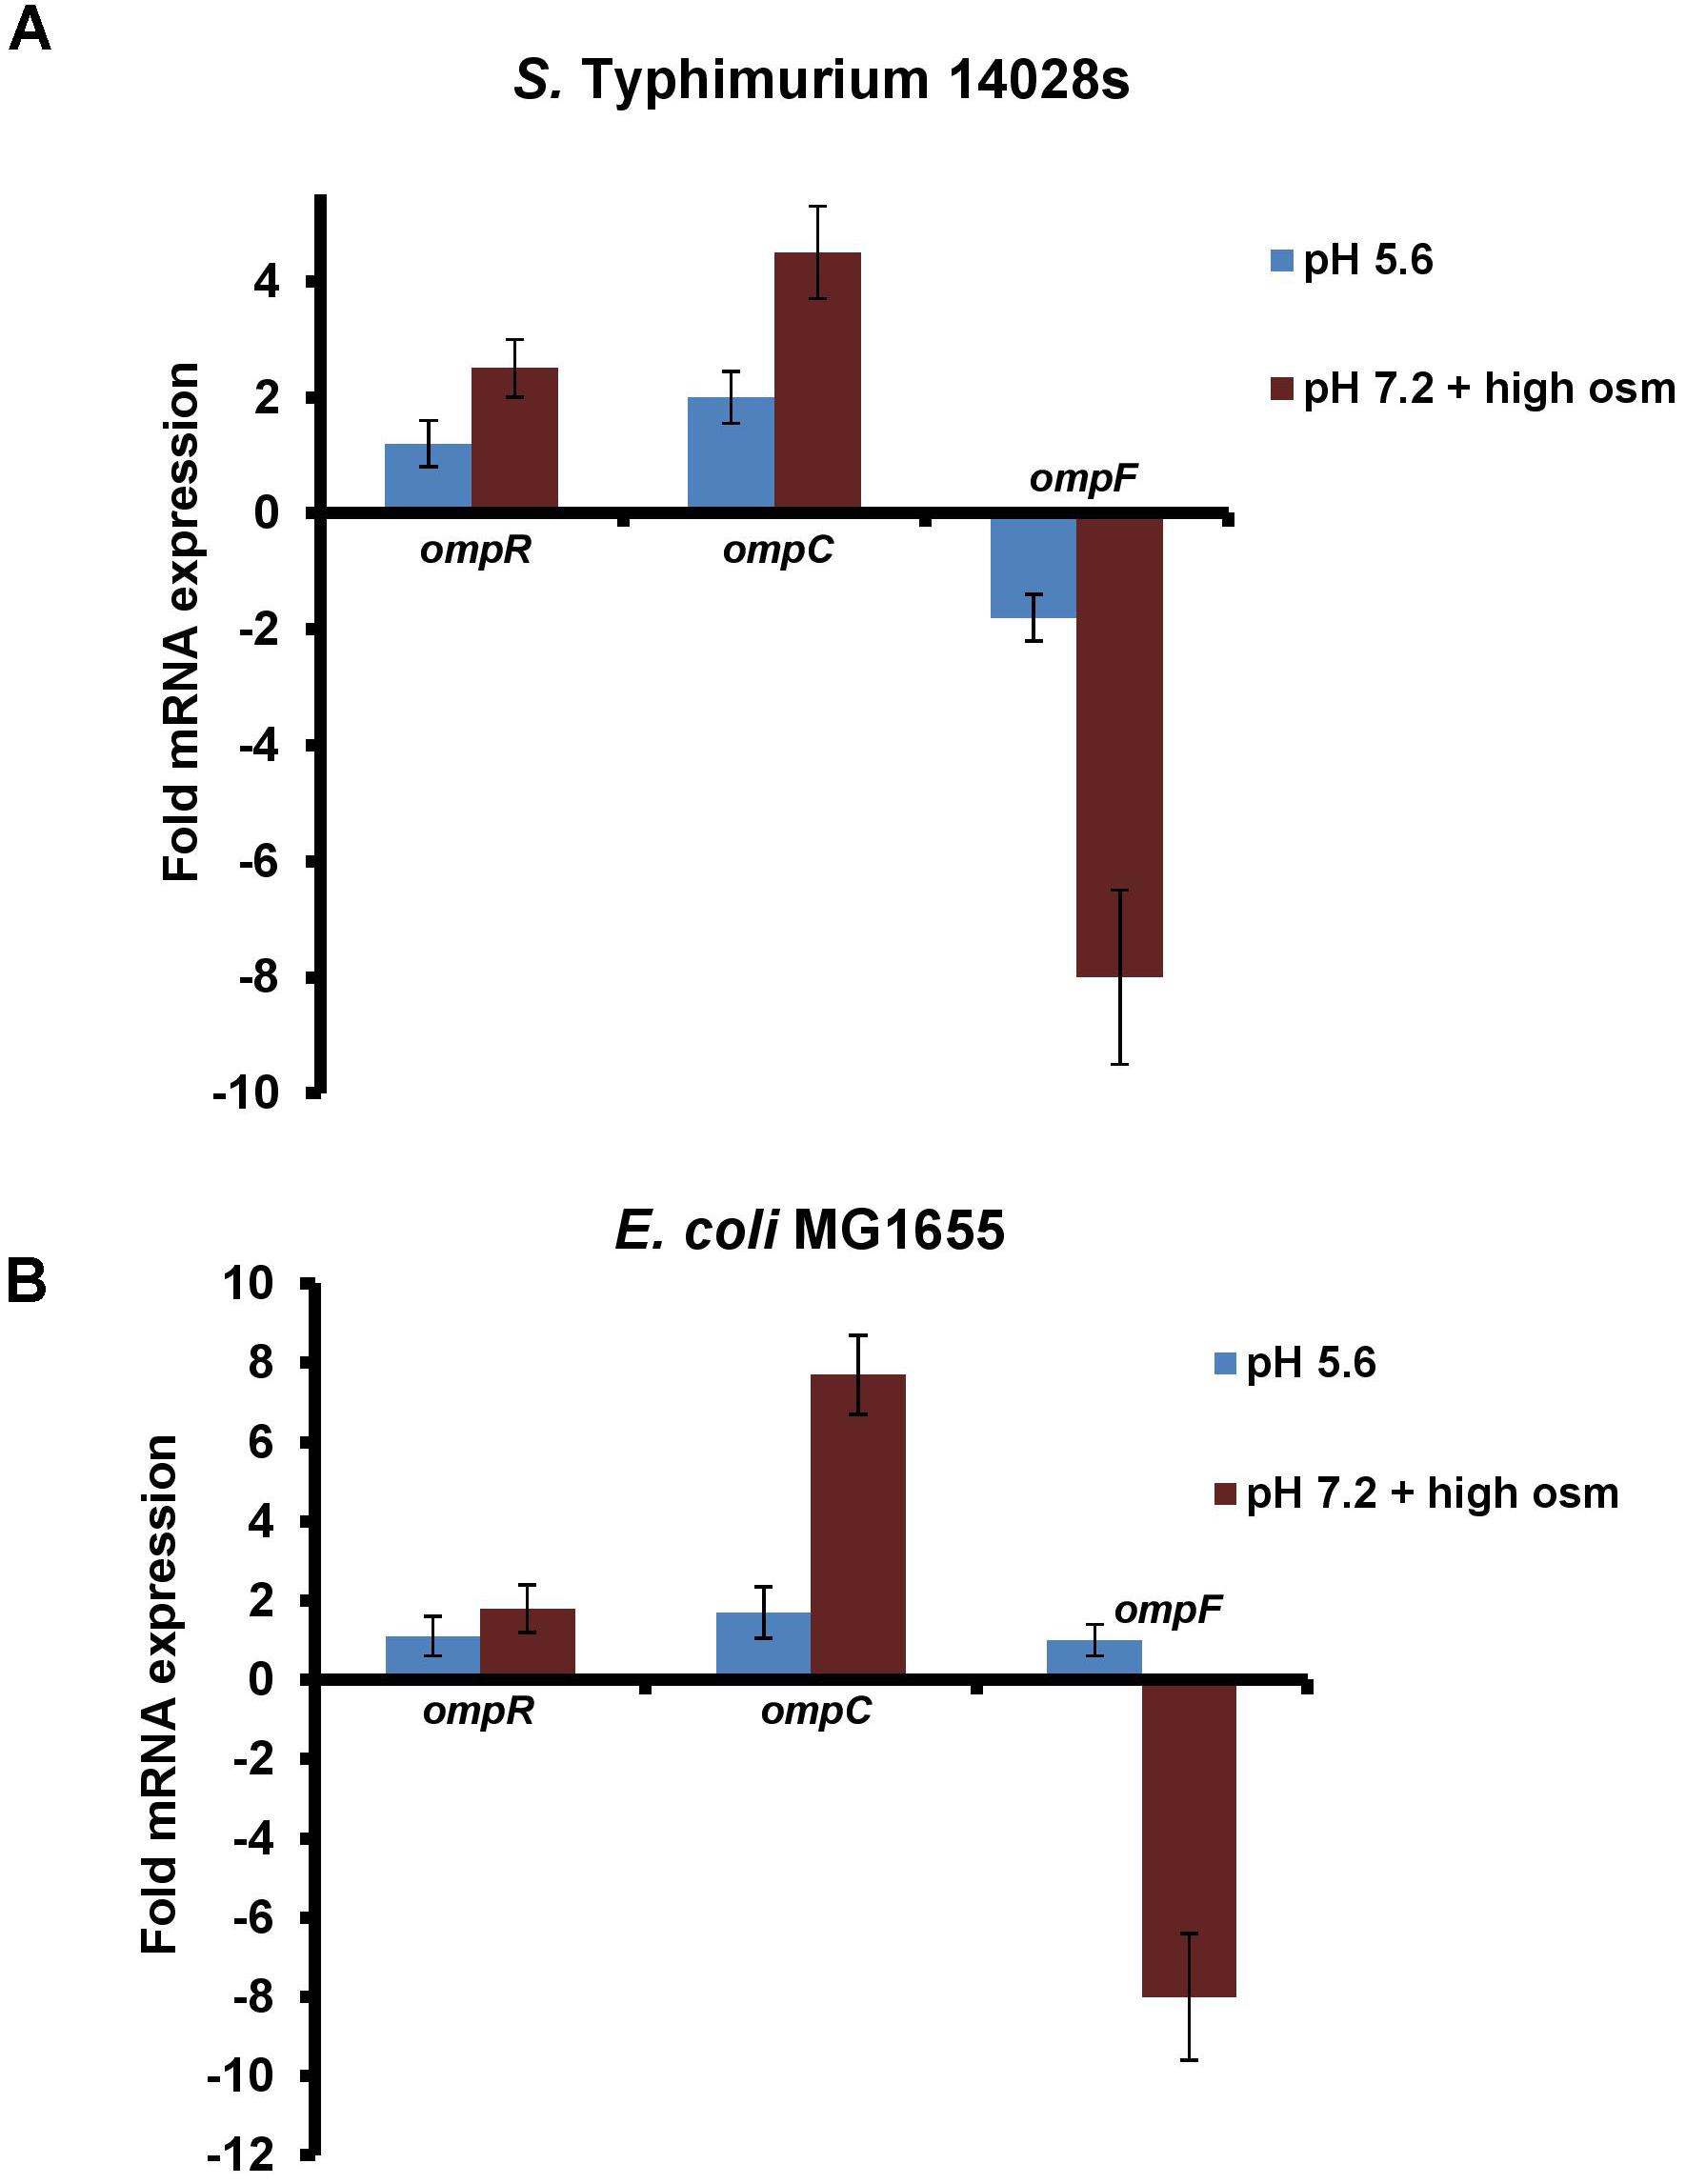
FIGURE 2. ompR transcription in S. Typhimurium and E. coli is insensitive to pH, but increases slightly at high osmolality. (A) The mRNA levels of ompR, ompC and ompF at pHe 5.6 and pHe 7.2 plus 15% (w/v) sucrose were compared to pHe 7.2 by qRT-PCR in the wild-type S. Typhimurium and (B) E. coli strains. The mRNA expression level of the target genes was normalized relative to 16S rRNA. Error bars represent the mean ± standard deviation (n = 3).
Identification of the OmpR Acid Stress Regulon
In order to identify OmpR-dependent pathways induced during acid stress, gene expression profiles between wild-type and an ompR null strain of S. Typhimurium and E. coli were compared. Genes with statistically significant differential expression were required to meet two criteria: a fold change (FC) ≥ 2 and a P-value of ≤ 0.05, as determined by the Student’s t-test (Figure 3). The OmpR acid stress regulon was considerably more extensive in E. coli compared to S. Typhimurium, where a higher number of OmpR affected genes were apparent (1360 vs. 240). In S. Typhimurium, more acid-sensitive genes (78%) were positively regulated by OmpR (Figure 3A), i.e., they were down-regulated when OmpR was absent. In contrast, E. coli was poised in the opposite direction, i.e., OmpR repressed the majority of the acid-responsive genes (71%). As shown in Figure 3B, it was evident that there was significant divergence between S. Typhimurium and E. coli OmpR acid stress regulons, as only 25 targets were common to both organisms. These 25 genes represented <2% of the overall OmpR response in E. coli, but were ∼10% of the S. Typhimurium OmpR-dependent acid stress response (Figures 3B,C).
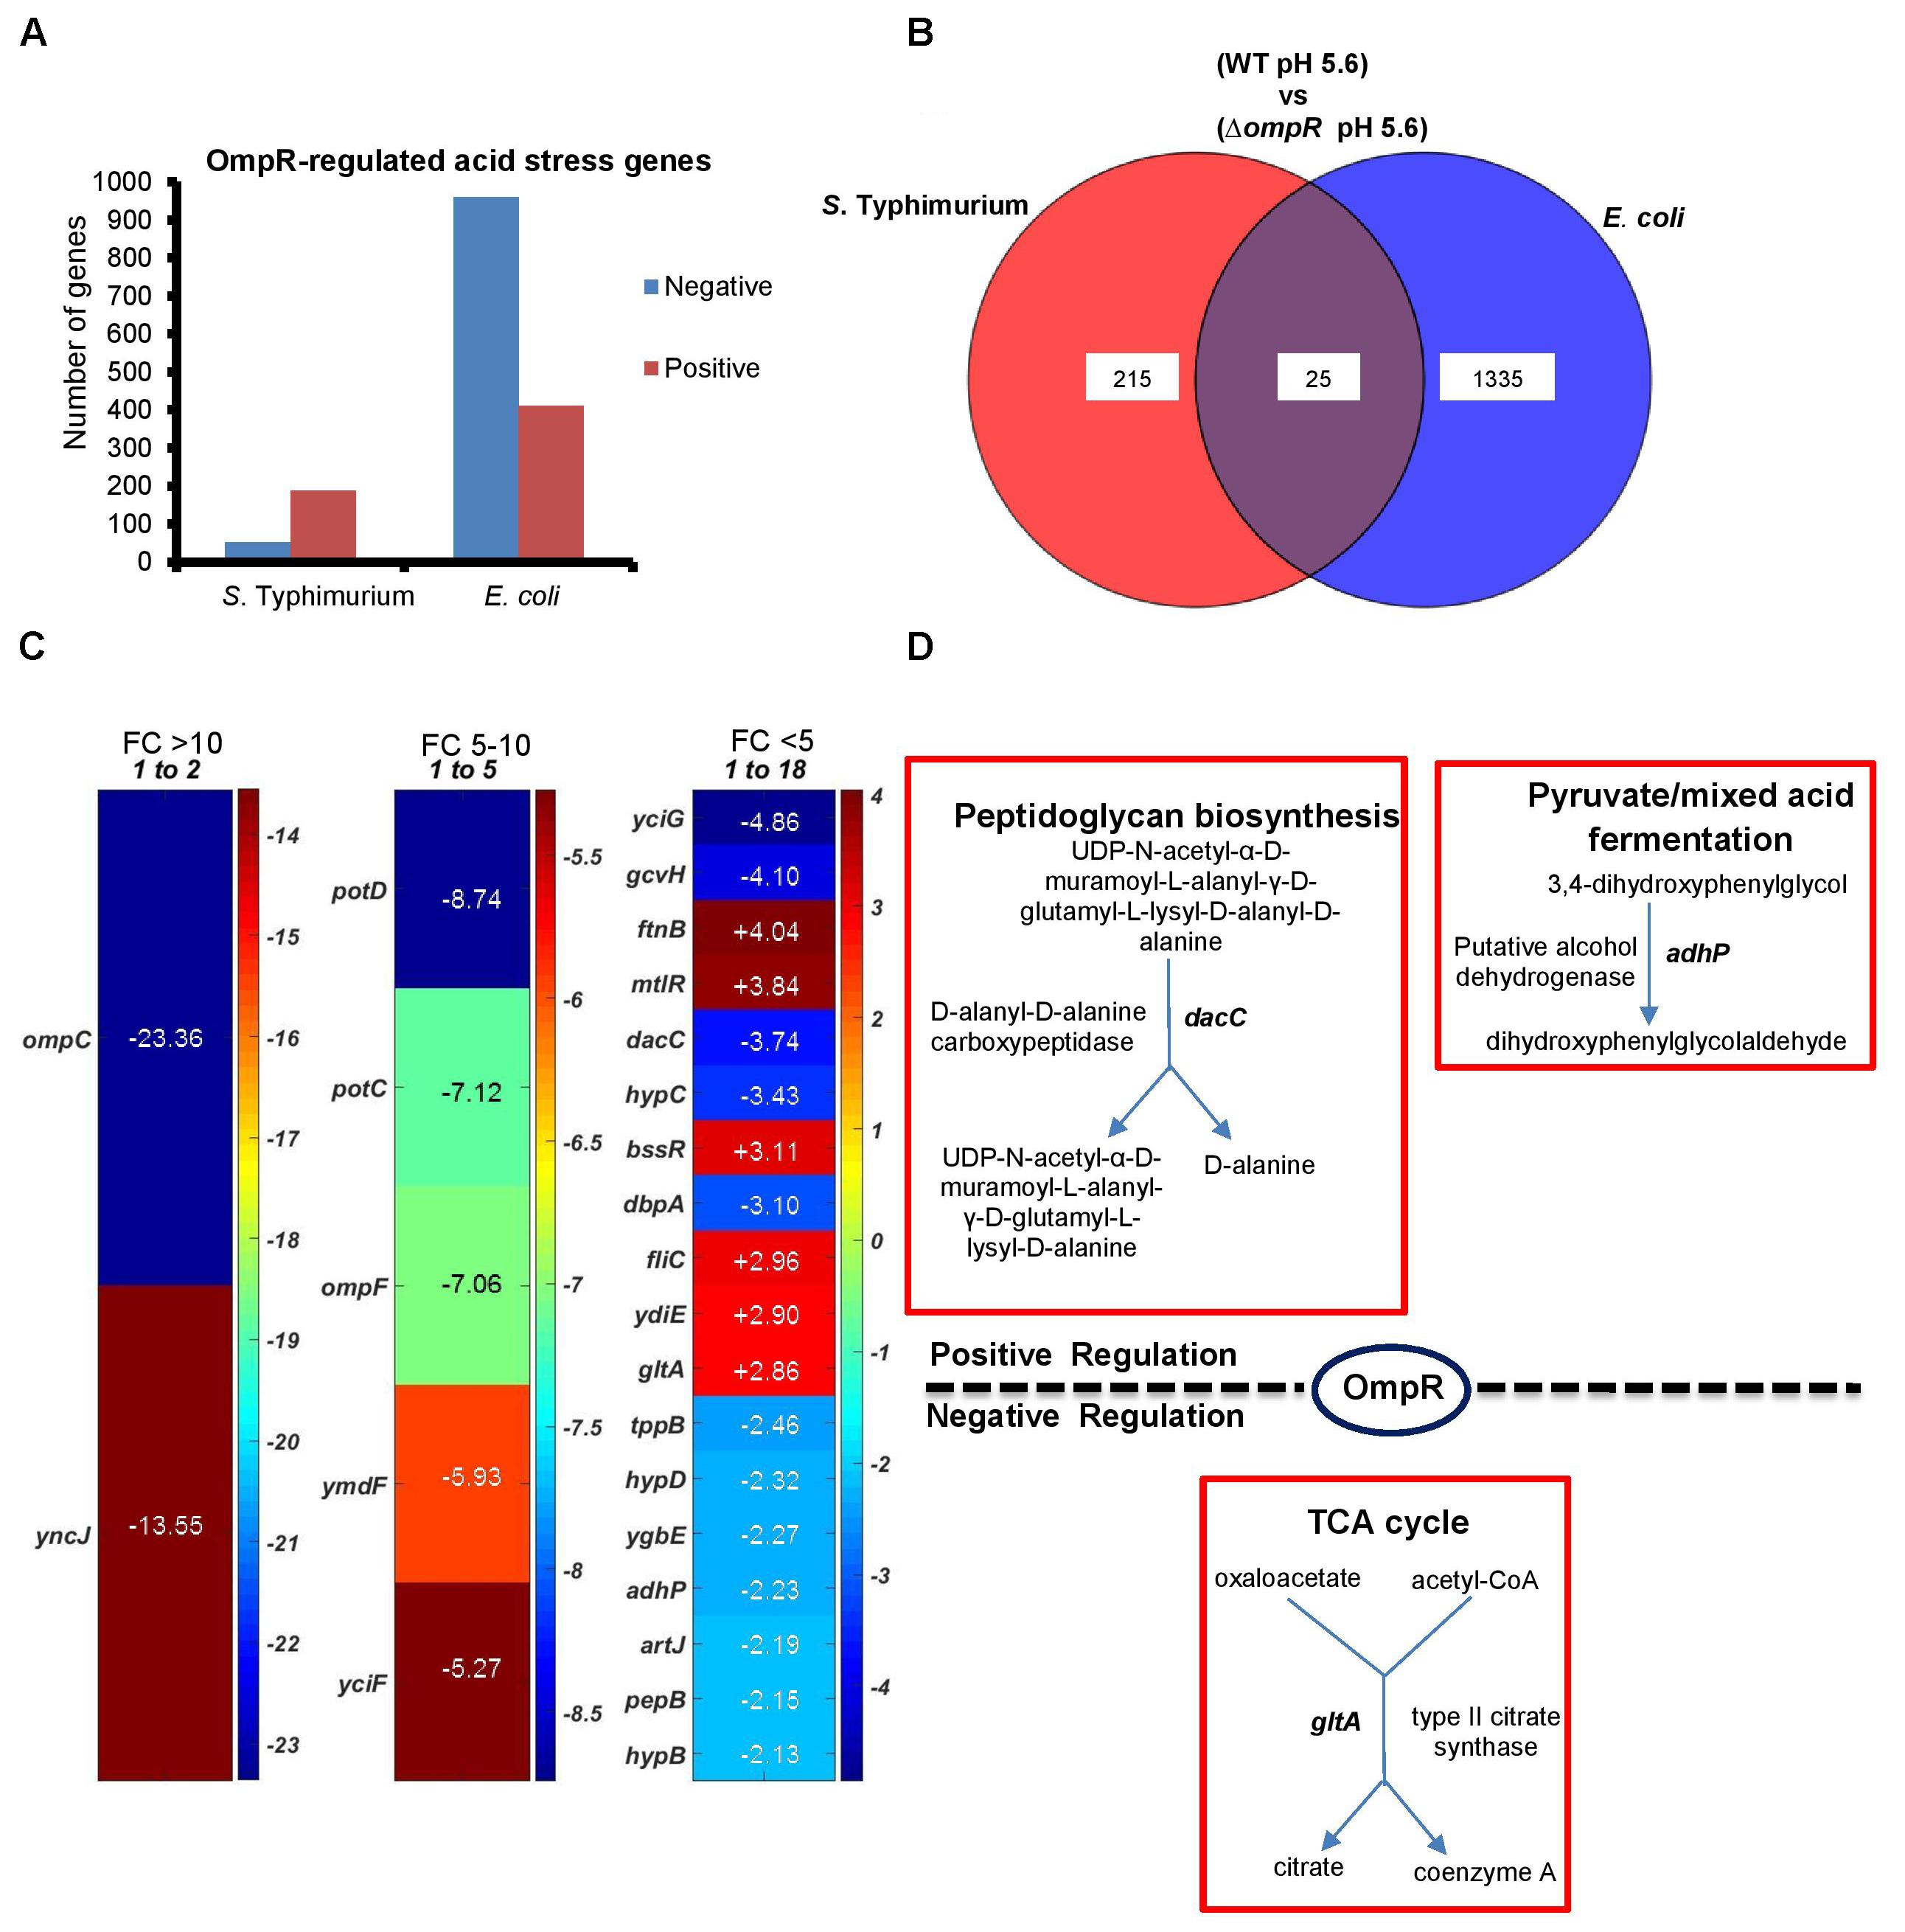
FIGURE 3. Comparison of the ompR acid stress regulons of S. Typhimurium and E. coli (A) The number of OmpR regulated genes (≥ 2-fold change; P-value ≤ 0.05) in S. Typhimurium and E. coli are shown in response to acid stress. (B) Overlap of OmpR acid stress targets between S. Typhimurium and E. coli. (C) A heat map shows the differential expression profiles of common OmpR targets separated into three groups based on the fold change, i.e., ompC was the most highly downregulated-regulated gene at –23.36. A positive number indicates OmpR repression. The fold change represents the expression level of an ompR null strain compared to the wild-type in S. Typhimurium or E. coli during acid stress. The color scale represents the average fold change (n = 3). Supplementary Table S2 provides a detailed description of the overlapping genes. Data processing was performed using MATLAB 6.1 (MathWorks Inc., Natick, MA, United States). (D) Enzymatic reactions and pathways of the common OmpR targets involved in metabolism are shown using PGDB analysis (EcoSal Plus doi: 10.1128/ecosalplus.ESP-0009-2014). Similar algorithms and software tools were used for the remaining microarray analyses.
We used the UniProt Gene Ontology (GO) annotation program to represent the normal molecular function and biological processes of the 25 common targets (Supplementary Table S2A). As intracellular acidification in wild-type S. Typhimurium and E. coli did not result in significant growth defects (Figure 1), we searched for biosynthetic and metabolic pathways and/or for pathways that might prevent accumulation of metabolites or toxins in order to support growth at acid pH. To gain insight into the metabolic functions, significantly differentiated genes were matched with the BioCyc Database collection (PGDB) (Keseler et al., 2011). The OmpR overlapping targets revealed three genes (dacC, gltA and adhP) involved in metabolic pathways (Figure 3D). DacC is a D-alanyl-D-alanine carboxypeptidase that was activated by OmpR (3.7-fold) (see section “Discussion”). OmpR down-regulated the citrate synthase gltA (2.9-fold), which synthesizes citrate from oxaloacetate and acetyl-CoA. A previous report showed that the expression of gltA was inversely proportional to the cell growth rate in E. coli (Park et al., 1994). In another study S. Typhimurium gltA was shown to catalyze the accumulation of 2-methylcitrate, which is deleterious to cell growth (Horswill et al., 2001). In both S. Typhimurium and E. coli, over-expression of gltA resulted in growth defects (Figures 1A,B), as evident by the increased doubling times (Td) at acidic (∼25%) and neutral pH (∼34%) (Figure 1C). Thus, OmpR repression of gltA contributes to optimum growth when S. Typhimurium and E. coli are acidified. A systems biology approach also identified gltA as being down-regulated in response to acid stress (Stincone et al., 2011). Cluster analysis of the common targets in S. Typhimurium and E. coli identified shared functions such as membrane transport (tppB, ompC, ompR, potC, potD, ygbE), biosynthesis of antibiotics and secondary metabolites (adhP, gltA, gcvH, dacC, pepB) and others (see Supplementary Table S2B for the full list).
Analysis of the OmpR Osmotic Stress Regulon
In repsonse to osmotic stress, the cytoplasm of both E. coli and S. Typhimurium was acidified in an OmpR-dependent manner. However, acidification was not as pronounced as during acid stress and the pathways involved were distinct (Chakraborty et al., 2015, 2017). We therefore examined the OmpR regulon in response to osmotic stress. At high osmolality, the number of OmpR-regulated genes was similar between E. coli (875) and S. Typhimurium (764) (Figure 4A). Sixty six OmpR targets that were sensitive to changes in osmolality were overlapping, comprising ∼8–9% of the total OmpR response in either S. Typhimurium or E. coli (Figure 4B).
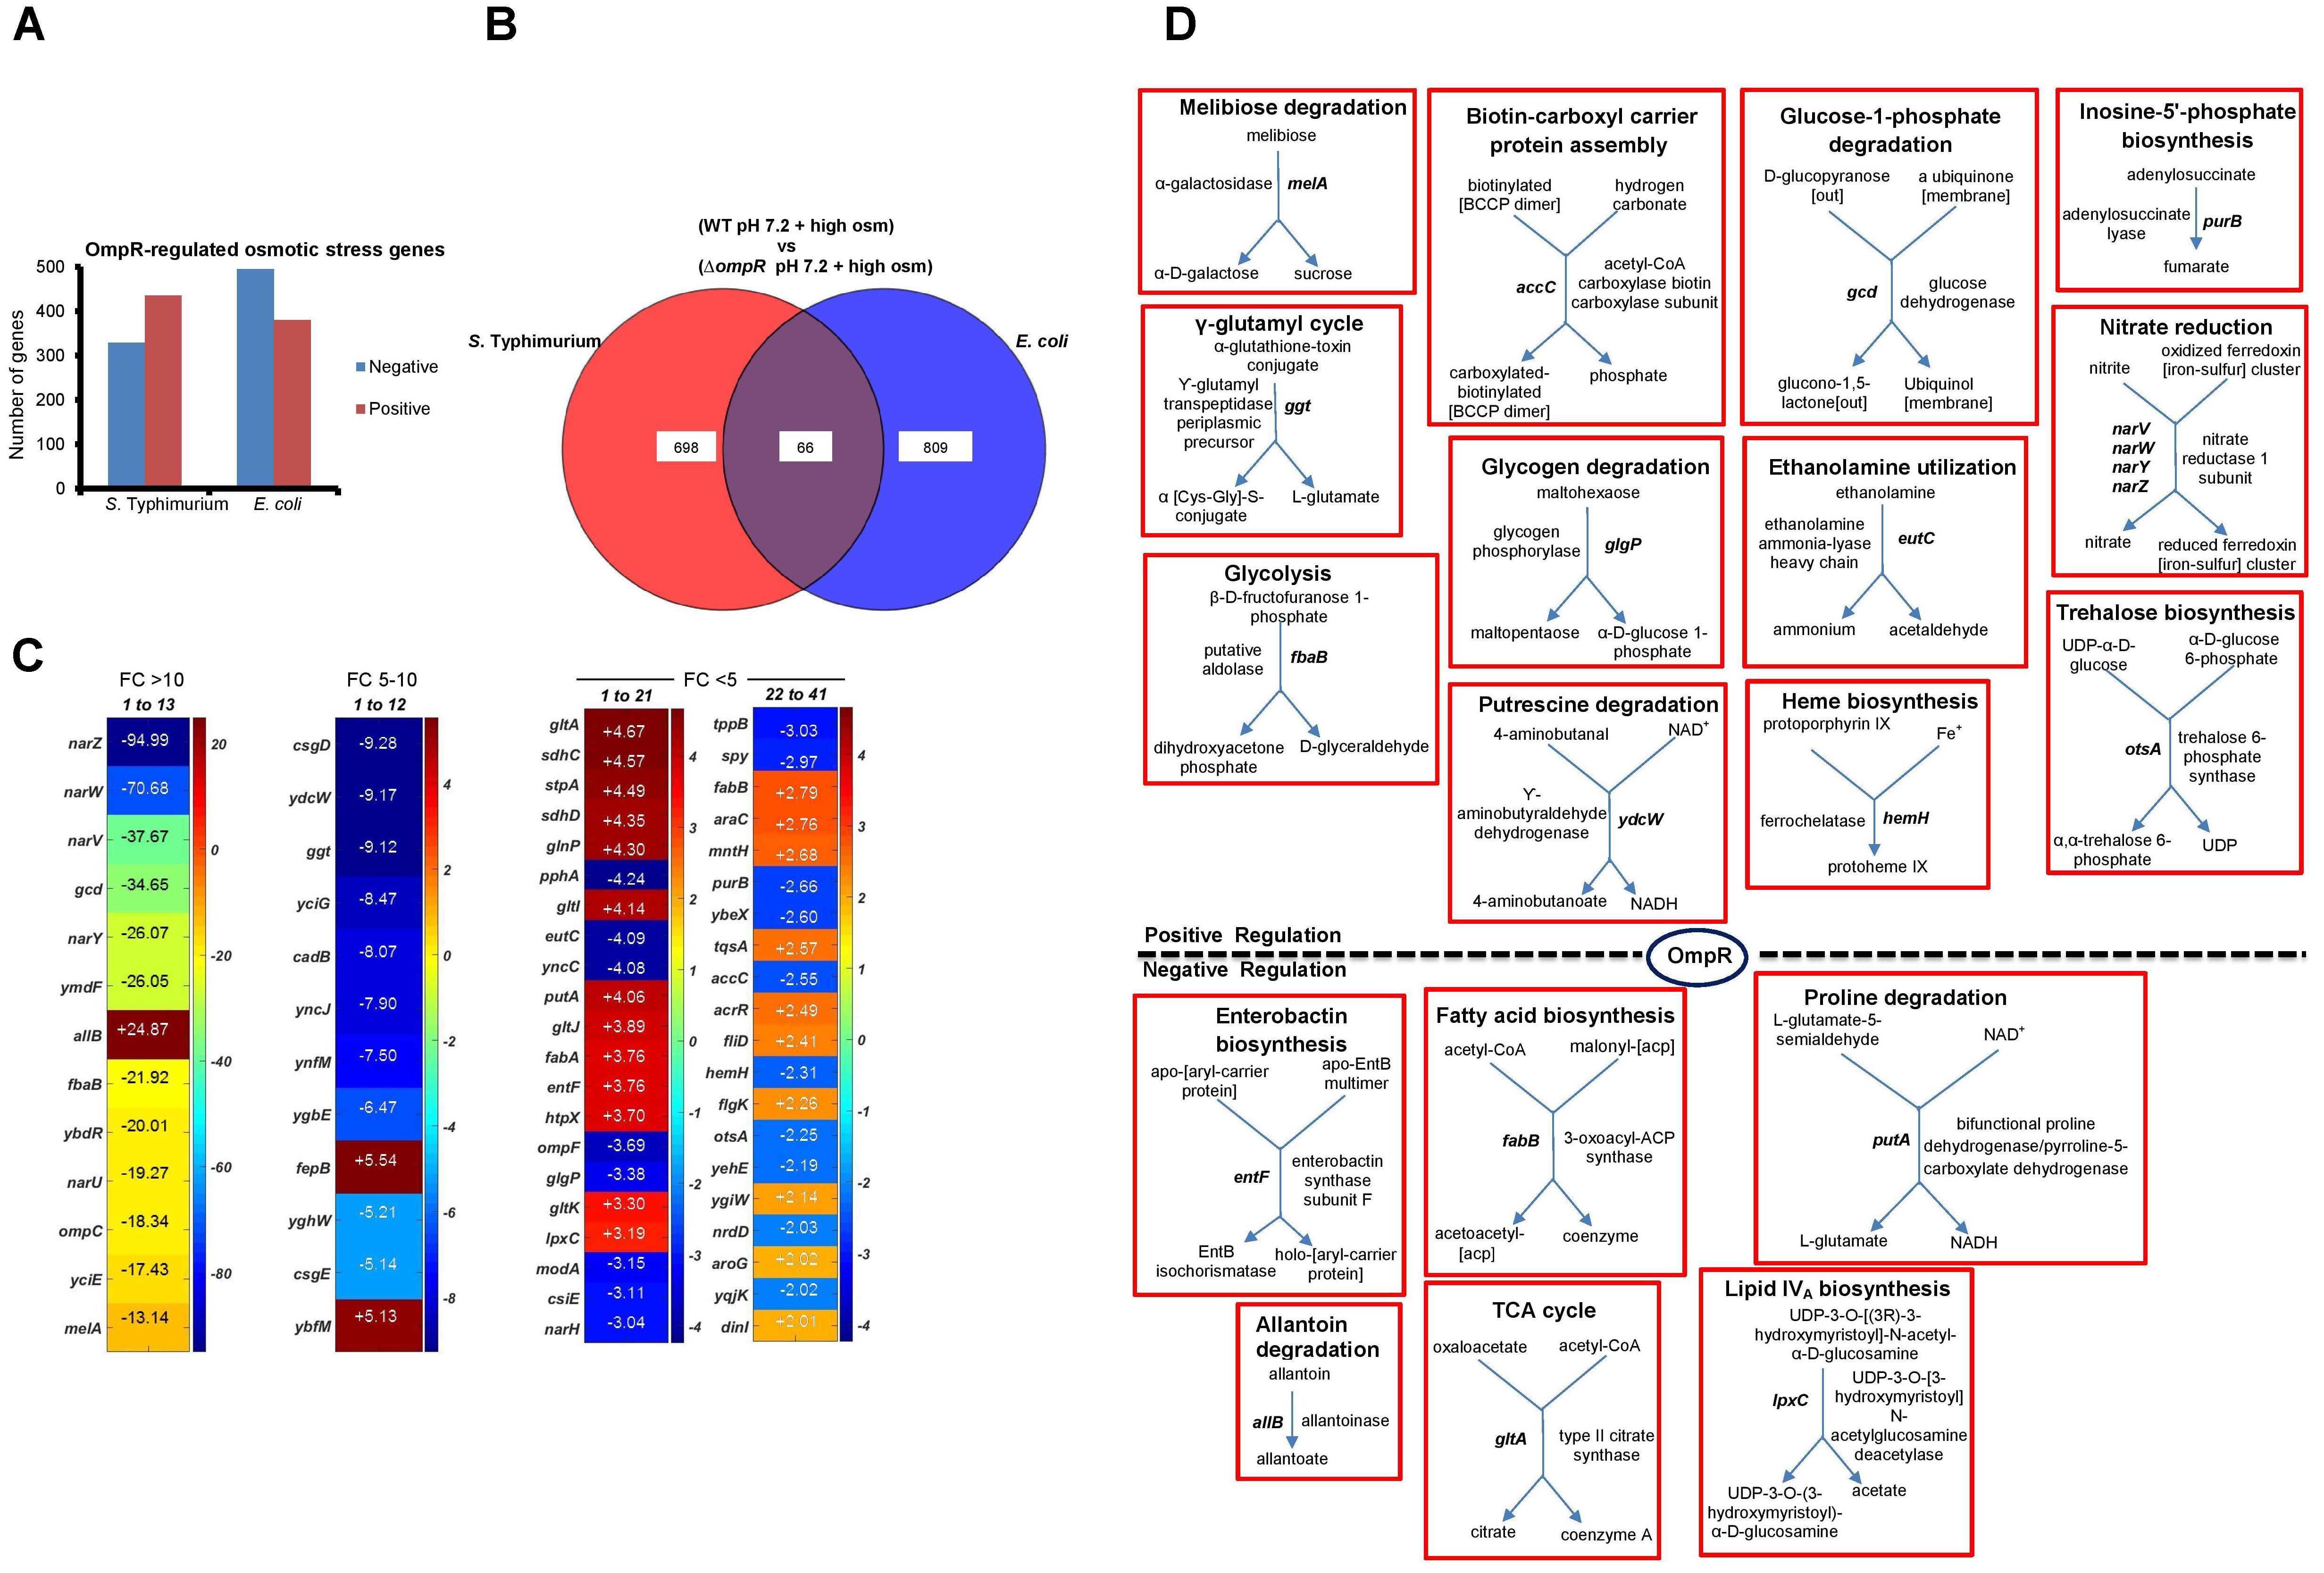
FIGURE 4. Analysis of OmpR osmotic stress-sensitive targets in S. Typhimurium and E. coli. (A) The number of differentially expressed (≥ 2-fold change; P-value ≤ 0.05) OmpR-affected genes in S. Typhimurium and E. coli are indicated. (B) Overlapping OmpR targets between S. Typhimurium and E. coli during osmotic stress are shown. (C) A heat map representing the expression profiles of the overlapping OmpR targets are grouped based on their fold change. The color scale represents the average fold change of ompR null strain compared to the wild-type in S. Typhimurium (n = 3). Supplementary Table S3 details a description of the overlapping genes. (D) Metabolic maps of overlapping OmpR targets involved in cellular processes are shown.
Uniprot GO was used to list the functions of the 66 common OmpR targets (Supplementary Table S3A). Interestingly, genes encoding nitrate reductase such as narZ (95-fold), narW (71-fold) and narV (38-fold) showed the highest decrease in the ompR null strain compared to the wild-type, indicating that they were strongly activated (directly or indirectly) by OmpR (Figure 4C). Growth inhibition by accumulation of nitrate during osmotic stress has been reported in the sulfate-reducing bacterium Desulfovibrio vulgaris (He et al., 2010). Thus, up-regulation of nitrate reductase is a possible mechanism employed by wild-type S. Typhimurium and E. coli to relieve nitrate toxicity at high osmolality. PGDB analysis of the overlapping targets identified 18 genes involved in various metabolic functions (Figure 4D). Cluster analysis identified eight major clusters linked to biological processes, including: nitrate metabolism, membrane transport, biosynthesis of metabolites and amino acids and transcriptional regulation (Supplementary Table S3B).
Common OmpR Targets in Acid and Osmotic Stress
We next identified the OmpR targets that were involved in response to both acid and osmotic stress. In S. Typhimurium, 52 genes were common OmpR targets responsive to both stress pathways (Figure 5A), and in E. coli, 325 genes were common (Figure 5B). Out of these, nine genes were common to the OmpR regulons of S. Typhimurium and E. coli (Figure 5C). Three of the nine genes were again the well-known OmpR targets, ompC, ompF and tppB (Goh et al., 2004). Five genes were of unknown function (Figure 5D and Supplementary Table S4A). These nine genes were grouped into the membrane transport cluster (Supplementary Table S4B).
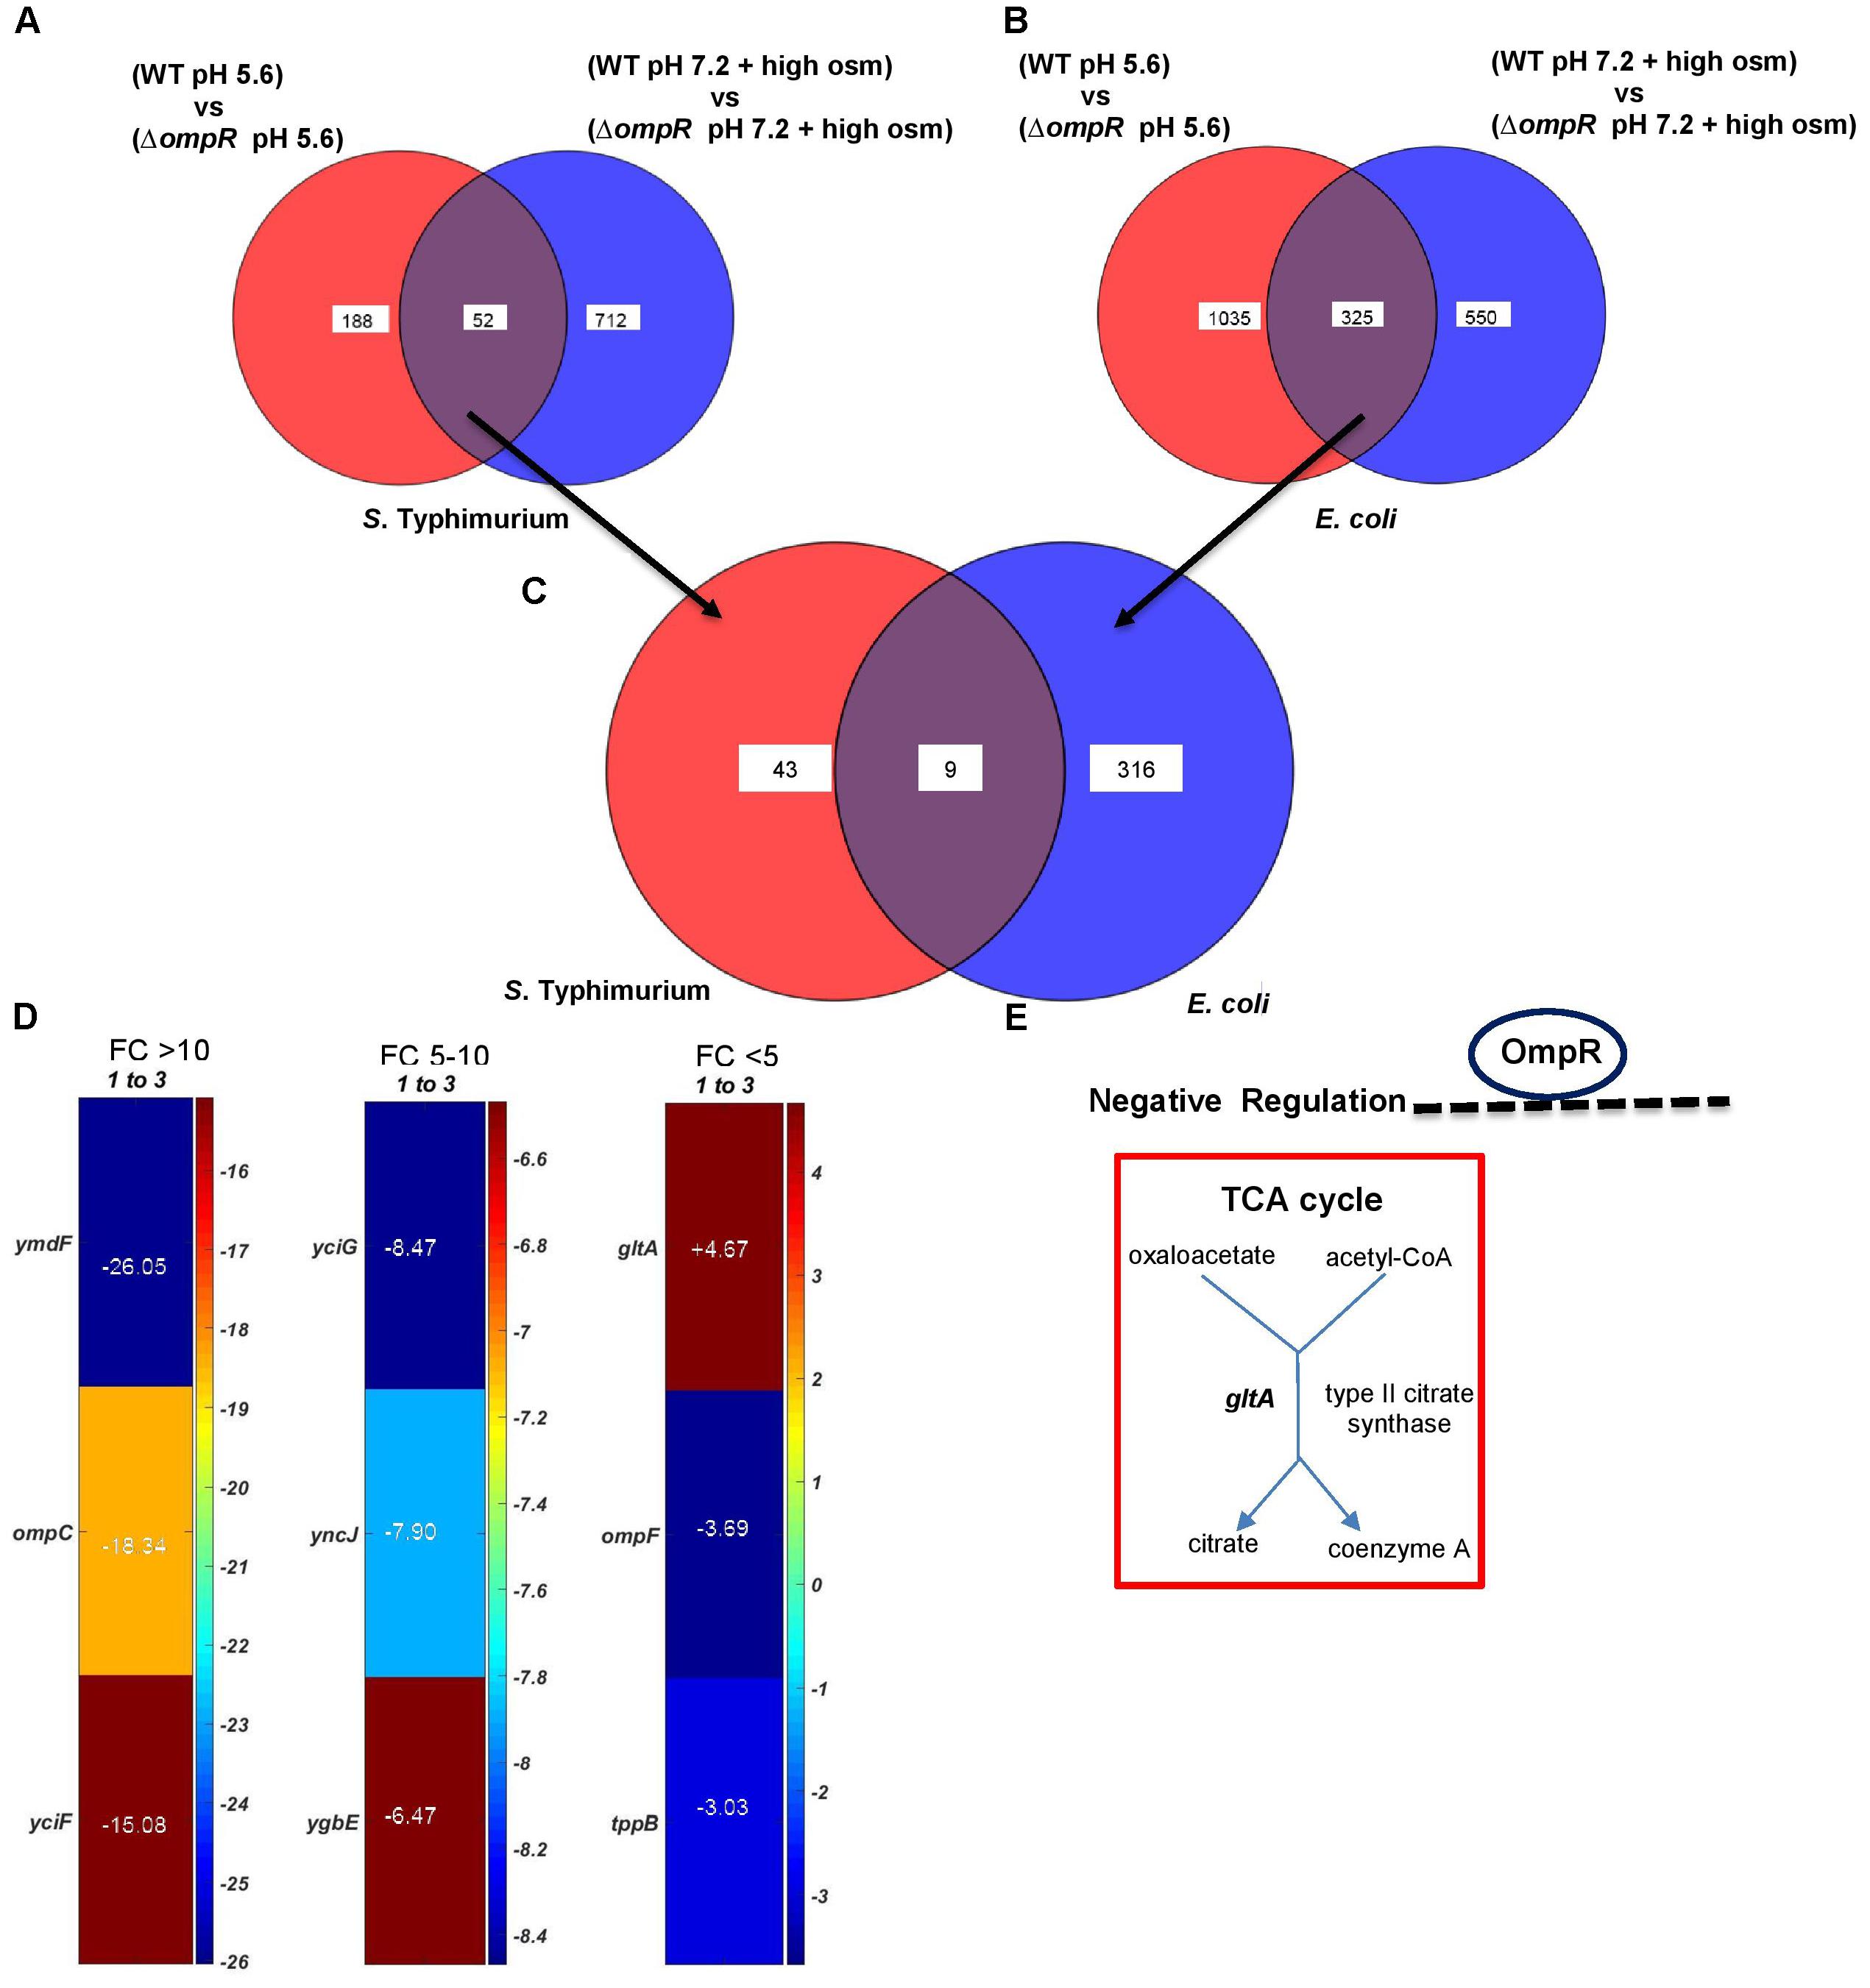
FIGURE 5. Overlapping OmpR acid and osmotic stress targets. Common OmpR targets in (A) S. Typhimurium and (B) E. coli responsive to both acid and osmotic stress are shown. (C) Overlapping genes between (A) and (B) identifies nine common OmpR targets differentially expressed during both pH and osmolality shifts. (D) A heat map shows the expression profiles of the nine common OmpR targets. The color scale represents the average fold change of an ompR null strain of S. Typhimurium compared to the wild-type (n = 3). Supplementary Table S4 provides a detailed description of the overlapping genes. (E) A metabolic map of gltA is shown.
PGDB analysis identified gltA as the sole OmpR target involved in metabolism (Figure 5E). Thus, OmpR repression of gltA appears to play a major role in supressing growth defects upon intracellular acidification in wild-type S. Typhimurium and E. coli in response to both acid and osmotic stress. To determine if gltA was involved in intracellular acidification, we measured the pHi of gltA null strains and strains of S. Typhimurium and E. coli in which gltA was over-expressed in response to both acid and osmotic stress. The gltA null strains were fully capable of cytoplasmic acidification and the pHi was similar to the wild-type in both S. Typhimurium and E. coli (Figures 6A–D). Similarly, in the ΔompR/gltA null strains, the pH was similar to the pH of the ompR null strain. This was not surprising, because citrate synthase (gltA) is not known to be involved in proton exchange. In contrast, the gltA over-expressed strains exhibited a slightly higher intracellular pH (∼0.1 pH unit) compared to the wild-type strains.
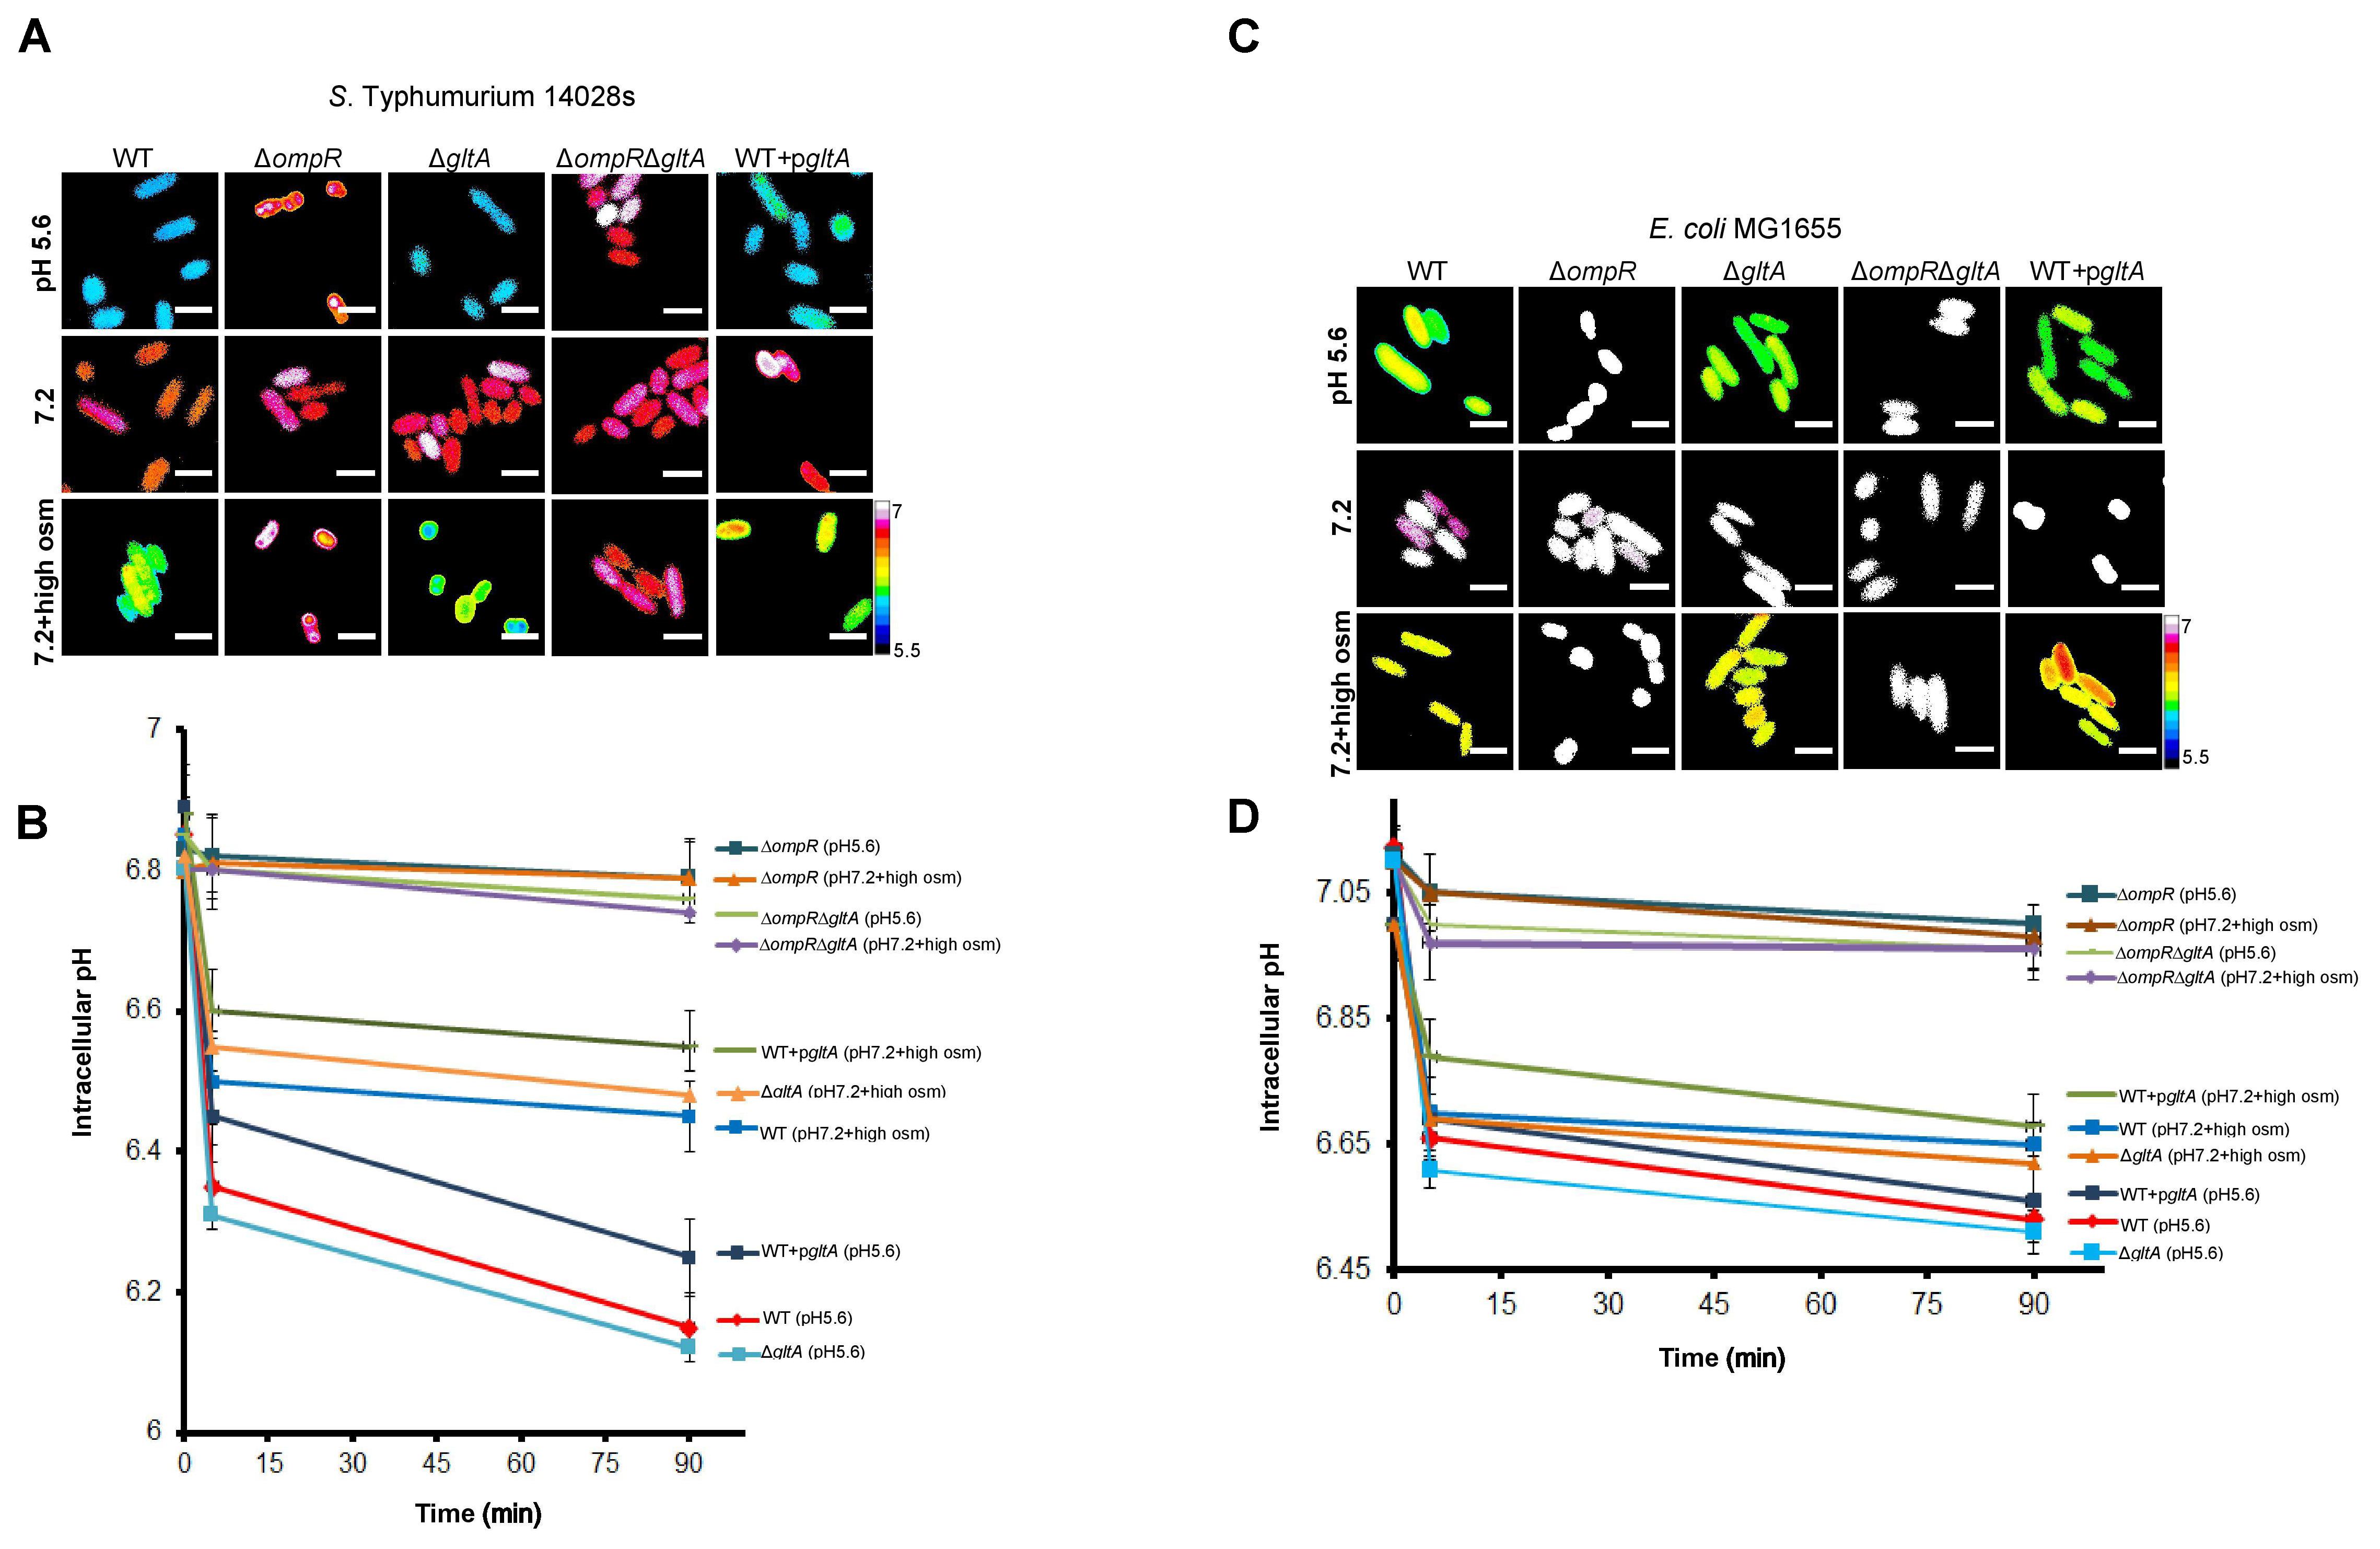
FIGURE 6. GltA is not involved in intracellular acidification. S. Typhimurium and E. coli cultures were incubated with 20 μM BCECF for 60 min before imaging. Representative epifluorescence ratio images (R488/440) of emission channel 525 nm upon 488 and 440 nm excitation were obtained for wild type, an ompR null mutant, a gltA null mutant, an ompR/gltA null strain and a gltA over-expressed strain of (A) S. Typhimurium and (C) E. coli incubated at either acid pHe (5.6), pHe (7.2), or pHe (7.2) plus 15% (w/v) sucrose. Using ImageJ software, ratio images were color coded blue (ratio = 0.1) to white (ratio = 1). Scale bar, 3 μm. A plot of the intracellular pH of 50 cells of wild-type and mutants of (B) S. Typhimurium and (D) E. coli at each indicated time point. Error bars represent the mean ± s.e.m. (n = 3).
To determine whether gltA repression was the result of direct interaction by OmpR, we used AFM to visualize OmpR binding to PgltA. OmpR was added to a solution buffered to the measured pHi of S. Typhimurium or E. coli, as determined from previous experiments (Chakraborty et al., 2017). Addition of OmpR at pH 6.1 (S. Typhimurium) or at pH 6.5 (E. coli) increased the proportion of DNA-OmpR protein complexes (Figure 7A), as evident by an increase in the relative height (white foci). OmpR binding to the gltA promoter was increased at acid pH ompared to the addition of OmpR at neutral pH (Figures 7A,B). Thus, OmpR represses gltA during acidification via a direct interaction at its promoter to enable optimum growth in both S. Typhimurium and E. coli. In previous studies, we also determined that there was no visible effect of acid pH on OmpR (pH 6.1–7.1) in the absence of DNA (Chakraborty et al., 2017) (see Supplementary Figure S1).
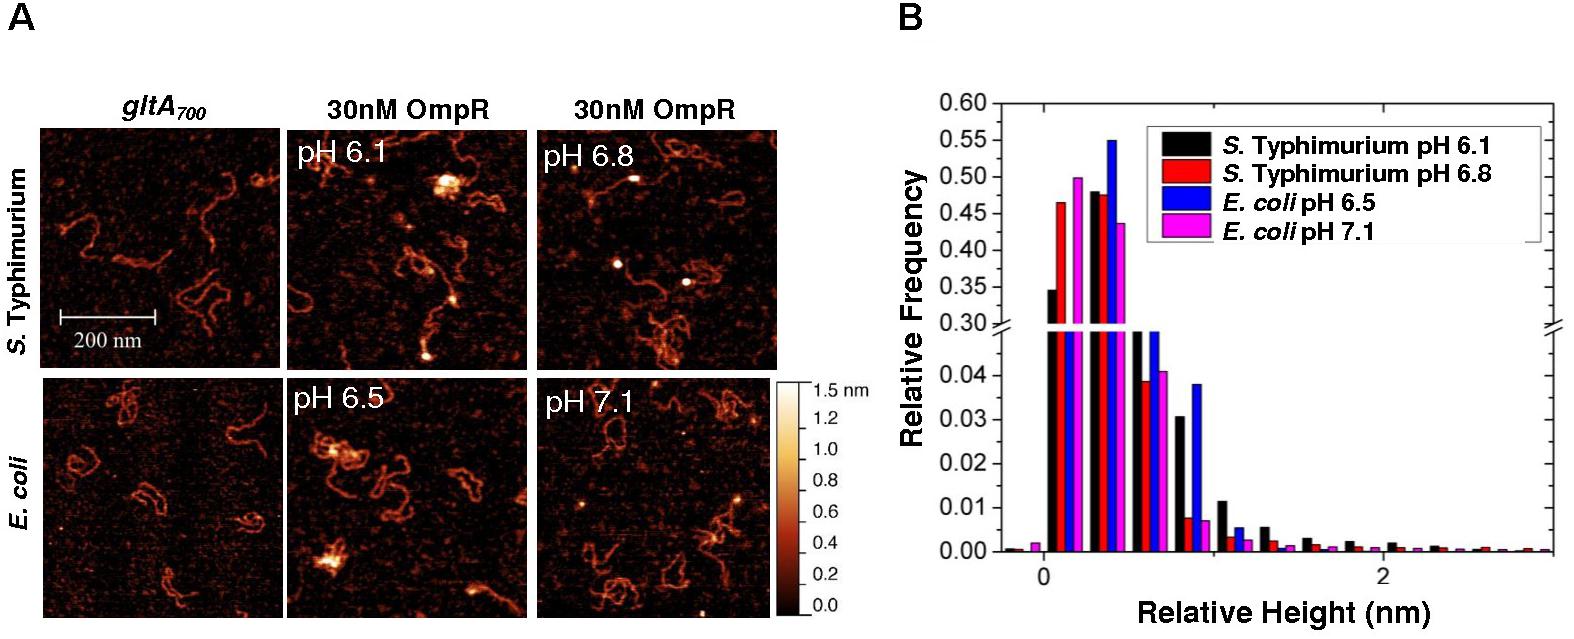
FIGURE 7. OmpR binds to the gltA promoter. (A) AFM images of the 700 bp gltA promoter (gltA700) from S. Typhimurium and E. coli (left panel) with 30 nM OmpR at either acidic (middle panel) or neutral pH (right panel). The pH corresponds to the relevant pHi that was measured during acid stress (Chakraborty et al., 2015, 2017). (B) A relative height distribution histogram of the gltA promoter complexed with 30 nM OmpR at either acid or neutral pH. To obtain the relative height distribution histograms of OmpR-gltA complexes, a threshold was applied to filter the gltA contour from the background by a MATLAB code. The relative height, which is essentially the pixel values of the contour above the background, was plotted as a distribution histogram. A higher relative height indicates more OmpR bound to the DNA. The relative frequency indicates how often the relative height was observed in acid or neutal pH. The term relative height is used, as the apparent heights measured by AFM do not represent the true height (Lai et al., 2015). In the absence of DNA, OmpR was visible as pinpoint dots and was not aggregated (Supplementary Figure S1).
Comparison of Osmolytes in the OmpR S. Typhimurium Transcriptome- Salt vs. Sucrose
Our previous data showed that the local unfolding and ensemble behavior of EnvZc was comparable in the presence of either sucrose or salt as the osmolyte (Wang et al., 2012). We were curious whether there were separate effects of osmolytes depending on whether the osmolyte was ionic or non-ionic. We therefore analyzed the effect of salt by adding 400 mM NaCl to N-minimal medium (MgM) at pHe 5.6 (976 mOsmol/kg). We compared OmpR-dependent pathways induced by acid, sucrose and salt stress from the expression profiles of wild-type and the ompR null strain of S. Typhimurium (Figure 8). Salt stress resulted in the highest number of differentially expressed genes (947) compared to acid (240) and sucrose (764) stress (Figure 8A). There was moderate overlap of these three responses, as 120 genes were common OmpR targets, but >50% of these were uncharacterized genes. This core regulon represented ∼13% of the OmpR response to salt stress (Figures 8B,C). It was noteworthy that half of the most highly expressed genes (fold change >10) were SPI-2 or SPI-2 co-regulated genes, which enable S. Typhimurium to survive the high osmolality and low pH of the macrophage vacuole (Chakraborty et al., 2015). Apart from ssrA and ssrB, none of the other SPI-2 genes have been shown to be direct targets of OmpR regulation (Lee et al., 2000; Feng et al., 2003, 2004), although many of them are directly regulated by SsrB (Feng et al., 2004; Walthers et al., 2007, 2011). PGDB analysis of the 120 OmpR common targets revealed only nine genes involved in metabolism (Figure 8D), and most of these were degradative pathways. Interestingly, gltA was the only OmpR-repressed target that was sensitive to acid, sucrose and salt stress in S. Typhimurium (Figure 8D) and in E. coli during acid and sucrose stress (Figure 5D). Our findings suggest that in both S. Typhimurium, S. Typhi (Perkins et al., 2013) and E. coli, OmpR repression of gltA plays a major role in maintaining optimum cell growth during stress.
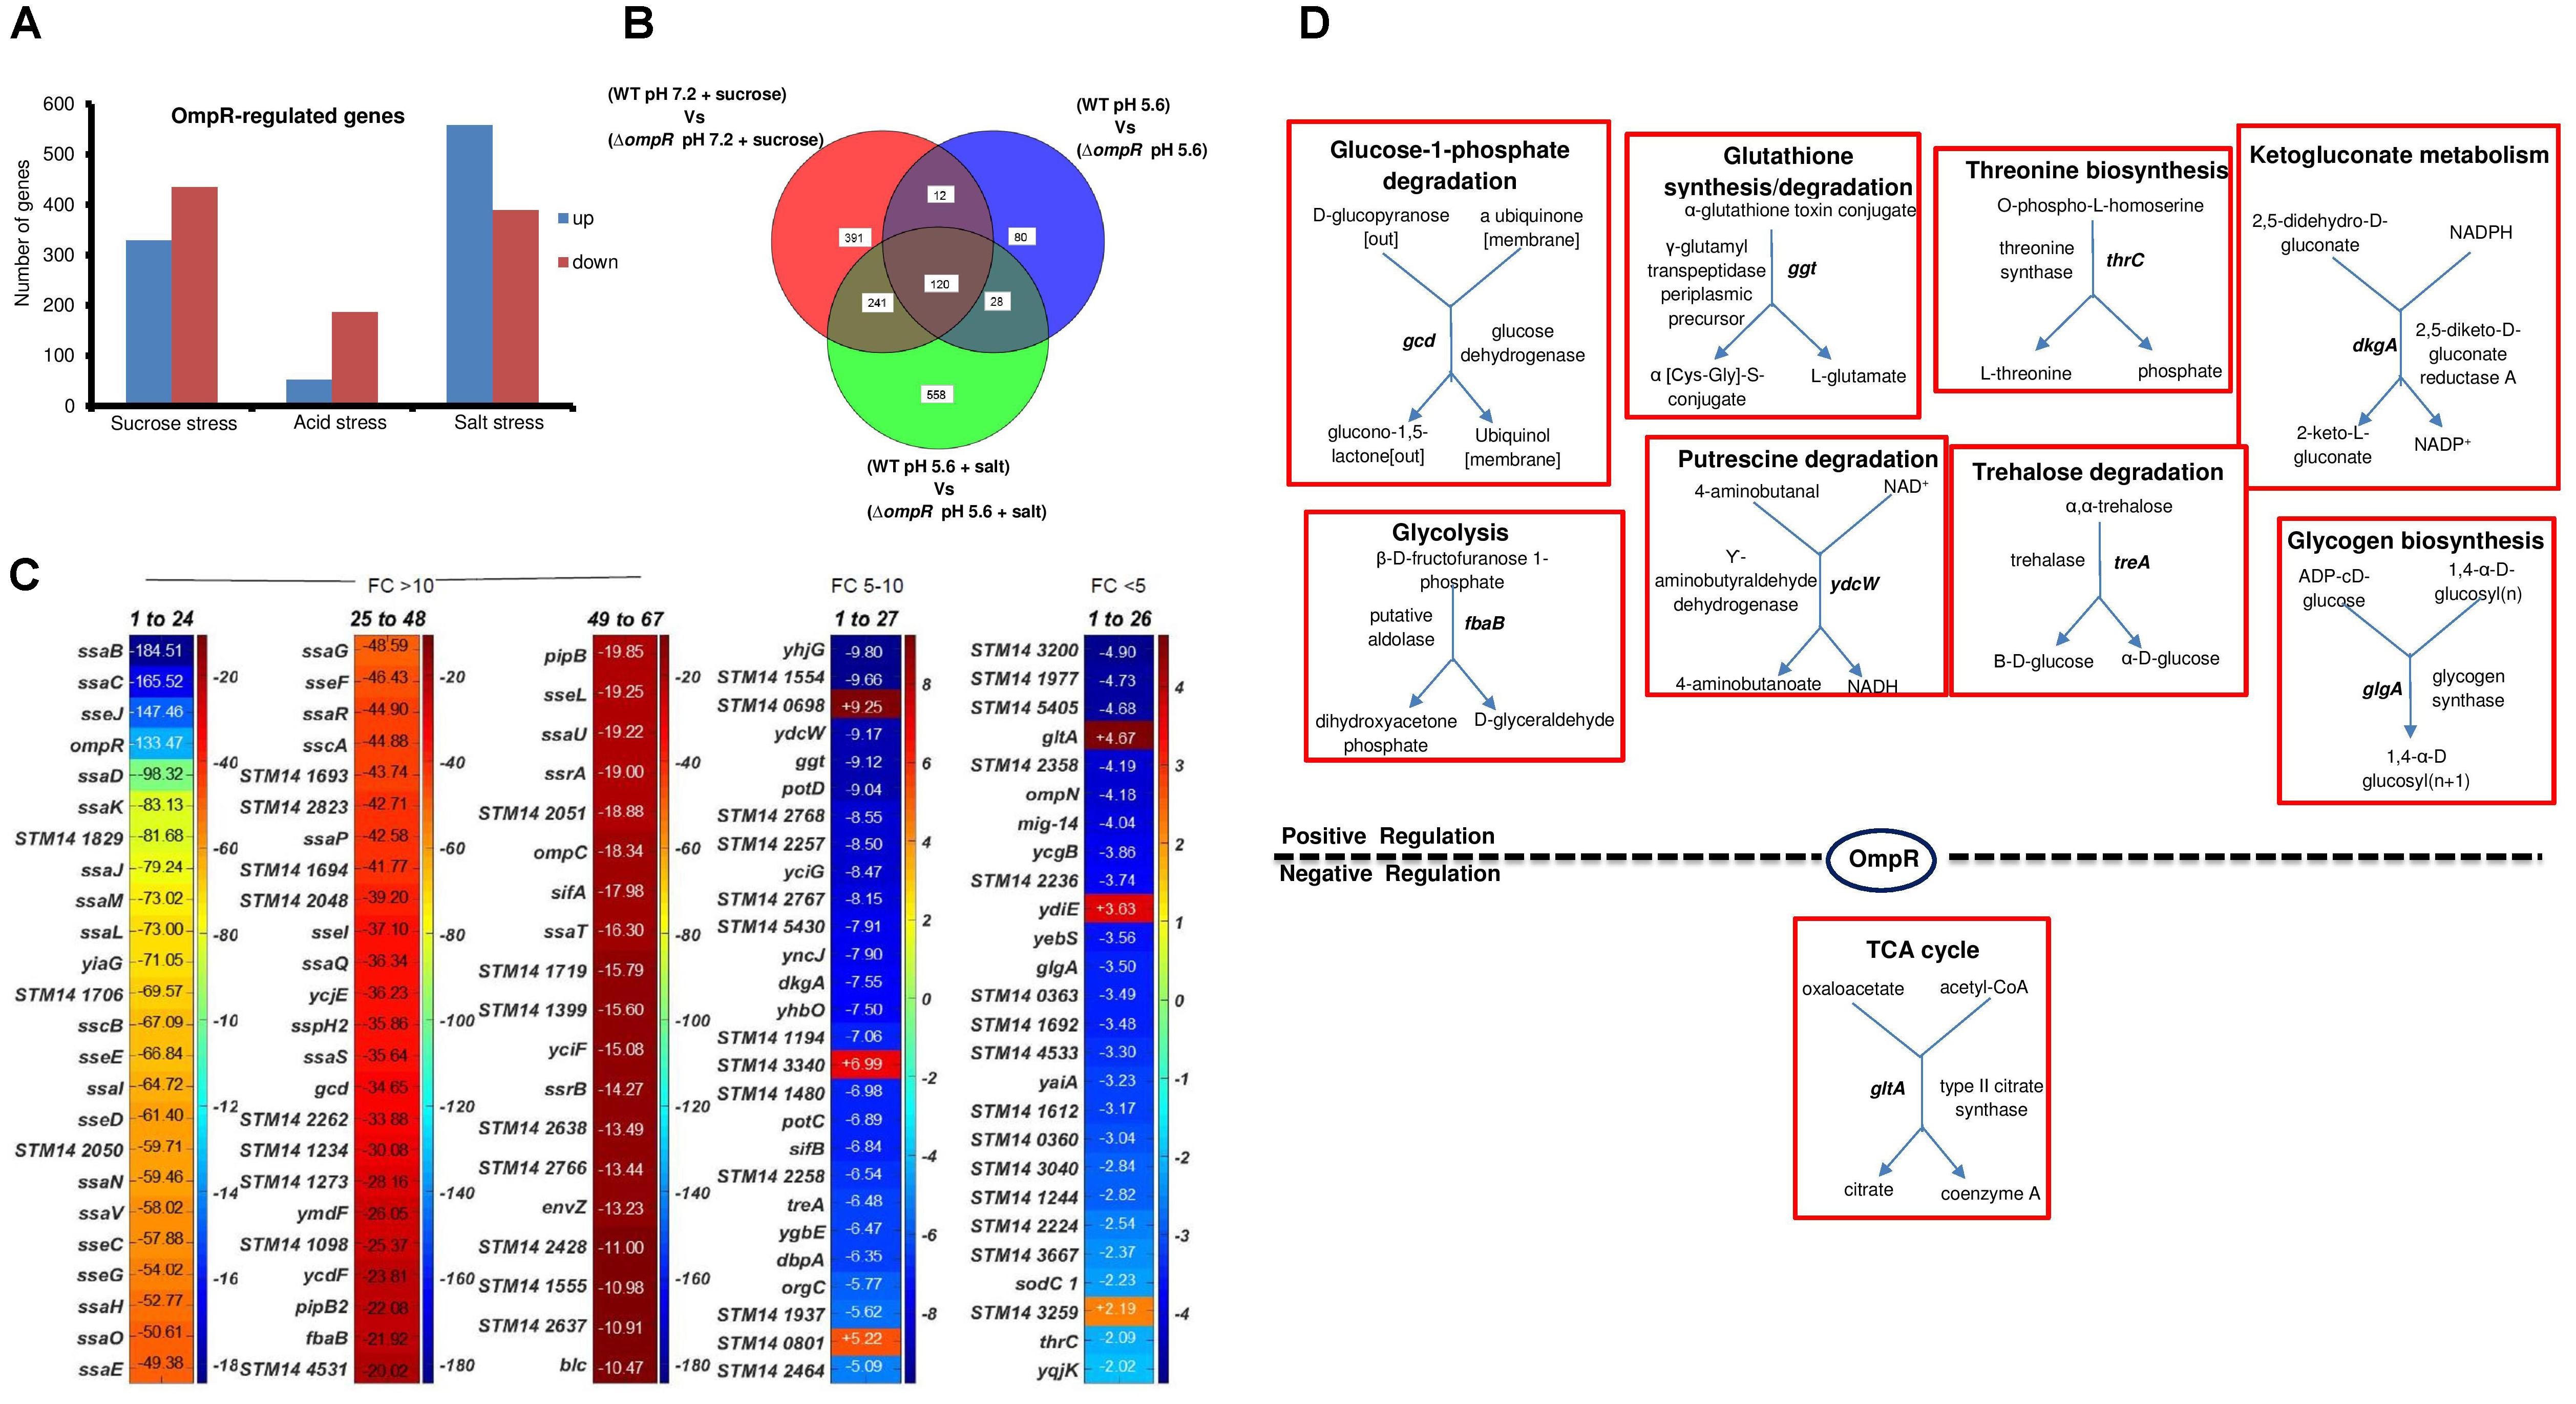
FIGURE 8. Overlapping OmpR acid, sucrose, and salt stress targets (A) Statistically significant (≥ 2-fold change; P-value ≤ 0.05) OmpR targets differentially expressed in S. Typhimurium in response to acid, sucrose and salt stress are shown. (B) Overlapping OmpR targets are shown. (C) A heat map shows the expression profiles of the overlapping OmpR-regulated genes grouped based on differences in their fold change. The color scale represents the average fold change of an ompR null strain during sucrose stress (n = 3). (D) Metabolic overview of OmpR targets involved in cellular processes is shown.
Discussion
OmpR Is an Important Global Regulator of the Bacterial Response to Acid/Osmotic Stress
Bacteria encounter diverse environmental conditions both inside and outside of the host. TCRSs play a major role in sensing these varied environmental cues and subsequently modulate gene expression in response to stress. In a previous study, we established that the cytoplasmic domain alone of the sensor kinase EnvZ sensed cytoplasmic signals to activate its downstream target OmpR without being in the membrane (Wang et al., 2012). It was then logical that cytoplasmic acidification of S. Typhimurium occurred during macrophage infection (Chakraborty et al., 2015) and during in vitro acid and osmotic stress (Chakraborty et al., 2017). Cytoplasmic acidification was completely dependent on the OmpR response regulator, but did not require known OmpR-regulated genes such as ompC, ompF, or ssaC (a SPI-2 structural gene). To elucidate the OmpR regulatory networks, we performed microarray analysis and compared the transcriptome of ompR null and wild-type strains of S. Typhimurium and E. coli during acid and osmotic stress. OmpR repressed distinct genes, depending on whether the stressor was acid or osmotic stress, as driven by differences in pHi that ensued (Chakraborty et al., 2017). Thus, we were motivated to further understand the role of OmpR in the cellular stress response.
OmpR Down-Regulates a Metabolic Pathway That Produces Toxic Intermediates
A previous study proposed a program of gene expression of E. coli BW35113 during exposure to acid pH that involved the following metabolic switches: from utilizing glucose to gluconeogenesis and fatty acid synthesis, from aerobic to anaerobic growth and down–regulation of fumarate and up-regulation of formate and nitrate pathways (Stincone et al., 2011). In the present work, some of these same changes were evident in the response to acidification caused by osmotic stress, where nar (ZWVY and U) genes were highly up-regulated (Figure 4C), but fatty acid synthesis genes (entF, fabB and lpxC) were down-regulated. Common targets between E. coli and S. Typhimurium also included genes involved in carbohydrate degradation (melA, gcd, ydcW, fbaB, and glgP).
During acid stress, the OmpR overlapping targets revealed three genes in both E. coli and S. Typhimurium involved in metabolism, including: dacC, gltA and adhP (Figure 3D). DacC is a D-alanyl-D-alanine carboxypeptidase that was activated by OmpR (3.7-fold). Deletion of DacC (PBP6) had no detectible phenotype in E. coli (Broome-Smith and Spratt, 1982), but over-expression was reported to be toxic (Pedersen et al., 1998). In another study, dacC was shown to be essential for E. coli cell morphology and was regulated by BolA (Santos et al., 2002).
Nine common targets in the OmpR-dependent acid and osmotic stress response were identified. Three of these were ompF, ompC and tppB, i.e., known OmpR-regulated genes. The fourth was gltA, which encodes citrate synthase, and converts oxaloacetate and acetyl-CoA into citrate (Figures 3–6). GltA controls the entry of metabolites into the TCA cycle, and it also appears to be the source of a toxic metabolite, 2-methylcitrate that can be a potent inhibitor of cell growth (Horswill et al., 2001). The gltA promoter is regulated by ArcA (Park et al., 1994) and in the present work we establish that OmpR binds to PgltA and represses its expression to ensure optimum growth. Over-expression of gltA resulted in growth defects in both S. Typhimurium and E. coli (Figures 1, 7). OmpR regulation of gltA also appeared in a ChIP-seq analysis of S. Typhi (Perkins et al., 2013). A clearer picture will hopefully emerge when we understand the function of these unknown genes.
Although the remaining five common OmpR target genes are of unknown function, they include YmdF and YciG, annotated as stress-induced proteins related to conidiation-specific protein 10 from Neurospora. YciF is highly conserved across the Enterobacteriaciae, and based on its structure, it was proposed to be a metal binding protein (Hindupur et al., 2006), and to function to protect the cell against oxidative damage. YciF was up-regulated in the OmpR response to acidification by acid or osmotic stress (Figure 5). It is annotated as being involved in the cellular response to DNA damage, as is yciG. YciF and YciG are in the yciFGE-katN operon, KatN is a non-heme catalase (Robbe-Saule et al., 2001). In Salmonella, YciF was reported to be under positive control of RpoS (Ibanez-Ruiz et al., 2000), yet our previous study showed that OmpR repressed rpoS during osmotic stress (Chakraborty et al., 2017), which would decrease yciF transcription. Our microarray results identify yciF as up-regulated by OmpR in both osmotic and acid stress (Figure 5). In Salmonella, yciF was reported to be regulated by bile, independently of rpoS (Prouty et al., 2004).
The E. coli Acid Stress Regulon Is Large
Our microarray results indicated that the OmpR-dependent response to acid stress in E. coli involved about six times as many genes as in S. Typhimurium (Figure 3). The involvement of 1360 genes in the OmpR-dependent E. coli MG1655 acid stress response (and 1538 genes in the total OmpR-independent acid stress response) was similar to a study of E. coli BW25113, in which 1871 genes were differentially expressed after a 15 min acid exposure (to pH 5.5) (Stincone et al., 2011). These two studies were in contrast to a ChIP-on-chip study using the E. coli K-12 strain CSH-50 (Quinn et al., 2014). In that study, only 144 OmpR-regulated acid stress genes were identified in CSH-50, i.e., only ∼10% compared to the 1360 genes that we identified in E. coli MG1655. In contrast, the response of S. Typhimurium was comparable between our study and the study by Quinn and colleagues: 240 vs. 212 acid stress genes (Figure 3; Quinn et al., 2014, respectively). Fifteen OmpR-regulated genes were common to E. coli CSH-50 and S. Typhimurium (Quinn et al., 2014), whereas in E. coli MG1655 and S. Typhimurium strain 14028, 25 genes were common (Figure 3). There was very little overlap between the common genes that we identified and the common genes identified by Dorman and co-workers (Quinn et al., 2014); although the few genes that were in common were again the known OmpR targets: ompC, ompF and the tripartite permease, tppB. These same targets appear in the common genes of the acid and osmotic stress responses of S. Typhimurium and E. coli (see Figure 5). CSH-50 is a proline and thiamine auxotroph, contains an insertion sequence in fimE, and is rpsL null (Miller, 1972; Blomfield et al., 1991). Thus, extensive genetic differences between E. coli K-12 CSH-50 and MG1655 likely explains the poor overlap between studies.
OmpR Numbers and pH Regulation
Our qRT-PCR results are in good agreement with our microarray; the ompR transcripts of both S. Typhimurium and E. coli were unchanged in acid pH, but were slightly up-regulated by ∼2-fold in response to osmotic stress (Figure 2). This result conflicts with a previous study that reported ompR transcripts in S. Typhimurium were ∼2.7-fold higher at pH 4.5 compared to pH 7 (Quinn et al., 2014). It may be that the lower pH examined (4.5 instead of 5.6), or differences in the culture media (EG-minimal medium instead of MGM) or the reference gene employed (gmk) might contribute to these discrepancies. However, our finding that ompR transcripts did not change in acid stress (at pH 5.6) was entirely consistent with our use of super-resolution imaging to count OmpR molecules (Foo et al., 2015b; Liew et al., unpublished). OmpR molecules were counted in acid and neutral pH and the number of OmpR molecules was similar. We then used single particle tracking photoactivation localization microscopy (Spt-PALM) to monitor OmpR binding to DNA by measuring diffusion coefficients in acid and neutral pH. OmpR binding only increased by 5% in acid pH (Liew et al., unpublished). Previously, we have used AFM extensively to examine the role of pH in OmpR binding to DNA. OmpR binding affinity at the ompC and cadB/A promoters was increased in acid compared to neutral pH (Chakraborty et al., 2017). We propose that rather than increasing the number of OmpR molecules in acid pH, the OmpR binding affinity for DNA is pH-sensitive and increases in acid pH. In E. coli BW25113, it was reported that ompR transcripts were reduced by ∼50% in acid pH (Stincone et al., 2011). This was surprising, given the substantial role that OmpR plays in the acid stress response. In contrast, in the CSH-50 E. coli strain, ompR transcripts were unchanged between pH 7 and pH 4.5 (Quinn et al., 2014).
What Is the Cellular Response to Acid pH?
It was suggested that DNA topological changes at acid pH could drive OmpR binding to DNA and might be responsible for an increase in the number of OmpR-bound genes observed during acid stress (Cameron and Dorman, 2012). Previous studies used OmpR-dependent transcriptional fusions to gfp (including: ompR-gfp and ssrA-gfp) and reported that transcription was increased in the presence of novobiocin, which presumably reduces supercoiling. The authors concluded that DNA relaxation promoted OmpR binding to DNA, enhancing transcription (Cameron and Dorman, 2012). This was surprising, because we required supercoiled templates for OmpR transcription in vitro (D. Walthers and L.J. Kenney, unpublished observations). We used super-resolution microscopy to image a chromosomally-encoded OmpR-PAmCherry fusion protein during osmotic and acid stress (Foo et al., 2015b). We examined both the OmpR distribution and chromosomal compaction and discovered that the chromosome was actually more condensed during acidic conditions, rather than being more relaxed (Foo et al., 2015b; Liew et al., unpublished). This finding was recapitulated in a recent study of the nucleoid-associated protein H-NS (Gao et al., 2017).
A Caution Regarding C-Terminal Fusions to OmpR
ChIP-on-chip results with OmpR showed increased binding of OmpR at the mgtC promoter (Quinn et al., 2014), although microarray and qRT-PCR analysis of OmpR-regulated genes at acid pH did not identify mgtC as a target of OmpR regulation, nor did mgtC contribute to intracellular acidification (Chakraborty et al., 2015). A likely explanation for this discrepancy is that OmpR containing a 3XFLAG tag was employed in the ChIP-on-chip study, which also contained a D55E substitution (Quinn et al., 2014). It is well known that C-terminal tags to OmpR affect not only its DNA binding ability (Perkins et al., 2013), but also its specificity (Shimada et al., 2015), which may explain why it was observed that OmpR preferred relaxed DNA over supercoiled DNA. The D55E-3XFLAG-tagged OmpR also required concentrations > 1 μM to bind in electrophoretic mobility shift assays (Cameron and Dorman, 2012), even though the affinity of wildtype, unphosphorylated OmpR for the porin genes ompF and ompC is ∼150 nM (Head et al., 1998). In a recent study, OmpR targets were identified by SELEX (Shimada et al., 2015), but we were unable to validate the targets identified (Gao and Kenney, unpublished observations). Furthermore, different OmpR targets were identified depending on whether a C-terminal or N-terminal tag was employed (Shimada et al., 2015). Thus, extreme caution should be used when interpreting results using OmpR C-terminal fusions. A more likely explanation is that OmpR directly regulates phoP, in agreement with (Quinn et al., 2014), where OmpR was shown to bind to the phoP promoter. In turn, PhoP directly regulates mgtC and the reduced mgtC levels observed in the ompR null strain were likely due to reduced phoP levels. This type of indirect regulation has been observed in the OmpR regulation of the response regulator SsrB, which then regulates sifA (Walthers et al., 2011). It is also evident in the additional SPI-2 genes that are known SsrB targets (Figure 8).
Overall, this work revealed a large number of genes that are new targets of OmpR regulation during acid and osmotic stress. The challenge will be to determine whether these are direct effects or if they are mediated through OmpR regulation of an intermediating regulator, as we observed with the OmpR repression of the stationary phase sigma factor rpoS (Chakraborty et al., 2017).
Author Contributions
SC performed the analysis and the experiments. SC and LK analyzed the data and wrote the manuscript.
Funding
Supported by VA IOBX-000372, NIH AI123640 to LK and an RCE in Mechanobiology from the Ministry of Education, Singapore.
Conflict of Interest Statement
The authors declare that the research was conducted in the absence of any commercial or financial relationships that could be construed as a potential conflict of interest.
Acknowledgments
We thank Dr. Ricksen Winardhi, formerly of the MBI for contributing the gltA AFM images and Ong Hui Ting (MBI Microscopy Core) for assistance with microarray analysis.
Supplementary Material
The Supplementary Material for this article can be found online at: https://www.frontiersin.org/articles/10.3389/fmicb.2018.02656/full#supplementary-material
Abbreviations
BCECF-AM, 2′,7′-Bis-(2-Carboxyethyl)-5-(and-6)Carboxyfluorescein, AcetoxymethylEster); CAD, cadaverine decarboxylation system; cF, 5 (and 6-)-carboxyfluorescein; FRET, fluorescence resonance energy transfer; GAD, glutamine decarboxylation system; min, minutes; pHe, extracellular pH; pHi, intracellular pH; qRT-PCR, quantitative real-time polymerase chain reaction; RT, room temperature; SPI-2, S. Typhimurium pathogenicity island 2; Spt-PALM, single particle tracking photoactivatable localization microscopy; TCRS, two-component regulatory systems; TTSS, type three secretion systems.
Footnotes
References
Bearson, B. L., Lee, I. S., and Casey, T. A. (2009). Escherichia coli O157?: H7 glutamate- and arginine-dependent acid-resistance systems protect against oxidative stress during extreme acid challenge. Microbiology 155, 805–812. doi: 10.1099/mic.0.022905-0
Blomfield, I. C., McClain, M. S., Princ, J. A., Calie, P. J., and Eisenstein, B. I. (1991). Type 1 fimbriation and fimE mutants of Escherichia coli K-12. J. Bacteriol. 173, 5298–5307. doi: 10.1128/jb.173.17.5298-5307.1991
Boor, K. J. (2006). Bacterial stress responses: what doesn’t kill them can make them stronger. PLoS Biol. 4:e23. doi: 10.1371/journal.pbio.0040023
Broome-Smith, J. K., and Spratt, B. G. (1982). Deletion of the penicillin-binding protein 6 gene of Escherichia coli. J. Bacteriol. 152, 904–906.
Cameron, A. D. S., and Dorman, C. J. (2012). A fundamental regulatory mechanism operating through OmpR and DNA topology controls expression of Salmonella pathogenicity islands SPI-1 and SPI-2. PLoS Genet. 8:e1002615. doi: 10.1371/journal.pgen.1002615
Casey, J. R., Grinstein, S., and Orlowski, J. (2010). Sensors and regulators of intracellular pH. Nat. Rev. Mol. Cell Biol. 11, 50–61. doi: 10.1038/nrm2820
Chakraborty, S., Mizusaki, H., and Kenney, L. J. (2015). A FRET-Based DNA biosensor tracks OmpR-dependent acidification of Salmonella during macrophage infection. PLoS Biol. 13:e1002116. doi: 10.1371/journal.pbio.1002116
Chakraborty, S., Winardhi, R. S., Morgan, L. K., Yan, J., and Kenney, L. J. (2017). Non-canonical activation of OmpR drives acid and osmotic stress responses in single bacterial cells. Nat. Commun. 8:1587. doi: 10.1038/s41467-017-02030-0
Cheeseman, G. C., and Fuller, R. (1968). Changes in the pH activity profile of the lysine decarboxylase during incubation of Escherichia coli. J. Appl. Bacteriol. 31, 253–258. doi: 10.1111/j.1365-2672.1968.tb00365.x
Choi, J., and Groisman, E. A. (2016). Acidic pH sensing in the bacterial cytoplasm is required for Salmonella virulence. Mol. Microbiol. 101, 1024–1038. doi: 10.1111/mmi.13439
De Biase, D., and Lund, P. A. (2015). The Escherichia coli acid stress response and its significance for pathogenesis. Adv. Appl. Microbiol. 92, 49–88. doi: 10.1016/bs.aambs.2015.03.002
De Biase, D., Tramonti, A., Bossa, F., and Visca, P. (1999). The response to stationary-phase stress conditions in Escherichia coli: role and regulation of the glutamic acid decarboxylase system. Mol. Microbiol. 32, 1198–1211. doi: 10.1046/j.1365-2958.1999.01430.x
Eguchi, Y., and Utsumi, R. (2014). Alkali metals in addition to acidic pH activate the EvgS histidine kinase sensor in Escherichia coli. J. Bacteriol. 196, 3140–3149. doi: 10.1128/JB.01742-14
Feng, X., Oropeza, R., and Kenney, L. J. (2003). Dual regulation by phospho-OmpR of ssrA/B gene expression in Salmonella pathogenicity island 2. Mol. Microbiol. 48, 1131–1143. doi: 10.1046/j.1365-2958.2003.03502.x
Feng, X., Walthers, D., Oropeza, R., and Kenney, L. J. (2004). The response regulator SsrB activates transcription and binds to a region overlapping OmpR binding sites at Salmonella pathogenicity island 2. Mol. Microbiol. 54, 823–835. doi: 10.1111/j.1365-2958.2004.04317.x
Foo, Y. H., Gao, Y., Zhang, H., and Kenney, L. J. (2015a). Cytoplasmic sensing by the inner membrane histidine kinase EnvZ. Prog. Biophys. Mol. Biol. 118, 119–129. doi: 10.1016/j.pbiomolbio.2015.04.005
Foo, Y. H., Spahn, C., Zhang, H., Heilemann, M., and Kenney, L. J. (2015b). Single cell super-resolution imaging of E. coli OmpR during environmental stress. Integr. Biol. 7, 1297–1308. doi: 10.1039/C5IB00077G
Gao, Y., Foo, Y. H., Winardhi, R. S., Tang, Q., Yan, J., and Kenney, L. J. (2017). Charged residues in the H-NS linker drive DNA binding and gene silencing in single cells. Proc. Natl. Acad. Sci. U.S.A. 114, 12560–12565. doi: 10.1073/pnas.1716721114
Ghosh, M., Wang, L. C., Ramesh, R., Morgan, L. K., Kenney, L. J., and Anand, G. S. (2017). Lipid-mediated regulation of embedded receptor kinases via parallel Allosteric Relays. Biophys. J. 112, 643–654. doi: 10.1016/j.bpj.2016.12.027
Goh, E. B., Siino, D. F., and Igo, M. M. (2004). The Escherichia coli tppB (ydgR) gene represents a new class of OmpR-regulated genes. J. Bacteriol. 186, 4019–4024. doi: 10.1128/JB.186.12.4019-4024.2004
Head, C. G., Tardy, A., and Kenney, L. J. (1998). Relative binding affinities of OmpR and OmpR-phosphate at the ompF and ompC regulatory sites. J. Mol. Biol. 281, 857–870. doi: 10.1006/jmbi.1998.1985
He, Q., He, Z., Joyner, D. C., Joachimiak, M., Price, M. N., Yang, Z. K., et al. (2010). Impact of elevated nitrate on sulfate-reducing bacteria: a comparative study of Desulfovibrio vulgaris. ISME J. 4, 1386–1397. doi: 10.1038/ismej.2010.59
Hindupur, A., Liu, D. Q., Zhao, Y. H., Bellamy, H. D., White, M. A., and Fox, R. O. (2006). The crystal structure of the E-coli stress protein YciF. Protein Sci. 15, 2605–2611. doi: 10.1110/Ps.062307706
Horswill, A. R., Dudding, A. R., and Escalante-Semerena, J. C. (2001). Studies of propionate toxicity in Salmonella enterica identify 2-methylcitrate as a potent inhibitor of cell growth. J. Biol. Chem. 276, 19094–19101. doi: 10.1074/jbc.M100244200
Ibanez-Ruiz, M., Robbe-Saule, V., Hermant, D., Labrude, S., and Norel, F. (2000). Identification of RpoS (sigma(S))-regulated genes in Salmonella enterica serovar typhimurium. J. Bacteriol. 182, 5749–5756. doi: 10.1128/JB.182.20.5749-5756.2000
Karlinsey, J. E. (2007). Lambda-Red genetic engineering in Salmonella enterica serovar Typhimurium. Methods Enzymol. 421, 199–209. doi: 10.1016/S0076-6879(06)21016-4
Keseler, I. M., Collado-Vides, J., Santos-Zavaleta, A., Peralta-Gil, M., Gama-Castro, S., Muniz-Rascado, L., et al. (2011). EcoCyc: a comprehensive database of Escherichia coli biology. Nucleic Acids Res. 39, D583–D590. doi: 10.1093/nar/gkq1143
Kitko, R. D., Wilks, J. C., Garduque, G. M., and Slonczewski, J. L. (2010). Osmolytes contribute to pH homeostasis of Escherichia coli. PLoS One 5:e10078. doi: 10.1371/journal.pone.0010078
Krulwich, T. A., Sachs, G., and Padan, E. (2011). Molecular aspects of bacterial pH sensing and homeostasis. Nat. Rev. Microbiol. 9, 330–343. doi: 10.1038/nrmicro2549
Lai, C.-Y., Santos, S., and Chiesa, M. (2015). General interpretation and theory of apparent height in dynamic atomic force microscopy. RSC Adv. 5,80069–80075. doi: 10.1039/C5RA16695K
Lee, A. K., Detweiler, C. S., and Falkow, S. (2000). OmpR regulates the two-component system SsrA-SsrB in Salmonella pathogenicity island 2. J. Bacteriol. 182, 771–781. doi: 10.1128/JB.182.3.771-781.2000
Madshus, I. H. (1988). Regulation of intracellular pH in eukaryotic cells. Biochem. J. 250, 1–8. doi: 10.1042/bj2500001
Miller, J. H. (1972). Experiments in Molecular Genetics. New York, NY: Cold Spring Harb. Lab. Press. 433, 352–355.
Park, S. J., McCabe, J., Turna, J., and Gunsalus, R. P. (1994). Regulation of the citrate synthase (gltA) gene of Escherichia coli in response to anaerobiosis and carbon supply: role of the arcA gene product. J. Bacteriol. 176, 5086–5092. doi: 10.1128/jb.176.16.5086-5092.1994
Pedersen, L. B., Murray, T., Popham, D. L., and Setlow, P. (1998). Characterization of dacC, which encodes a new low-molecular-weight penicillin-binding protein in Bacillus subtilis. J. Bacteriol. 180, 4967–4973.
Perkins, T. T., Davies, M. R., Klemm, E. J., Rowley, G., Wileman, T., James, K., et al. (2013). ChIP-seq and transcriptome analysis of the OmpR regulon of Salmonella enterica serovars Typhi and Typhimurium reveals accessory genes implicated in host colonization. Mol. Microbiol. 87, 526–538. doi: 10.1111/mmi.12111
Prouty, A. M., Brodsky, I. E., Manos, J., Belas, R., Falkow, S., and Gunn, J. S. (2004). Transcriptional regulation of Salmonella enterica serovar Typhimurium genes by bile. FEMS Immunol. Med. Microbiol. 41, 177–185. doi: 10.1016/j.femsim.2004.03.002
Quinn, H. J., Cameron, A. D. S., and Dorman, C. J. (2014). Bacterial regulon evolution: distinct responses and roles for the identical OmpR proteins of Salmonella Typhimurium and Escherichia coli in the acid stress response. PLoS Genet. 10:e1004215. doi: 10.1371/journal.pgen.1004215
Rhee, E. J., Sheng, W., Morgan, L. K., Nolet, R., Liao, X., and Kenney, L. J. (2008). Amino acids important for DNA recognition by the response regulator OmpR. J. Biol. Chem. 283, 8664–8677. doi: 10.1074/jbc.M705550200
Robbe-Saule, V., Coynault, C., Ibanez-Ruiz, M., Hermant, D., and Norel, F. (2001). Identification of a non-haem catalase in Salmonella and its regulation by RpoS (σs). Mol. Microbiol. 39, 1533–1545. doi: 10.1046/j.1365-2958.2001.02340.x
Santos, J. M., Lobo, M., Matos, A. P. A., De Pedro, M. A., and Arraiano, C. M. (2002). The gene bolA regulates dacA (PBP5), dacC (PBP6) and ampC (AmpC), promoting normal morphology in Escherichia coli. Mol. Microbiol. 45, 1729–1740. doi: 10.1046/j.1365-2958.2002.03131.x
Sen, H., Aggarwal, N., Ishionwu, C., Hussain, N., Parmar, C., Jamshad, M., et al. (2017). Structural and functional analysis of the Escherichia coli acid-sensing histidine kinase, EvgS. J. Bacteriol. 199, e310–e317. doi: 10.1128/JB.00310-17
Shimada, T., Takada, H., Yamamoto, K., and Ishihama, A. (2015). Expanded roles of two-component response regulator OmpR in Escherichia coli: genomic SELEX search for novel regulation targets. Genes Cells 20, 915–931. doi: 10.1111/gtc.12282
Slonczewski, J. L., Fujisawa, M., Dopson, M., and Krulwich, T. A. (2009). Cytoplasmic pH measurement and homeostasis in bacteria and archaea. Adv. Microb. Physiol. 55, 1–79. doi: 10.1016/S0065-2911(09)05501-5
Stincone, A., Daudi, N., Rahman, A. S., Antczak, P., Henderson, I., Cole, J., et al. (2011). A systems biology approach sheds new light on Escherichia coli acid resistance. Nucleic Acids Res. 39, 7512–7528. doi: 10.1093/nar/gkr338
Tucker, D. L., Tucker, N., and Conway, T. (2002). Gene expression profiling of the pH response in Escherichia coli. J. Bacteriol. 184, 6551–6558. doi: 10.1128/JB.184.23.6551-6558.2002
Vivijs, B., Aertsen, A., and Michiels, C. W. (2016). Identification of genes required for growth of Escherichia coli MG1655 at moderately low pH. Front. Microbiol. 7:1672. doi: 10.3389/fmicb.2016.01672
Walthers, D., Carroll, R. K., Navarre, W. W., Libby, S. J., Fang, F. C., and Kenney, L. J. (2007). The response regulator SsrB activates expression of diverse Salmonella pathogenicity island 2 promoters and counters silencing by the nucleoid-associated protein H-NS. Mol. Microbiol. 65, 477–493. doi: 10.1111/j.1365-2958.2007.05800.x
Walthers, D., Go, A., and Kenney, L. J. (2005). “Regulation of porin gene expression by the two-component regulatory system EnvZ/OmpR,” in Bacterial and Eukaryotic Porins: Structure, Function, Mechanism, ed. R. Benz (Weinheim: Wiley-VCH), 1–24.
Walthers, D., Li, Y., Liu, Y., Anand, G., Yan, J., and Kenney, L. J. (2011). Salmonella enterica response regulator SsrB relieves H-NS silencing by displacing H-NS bound in polymerization mode and directly activates transcription. J. Biol. Chem. 286, 1895–1902. doi: 10.1074/jbc.M110.164962
Wang, L. C., Morgan, L. K., Godakumbura, P., Kenney, L. J., and Anand, G. S. (2012). The inner membrane histidine kinase EnvZ senses osmolality via helix-coil transitions in the cytoplasm. EMBO J. 31, 2648–2659. doi: 10.1038/emboj.2012.99
Keywords: single cells, fluorescence microscopy, two-component regulatory systems, EnvZ, OmpR, GltA, acid stress, osmotic stress
Citation: Chakraborty S and Kenney LJ (2018) A New Role of OmpR in Acid and Osmotic Stress in Salmonella and E. coli. Front. Microbiol. 9:2656. doi: 10.3389/fmicb.2018.02656
Received: 16 July 2018; Accepted: 17 October 2018;
Published: 22 November 2018.
Edited by:
Daniela De Biase, Università degli Studi di Roma La Sapienza, ItalyReviewed by:
Peter Adrian Lund, University of Birmingham, United KingdomSylvie Rimsky, INSERM U1050 Centre Interdisciplinaire de Recherche en Biologie, France
Samantha Miller, University of Aberdeen, United Kingdom
Copyright © 2018 Chakraborty and Kenney. This is an open-access article distributed under the terms of the Creative Commons Attribution License (CC BY). The use, distribution or reproduction in other forums is permitted, provided the original author(s) and the copyright owner(s) are credited and that the original publication in this journal is cited, in accordance with accepted academic practice. No use, distribution or reproduction is permitted which does not comply with these terms.
*Correspondence: Linda J. Kenney, kenneyl@uic.edu
†Present address: Smarajit Chakraborty, Fat Metabolism and Stem Cell Group, Laboratory of Metabolic Medicine, Singapore Bioimaging Consortium, A∗STAR, Singapore, Singapore