 Wenbing Gong
 Chunliang Xie
 Yuande Peng
- Institute of Bast Fiber Crops, Chinese Academy of Agricultural Sciences, Changsha, China
Hericium erinaceus has attracted tremendous interest owing to its compelling health-promoting properties. However, breeding of elite cultivars of H. erinaceus is hindered by the lack of a genetic and molecular toolbox. Here, we performed resequencing analysis of 127 F1 single-spore isolates and constructed the first high-resolution genetic map of H. erinaceus. With the use of recombination bins as markers, an ultradense genetic map consisting of 1,174 bins (including 37,082 single-nucleotide polymorphisms) was generated. This newly developed genetic map covered 1,096.5 cM, with an average bin spacing of 0.95 cM. High collinearity between genetic map and H. erinaceus genome assembly was revealed by aligning scaffolds to this genetic map using bin markers as anchors. The application of this newly developed genetic map in quantitative trait locus (QTL) mapping was also elucidated, and four QTLs for monokaryon growth were recovered. One QTL, mgr1, which contributes 12.1% of growth variations, was located near the mating type A (MAT-A) loci. Overall, this newly constructed high-resolution genetic map (or bin map) could be used as reference in future genetic, genomic, and breeding studies on H. erinaceus.
Introduction
Hericium erinaceus (Bull.) Pers., also called lion’s mane or yamabushitake, is a well-known culinary and medicinal mushroom and has been historically used in traditional Chinese medicine (He et al., 2017). H. erinaceus produces numerous bioactive compounds, including polysaccharides, terpenoids, proteins, lectins, and phenols (Friedman, 2015). Over the past decade, H. erinaceus has been extensively documented and exhibited a broad range of physiological and health-promoting properties such as antiaging, antioxidant, anticancer, immunomodulatory, and anti-gastritis and anti-metabolic diseases (Friedman, 2015; Tzeng et al., 2018; Wu et al., 2018).
Despite its nutritional and medicinal benefits, the current understanding of the molecular biology and genetics of H. erinaceus is limited. Hence, the genetic improvement of mushroom yield and quality is hampered, thereby preventing breeding of elite cultivars and ultimately affecting the sustainable development of the H. erinaceus industry. Its abundance in bioactive compounds, high yield, good quality, and resistance to diseases are the main targets of breeding schemes in mushrooms, including H. erinaceus (Gong et al., 2018a). However, the genetic improvement of these traits would be a great challenge because most of the traits of interest are governed by QTLs. The identification of QTLs underlying these complex traits through genetic mapping could greatly facilitate marker-assisted selection and accelerate the breeding progress (Gao et al., 2018).
High-resolution genetic linkage maps are crucial for the accurate identification and characterization of QTLs and candidate genes (Han et al., 2016). In addition, high-density genetic maps have been proven to be useful for various applications in marker-assisted selection, genome organization analysis, detection of recombination, and comparative genomic analysis (Gao et al., 2018). To date, only a few dozen genetic maps have been constructed for several widely cultivated mushrooms, including Agaricus bisporus (Foulongne-Oriol et al., 2010), Pleurotus spp. (Larraya et al., 2000; Okuda et al., 2009, 2012; Im et al., 2016; Gao et al., 2018), Lentinula edodes (Gong et al., 2016), and Auricularia auricula-judae (Lu et al., 2017). Most of the genetic linkage maps of edible mushrooms were generated using a few 10s to 100s of PCR-based markers (Foulongne-Oriol, 2012; Gong et al., 2016). The low coverage of genetic markers across genomes has hindered the identification of trait-regulating QTLs and genes. In H. erinaceus, no genetic linkage map has been generated to date, thereby preventing the identification of genotype–phenotype associations.
The development of genetically segregating populations is a prerequisite to genetic linkage-based mapping. Biparental populations such as F2, backcrosses, doubled haploids, recombinant inbred lines, and near-isogenic lines are commonly used in genetic map construction and QTL mapping in crops (Xu et al., 2017). In mushrooms, the selection of appropriate mapping populations relies on their reproductive mode (Foulongne-Oriol, 2012). The key to genetic map construction is the accurate estimation of recombination frequency during meiosis (Meng et al., 2015). F1 progenies such as SSIs derived from products of meiosis are ideal populations for genetic mapping and are frequently used in mushrooms (Gong et al., 2016; Gao et al., 2018). For the size of mapping populations, it is rare to use more than 100 progenies derived from meiotic spores in mushrooms, which limits mapping accuracy (Foulongne-Oriol, 2012).
In the past, the construction of a genetic map was quite tedious and time-consuming owing to the sample-by-sample low-throughput genotyping of markers in a set of mapping individuals (Foulongne-Oriol, 2012). The emergence of next-generation sequencing has simplified genetic map construction using high-throughput genotyping-by-sequencing, which allows the simultaneous discovery and genotyping of SNPs across the genomes of mapping individuals (Galpaz et al., 2018; Paudel et al., 2018). Despite the increase in the number of edible mushrooms that have been sequenced or resequenced (Grigoriev et al., 2014), the application of genotyping-by-sequencing in mushroom genetic studies is rare. High-throughput genotyping strategies have only recently been utilized in rapid genotyping of mushrooms (Au et al., 2013; Seplyarskiy et al., 2014; Gao et al., 2018). In H. erinaceus, no application of genotyping-by-sequencing in genetic studies has been reported.
Herein, through de novo SNP discovery and genotyping by high-throughput resequencing analysis of 127 SSIs in a mapping population, we constructed the first ultra-high-density genetic linkage map of H. erinaceus. Then, genome assemblies and the genetic map were integrated. The application of this newly developed genetic map in QTL mapping was also elucidated. Our objectives were to (1) construct a high-resolution genetic map for further genetic research and (2) detect QTLs for monokaryon growth in H. erinaceus.
Materials and Methods
Fungal Strains and Mapping Population
Hericium erinaceus monokaryon strains CS-4 (CCTCC AF 2018025) and 911-4 (CCTCC AF 2018054) were obtained from protoclones of the dikaryon strains HeCS (CCTCC AF 2018028) and He911 (CCTCC AF 2018027). The hybrid strain HeC9 was generated by mating between CS-4 and 911-4. The spores of HeC9 were isolated using spine-based elution (Gong et al., 2018b). In detail, we randomly selected eight spines, where the basidiospores are located, from a single mature fruiting body of HeC9. The basidiospores on the eight spines were washed with sterile water and then cultured in malt extract agar medium (3% malt extract, 0.3% soya peptone, and 1.5% agar). After germination, monokaryotic SSIs were randomly selected and identified under a microscope on the basis of the absence of clamp connections. Among the identified monokaryons, a total of 127 F1 SSIs derived from the hybrid strain HeC9 were selected and used as mapping population. All H. erinaceus strains used in this study were deposited at the Institute of Bast Fiber Crops, Chinese Academy of Agricultural Sciences (Changsha, China).
Single-Nucleotide Polymorphism Identification
The genome of parent monokaryon CS-4 was de novo sequenced using the Illumina and PacBio platform. The genome of CS-4 was initially assembled using PacBio long reads and further corrected using accurate Illumina short reads. Finally, a 41.2-Mb genome of H. erinaceus, which consisted of 52 scaffolds with an N50 of 2.1 Mb, was assembled and used as reference genome (NCBI BioProject PRJNA541374, accession number SZZO00000000). For high-throughput genotyping of individuals in the mapping population, all of the 127 SSIs were resequenced using the Illumina HiSeq X Ten system at Shanghai OE Biotech., Co., Ltd., The total genomic DNA of monokaryon 911-4 and 127 SSIs was extracted from freeze-dried mycelia using a TIANGEN plant genomic DNA kit by following the manufacturer’s protocol. The DNA concentration was adjusted to 20 ng/μl. The paired-end libraries with an insert size of 350 bp were constructed for the subsequent paired-end (PE150) sequencing. Monokaryon 911-4 was sequenced with 240-fold genome coverage, and all of the 127 SSIs were sequenced with at least 20-fold coverage in this study.
The raw paired-end reads of monokaryon 911-4 and 127 SSIs were trimmed to remove the adaptors and low-quality bases using fastp (Chen et al., 2018). The reads were filtered with a sliding window of size 4, with average Phred score scale of 20 within the window. The trimmed reads were mapped to the CS-4 genome using bwa-mem v 0.7-17 (Li, 2013) with default parameters. SAMtools (Li et al., 2009) was used to position sort the aligned reads, and Picard tools (version 2.18.171) was used to remove duplicates according to the mapping coordinates. SNP calling was performed according to the best practice pipeline using the GATK v 3.8.1 (McKenna et al., 2010). Briefly, the variants were called for SSI by the HaplotypeCaller with default parameters. A joint genotyping step for comprehensive variations union was performed on the gVCF files. In the initial filtering step, the SNP filter expression was set as QD < 2.0| | MQ < 40.0| | FS > 60.0| | SOR > 3.0| | MQRankSum < −12.5| | ReadPosRankSum < −8.0. Because all the SSIs in mapping population were monokaryons, only bi-allelic homozygous SNPs with a minimum mapping depth of 8 were retained. SNPs that were missing in more than 30% of the progeny were also removed.
Bin Map Construction and Anchoring of Scaffolds
To increase mapping efficiency, individual SNPs were combined into recombination bins as genetic markers (Huang et al., 2009). We first merged the adjacent SNPs with the same genotype within 500 bp into consolidated SNPs (designated as Tags) using the script “SNP_genotyper.py.” To generate a set of high-quality non-redundant markers for genetic map construction, the co-segregated SNPs (Tags) were combined into a recombination bin. Then, using the python script “SNP_cosegregation.py,” the best tag with the most complete genotypic information was selected, on behalf of all the SNPs in a given bin, for map construction. The two scripts “SNP_genotyper.py” and “SNP_cosegregation.py” were released by Qi et al. (2018)2. For each bin, the genotype identical to CS-4 was marked as “a,” whereas that to 911-4 was marked as “b.”
Thus, a set of bins was employed as markers to construct a bin map using Joinmap 4.0 software (Van Ooijen and Voorrips, 2006) with the HAP1 model and default settings. Bin markers were assigned into LGs at an independence test LOD score from 3.0 to 10.0. The Kosambi mapping function was used to estimate the map distances. Bin map orders were scrutinized manually and, when necessary, further adjusted. After that, the co-segregated SNPs were re-added into the bin map to get the final genetic map. The integration of genome assemblies and the genetic map was performed using mapped bins as anchors. By comparing mapped SNP positions on scaffolds and positions on the genetic map, scaffolds of the CS-4 genome were anchored on LGs. The LGs of the bin map were graphically exhibited using the MapChart (Voorrips, 2002). Alignment of the genetic map and genome scaffolds was graphically exhibited using Circos (Krzywinski et al., 2009).
Quantitative Trait Locus Mapping of Monokaryon Growth
For all the 127 SSIs, mgrs were determined on the malt extract agar medium, which were calculated as the radial extension of each mycelial colony per day (Gong et al., 2014). All the SSIs were incubated at 25°C in the dark with three repetitions. The effect of genotype on mgrs was assessed by one-way ANOVA using the Statistical Package for the Social Sciences version 25 (SPSS, Inc., Chicago, IL, United States). QTLs for mgr were scanned by CIM in WinQTLCart 2.5 (Wang et al., 2012). One thousand permutation tests were conducted to obtain the threshold for significant QTLs (p < 0.05). QTL confidence interval was identified as a genomic range with 1 LOD drop from the LOD peak of the QTL. To verify the result of CIM mapping, the inclusive CIM (ICIM) was also employed using QTL IciMapping v4.0 (Li et al., 2007) with mapping parameters of 1 cM step and 0.001 probabilities in stepwise regression.
Results
Genotyping of Single-Spore Isolate Population and Bin Map Construction
A total of 10 Gb of clean reads were generated for parent monokaryon 911-4 (240-fold genome coverage). At least 1 Gb of clean reads was obtained for each SSI (at least 24-fold genome coverage), with > 85% of the bases higher than Q30 (Supplementary Table S1). For all 127 SSIs, more than 90% of the clean reads could be aligned to the CS-4 reference genome. For parent monokaryon 911-4, 85.5% of the clean reads could be aligned to the CS-4 genome (Supplementary Table S1). Over 0.9 million SNPs were called within this SSI population. After SNP filtering and bin calling, we obtained a total of 1,522 bins. Only bins with minor allele frequencies (MAFs) > 20% were kept for subsequent linkage analyses.
Finally, a total of 1,174 bins consisting of 37,082 consolidated SNPs were grouped into 15 LGs (Table 1). The total genetic length of the bin map was 1,096.5 cM and covered 31.1 Mb of the CS-4 genome. The average length of the bins was 26.5 kb, which was estimated as the ratio of covered physical lengths to the total number of mapped bins. In total, 50% of bin markers were < 5 kb in length, and there were three big bins larger than 1.0 Mb (Supplementary Figure S1). The number of bin markers per LG varied from 15 to 117, with an average of 78.3. The size of LGs ranged from 18.6 to 99.5 cM, with an average of 73.1 cM. The average interval of bins in most of LGs was less than 1.0 cM. No gap over 10 cM was found, and the maximum gap interval was detected on LG4 (7.86 cM). The distribution of bin markers on LGs is shown in Figure 1, and the genetic and physical positions of bins are presented in Supplementary Table S2. In the CS-4 genome, mating-type genes were identified by genome annotation and homology search. Mating-type loci A and B were mapped to scaffold6 and scaffold7, respectively. Accordingly, MAT-A and MAT-B were respectively mapped to LG1 (Tag_1981, 46.3 cM) and LG9 (Tag_28779, 48.9 cM) in the bin map (Figure 1). The correspondence between LG ID and chromosomes remained unresolved because the number of chromosomes in H. erinaceus is unknown.
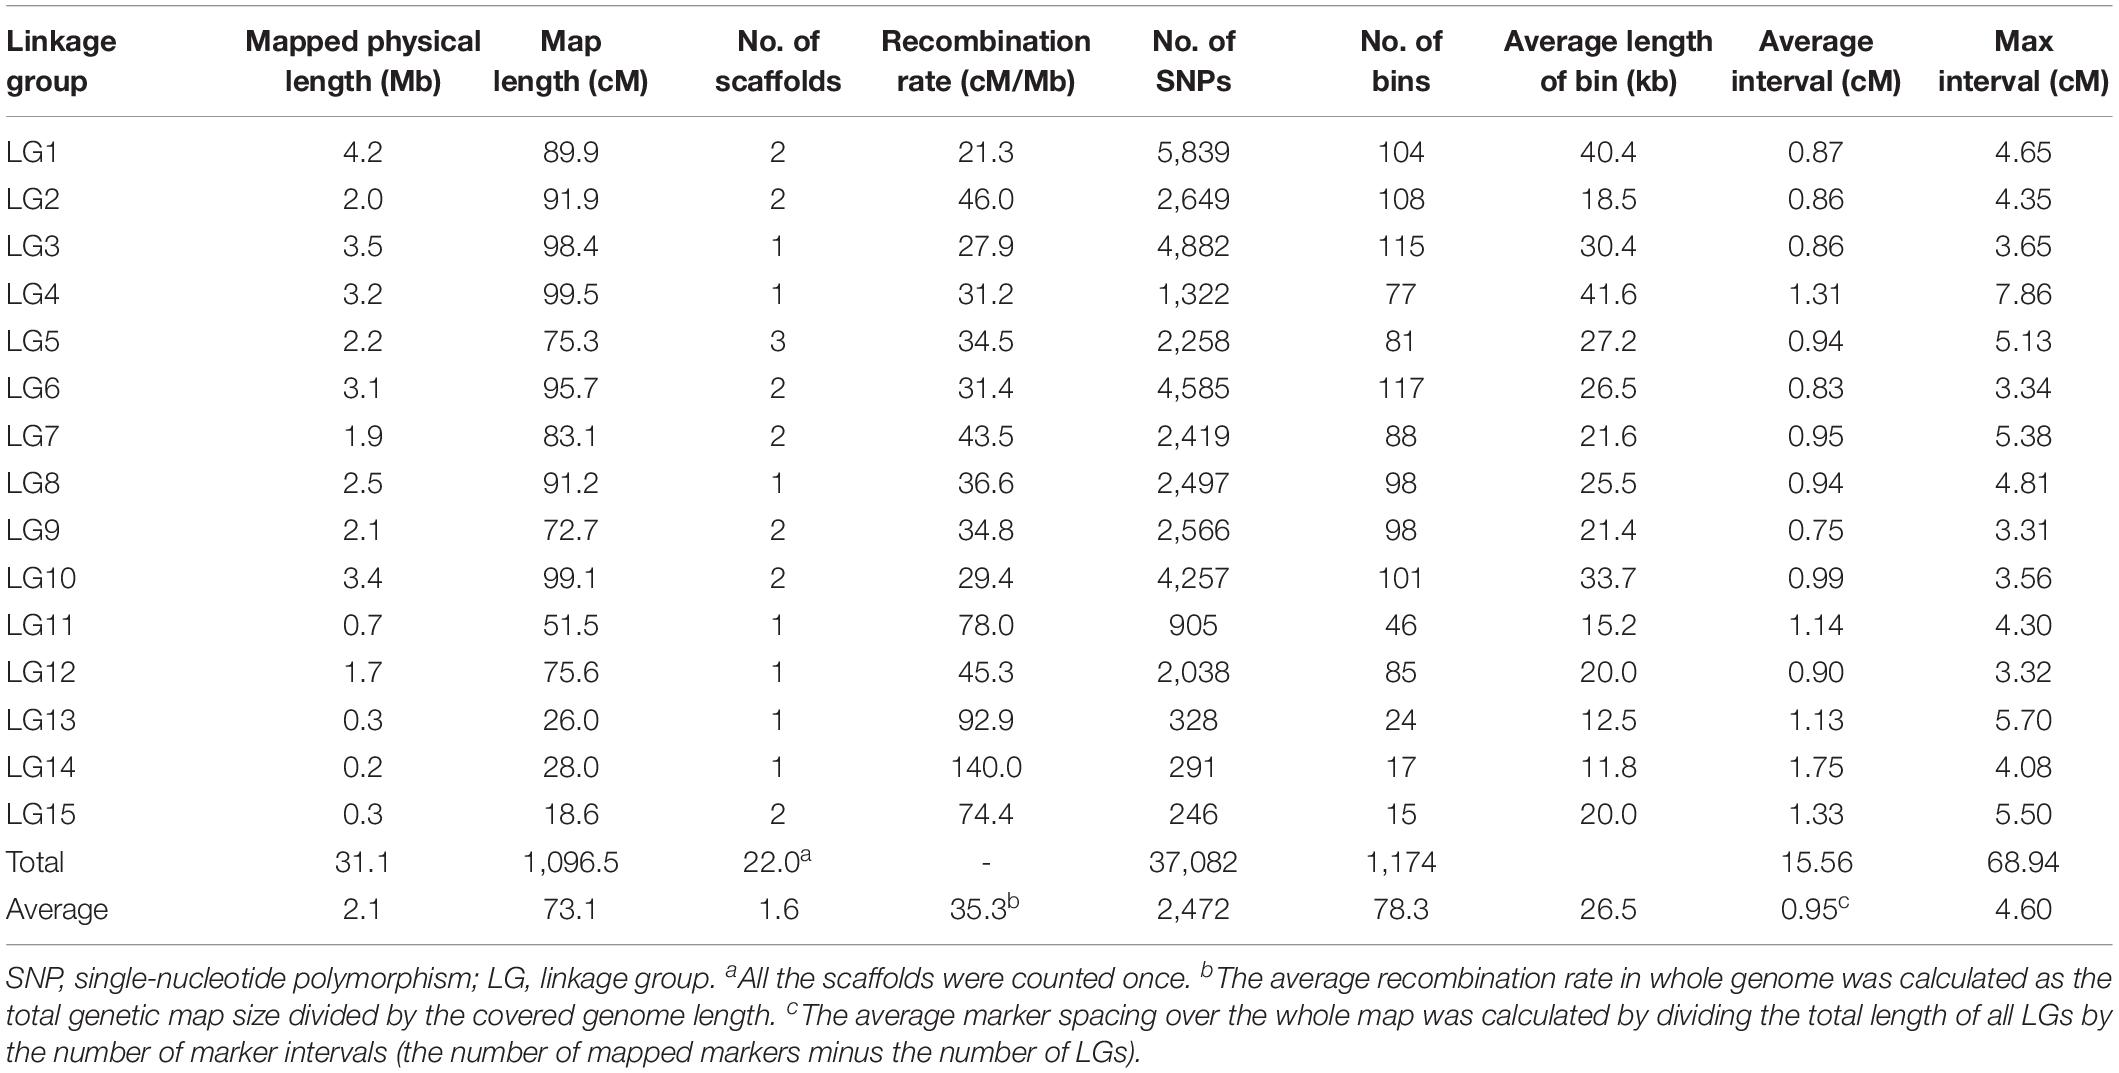
Table 1. Characteristics of the genetic map of Hericium erinaceus.
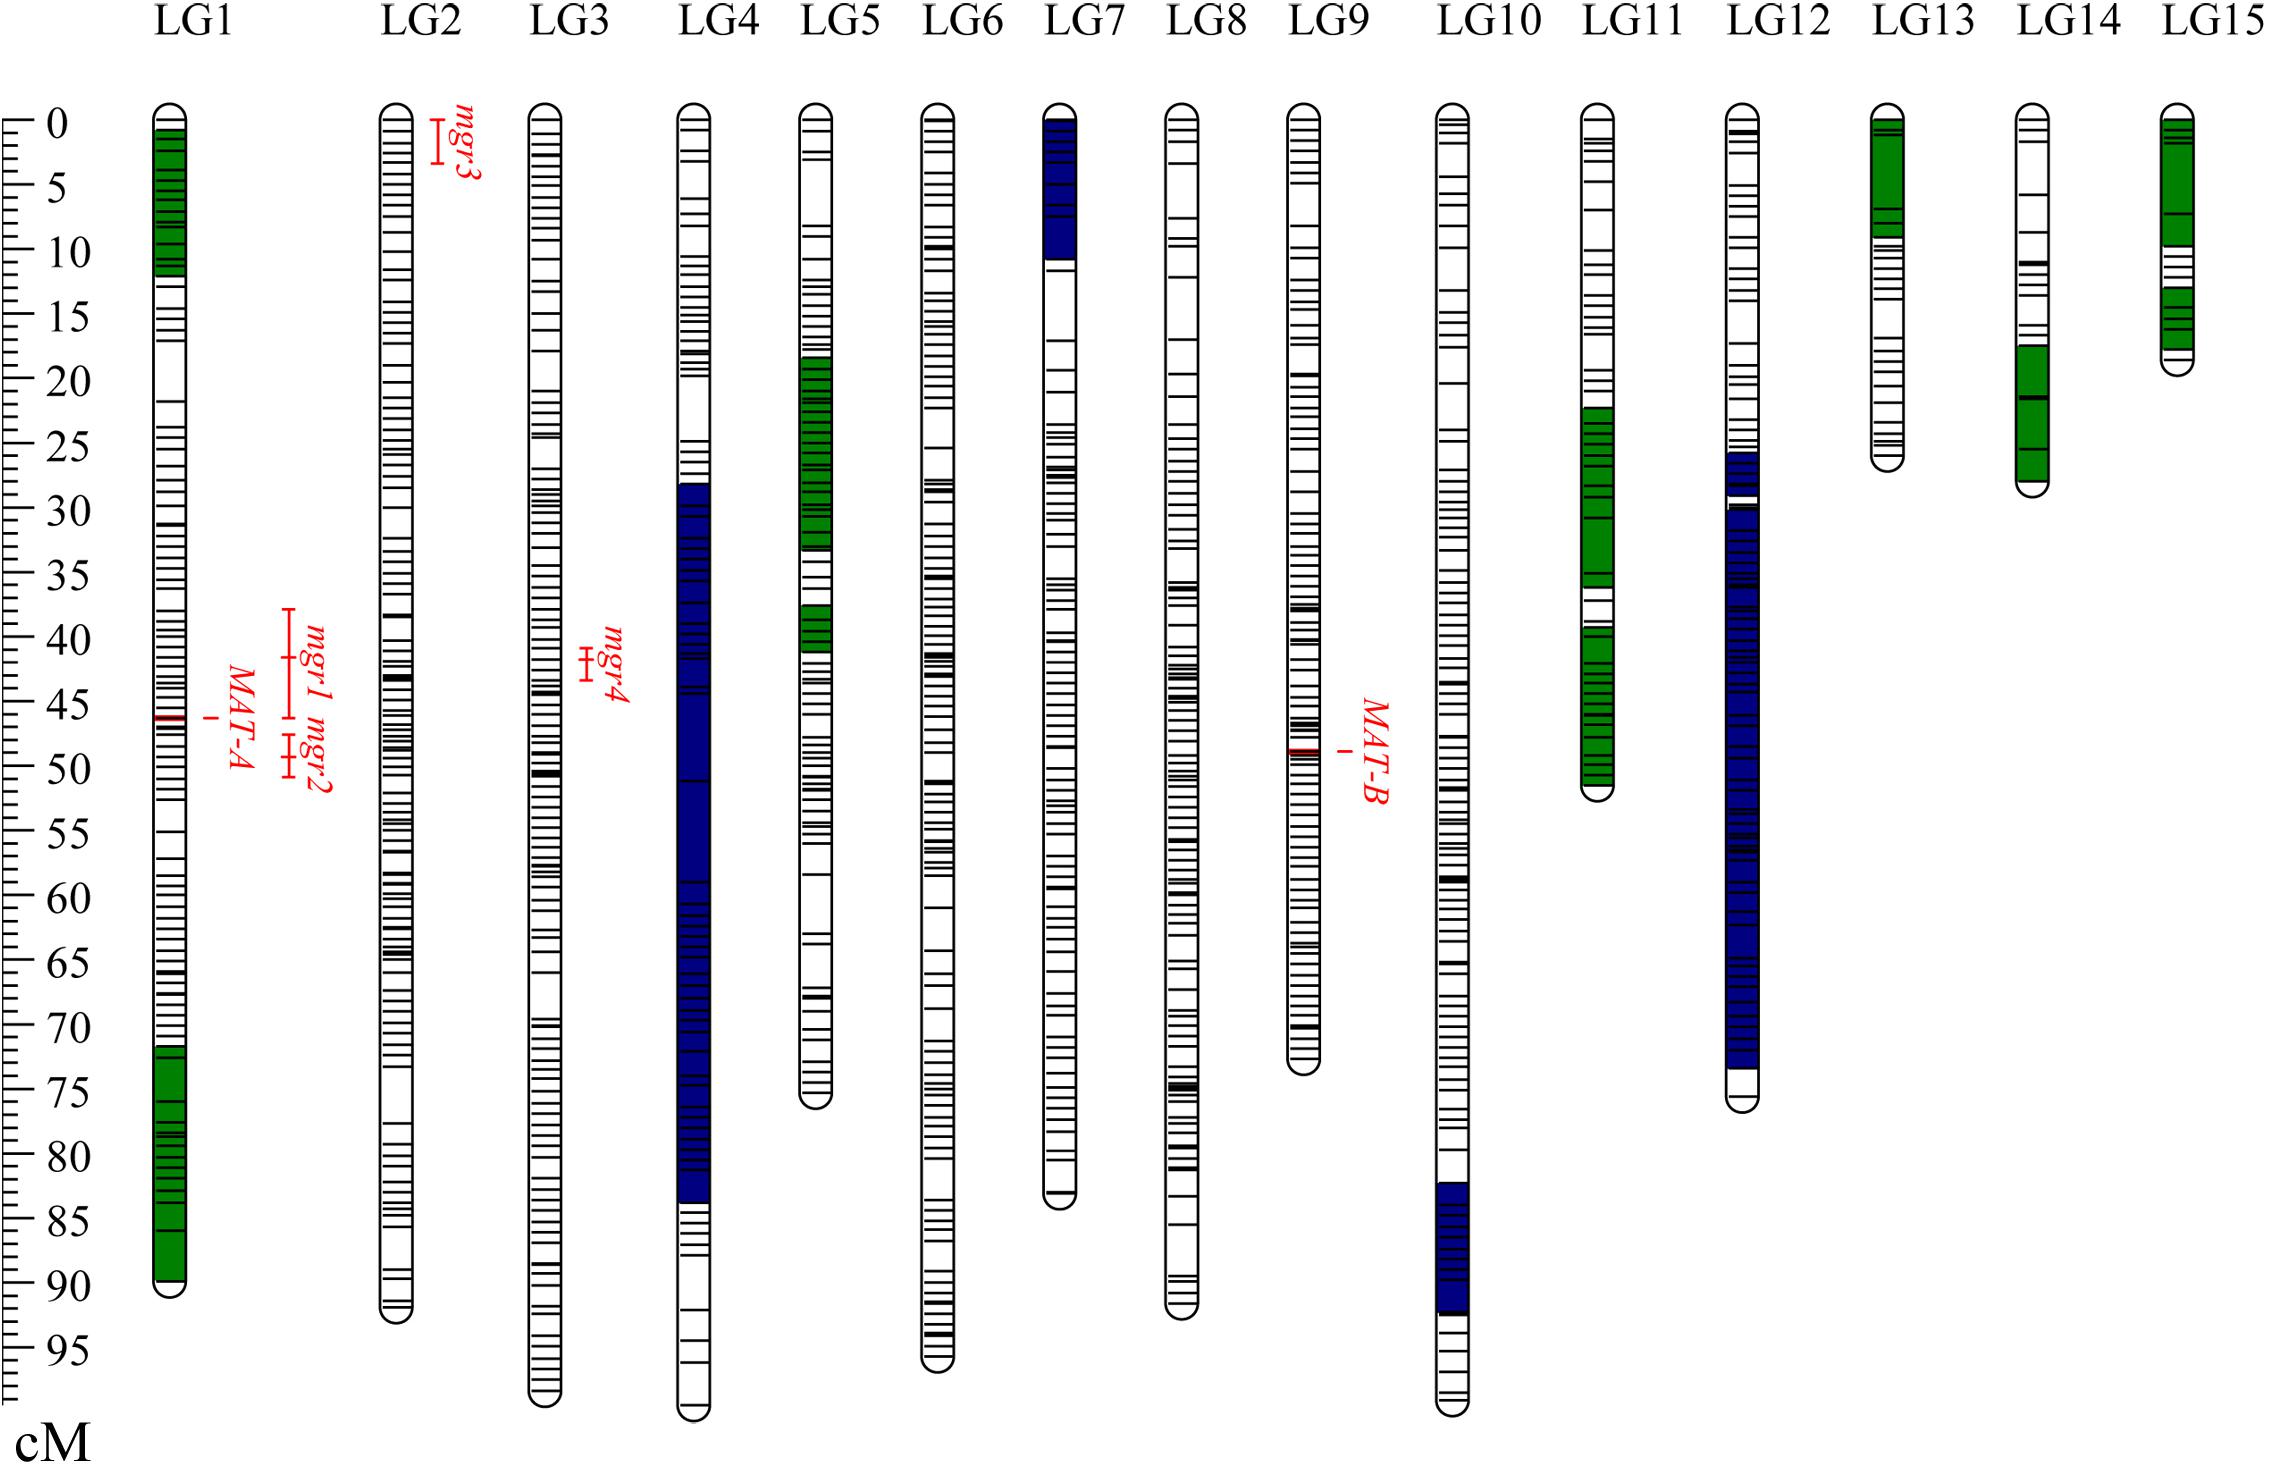
Figure 1. Distribution of bins on the genetic linkage map of Hericium erinaceus. The 15 LGs were randomly designated as LG1–LG15. Short lines in the LG bars indicate bin markers. The genetic position of bins is shown with a genetic ruler on the left. Segments in green representing the skewed bins in the segregation distortion regions are biased to CS-4, whereas segments in blue indicating the skewed bins are biased to 911-4. Four QTLs for mgr are shown on the right side of the LGs. The LOD-1 confidence interval is indicated by the length of the QTL bar, and the position of the LOD peak is represented by the short line in the middle of the QTL bar.
Because limited crossovers occurred in the artificial biparental mapping population, for a given SSI, the large genome fragments from the same parent monokaryon were found (Figure 2). For all SSIs, no more than two crossovers occurred in LG1. In several SSIs such as 1-14 and 8-8, the whole segment of LG1 was inherited from CS-4, and no crossover was observed. The similar inheritance pattern was also detected in the other LGs (Figure 2). However, for all the 15 LGs, no SSI was inherited exclusively from a single parental line. Among all the SSIs, the minimal proportion of parental genotypes was 23.9% and 26.0%, which came from CS-4 and 911-4, respectively.
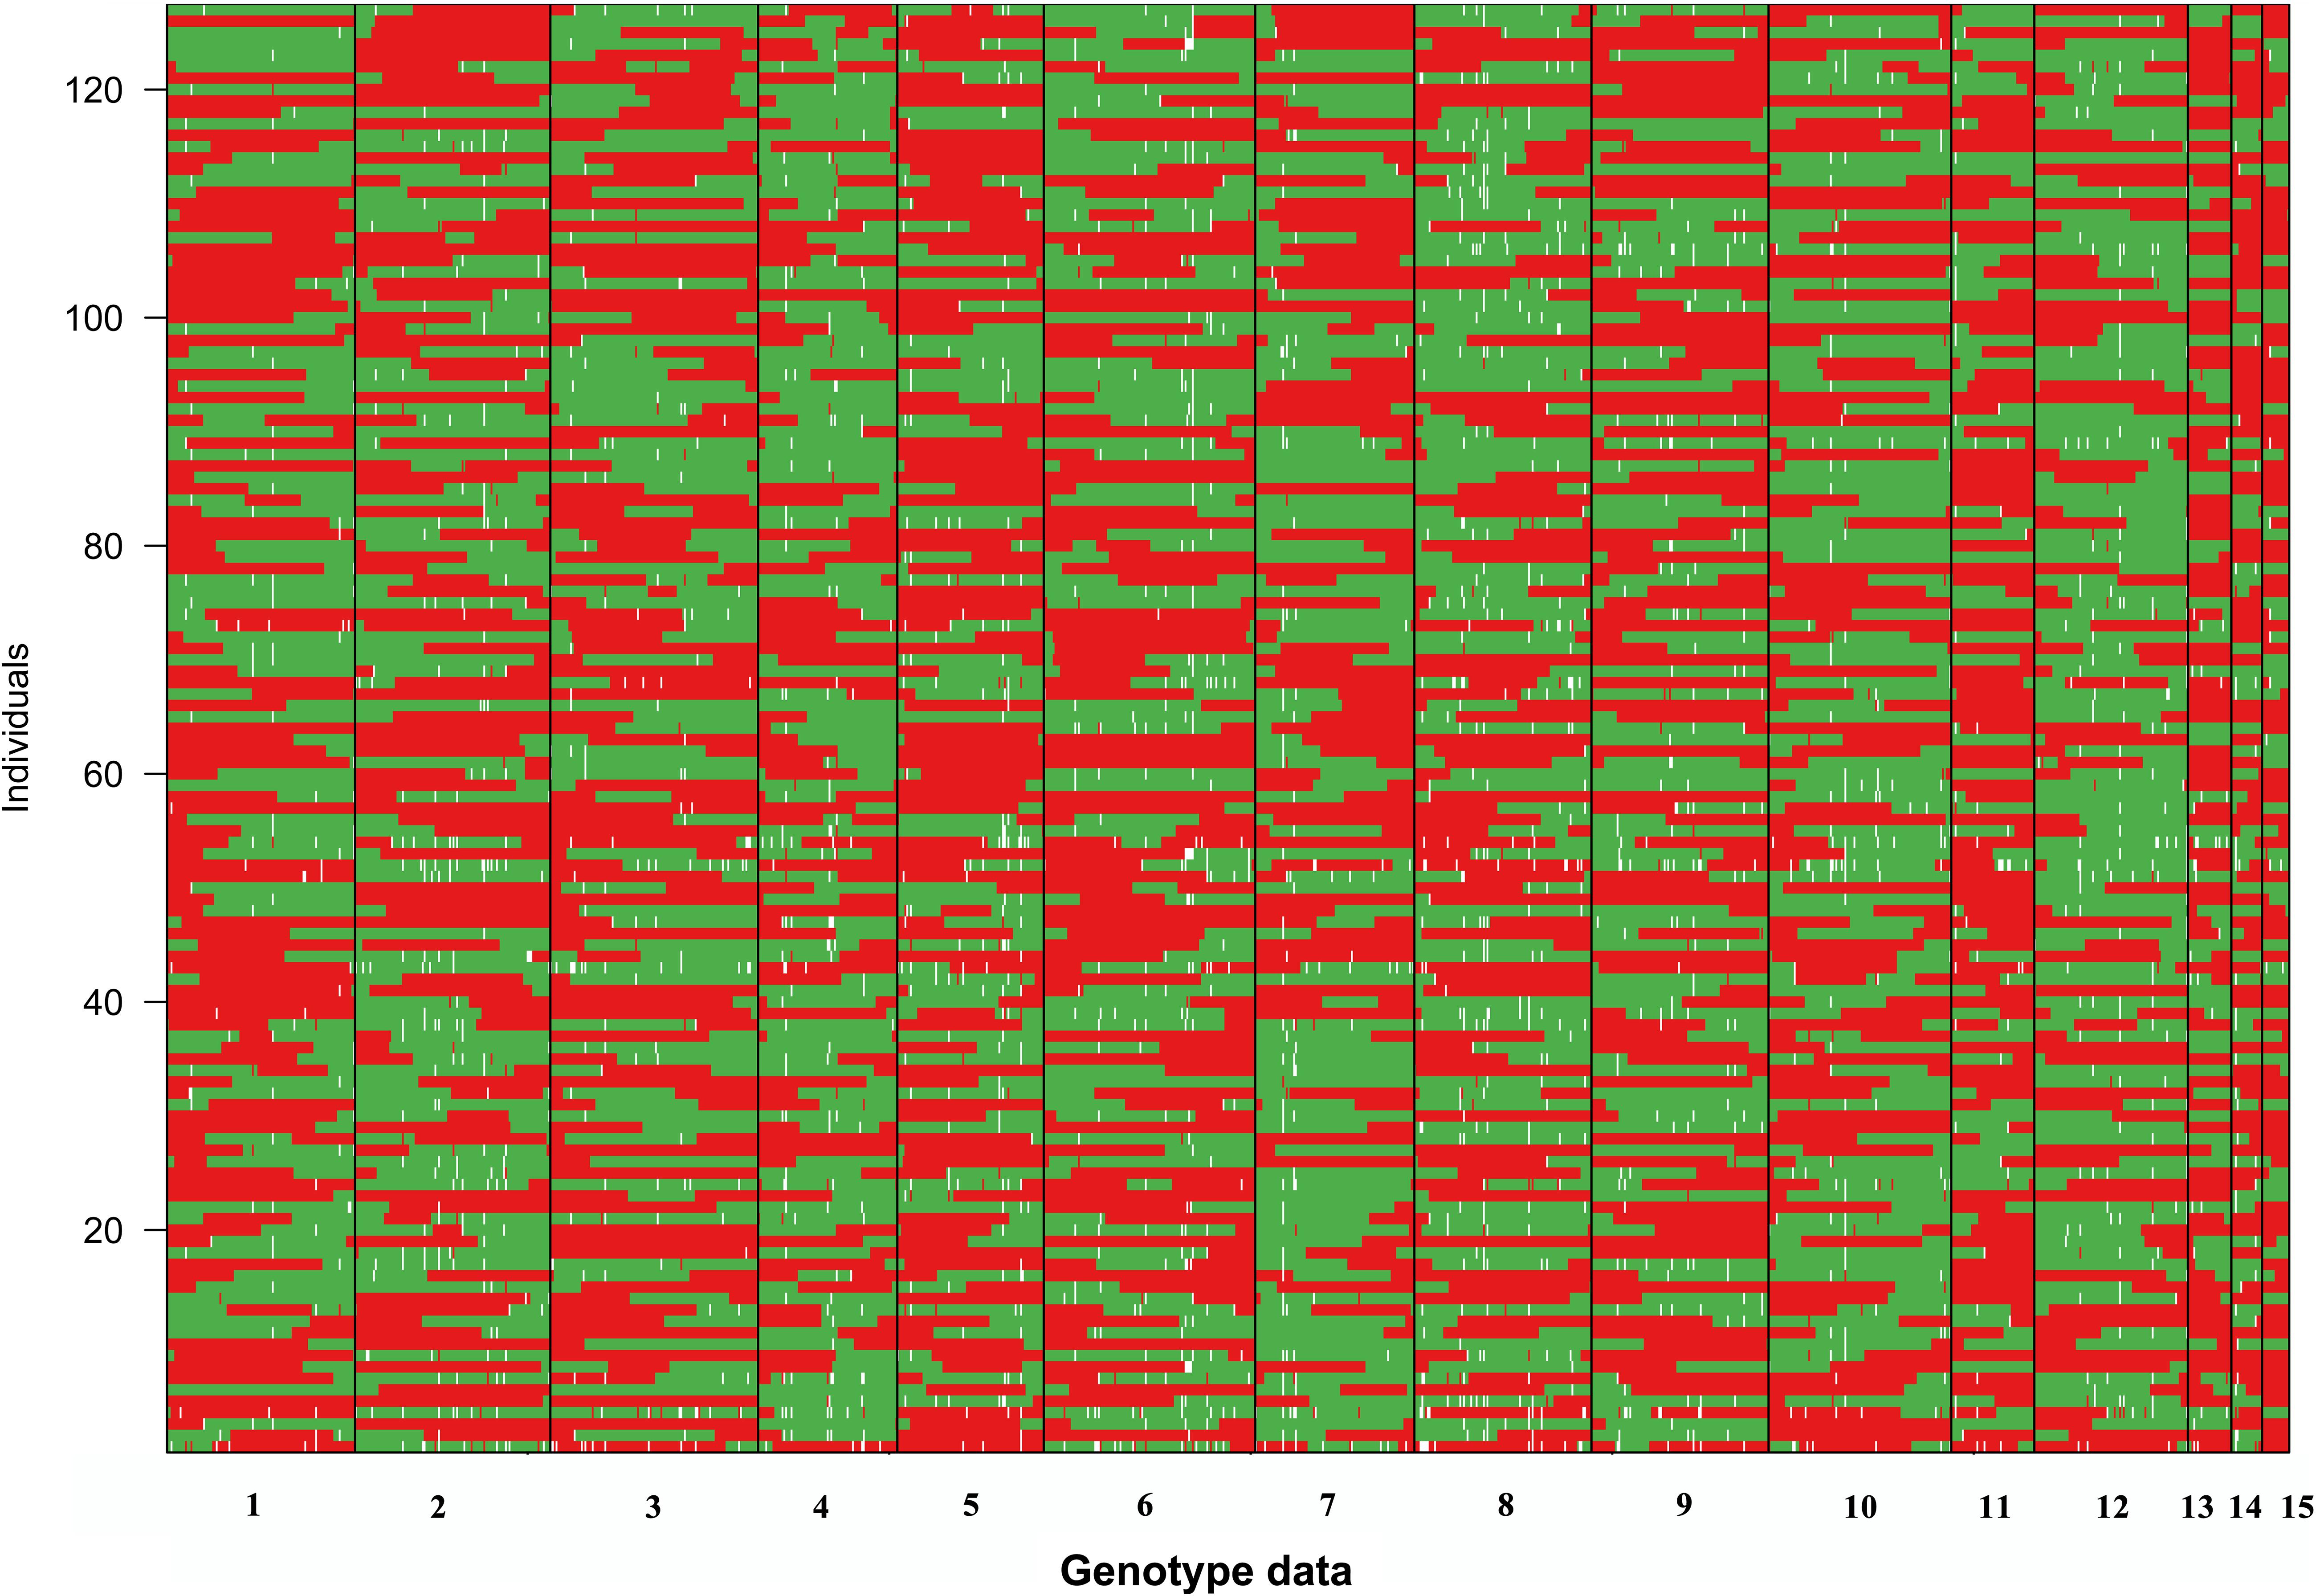
Figure 2. Visualization of the genotype of SSIs. The red segments originated from parent monokaryon CS-4, whereas the green segments are from 911 to 4. Missing data are shown in white.
In this SSI population, 242 (20.7%) mapped bins were found to be skewed (p < 0.001), of which 110 bins were biased to the direction of parental line CS-4, whereas the remaining skewed bins were biased to 911-4. A total of 220 skewed bins (90.9%) were clustered as SDRs, which were defined as regions with three or more closely linked markers exhibiting segregation distortion (Paillard et al., 2003). A total of 15 SDRs, with 5–50 skewed bins per SDR, were distributed across 10 LGs (Table 2). All of the skewed bins in a given SDR skewed toward the same parent. The average genetic length of SDRs was 15.4 cM and varied from 3.6 to 55.6 cM.
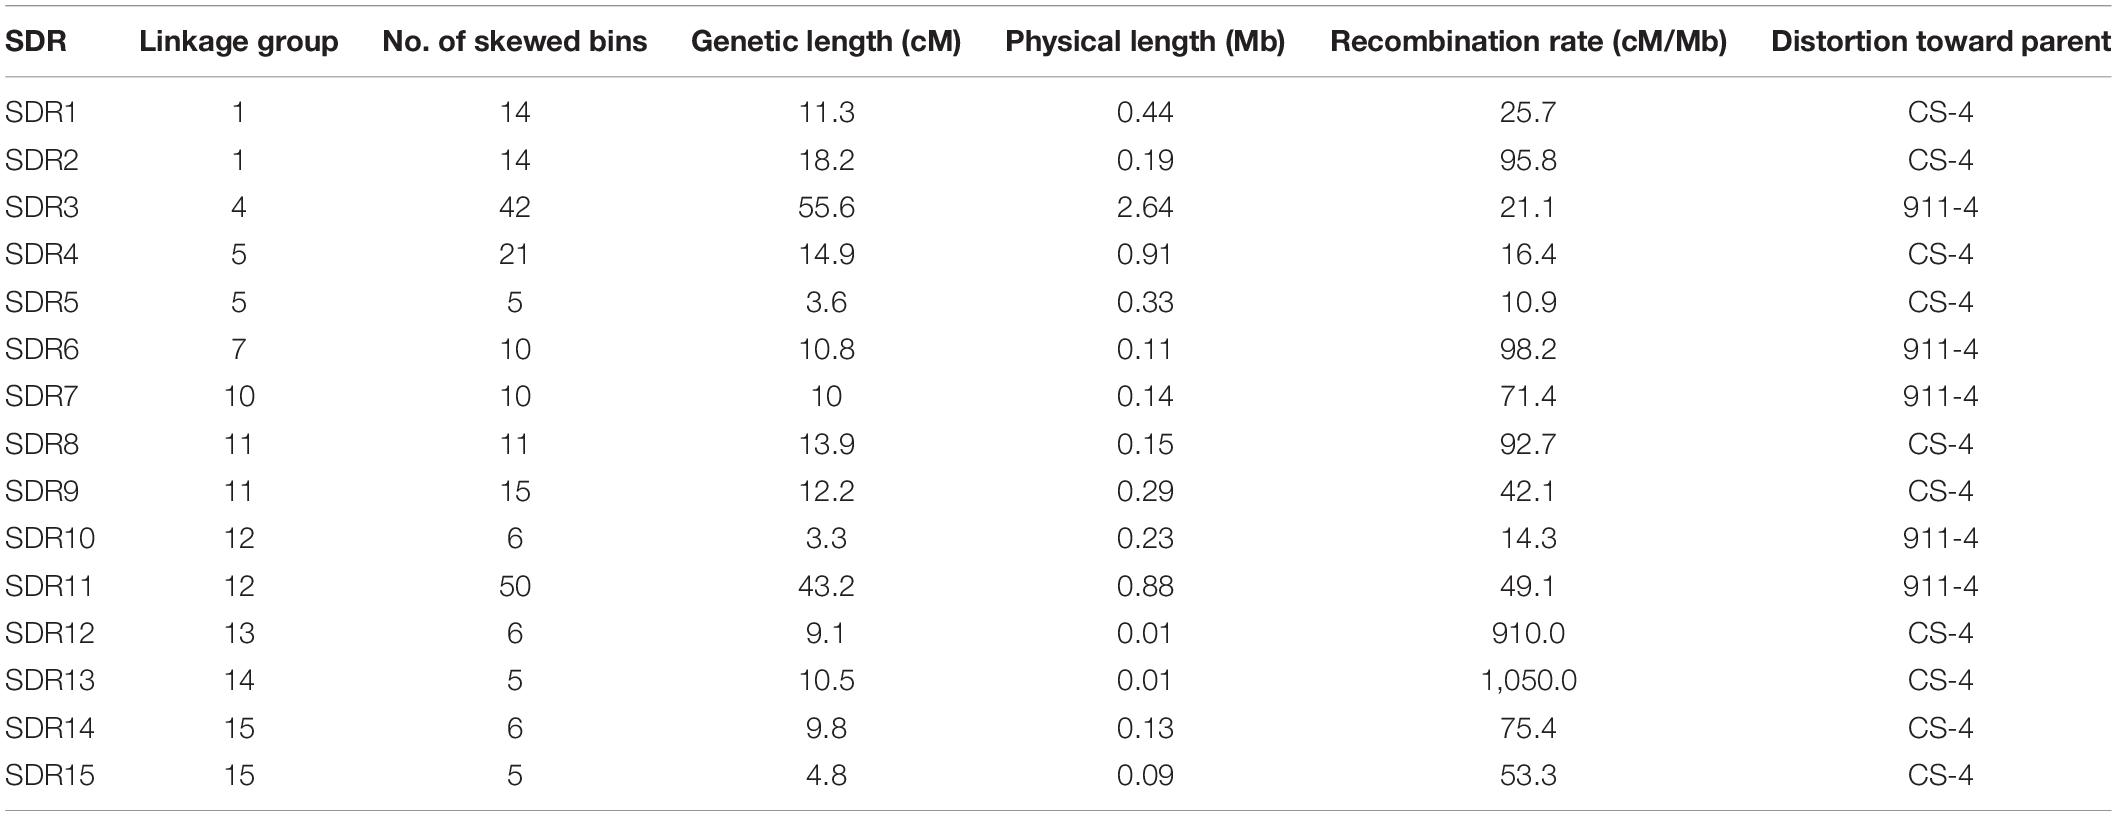
Table 2. Segregation distortion regions detected in the genetic map of Hericium erinaceus.
Alignment of Genome Assemblies to Genetic Map
Using bin markers as anchors, we aligned 22 scaffolds (total length: 38.8 Mb), representing 94.2% of the CS-4 genome, into 15 LGs of the genetic map. The schematic of assembled scaffolds-genetic map integration is shown in Figure 3. A high level of collinearity relationship between the physical sequence and genetic map of H. erinaceus was observed. An overwhelming majority of the marker orders on each LG were consistent with their position on the genome. Most of the scaffolds were mapped to a single LG, except for scaffold3 and scaffold6. Scaffold3 was dissected into two parts, corresponding to LG5 and LG7, whereas scaffold6 was divided into LG1 and LG2. Seven scaffolds corresponded to seven LGs (Table 1). A part of scaffold6 (∼3.8 Mb), gathered with scaffold18, was mapped to LG1, whereas the remainder of scaffold6, gathered with scaffold25, was anchored to LG2. In addition, LG5, LG6, LG7, LG9, LG10, and LG15 corresponded to two or three scaffolds (Supplementary Table S3).
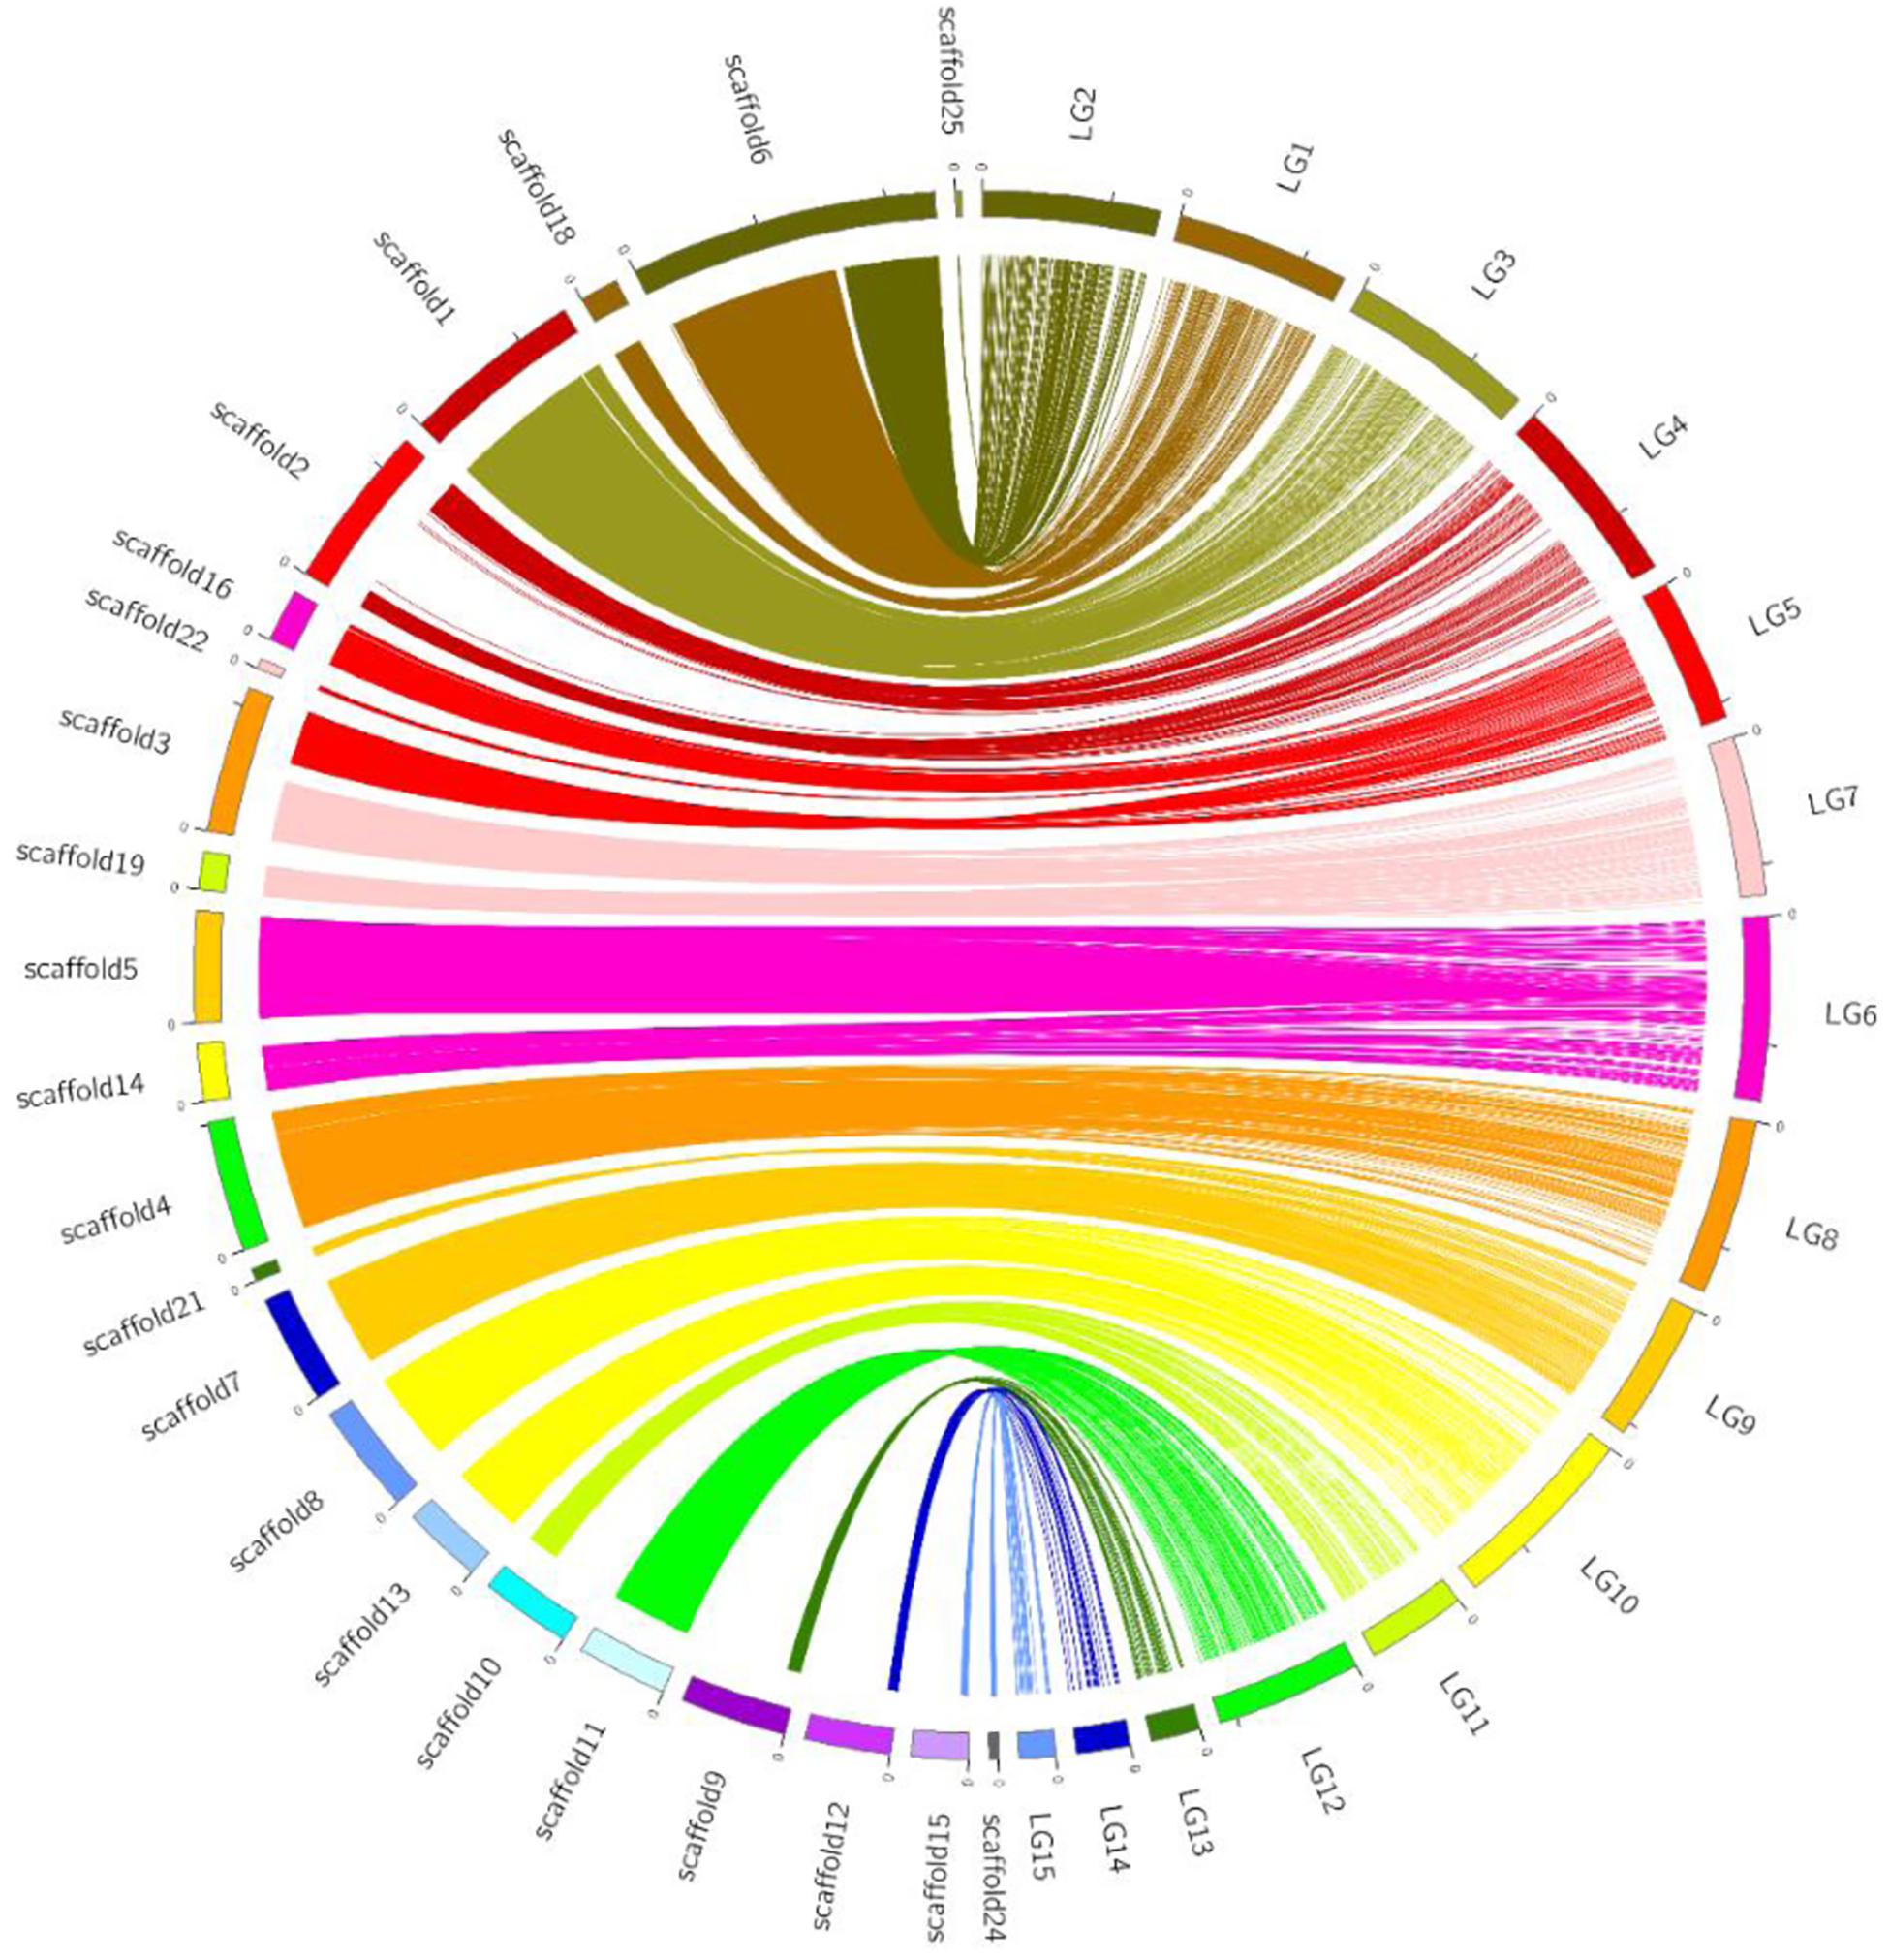
Figure 3. Graphical representation of the syntenic relationship between the physical and genetic maps of H. erinaceus. Linkage groups are depicted in colors at the right side of the circle, and the corresponding scaffolds are at the left side of the circle. Lines of the same colors connected the bins on LGs and physical positions on scaffolds.
The average recombination rate in H. erinaceus, calculated as the ratio of total genetic map size to covered physical lengths, was 35.3 cM/Mb. The recombination rates of different LGs varied from 21.3 to 140 cM/Mb. The recombination rate per LG was significantly negatively correlated with the physical length (r2 = 0.736, p < 0.001). The recombination rates of the three small LGs were relatively high. Compared with the other LGs, in LG1, the lowest recombination rate was observed (21.3 cM/Mb), where the MAT-A loci were located. To identify variations in recombination rates within chromosomes, the 37,082 consolidated SNPs were re-mapped into this genetic map. The SNPs in the same recombination bin had the same genetic position (Supplementary Table S4). We then divided the genome into non-overlapping 10-kb windows and calculated the recombination rate of the genome. The high level of variations in recombination rate within chromosomes was observed, with some regions entirely devoid of recombination and some regions exhibiting high recombination rates (Supplementary Figure S2). Recombination hotspot regions were defined as the chromosomal regions that presented an estimated recombination rate greater than a 10-fold increase in the genome-wide recombination rate (>350 cM/Mb) (Laurent et al., 2016). Accordingly, a total of 56 recombination hotspot regions were identified and unevenly distributed on the 15 LGs (Supplementary Figure S2 and Supplementary Table S5). The highest recombination rate (1,972.6 cM/Mb) was observed on LG8 (scaffold4: 30–31 kb), which was over 55-fold higher than the genome average recombination rate. In most cases, the higher recombination rates were observed in the LG ends, suggesting potential telomeric regions (Supplementary Figure S2). No crossover was detected in the 0.5-Mb region surrounding the MAT-A loci, suggesting a recombination coldspot. A normal recombination rate (37.4 cM/Mb) was observed in the region surrounding MAT-B loci. We also calculated the guanine–cytosine (GC) contents in the 56 recombination hotspot regions. Compared with that in the genomic background, the GC content was significantly higher in recombination hotspot regions (57.8% vs. 52.3%, Student’s t-test, p = 1.4 × 10⁻²¹).
Quantitative Trait Locus Mapping for Monokaryon Growth
The mgrs of the two parent monokaryons CS-4 and 911-4 were 3.2 and 1.29 mm/day, respectively. For the 127 SSIs, mgrs ranged from 0.33 to 4.27 mm/day, with an average of 1.89 mm/day (Figure 4). A significant effect of genotype on mgrs was revealed by one-way ANOVA (p < 0.01). The distribution of mgrs of SSIs derived from different spines is shown in Supplementary Figure S3. No significant difference was detected among growth rates of different spine-derived SSIs (p = 0.56). With the use of CIM, a total of four QTLs for mgrs were detected, of which two QTLs (mgr1 and mgr4) were also verified by ICIM (Supplementary Figure S4). Together, the four QTLs accounted for 39.2% of mycelial growth variations, and the phenotypic variance explained by a single QTL ranged from 8.0% to 12.1% (Table 3). The physical length of the confidence intervals for these QTLs ranged from 52 to 2,467 kb. Both mgr1 and mgr2 imparted negative additive effects and were mapped to adjacent regions of LG1. Notably, mgr1, which was linked to Tag_5097, was mapped to the region encompassing 37.9 to 46.3 cM of LG1, where MAT-A was located. With a narrow confidence interval (40.9–43.4 cM, 52.3 kb) on LG4, mgr4 was detected by CIM and ICIM and linked to bin marker Tag_12452. We then analyzed the genes in the confidence intervals of the four QTLs. Only 22 and 19 protein-coding genes were encompassed in the small physical intervals of mgr3 and mgr4, respectively. However, 100s of genes were included in the confidence intervals of mgr1 and mgr2 on LG1. Several genes (such as those encoding homeodomain transcription factor, zinc finger transcription regulator, and glycosyltransferase), which had been reported to be possibly involved in vegetative growth and morphology of fungi, were localized within QTLs (Supplementary Table S6).
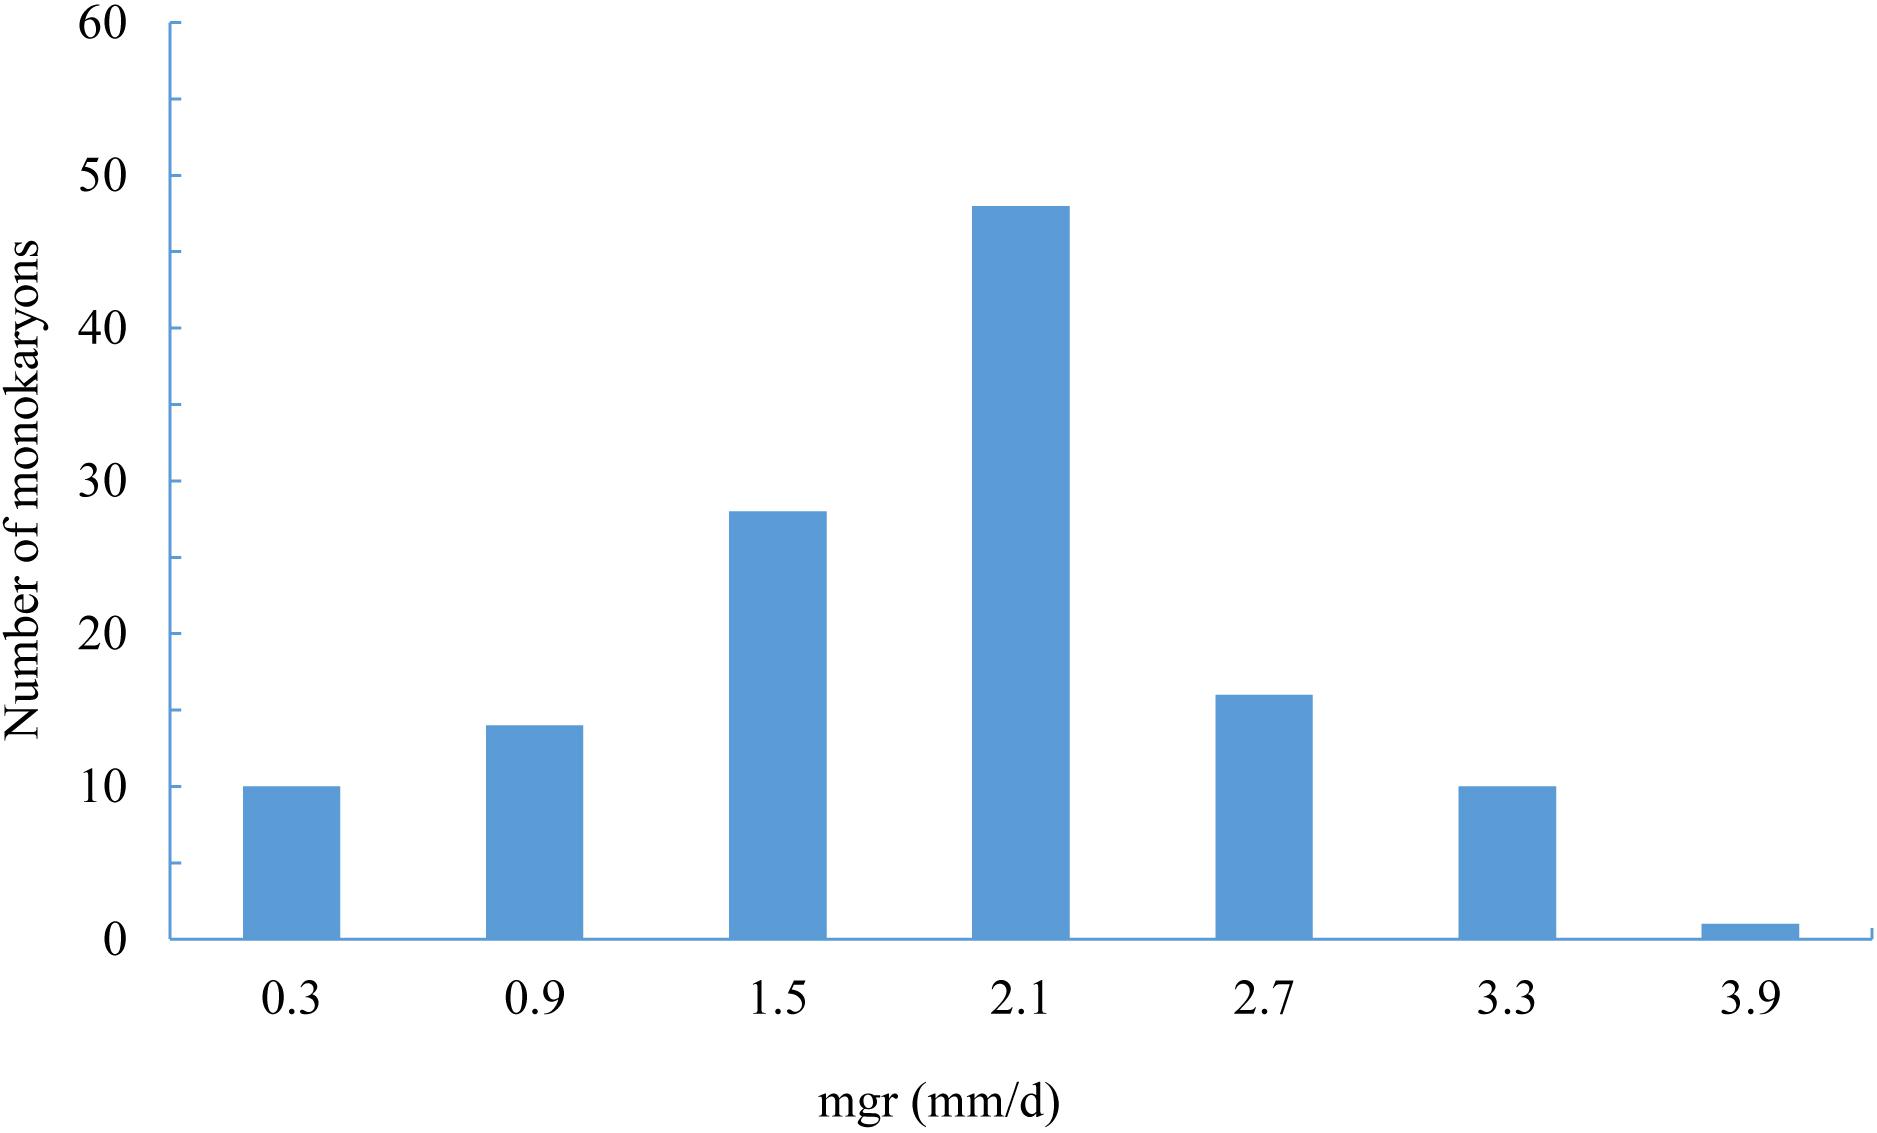
Figure 4. The distribution of monokaryon growth rates in SSI individuals.
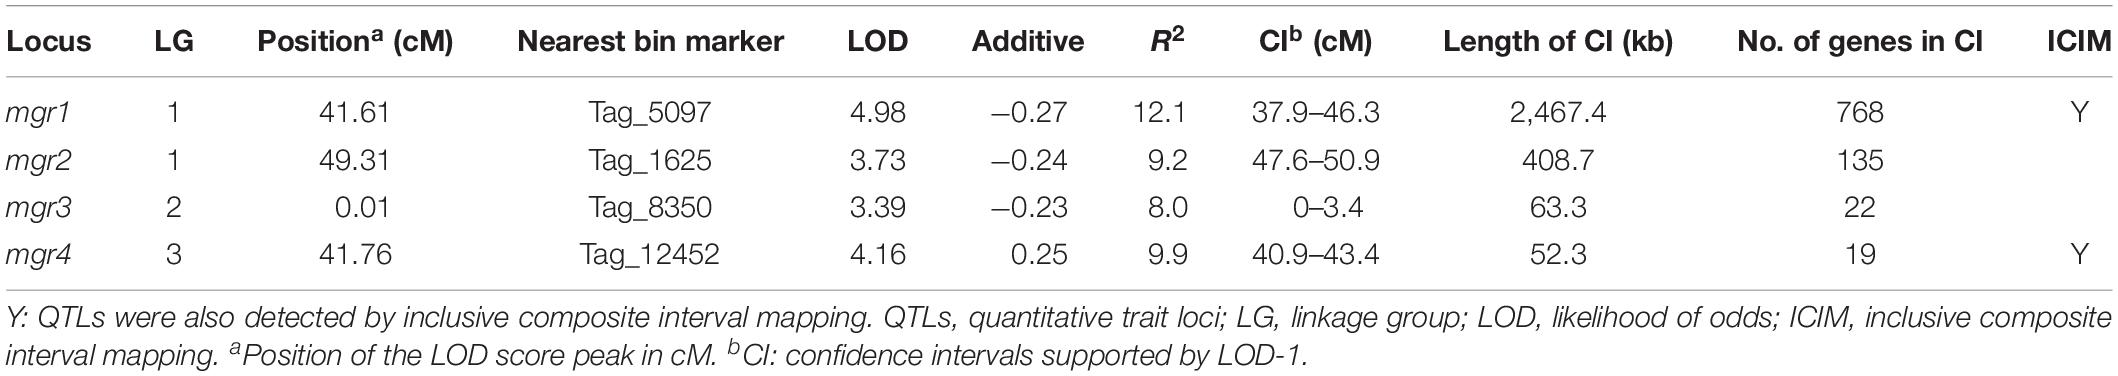
Table 3. Quantitative trait loci controlling the monokaryon growth rate of Hericium erinaceus.
Discussion
Construction of a High-Dense Bin Map
High-resolution genetic linkage maps play indispensable roles in genetic, genomic, and breeding studies. To date, genetic studies on mushrooms are hindered by the fact that only a few genetic maps are currently available, and only a few 100 non-specific PCR-based markers have been explored (Foulongne-Oriol, 2012). Rapid advances in high-throughput sequencing have revolutionized SNP discovery and genotyping analyses (Hu et al., 2017). Here, by employing resequencing analysis of 127 SSIs in a mapping population, we constructed the first high-resolution genetic map of H. erinaceus. Because there are a relatively small number of recombination events in biparental mapping populations, high-throughput genotyping by sequencing-based approaches results in highly redundant markers per recombination bin (Jordan et al., 2018). Genotyping errors and missing data in these large datasets provide substantial challenges in map construction (Ronin et al., 2017). In this study, marker redundancy was reduced by calling bins that were defined by the recombination breakpoints on chromosomes. Then, the recombination bins were used in linkage map construction as the representative set of genetic markers. The recombination bin strategy for high-resolution genetic mapping has been extensively employed in plants (Han et al., 2016; Hu et al., 2017; Galpaz et al., 2018), but not in mushrooms. Here, a total of 37,082 consolidated SNPs that were grouped into 1,174 bins were mapped in the H. erinaceus genetic map. With the use of high-throughput SNP genotyping, the interval of markers reported here (<1.0 cM, no gap > 10 cM) was shorter than that of previously reported genetic maps in other mushrooms such as A. bisporus (Foulongne-Oriol et al., 2010) and Pleurotus spp. (Larraya et al., 2000; Im et al., 2016; Gao et al., 2018). This map also provides a reference for anchoring and sorting scaffolds during the assembly of the H. erinaceus genome.
The present genetic map covered 1,096.5 cM, spanning 15 LGs, of which three (LG13, LG14, and LG15) were relatively small. Currently, the number of chromosomes in H. erinaceus remains unclear. By microscopic observation, Zhou and Liu (1996) initially suggested that there were 12 chromosomes in H. erinaceus. The 12 large LGs may correspond to 12 chromosomes, and 3 small LGs correspond to small chromosome segments. Filtering of extremely distorted SNPs or bins during map construction may be one of the causes of fragmentation of a few chromosomes. Additional experiments such as contour-clamped homogeneous electric field gel analysis and high-throughput chromosome conformation capture analysis would provide more instructive clues on the actual number and conformation of H. erinaceus chromosomes.
Distorted segregation of markers has been commonly reported in linkage analysis (Manrique-Carpintero et al., 2016). The cluster distribution of skewed loci as SDRs has also been observed in other mushrooms, for example, A. bisporus (Foulongne-Oriol et al., 2010), L. edodes (Gong et al., 2014), and P. eryngii (Okuda et al., 2012). Several hypotheses such as the expression of lethal factors, biased selection of SSIs, and unbalanced selection of recognition loci have been used to explain distorted segregation of loci in fungi (Larraya et al., 2000; Foulongne-Oriol et al., 2010). No bias in segregation of bin markers surrounding the MAT-type loci was observed, suggesting that selection on the recognition loci could not be considered as the main cause of distorted segregation in this study. Most of the SDRs were relatively large with parent-specific segregation, suggesting that genetic factors influencing spore germination and growth are likely the causes for segregation distortion in this mapping population. One concern is that segregation distortion of markers may affect mapping quality (Hackett and Broadfoot, 2003). In this study, no differences in terms of mapping order due to distorted segregation were observed based on the high collinearity of the physical sequence and the genetic map.
Alignment of Genome Assemblies and Genetic Map
The availability of a high-quality genome and genetic map greatly aids the identification of functional genes and genetic improvement of cultivars (Han et al., 2016). The high collinearity between sequence assemblies and the genetic map indicated that both the genetic map and genome assembly achieved high fidelity. Approximately, 94.2% (38.8 Mb, 22 scaffolds) of the CS-4 genome was anchored to the 15 LGs or pseudo-chromosomes. The unanchored scaffold, for example, scaffold20 (∼0.5 Mb), was enriched with repeated sequences. The majority of SNPs on this scaffold were heterozygous and thus were excluded from genetic mapping. In this study, a slight inconsistency of marker order on LGs and physical position on scaffolds was also observed, especially in regions with very low or no recombination (Supplementary Table S2), which was mainly caused by genotyping errors and missing data according to our in-house test.
Recombination plays a crucial role in the evolution of genomes, and extensive variations in recombination rates have been reported across sexually reproducing fungi (Laurent et al., 2016). In the button mushroom A. bisporus var. bisporus, genome-wide recombination suppression has been reported (∼11 cM/Mb), and meiotic crossovers were restricted to chromosome ends (Sonnenberg et al., 2016). The genome-wide recombination rate estimated in this study for H. erinaceus (35.3 cM/Mb) was higher than that of A. bisporus var. bisporus but was comparable with that of other mushrooms, for example, ∼32 cM/Mb in P. ostreatus (Larraya et al., 2000) and 31.6 cM/Mb in P. tuoliensis (Gao et al., 2018). Our results provided a comprehensive view of the recombination landscape in H. erinaceus. The recombination rate showed a highly uneven distribution among and along chromosomes, and recombination hotspot and coldspot regions were observed. The 56 recombination hotspot regions identified here could facilitate marker-assisted selection and accelerate the breeding progress by construction of populations with the higher recombination rate in specific genome regions. Suppressed recombination of the genomic regions involved in mating compatibility has been frequently reported in fungi (Idnurm et al., 2015). In H. erinaceus, an obvious recombination suppression or recombination coldspot was also found in the region surrounding the MAT-A loci. The increase in recombination rate in subtelomeric regions was observed in many species (Laurent et al., 2016). In this study, the higher recombination rates were observed for the three small LGs (LG13–LG15), which suggested that these were likely telomeres or subtelomeric regions of other chromosomes.
Quantitative Trait Loci for Monokaryon Growth
One principal interest of genetic maps is to identify QTLs or genes for phenotypic traits of interest. The application of this newly developed genetic map of H. erinaceus in QTL mapping was also elucidated. Mycelial growth has attracted tremendous interest owing to its correlation with resistance to diseases (Larraya et al., 2002). Four QTLs for mycelial growth were detected and together contributed 39.2% of total mycelial growth variation, which indicated that mgrs were shaped by multiple small-effect loci. The QTL mgr1 was localized near MAT-A. In some Basidiomycetes, an association of mycelial growth and sexual recognition has been observed (van der Nest et al., 2009; Sivolapova et al., 2012; Gong et al., 2014). The results of the present study in H. erinaceus have provided additional evidence that mycelial growth is influenced by sexual recognition loci. However, only part of the QTLs for mycelial growth was positioned near the recognition loci. There seemed to be a correlation without causal relation between mycelial growth and the sexual recognition system. The confidence interval of mgr1 was significantly longer than the remaining three loci, which may be caused by the recombination suppression of regions surrounding the MAT-A loci. The low recombination rate (3.4 cM/Mb) of this confidence interval implied that it is arduous to narrow down the boundaries of the target loci and identify the underlying genes.
The integration of the genome assembly and genetic map allowed us to screen for putative candidate genes in QTL regions. Several genes, which have been reported to be possibly involved in vegetative growth and morphology of fungi, were found within the confidence intervals of these QTLs. For instance, several transcription factors such as homeodomain protein, MADS box transcription factor, and zinc finger protein were found within the confidence interval of mgr1. In Schizophyllum commune, transcription factors regulate various aspects of fruiting body formation, and the homeodomain protein Hom1 is involved in stimulating vegetative growth (Pelkmans et al., 2017; Vonk and Ohm, 2018). Similarly, in Botrytis cinerea, the homeobox bchox8 gene was also found to be involved in vegetative growth and morphology (Antal et al., 2012). One C2H2-type zinc finger transcription regulator was found in the bin marker Tag_5097, which was located on the position of the LOD score peak of mgr1. In Tag_1625 (the peak position of mgr2), a DHHC-type zinc finger protein gene was also identified. In S. commune and A. bisporus, the Cys2His2 zinc finger protein gene c2h2 has been shown to be involved in mushroom formation (Pelkmans et al., 2016). Two glycosyltransferase genes involved in glycosylphosphatidylinositol (GPI)-anchor biosynthesis were found in the peak positions of mgr3 and mgr4. In fungi, GPI-anchored proteins often possess enzymatic activities that modify cell wall polymers and are indispensable for the continuous shape adaptation of the cell wall (De Groot et al., 2005). In Candida albicans, a glucosyltransferase coding gene PHR1 plays a critical role in hyphal wall formation (Ragni et al., 2011). In Ustilago maydis, most of the genes encoding enzymes involved in the synthesis of the GPI anchor and secreted proteins were upregulated in the mycelium form compared with the yeast phase (Robledo-Briones and Ruiz-Herrera, 2013). Subsequent studies were required to further confirm the involvement of these genes in modifying vegetative growth. Nevertheless, the bin markers closely linked to these QTLs could be used in marker-assisted improvement. These putative candidate genes also provide clues in elucidating the molecular mechanism of vegetative growth in H. erinaceus.
Conclusion
This study reported the utilization of the genotype-by-sequencing method for identification and genotyping of SNPs in H. erinaceus. The first high-resolution genetic map of H. erinaceus was generated using the genome-wide scale genotyping data of 127 SSIs. Then, by alignment of the scaffolds to LGs, high collinearity between the genome assembly and genetic map was revealed. In addition, four QTLs associated with mgr were also detected in the subsequent QTL mapping. The present study demonstrates the potential of using the newly developed genetic map to uncover the loci or genes regulating important agronomic and economic traits such as yield. Overall, this newly constructed high-resolution genetic map could be used as a reference in future genetic, genomic, and breeding studies.
Data Availability Statement
The datasets generated for this study can be found in the NCBI BioProject: PRJNA541374, accession number: SZZO00000000.
Author Contributions
WG conceived and designed the experiments, performed the experiments, analyzed the data, and wrote the manuscript. CX, YZ, and ZZ performed the experiments. YW analyzed the phenotypic and genotypic data. YP conceived and designed the experiments and reviewed drafts of the manuscript. All authors read and approved the final manuscript.
Funding
This work was financially supported by the National Natural Science Foundation of China (Grant No. 31701981), the Agricultural Science and Technology Innovation Program of China (CAAS-ASTIP-2017-IBFC), and a grant from the China Agriculture Research System for Bast and Leaf Fiber Crops (No. CARS-19-E26).
Conflict of Interest
The authors declare that the research was conducted in the absence of any commercial or financial relationships that could be construed as a potential conflict of interest.
Acknowledgments
We thank LetPub (www.letpub.com) for providing linguistic assistance during the preparation of this manuscript.
Supplementary Material
The Supplementary Material for this article can be found online at: https://www.frontiersin.org/articles/10.3389/fmicb.2019.03129/full#supplementary-material
FIGURE S1 | The distribution of bin marker length.
FIGURE S2 | The distribution of recombination rate in Hericium erinaceus. The recombination rates were estimated within non-overlapping 10-kb windows across the genome. The variations of recombination rates along LG1-LG12 are shown.
FIGURE S3 | The box plot of monokaryon growth rate of SSIs derived from different spines.
FIGURE S4 | Manhattan plot of QTLs for mgr. Based on the 1,000 permutation test, the LOD threshold for significant QTLs (p < 0.05) was 2.98, which was marked in a blue line.
TABLE S1 | Re-sequence data of 127 SSIs and 911-4.
TABLE S2 | Bin map information.
TABLE S3 | Scaffolds coverage of linkage groups.
TABLE S4 | The physical and genetic position of SNPs.
TABLE S5 | The distribution of recombination hot regions.
TABLE S6 | Genes in QTLs confidence intervals.
Abbreviations
CIM, composite interval mapping; ICIM, inclusive composite interval mapping; LG, linkage group; LOD, likelihood of odds; MAT-A, mating type A; mgrs, monokaryon growth rates; QTL, quantitative trait locus; SDR, segregation distortion region; SNP, single-nucleotide polymorphism; SSIs, single-spore isolates.
Footnotes
- ^ http://broadinstitute.github.io/picard/
- ^ http://research.franklin.uga.edu/devoslab/scripts-used-gbs-pipeline
References
Antal, Z., Rascle, C., Cimerman, A., Viaud, M., Billon-Grand, G., Choquer, M., et al. (2012). The homeobox BcHOX8 gene in Botrytis cinerea regulates vegetative growth and morphology. PLoS One 7:e48134. doi: 10.1371/journal.pone.0048134
Au, C. H., Cheung, M. K., Wong, M. C., Chu, A. K., Law, P. T., and Kwan, H. S. (2013). Rapid genotyping by low-coverage resequencing to construct genetic linkage maps of fungi: a case study in Lentinula edodes. BMC Res. Notes 6:307. doi: 10.1186/1756-0500-6-307
Chen, S., Zhou, Y., Chen, Y., and Gu, J. (2018). Fastp: an ultra-fast all-in-one FASTQ preprocessor. Bioinformatics 34, i884–i890. doi: 10.1093/bioinformatics/bty560
De Groot, P. W., Ram, A. F., and Klis, F. M. (2005). Features and functions of covalently linked proteins in fungal cell walls. Fungal Genet. Biol. 42, 657–675. doi: 10.1016/j.fgb.2005.04.002
Foulongne-Oriol, M. (2012). Genetic linkage mapping in fungi: current state, applications, and future trends. Appl. Microbiol. Biotechnol. 95, 891–904. doi: 10.1007/s00253-012-4228-4
Foulongne-Oriol, M., Spataro, C., Cathalot, V., Monllor, S., and Savoie, J. M. (2010). An expanded genetic linkage map of an intervarietal Agaricus bisporus var. bisporus×A. bisporus var. burnettii hybrid based on AFLP, SSR and CAPS markers sheds light on the recombination behaviour of the species. Fungal Genet. Biol. 47, 226–236. doi: 10.1016/j.fgb.2009.12.003
Friedman, M. (2015). Chemistry, nutrition, and health-promoting properties of Hericium erinaceus (Lion’s Mane) mushroom fruiting bodies and mycelia and their bioactive compounds. J. Agric. Food. Chem. 63, 7108–7123. doi: 10.1021/acs.jafc.5b02914
Galpaz, N., Gonda, I., Shem-Tov, D., Barad, O., Tzuri, G., Lev, S., et al. (2018). Deciphering genetic factors that determine melon fruit-quality traits using RNA-Seq-based high-resolution QTL and eQTL mapping. Plant J. 94, 169–191. doi: 10.1111/tpj.13838
Gao, W., Qu, J., Zhang, J., Sonnenberg, A., Chen, Q., Zhang, Y., et al. (2018). A genetic linkage map of Pleurotus tuoliensis integrated with physical mapping of the de novo sequenced genome and the mating type loci. BMC Genom. 19:18. doi: 10.1186/s12864-017-4421-z
Gong, W. B., Li, L., Zhou, Y., Bian, Y. B., Kwan, H. S., Cheung, M. K., et al. (2016). Genetic dissection of fruiting body-related traits using quantitative trait loci mapping in Lentinula edodes. Appl. Microbiol. Biotechnol. 100, 5437–5452. doi: 10.1007/s00253-016-7347-5
Gong, W. B., Li, L., Zhou, Y., Bian, Y. B., Kwan, H. S., Cheung, M. T., et al. (2018a). Detection of quantitative trait loci underlying yield-related traits in shiitake culinary-medicinal mushroom, Lentinus edodes (Agaricomycetes). Int. J. Med. Mushrooms 20, 451–458. doi: 10.1615/IntJMedMushrooms.2018026236
Gong, W. B., Liu, W., Lu, Y. Y., Bian, Y. B., Zhou, Y., Kwan, H. S., et al. (2014). Constructing a new integrated genetic linkage map and mapping quantitative trait loci for vegetative mycelium growth rate in Lentinula edodes. Fungal Biol. 118, 295–308. doi: 10.1016/j.funbio.2014.01.001
Gong, W. B., Xie, C. L., Zhou, Y. J., Zhu, Z. H., Wang, Y. H., and Peng, Y. D. (2018b). A simple and effective method of single spore isolation of Hericium erinaceus. Edn. Med. Mushrooms 26, 363–366.
Grigoriev, I. V., Nikitin, R., Haridas, S., Kuo, A., Ohm, R., Otillar, R., et al. (2014). MycoCosm portal: gearing up for 1000 fungal genomes. Nucleic Acids Res. 42, D699–D704. doi: 10.1093/nar/gkt1183
Hackett, C. A., and Broadfoot, L. B. (2003). Effects of genotyping errors, missing values and segregation distortion in molecular marker data on the construction of linkage maps. Heredity 90, 33–38. doi: 10.1038/sj.hdy.6800173
Han, K., Jeong, H. J., Yang, H. B., Kang, S. M., Kwon, J. K., Kim, S., et al. (2016). An ultra-high-density bin map facilitates high-throughput QTL mapping of horticultural traits in pepper (Capsicum annuum). DNA Res. 23, 81–91. doi: 10.1093/dnares/dsv038
He, X., Wang, X., Fang, J., Chang, Y., Ning, N., Guo, H., et al. (2017). Structures, biological activities, and industrial applications of the polysaccharides from Hericium erinaceus (Lion’s Mane) mushroom: a review. Int. J. Biol. Macromol. 97, 228–237. doi: 10.1016/j.ijbiomac.2017.01.040
Hu, Z. Y., Deng, G. C., Mou, H. P., Xu, Y. H., Chen, L., Yang, J. H., et al. (2017). A re-sequencing-based ultra-dense genetic map reveals a gummy stem blight resistance-associated gene in Cucumis melo. DNA Res. 25, 1–10. doi: 10.1093/dnares/dsx033
Huang, X., Feng, Q., Qian, Q., Zhao, Q., Wang, L., Wang, A., et al. (2009). High-throughput genotyping by whole-genome resequencing. Genom. Res. 19, 1068–1076. doi: 10.1101/gr.089516.108
Idnurm, A., Hood, M. E., Johannesson, H., and Giraud, T. (2015). Contrasted patterns in mating-type chromosomes in fungi: hotspots versus coldspots of recombination. Fungal Biol. Rev. 29, 220–229. doi: 10.1016/j.fbr.2015.06.001
Im, C. K., Park, Y. H., Hammel, K. E., Park, B. Y., Kwon, S. W., Ryu, H. J., et al. (2016). Construction of a genetic linkage map and analysis of quantitative trait loci associated with the agronomically important traits of Pleurotus eryngii. Fungal Genet. Biol. 9, 50–64. doi: 10.1016/j.fgb.2016.05.002
Jordan, K. W., Wang, S., He, F., Chao, S., Lun, Y., Paux, E., et al. (2018). The genetic architecture of genome-wide recombination rate variation in allopolyploid wheat revealed by nested association mapping. Plant J. 95, 1039–1054. doi: 10.1111/tpj.14009
Krzywinski, M., Schein, J., Birol, I., Connors, J., Gascoyne, R., Horsman, D., et al. (2009). Circos: an information aesthetic for comparative genomics. Genom. Res. 19, 1639–1645. doi: 10.1101/gr.092759.109
Larraya, L. M., Idareta, E., Arana, D., Ritter, E., Pisabarro, A. G., and Ramírez, L. (2002). Quantitative trait loci controlling vegetative growth rate in the edible basidiomycete Pleurotus ostreatus. Appl. Environ. Microbiol. 68, 1109–1114. doi: 10.1128/aem.68.3.1109-1114.2002
Larraya, L. M., Perez, G., Ritter, E., Pisabarro, A. G., and Ramírez, L. (2000). Genetic linkage map of the edible basidiomycete Pleurotus ostreatus. Appl. Environ. Microbiol. 66, 5290–5300. doi: 10.1128/aem.66.12.5290-5300.2000
Laurent, B., Palaiokostas, C., Spataro, C., Moinaro, M., Zehraoui, E., Houston, R. D., et al. (2016). High-resolution mapping of the recombination landscape of the phytopathogen Fusarium graminearum suggests two speed genome evolution. Mol. Plant Pathol. 19, 341–354. doi: 10.1111/mpp.12524
Li, H. (2013). Aligning sequence reads, clone sequences and assembly contigs with BWA-MEM. arXiv [Preprint].
Li, H., Handsaker, B., Wysoker, A., Fennell, T., Ruan, J., Homer, N., et al. (2009). The sequence alignment/map format and SAMtools. Bioinformatics 25, 2078–2079. doi: 10.1093/bioinformatics/
CrossRef Full Text btp352
Li, H., Ye, G., and Wang, J. (2007). A modified algorithm for the improvement of composite interval mapping. Genetics 175, 361–374. doi: 10.1534/genetics.106.066811
Lu, L. X., Yao, F. J., Wang, P., Fang, M., Zhang, Y. M., Zhang, W. T., et al. (2017). Construction of a genetic linkage map and QTL mapping of agronomic traits in Auricularia auricula-judae. J. Microbiol. 55, 792–799. doi: 10.1007/s12275-017-7241-6
Manrique-Carpintero, N. C., Coombs, J. J., Veilleux, R. E., Buell, C. R., and Douches, D. S. (2016). Comparative analysis of regions with distorted segregation in three diploid populations of potato. G3 6, 2617–2628. doi: 10.1534/g3.116.030031
McKenna, A., Hanna, M., Banks, E., Sivachenko, A., Cibulskis, K., Kernytsky, A., et al. (2010). The genome analysis toolkit:a MapReduce framework for analyzing next-generation DNA sequencing data. Genom. Res. 20, 1297–1303. doi: 10.1101/gr.107524.110
Meng, L., Li, L., Zhang, L., and Wang, J. (2015). QTL IciMapping: integrated software for genetic linkage map construction and quantitative trait locus mapping in bi-parental populations. Crop. J. 33, 269–283. doi: 10.1016/j.cj.2015.01.001
Okuda, Y., Murakami, S., and Matsumoto, T. (2009). A genetic linkage map of Pleurotus pulmonarius based on AFLP markers, and localization of the gene region for the sporeless mutation. Genome 52, 438–446. doi: 10.1139/g09-021
Okuda, Y., Ueda, J., Obatake, Y., Murakami, S., Fukumasa, Y., and Matsumoto, T. (2012). Construction of a genetic linkage map based on amplified fragment length polymorphism markers and development of sequence-tagged site markers for marker assisted selection of the sporeless trait in the oyster mushroom (Pleurotus eryngii). Appl. Environ. Microbiol. 78, 1496–1504. doi: 10.1128/AEM.07052-11
Paillard, S., Schnurbusch, T., Winzeler, M., Messmer, M., Sourdille, P., Abderhalden, O., et al. (2003). An integrative genetic linkage map of winter wheat (Triticum aestivum L.). Theor. Appl. Genet. 107, 1235–1242. doi: 10.1007/s00122-003-1361-6
Paudel, D., Kannan, B., Yang, X., Harris-Shultz, K., Thudi, M., Varshney, R. K., et al. (2018). Surveying the genome and constructing a high-density genetic map of napiergrass (Cenchrus purpureus Schumach). Sci. Rep. 8:14419. doi: 10.1038/s41598-018-32674-x
Pelkmans, J. F., Patil, M. B., Gehrmann, T., Reinders, M. J., Wösten, H. A., and Lugones, L. G. (2017). Transcription factors of Schizophyllum commune involved in mushroom formation and modulation of vegetative growth. Sci. Rep. 7:310. doi: 10.1038/s41598-017-00483-3
Pelkmans, J. F., Vos, A. M., Scholtmeijer, K., Hendrix, E., Baars, J. J., Gehrmann, T., et al. (2016). The transcriptional regulator c2h2 accelerates mushroom formation in Agaricus bisporus. Appl. Microbiol. Biotechnol. 100, 7151–7159. doi: 10.1007/s00253-016-7574-9
Qi, P., Gimode, D., Saha, D., Schröder, S., Chakraborty, D., Wang, X., et al. (2018). UGbS-Flex, a novel bioinformatics pipeline for imputation-free SNP discovery in polyploids without a reference genome: finger millet as a case study. BMC Plant Biol. 18:117. doi: 10.1186/s12870-018-1316-3
Ragni, E., Calderon, J., Fascio, U., Sipiczki, M., Fonzi, W. A., and Popolo, L. (2011). Phr1p, a glycosylphosphatidylinositol-anchored β (1,3)-glucanosyltransferase critical for hyphal wall formation, localizes to the apical growth sites and septa in Candida albicans. Fungal Genet. Biol. 48, 793–805. doi: 10.1016/j.fgb.2011.05.003
Robledo-Briones, M., and Ruiz-Herrera, J. (2013). Regulation of genes involved in cell wall synthesis and structure during Ustilago maydis dimorphism. FEMS Yeast Res. 13, 74–84. doi: 10.1111/1567-1364.12011
Ronin, Y. I., Mester, D. I., Minkov, D. G., Akhunov, E., and Korol, A. B. (2017). Building ultra-high density linkage maps based on efficient filtering of trustable markers. Genetics 206, 1285–1295. doi: 10.1534/genetics.116.197491
Seplyarskiy, V. B., Logacheva, M. D., Penin, A. A., Baranova, M. A., Leushkin, E. V., Demidenko, N. V., et al. (2014). Crossing-over in a hypervariable species preferentially occurs in regions of high local similarity. Mol. Biol. Evol. 31, 3016–3025. doi: 10.1093/molbev/msu242
Sivolapova, A. B., Shnyreva, A. V., Sonnenberg, A., and Baars, I. (2012). DNA marking of some quantitative trait loci in the cultivated edible mushroom Pleurotus ostreatus (Fr.) Kumm. Russian J. Genet. 48, 383–389. doi: 10.1134/s1022795412040114
Sonnenberg, A. S., Gao, W., Lavrijssen, B., Hendrickx, P., Sedaghat-Tellgerd, N., Foulongne-Oriol, M., et al. (2016). A detailed analysis of the recombination landscape of the button mushroom Agaricus bisporus var. bisporus. Fungal Genet. Biol. 93, 35–45. doi: 10.1016/j.fgb.2016.06.001
Tzeng, T. T., Chen, C. C., Chen, C. C., Tsay, H. J., Lee, L. Y., Chen, W. P., et al. (2018). The cyanthin diterpenoid and sesterterpene constituents of Hericium erinaceus mycelium ameliorate Alzheimer’s disease-related pathologies in APP/PS1 transgenic mice. Int. J. Mol. Sci. 19, E598. doi: 10.3390/ijms19020598
van der Nest, M. A., Slippers, B., Steenkamp, E. T., De Vos, L., Van Zyl, K., Stenlid, J., et al. (2009). Genetic linkage map for Amylostereum areolatum reveals an association between vegetative growth and sexual and self-recognition. Fungal Genet. Biol. 46, 632–641. doi: 10.1016/j.fgb.2009.06.002
Van Ooijen, J., and Voorrips, R. (2006). JoinMap 4.0. Software for the Calculation of Genetic Linkage Maps in Experimental Populations. Wageningen: Kyazma Publisher.
Vonk, P. J., and Ohm, R. A. (2018). The role of homeodomain transcription factors in fungal development. Fungal Biol. Rev. 32, 219–230. doi: 10.1016/j.fbr.2018.04.002
Voorrips, R. E. (2002). MapChart: software for the graphical presentation of linkage maps and QTLs. J. Hered. 93, 77–78. doi: 10.1093/jhered/93.1.77
Wang, S., Bastern, C. J., and Zeng, Z. B. (2012). Windows QTL Cartographer 2.5. Department of Statistics. Raleigh, NC: North Carolina State University.
Wu, F., Zhou, C., Zhou, D., Ou, S., Zhang, X., and Huang, H. (2018). Structure characterization of a novel polysaccharide from Hericium erinaceus fruiting bodies and its immunomodulatory activities. Food Funct. 9, 294–306. doi: 10.1039/c7fo01389b
Xu, Y., Li, P., Yang, Z., and Xu, C. (2017). Genetic mapping of quantitative trait loci in crops. Crop. J. 5, 175–184. doi: 10.1016/j.cj.2016.06.003
Keywords: Hericium erinaceus, resequencing, high-resolution bin map, quantitative trait loci, monokaryon growth
Citation: Gong W, Xie C, Zhou Y, Zhu Z, Wang Y and Peng Y (2020) A Resequencing-Based Ultradense Genetic Map of Hericium erinaceus for Anchoring Genome Sequences and Identifying Genetic Loci Associated With Monokaryon Growth. Front. Microbiol. 10:3129. doi: 10.3389/fmicb.2019.03129
Received: 20 May 2019; Accepted: 24 December 2019;
Published: 31 January 2020.
Edited by:
Mohamed Hijri, Université de Montréal, CanadaReviewed by:
Chenyang Huang, Institute of Agricultural Resources and Regional Planning (CAAS), ChinaMatt Anderson, The Ohio State University, United States
Copyright © 2020 Gong, Xie, Zhou, Zhu, Wang and Peng. This is an open-access article distributed under the terms of the Creative Commons Attribution License (CC BY). The use, distribution or reproduction in other forums is permitted, provided the original author(s) and the copyright owner(s) are credited and that the original publication in this journal is cited, in accordance with accepted academic practice. No use, distribution or reproduction is permitted which does not comply with these terms.
*Correspondence: Yuande Peng, ibfcpyd313@126.com