 Yangmei Wang1
 Yong Zhao
 Haiquan Liu
- 1College of Food Science and Technology, Shanghai Ocean University, Shanghai, China
- 2Shanghai Engineering Research Center of Aquatic Product Processing & Preservation, Shanghai, China
- 3Laboratory of Quality & Safety Risk Assessment for Aquatic Product on Storage and Preservation (Shanghai), Ministry of Agriculture Shanghai, Shanghai, China
- 4Engineering Research Center of Food Thermal-Processing Technology, Shanghai Ocean University, Shanghai, China
Vibrio parahaemolyticus is a food-borne pathogen that causes pathogenic symptoms such as diarrhea and abdominal pain. Currently no studies have shown that either pathogenic and non-pathogenic V. parahaemolyticus possess growth heterogeneity in a human environment, such as in gastric and intestinal fluids. The tlh gene is present in both pathogenic and non-pathogenic V. parahaemolyticus strains, while the tdh and trh genes are only present in pathogenic strains. This study firstly applied simulated human gastric fluids to explore growth variability of 50 strains of V. parahaemolyticus at 37°C. The bacterial growth curves were fitted by primary modified Gompertz model, and the maximum growth rate (μmax), lag time (LT), and their CV values were calculated to compare the stress response of pathogenic and non-pathogenic V. parahaemolyticus to simulated human gastric fluids. Results showed that the simulated human gastric fluids treatment significantly increased the μmax of pathogenic strains and shortened the lag time, while decreased the μmax of non-pathogenic strains and prolonged the lag time. Meanwhile, the CV values of genotypes (tlh+/tdh+/trh–) evidently increased, showing that the pathogenic genotype (tlh+/tdh+/trh–) strains had strong activity to simulated gastric fluids. All of the results indicated that the V. parahaemolyticus strains exhibited a great stress-resistant variability and growth heterogeneity to the simulated gastric fluids, which provides a novel insight to unlock the efficient control of pathogenic V. parahaemolyticus.
Introduction
Vibrio parahaemolyticus is a gram-negative non-spore halophilic bacteria, which inhabits primarily coastal marine and estuarine environments and is widely found in various marine products (Alonsohernando et al., 2013). Cross-contamination due to the transportation and sale of seafood can also be found in large quantities in freshwater products (Jing et al., 2014). V. parahaemolyticus is a common food-borne pathogen, which can cause pathogenic symptoms such as diarrhea, vomiting, acute gastroenteritis, dehydration, shock, and even death after the ingestion of the bacteria (Baker-Austin et al., 2010). V. parahaemolyticus has become the major pathogen causing food-borne infection in many countries and coastal areas, such as Japan, Southeast Asia, the United States, and Taiwan (Yamasaki et al., 2009). According to reports of patients in China, due to V. parahaemolyticus, there have been 6.65 million cases of acute diarrhea, about 7.281 million cases of acute gastroenteritis, and the proportion of food-borne V. parahaemolyticus infection was about 68.0%. Thus, it is essential to control and prevent V. parahaemolyticus. Additionally, approximately 95% of V. parahaemoliticus cases are non-pathogenic and 5% are pathogenic in the environment (Nordstrom et al., 2007). The use of multiplex-PCR can comprehensively detect V. parahaemolyticus. All V. parahaemolyticus can amplify the tlh gene, which is unique to V. parahaemolyticus. The detection of tdh and trh genes as pathogenic isolates is also the main cause of human food-borne diseases (Letchumanan et al., 2015).
Although most environmental strains are not pathogenic, there are a small number of pathogenic strains with virulence factors that serve as the most critical in causing food-borne diseases. The reason that pathogenic V. parahaemolyticuscan causes human diarrhea, which is contained in seafood. And it is related to pathogenic factors, including the initial adhesion of pathogenic bacteria to host cells; and the release of pathogenic bacteria to the host cells with various biological activities such as toxins, proteins, and polysaccharides plays a toxic role. Usually, most pathogenic isolates and a few environmental sources of V. parahaemolyticus are pathogenic, which is associated with its cell-associated factors (such as colistin) (Obaidat et al., 2017), extracellular factors (such as hemolytic toxins) (Takahashi et al., 2000), and proteases (such as mucinase) (Jun et al., 2003).
Previous studies’ identified methods for the pathogenic isolates of V. parahaemolyticus mainly include: MLSA reveals that pathogenic isolates have a higher genetic diversity than non-pathogenic isolates (de Jesus Hernandez-Diaz et al., 2015). The pathogenic isolates include two hemolysin genes (tdh and trh) and a horizontally acquired type-three secretion system (T3SS2) (Xu et al., 2015). The comparative genomics method is used to analyze the differences in the genomes of pathogenic and non-pathogenic isolates, and there are more conserved genes in pathogenic isolates (Hazen et al., 2015). Using Whole Gene Sequencing (WGS) characterization, the pathogenic isolates containing tdh and trh genes account for the highest proportion of increasing cases of V. parahaemolyticus each year (Haendiges et al., 2015).
Current researches on V. parahaemolyticus have been mostly applied to single strain in pure cultures or in food. Studies have demonstrated that there are differences in the growth kinetics between temperature and salinity leading to pathogenicity and growth rate of the strains. There was an inseparable relationship between environmental factors and strain activity (Fujikawa et al., 2009). V. parahaemolyticus had different growth activities under four different temperature conditions (10, 20, 30, and 37°C) (Liu et al., 2016), and found that of the strains at 37°C, 3% had a good growth rate: As the temperature and salinity conditions become increasingly tense, their growth vigor was also more inhibited accordingly. Moreover, only a small amount of research has shown the pathogenicity of V. parahaemolyticus, which was present in the small intestine (Ritchie et al., 2012b), but few studies have been done on the growth kinetic parameters of V. parahaemolyticus under gastric digestion fluids. And there is also limited knowledge of the pathogenesis of diarrhea caused by V. parahaemolyticus. Therefore, it is of great significance to study the heterogeneity of growth of V. parahaemolyticus in gastric digestion fluids.
The main virulence factor of V. parahaemolyticus is hemolytic toxin—the others are heat-resistant hemolytic toxin (TDH), hemolytic toxin associated with heat-resistant hemolytic toxin (TRH), and heat-labile hemolytic toxin (TLH) (Takahashi et al., 2000; Dou et al., 2013). TDH is an enzyme that can digest the cell walls of blood cells and can produce a β-type hemolytic ring on blood agar medium, called Kanagawa (KP +) (Zhang and Chen, 2018). Almost all pathogens isolated V. parahaemolyticus produce a biologically active protein: TDH or TRH. The most direct characterization of the TDH-producing strain is the presence of beta-type hemolysis on the blood-stained plate, which is positive for Kanagawa (KP+) and is used as the most important marker for the pathogenicity of the strain. Pathogenic strains that produce only TRH (trh+), although negative for KP, also have enterotoxin activity, so these strains are generally considered to be pathogenic strains. Most environmental strains have neither tdh nor trh, and are called non-pathogenic strains. And epidemiological investigations have shown that the pathogenicity of V. parahaemolyticus is highly correlated with TDH (Guo et al., 2014). Otherwise, as a food-borne pathogen that is orally ingested, V. parahaemolyticus must survive human digestion to cause disease in humans. It is well known that in the gastric digestion fluids with pH 0.9–1.5, V. parahaemolyticus can neither survive nor cause people to become sick. However, the pH value of the stomach will rise rapidly within half an hour after ingestion. Therefore, for the food-borne pathogen V. parahaemolyticus, the bacterial concentration reaches 104 CFU/ml, while the stomach provides favorable conditions for growth and colonization. It can cause other symptoms, such as diarrhea (Ritchie et al., 2012a).
Maximum growth rate (μmax) and lag time (LT) are the most important parameters for fitting microbiology models. Predicting microbes is a precise method for risk assessment (Lou et al., 2015). Currently, risk assessment studies based on V. parahaemolyticus focus on models established by single strains under different environmental conditions (Yang and Jiao, 2008). Few papers have analyzed the differences in the growth kinetic parameters of highly pathogenic V. parahaemolyticus from diverse sources. As V. parahaemolyticus is the most common pathogenic microorganism in aquatic products, establishing a perfect predictive model has market significance for ensuring the quality of aquatic products and predicting the shelf life of aquatic products.
Materials and Methods
Bacterial Strains and Preparation of Inoculum
This study was carried out in accordance with the recommendations of the World Medical Association’s Declaration of Helsinki and the Shanghai First Maternity and Infant Hospital Ethics Committee. The protocol was approved by the Shanghai First Maternity and Infant Hospital (ethics approval acceptance number: KS1940). The medical ethics committee approved the project to amend the project according to ethical requirements, conformed to ethical requirements, and agreed to implement it. All subjects gave written informed consent, or written informed consent was provided by parents/guardians for participants that were under the age of 16.
All V. parahaemolyticus virulence genes information were identified in our previous studies (Li et al., 2017; Niu et al., 2018a). A total of 50 strains of V. parahaemolyticus were used in this study, of which clinical isolates (VPC, n = 23) were recovered from the patients who presented with acute diarrhea in gastroenteritis outpatient clinics in the Shanghai hospital. And each fecal specimen was collected after informed consent was obtained from the patient or, if the patient was a child, from the child’s parent/guardian. Environment isolates (VPE, n = 27) were recovered from shrimp in freshwater or seawater in our previous study. The sources and genotypes of all of the strains are listed in Table 1. All V. parahaemolyticus strains were stored −80°C in 25% glycerol test tubes. Strains were streaked onto a thiosulfate-bile salt-sucrose agar medium (TCBS; Beijing Guotuqiao Technology Co., Ltd., Beijing, China) and cultured at 37°C for 8–12 h. A single colony from TCBS plate was transferred into 9 ml TSB (Beijing Luqiao Technology Co., Ltd., Beijing, China) at pH 8.0 and 3.0% (w/w) NaCl concentration, and then incubated overnight at 37°C and 220 rpm to prepare the test inoculum. The overnight culture was then diluted with 0.1% peptone water (PW; Beijing Luqiao Technology Co., Ltd., Beijing, China) to an optical density (OD) value for 1.2 ± 0.02 (about 109 CFU/ml) at 600 nm (OD 600). The automated turbidimetric system Bioscreen C (Oy Growth Curves Ab Ltd., Raisio, Finland) was used to test the corresponding OD values at regular intervals (Niu et al., 2018b).
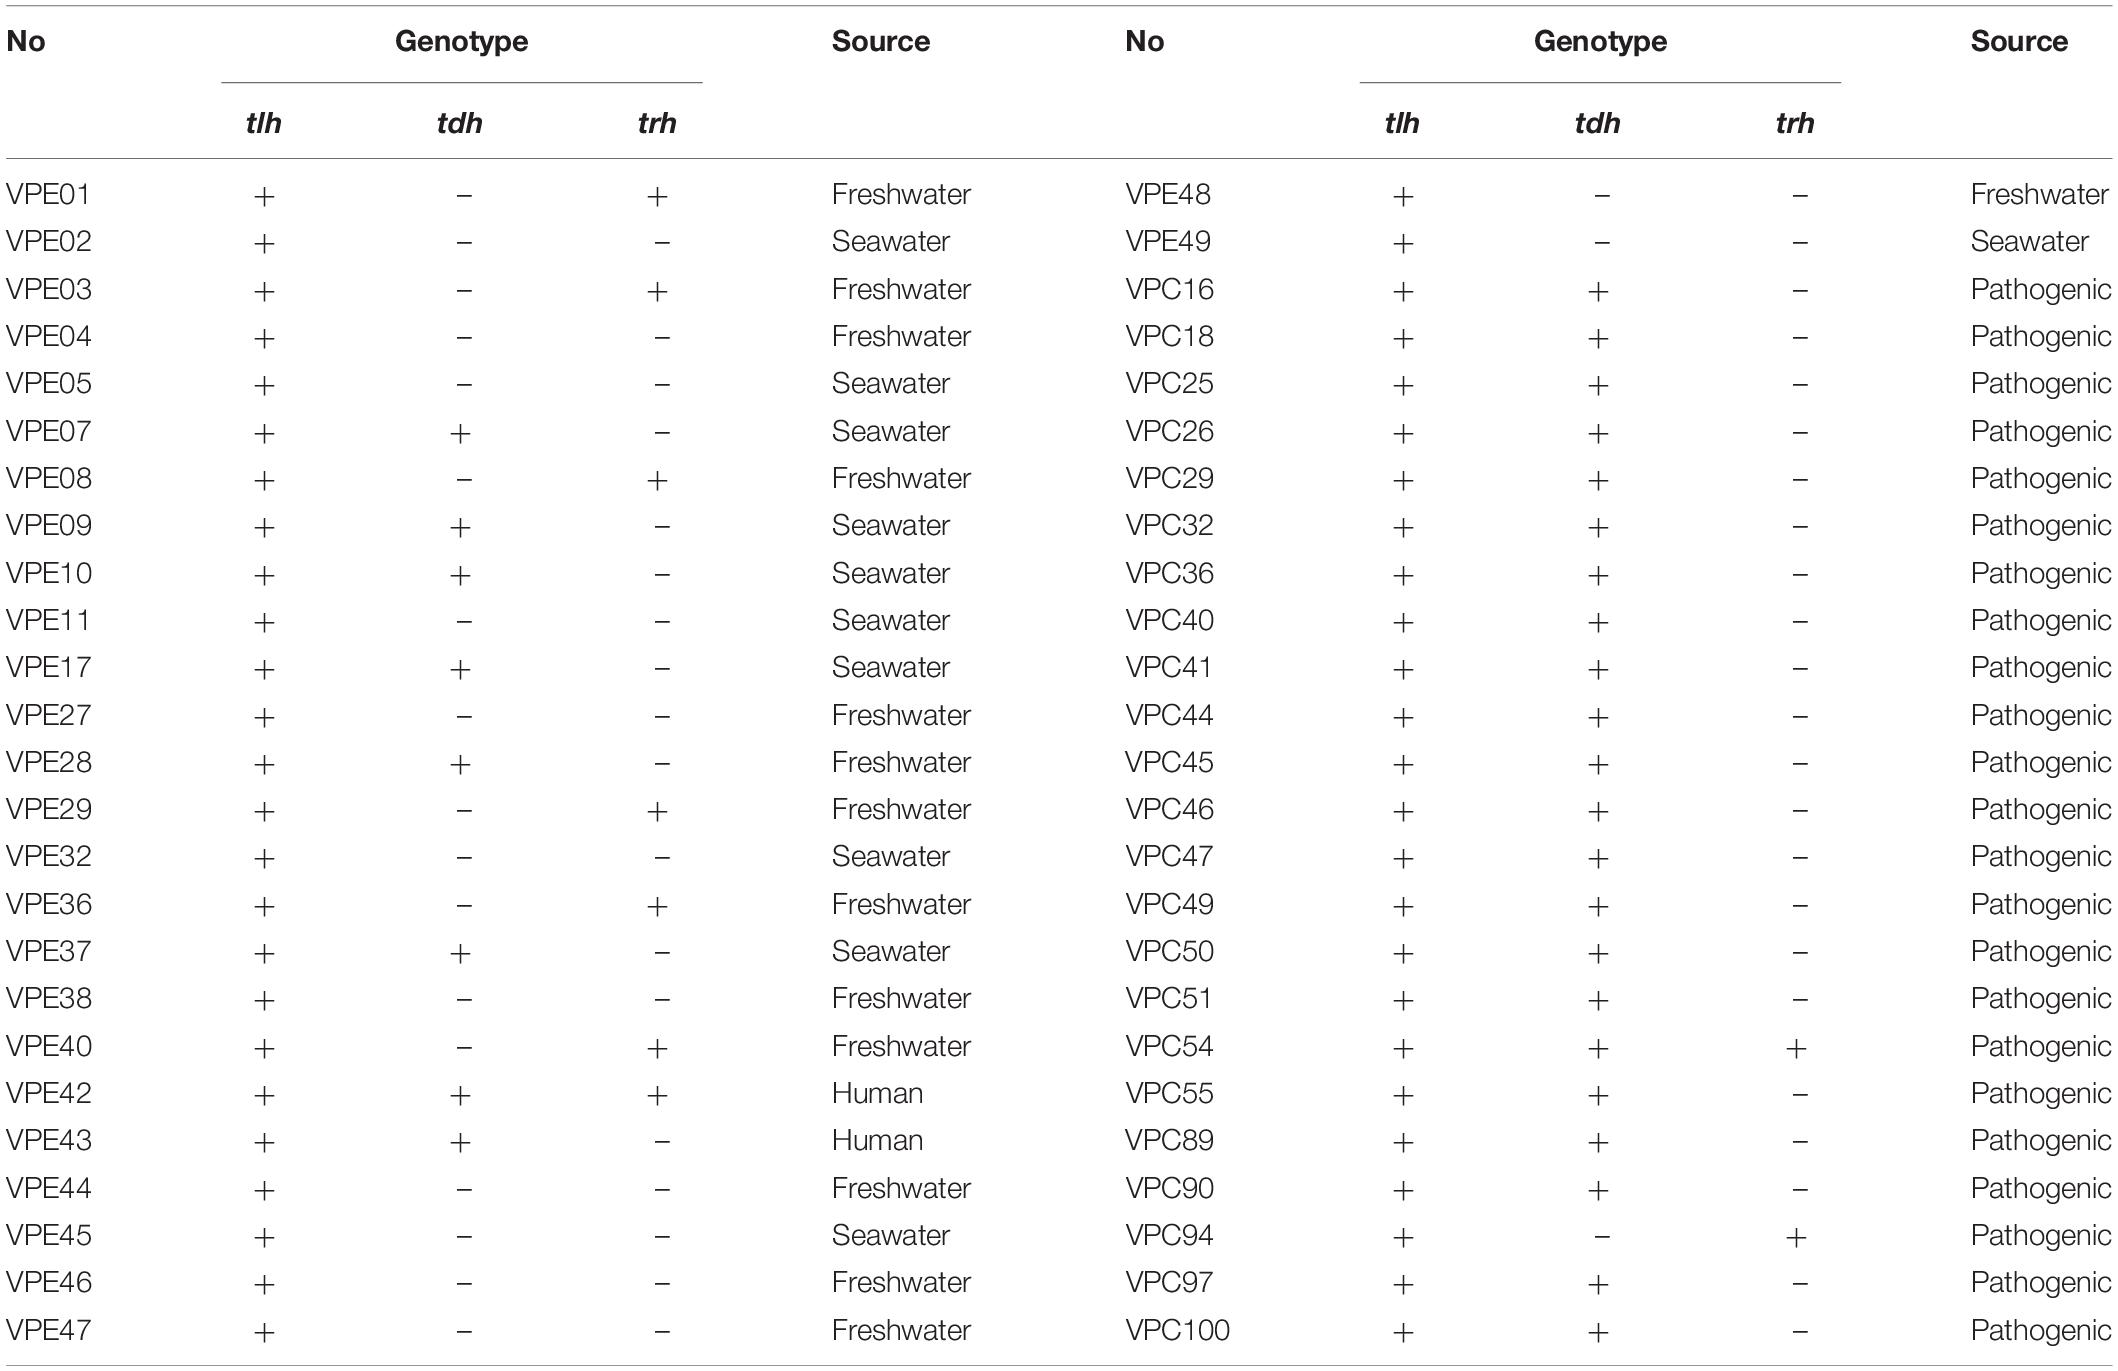
Table 1. The sources and genotypes of 50 strains of V. parahaemolyticus.
Preparation of Simulated Digestion Fluids
Simulated human gastric fluids were prepared according to the formula of Minekus simulated digestive fluids (Minekus et al., 2014), and sterilized by 0.22 um filter. 1 M HCl and 1 M NaOH were used to adjust the pH (SGF was 4.0). The gastric fluids should be pre-warmed to 37°C before use, and to avoid precipitation, the CaCl2(H2O)2 solutions were finally added to the mixture. The above inoculum was appropriately serially diluted ten-fold with a 0.1% PW solution, mixed with SGF digestion solution, and treated at 37°C, 110 rpm constant temperature shaker for 120 min.
Growth Curve Experiments
Microbial culture growth is often divided into four periods: lag time, logarithmic growth phase, stationary phase, and decay phase. The growth curve has the culture time as the abscissa and the logarithm of the number of bacteria or the growth rate as the ordinate. It represents the dynamic change of the whole process of growth, reproduction, and even death of bacteria in a new suitable environment. The automated turbidity system Bioscreen C (Oy Growth Curves Ab Ltd., Raisio, Finland) is used to detect the OD value of the wideband filter (600 nm) at regular time intervals. Changes in OD value can be observed throughout the total time period. The initial inoculum of each strain prepared was diluted ten-fold with five gradients in TSB. With strain concentration of approximately 104 CFU/ml, the inoculated TSB was transferred to a 100-well microtiter plate and then placed in automated turbidimetric system Bioscreen C. Three OD measurement replicates were tested throughout this process. In addition, three independent experiments were performed at each growth condition, and there were three samples per strain completely utilized for testing. In this way, the total OD growth curve described will reach 900 patterns (3 replicates × 3 independent experiments × 2 growth conditions × 50 types of V. parahaemolyticus).
Maximum Specific Growth Rate and Lag Time
Following the study by Lianou (Lindqvist, 2006; Alexandra and Koutsoumanis, 2011), the Bioscreen gradient dilution method is used to calculate the maximum specific growth rate of the strain as: log(Ni) = K − μmax × tdet.
In the formula: tdet is the time (h) when the OD 600 nm of V. parahaemolyticus reaches the Bioscreen C detectable level (106–107CFU/mL); μmax is the maximum specific growth rate of V. parahaemolyticus growth rate [log CFU/(mL h)]; Ni is the initial concentration of V. parahaemolyticus (CFU/mL) in the selected sample well; and K is a constant.
Growth Kinetics Fitting: Using the modified Gompertz model, the growth data of V. parahaemolyticus under different growth conditions were fitted by Origin Pro 8.0 software (Origin Lab Corp., Northampton, MA, United States).
were A means the initial total number of bacteria (log CFU/mL), C represents the difference between the maximum bacterial species and the initial bacterial species, log CFU/mL, μm represents maximum specific growth rate, λ is the time to reach the relative maximum growth rate (h), and y represents total number of bacteria at time (log CFU/mL).
Statistical Analysis Methods
The prediction model is evaluated through the coefficient of determination R2, the root mean square error (RMSE), the Fisher’s F test P-value, the accuracy factor Af, the bias factor Bf, and other parameters (Zhang et al., 2015). When R2 is close to 1, it means that the reference value of its prediction model is higher; otherwise, when it is close to 0, its reference value is lower. When Af is equal to 1, it means that the predicted value and the observed value are equal. If the Af value is larger, it indicates that the average accuracy of the model is lower. The Bf value in the range of (0.9–1.05) indicates that the prediction model has a small deviation. The parameter formula of each prediction model is as follows:
Under the condition of gastric digestive fluids treatment, the coefficient of variation (CV) of the μmax is calculated as follows:
In addition, a significant difference test using P-values was also used to verify differences in growth rates of strains from different conditions. The level of statistical significance (P < 0.05) was tested by the least significant difference (LSD) method. Statistical analysis were analyzed using the SPSS statistical package 17.0 (SPSS Inc., Chicago, IL, United States).
Results
Changes in Maximum Growth Rate After Gastric Digestion Fluids Treatment
The growth curves of 50 strains of V. parahaemolyticus were measured in an automated turbidity system Bioscreen C. The Modified Gompertz model was used to evaluate μmax(Nauta and Dufrenne, 1999; Boonyawantang et al., 2012). Almost all test values were fitted to the equations given above statistical formula. All RMSE values tended to 0, and Af and Bf were close to 1. The results showed goodness-of-fit with the Modified Gompertz model.
The maximum specific growth rates of V. parahaemolyticus from different sources after treatment with gastric digestive fluids (SGF) are shown in Figure 1. As shown in Figure 1A, which compares with control groups (before treatment with gastric digestive fluids), the μmax of 89% of environmental V. parahaemolyticus strains were significantly reduced. Among them, the μmax (OD × h–1) of VPE01, VPE05, VPE37, and VPE49 decreased sharply. The μmax of VPE01 decreased from 1.001 to 0.63, the μmax of VPE05 went down from 0.889 to 0.434, the μmax of VPE37 dropped from 0.982 to 0.541, and the μmax of VPE49 decreased from 0.979 to 0.565. Results indicated that the μmax of environmental strains treated with gastric fluids were decreased, which had poor tolerance to gastric fluids and poor adaptability to external stress environments.
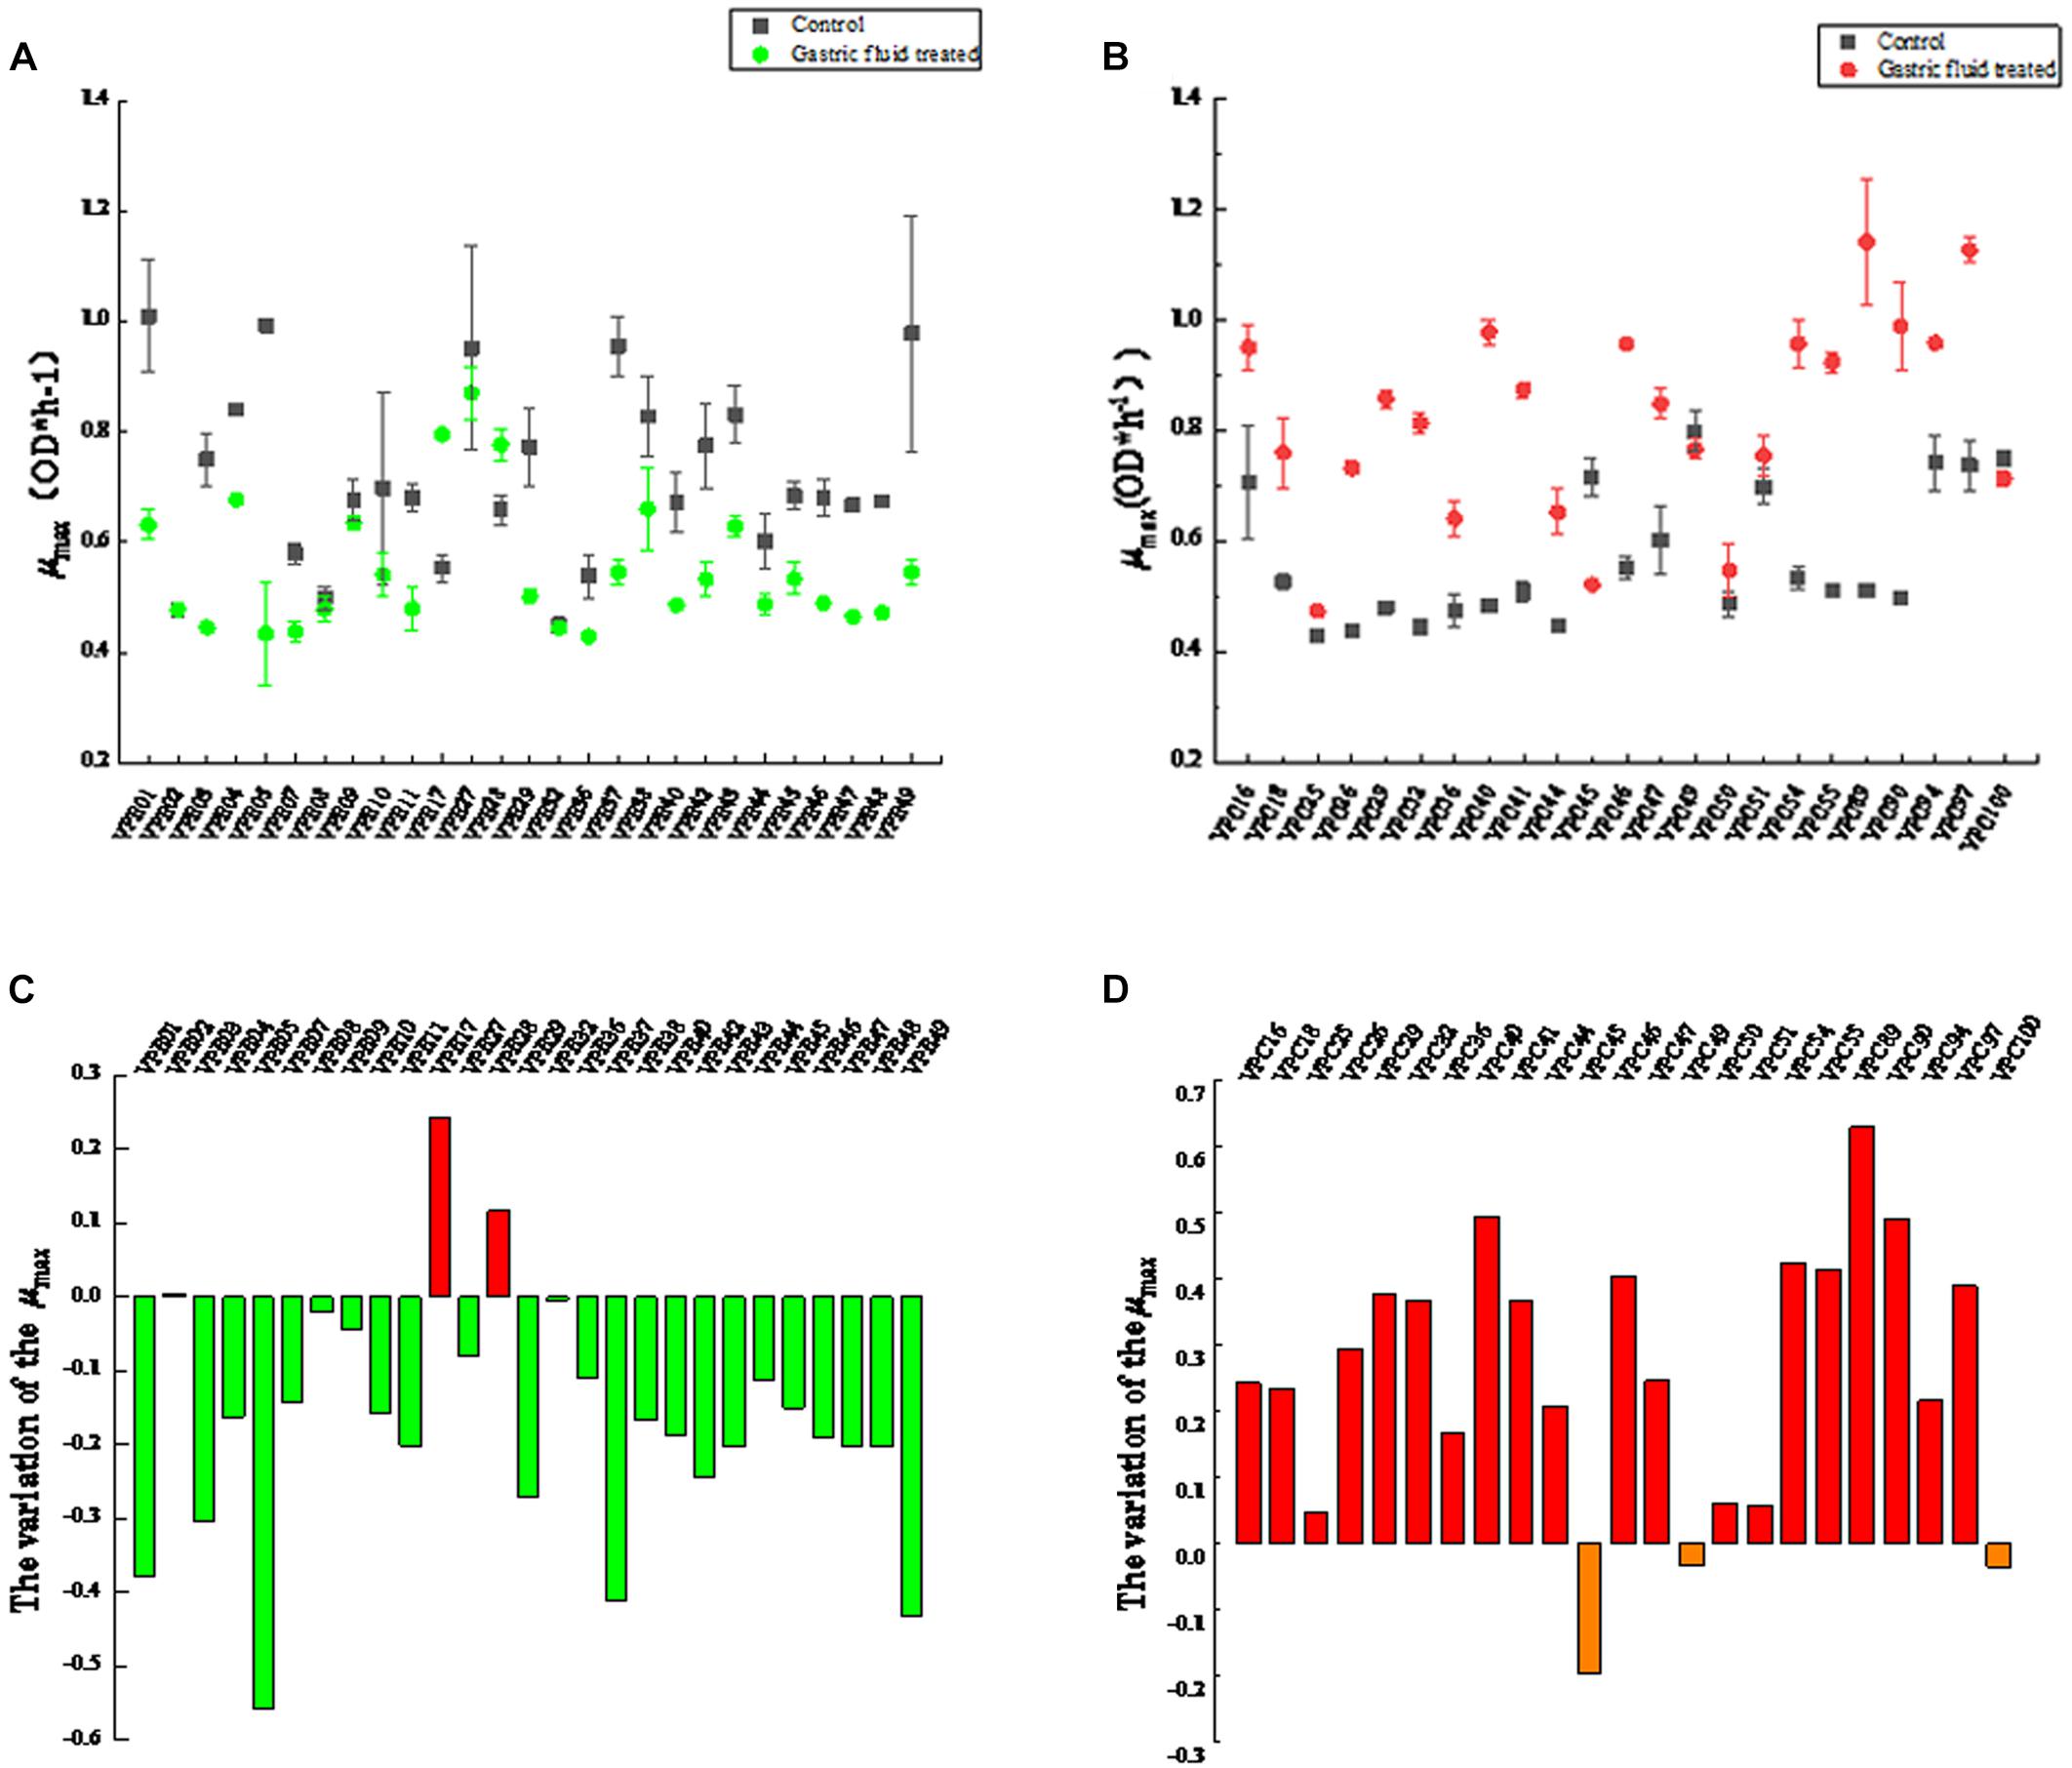
Figure 1. Maximum specific growth rates (μmax) of V. parahaemolyticus strains from different sources after SGF. (A) Maximum specific growth rate of environmental strains. (B) Maximum specific growth rate of pathogenic strains. (C) The change of maximum specific growth rate of environmental strains in SGF treatment. (D) The change of maximum specific growth rate of pathogenic strains in SGF treatment.
Interestingly, the μmax changes of the pathogenic V. parahaemolyticus were completely opposite to that of environmental strains. The value of μmax (OD × h–1) of most strains were significantly different (P < 0.01) between control and treatment groups. As shown in Figure 1B, the μmax of most strains fluctuated between 0.4 and 0.6 in control groups. After gastric fluids treatment, the μmax of the strains fluctuated between 0.64 and 1.1, increasing by 1.8 times. Among them, VPC40, VPC89, and VPC90 increased significantly. The μmax of VPC40 increased from 0.483 to 0.979, the μmax of VPC89 increased sharply from 0.511 to the highest point of 1.142, and the μmax of VPC90 increased from 0.498 to 0.989. Also as shown in Figure 1D, the μmax changes of VPC40, VPC89, and VPC90 were 0.496, 0.631, and 0.491, respectively. Other pathogenic isolates had increased to varying degrees. Meanwhile, the μmax of VPC45, VPC49, and VPC100 decreased on the contrary: The reductions were 0.196, 0.013, and 0.036, respectively. The reason for these reductions will be the focus of future experiments.
Tendency of Lag Time (LT) (λ)
The biologically accepted definition is the time when a microbial population undergoes a mutation in the environment and begins to reproduce after self-adjustment. In the geometric sense, the microbial lag period refers to the time interval when the logarithmic growth phase of the microorganism reaches the maximum specific growth rate (Aguirre and Koutsoumanis, 2016). The lag time (LT) exhibited changes, as shown in Figure 2. The LT of most strains were significantly different (P < 0.05) between control and treatment groups. In control groups, the LT values of environment-derived isolates were different, with about 60% of the isolates strains having LT of less than 3 h (Figure 2A). The LT of 92.5% of the strains increased in the treatment groups after SGF, on the other hand. Among them, the LT of VPE10 reached a maximum of 6.2965, the LT of VPE27 fell to a low of 2.1563, and the LT of VPE36 and VPE02 fluctuated insignificantly. However, as shown in Figure 2B, for pathogenic-derived strains, the LT of the strains was about 3 h, which was not significantly different in control groups. While, after SGF treatment, the LT of almost all pathogenic-derived isolates strains were shortened significantly, and about 91% of the strains had a LT of less than 3 h. The shortening of the pathogenic strains LT corresponded to the stress of gastric fluids treatment.
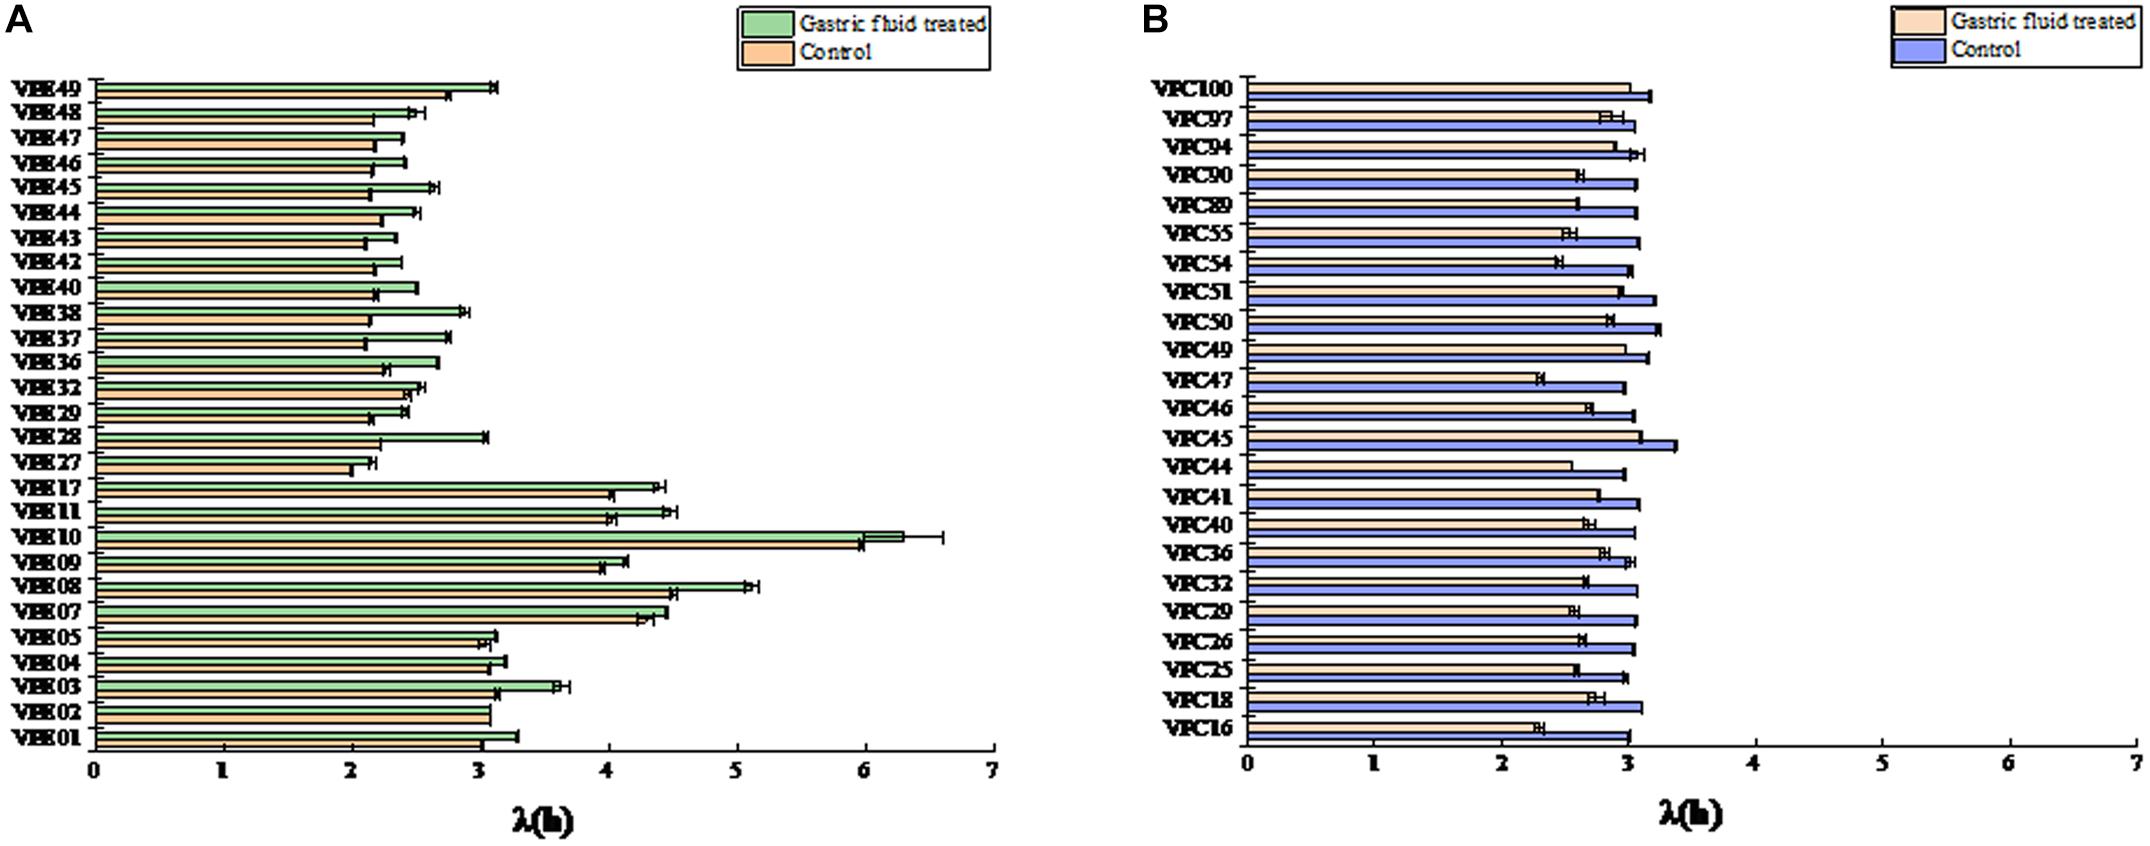
Figure 2. The lag time (λ) of V. parahaemolyticus strains from different sources after SGF. (A) Lag time (λ) of environmental strains. (B) Lag time (λ) of pathogenic strains.
Evaluation of Growth Variability After SGF
In order to study the effect of SGF treatment on the growth rate of V. parahaemolyticus, the growth variability of the strain was studied by coefficient of variation (CV). The maximum specific growth rate and CV values of environmental isolate strains after SGF treatment were shown in Figure 3A. After SGF treatment, the maximum specific growth rate of the environmental isolate strains decreased, and the CV value of the strain μmax also fluctuated. When the μmax of VPE1, VPE5, VPE37, and VPE49 decreased the most, the CV values of μmax were 4.3%, 9.5%, 3.9%, and 0.9%, respectively. The results showed that the CV value of μmax of VPE5 was the largest, which revealed the largest growth heterogeneity in the gastric fluids environment, and there was growth heterogeneity between the various strains of V. parahaemolyticus after SGF treatment.
Figure 3. Mean value curve of maximum specific growth rates (μmax) and coefficient of variation curve of μmax among strains (CV-Strain) after SGF treatment. (A) Mean value curve of maximum specific growth rates (μmax) and coefficient of variation curve of μmax among strains (CV-Strain) of environmental strain. (B) Mean value curve of maximum specific growth rates (μmax) and coefficient of variation curve of μmax among strains (CV-Strain) of pathogenic strain. (C) Mean value curve of lag time (λ) and coefficient of variation curve of lag time (λ) among strains (CV-Strain) of environmental strains. (D) Mean value curve of lag time (λ) and coefficient of variation curve of lag time (λ) among strains (CV-Strain) of pathogenic strains.
Results depicted the difference in the μmax coefficient of variation CV of pathogenic isolate strains after SGF treatment (Figure 3B). The CV value of most strains fluctuated between 0.26 and 4.00%. After SGF treatment, the CV value of μmax of VPC18, VPC50, VPC89, and VPC90 increased sharply, which were 8.44, 8.97, 10.07, and 8.17%, respectively. The CV values of μmax of VPC25 and VPC46 fell respectively by 0.55 and 0.26%. The CV values of μmax of pathogenic isolates, which were easier to grow in gastric fluids, were significantly higher than those of environmental isolates. When pathogenic V. parahaemolyticus grows to a pathogenic amount in human stomach, it has the potential of causing diarrhea and gastroenteritis.
The CV value of LT was significantly different (P < 0.01) between environmental isolates and pathogenic isolates after SGF treatment (Figure 3C). As shown in Figure 3C, the CV values of LT of environmental isolates fluctuated between 0.16% and 1.50%, while the CV values of LT of VPE03 and VPE48 exceeded 1.5%, which were 1.56 and 2.61%, respectively. As shown in Figure 3D, the CV values of LT of pathogenic isolates fluctuated between 0.14 and 1.3%, while all of the CV values of LT of VPC16, VPC18, VPC40, VPC55, and VPC97 strains were larger than the fluctuation range, which were 1.64, 2.29, 1.78, 2.04, and 3.35, respectively. By comparing the growth kinetic parameter, the CV value of μmax and LT more comprehensively represents the growth heterogeneity for V. parahaemolyticus strains.
Comparison of Growth Variability From Different Sources
Table 1 shows the sources of different types of V. parahaemolyticus, divided into environmental and pathogenic strains. Among them, environmental strains can be roughly divided into two categories: freshwater and seawater. The box diagrams of the four types are: environment group, pathogenic group, different sources strains before SGF treatment, and different sources strains after SGF treatment (Figure 4). The average of the maximum specific growth rate μmax was counted, and significant differences were calculated by the P-value. In addition, the P-values of the differences were 0.001 [environment group, SGF treatment (Figure 4A)], 0.000 [pathogen group, SGF treatment (Figure 4B)], 0.001 [environment group and pathogenic group before SGF (Figure 4C)], and 0.000 [Environment group and pathogenic group after SGF (Figure 4D)]. All four groups performed significant difference analysis.
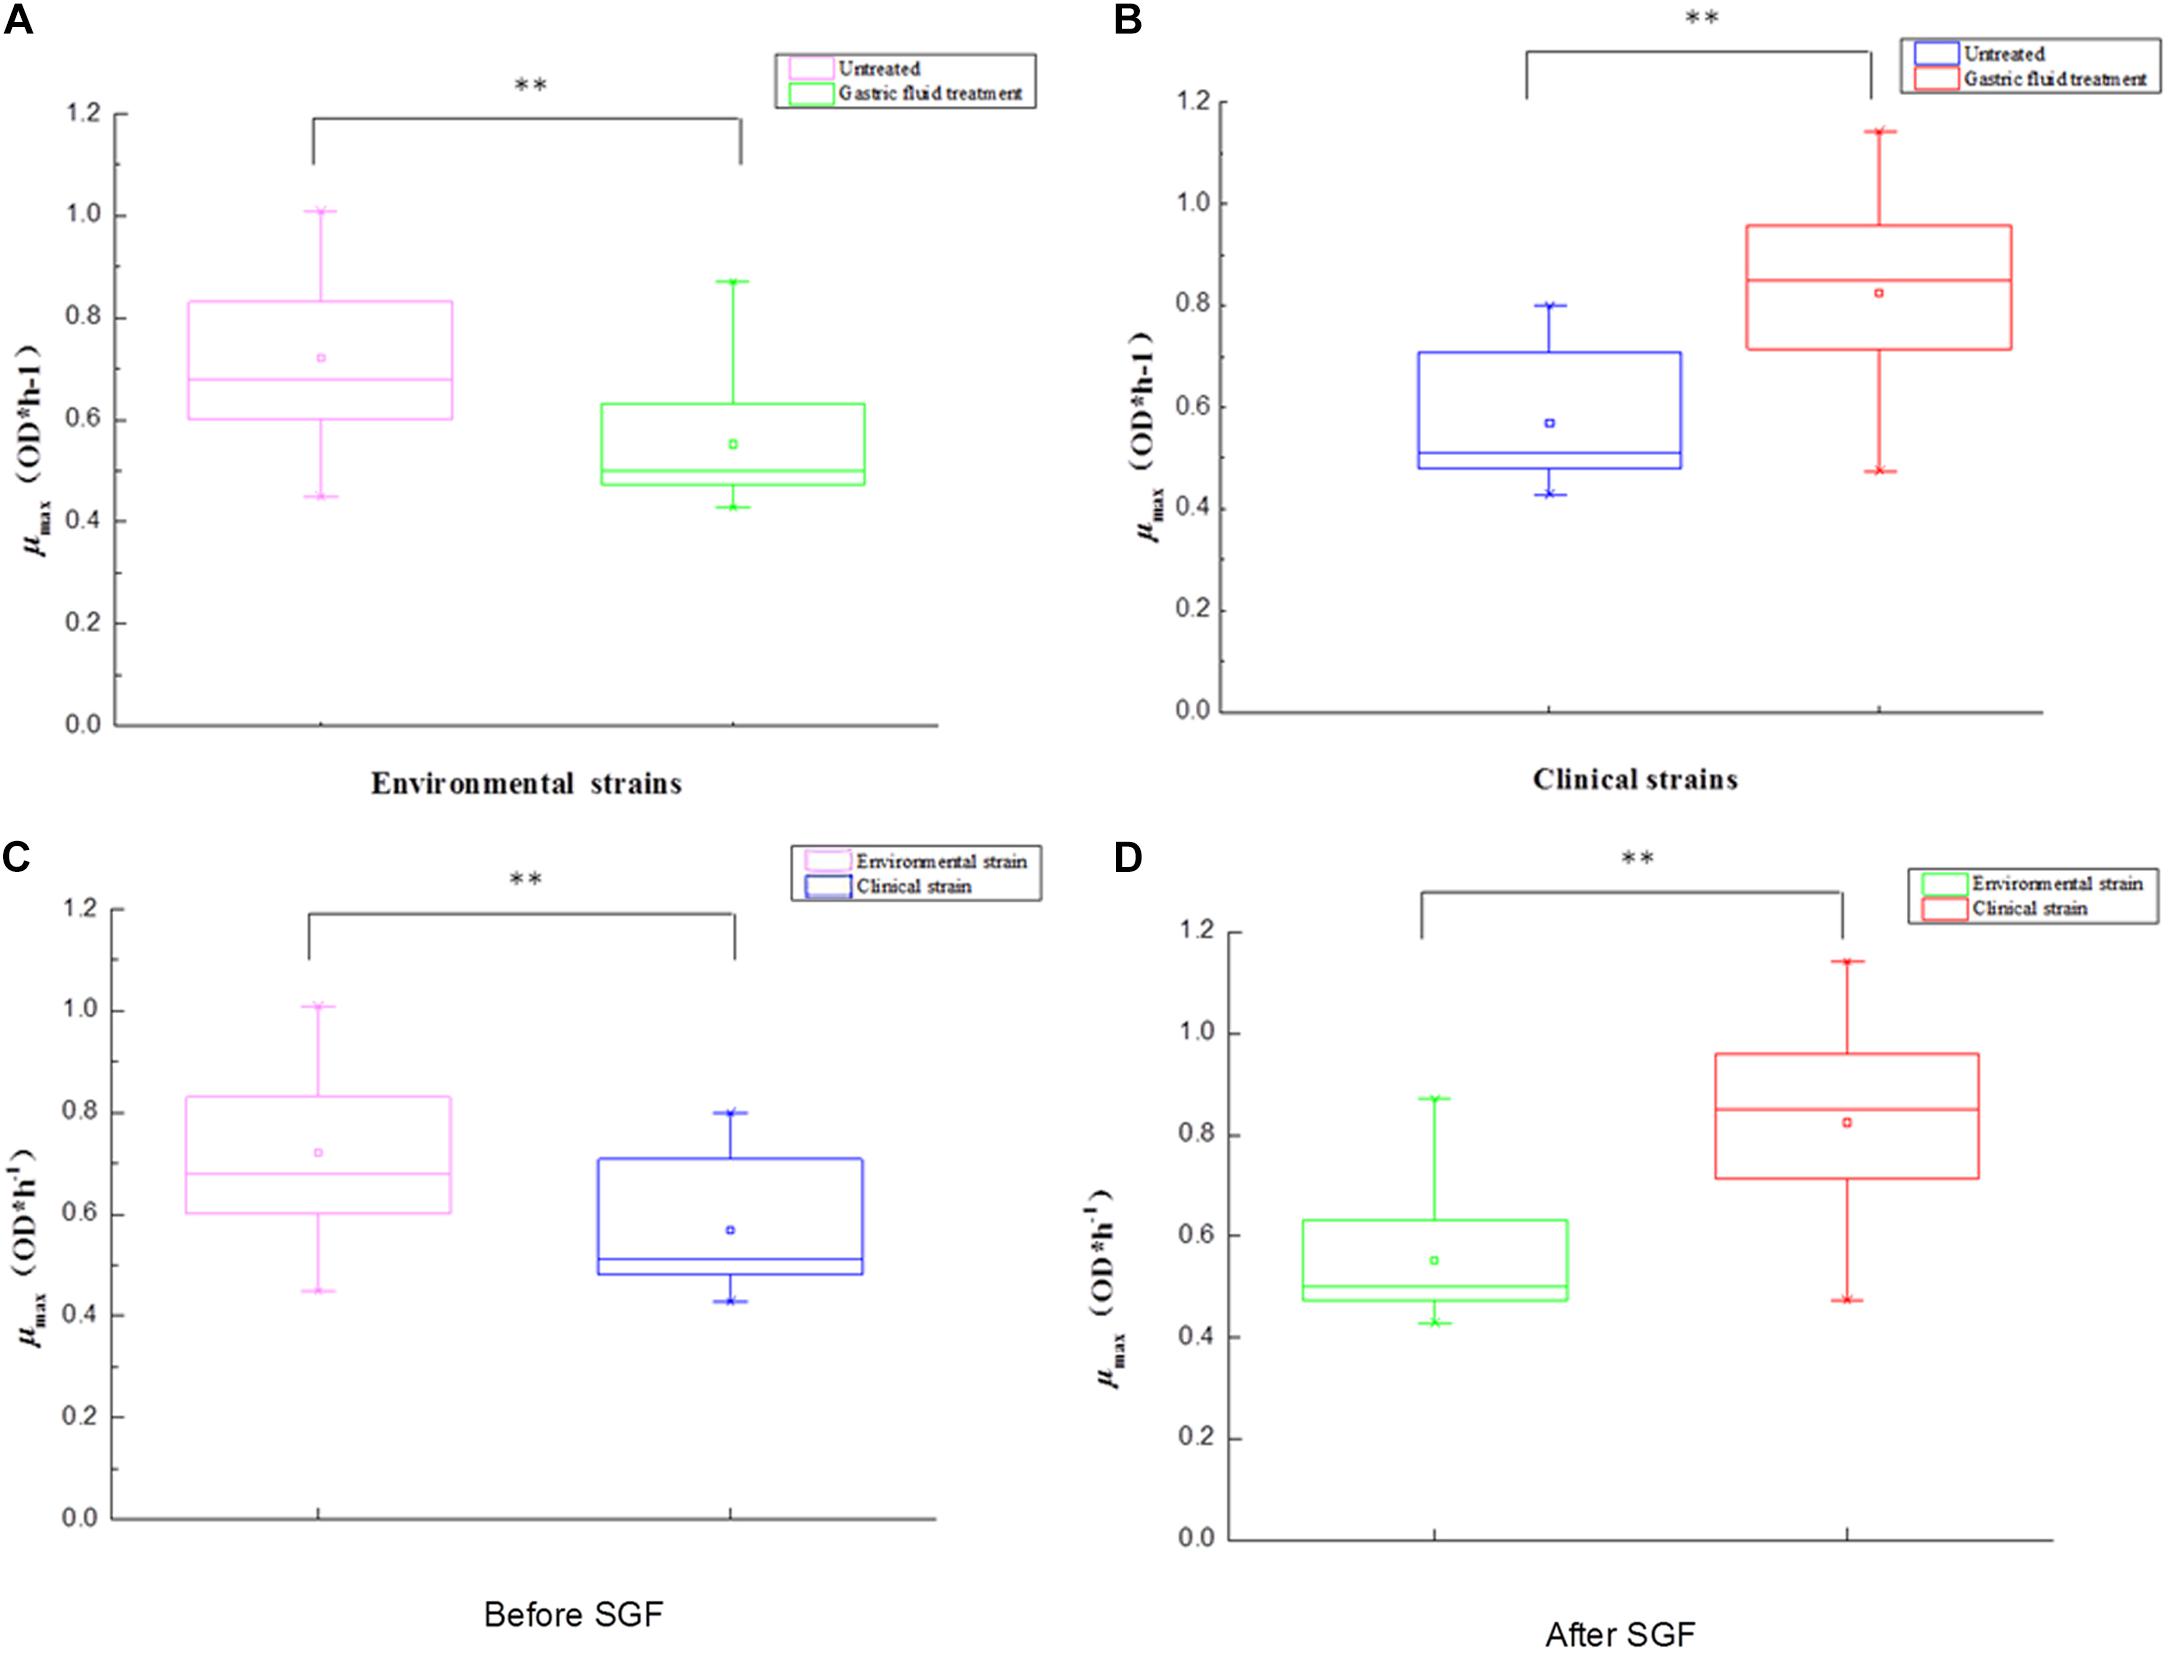
Figure 4. The box plot between environment and pathogens for V. parahaemolyticus strains under gastric fluids treatment in the following growth conditions. (A) The environmental strains with P = 0.001 (control group and SGF treatment). (B) The pathogenic strains with P = 0.000 (control group and SGF treatment). (C) The environmental strains and pathogenic strains with P = 0.001 before SGF treatment. (D) The environmental strains and pathogenic strains with P = 0.000 after SGF treatment. ∗∗Statistical significance (p < 0.05).
Effects of Genotypes on Growth Variation After Treatment With Different Sources
Genetic heterogeneity has a certain influence on the growth variation of V. parahaemolyticus. To further describe the growth characteristics of V. parahaemolyticus, 50 strains from different sources (shown in Table 1) were classified by genotype. Based on different virulence factors, V. parahaemolyticus could be divided into four categories: (1) tlh+/tdh–/trh–, (2) tlh+/tdh+/trh–, (3) tlh+/tdh–/trh+, and (4) tlh+/tdh+/trh+ (Letchumanan et al., 2014), which were used to explore the internal causes of the growth variability of V. parahaemolyticus. In these virulence genes, all clinical and environmental strains of V. parahaemolyticus had been expressed as tlh in previous studies (Okada et al., 2009). Today, the most important virulence factors of the recognized V. parahaemolyticus are heat-resistant direct hemolysin (TDH) and heat-resistant hemolysin (TRH), which are encoded by the tdh and trh genes, respectively, as an important basis to distinguish pathogenic and non-pathogenic V. parahaemolyticus.
The changes of V. parahaemolyticus of different genotypes after SGF treatment are shown in Figure 5. In control conditions, tlh+/tdh–/trh– (green) exhibited the maximum growth variability compared to the other three genotypes, which had CV values at higher levels (Figure 5A). As shown in Figure 5B, tlh+/tdh+/trh+ (black) and tlh+/tdh –/trh+ (red) performed moderate variability in growth. After SGF treatment, the CV value of tlh+/tdh+/trh – (blue) was the highest of those of other genotypes (tlh+/tdh–/trh–, tlh+/tdh–/trh+, and tlh+/tdh+/trh+).
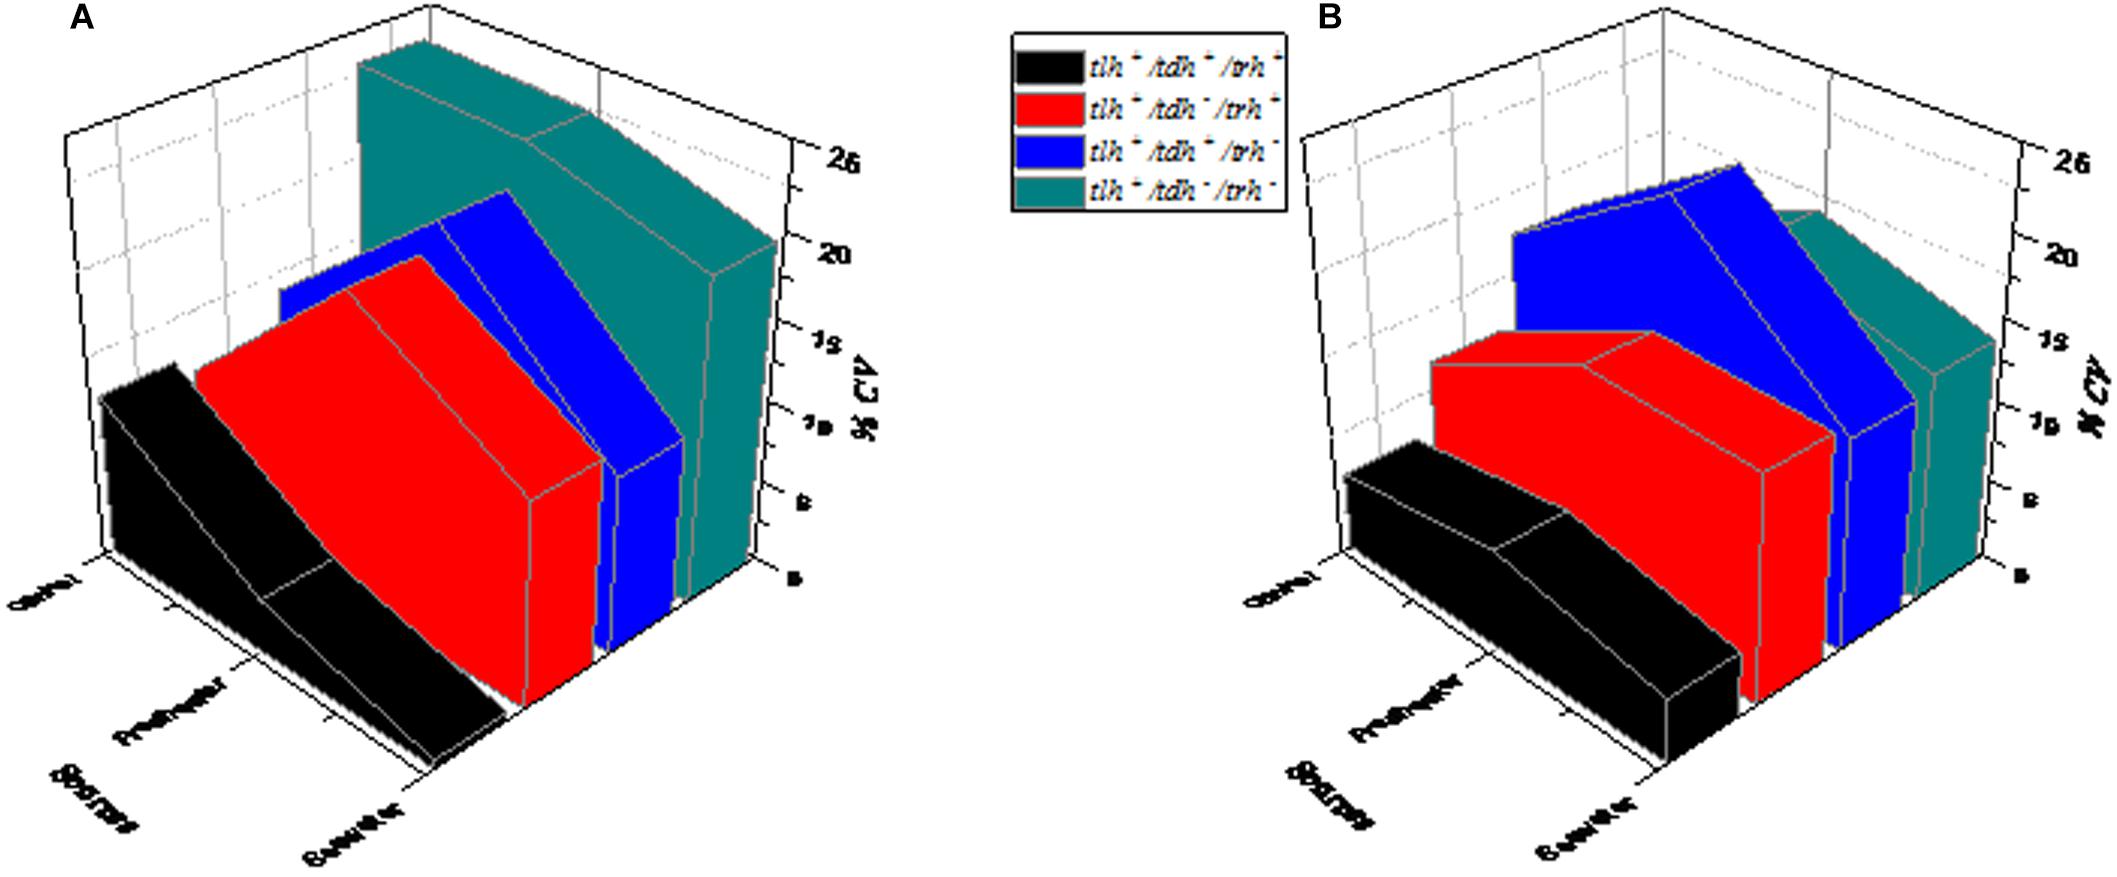
Figure 5. The influence of the genotype on the growth variability of V. parahaemolyticus strains from different sources. (A) Control group (not treated with SGF). (B) After SGF treatment.
Discussion
Effects of SGF on Growth Variability
Predictive microbiology model is an important research topic in the field of food safety (Yoon et al., 2008; Stan-Lotter et al., 2010). One should use a modified Gompertz model for growth kinetic analysis of pathogenic and non-pathogenic V. parahaemolyticus in broth and oysters, and use two-dimensional models (such as Davey and square root models) to fit lag time and the maximum growth rate (Yoon et al., 2014). Pathogenic V. parahaemolyticus strains in Vannamei have different growth kinetic parameters (Lou et al., 2015). The prediction model of V. parahaemolyticus was used to study the growth variation of pathogenic and non-pathogenic strains. The maximum specific growth rate (μmax) and lag time (LT) are the two most important parameters of microbial dynamics. It was obvious that 37°C was considered to be the optimal growth condition in the control group (Figure 1), which had already been verified by the similar completion in laboratory experiments (Baker-Austin et al., 2010; Fernandez-Piquer et al., 2011). However, the most effective obstacle of the survival and onset of V. parahaemolyticus is the human stomach. After SGF treatment, V. parahaemolyticus showed different variability. The maximum specific growth rate of environmental strains decreased (Figure 1A), while the lag time was increased simultaneously (Figure 2A). In fact, most environmental strains were adapted to the natural environment, while SGF was not adjusted to the growth of those strains. Interestingly, the growth of the pathogenic V. parahaemolyticus was opposite to SGF stress. The maximum specific growth rate of the pathogenic strains increased (Figure 1B), whereas the lag period was shortened (Figure 2B). The value of μmax of pathogenic VPC89 was 1.1418, and the lag time was only 2.59 h. This data indicates that VPC89 had a short lag time, rapidly entered into the log phase, which grew rapidly to reach the maximum bacterial concentration in a short time. Studies have shown that the length of the lag time can reflect the strain’s ability to respond to the new environment. The CV value of μmax and LT more clearly reflected the heterogeneity of V. parahaemolyticus after SGF (Figure 3). And the pathogenic bacteria was significantly different (P < 0.01) than that of environmental strains (Figure 4), which meant the pathogenic bacteria had a stronger ability to adapt to the SGF environment. This situation brought certain risks to food control and to human health (Arroyo-Lopez et al., 2014).
Impact of SGF on Pathogenicity
In this study, the differences in maximum growth rates and lag time between pathogenic and non-pathogenic isolates were observed after SGF treatment. The V. parahaemolyticus with high maximum growth rates in SGF generally presented a positive correlation with virulence factors and pathogenicity. Extracellular enzymes, endotoxin lipopolysaccharides, and heat-labile capsular polysaccharides have enhanced the pathogenicity of pathogenic strains. The pathogenic V. parahaemolyticus contains the tdh gene (Petronella and Ronholm, 2018), which is located in the coding region adjacent to the chromosome. The tdh gene with genetic characteristics was more easily expressed than the trh gene during SGF (Yoshitsugu et al., 2013; Shimohata and Takahashi, 2010).
According to the strain information data collected in Table 1, since there was only one strain containing tlh+/tdh+/trh+, the characteristics of this genotype would not be typical, and the black curve provided some references for different trends. Besides, the genotype tlh+/tdh+/trh– is found in almost all pathogenic isolated strains. In addition, the secretory systems of V. parahaemolyticus play an indispensable role in the pathogenesis. Almost all pathogenic V. parahaemolyticus have a type III secretion system (T3SS), which is the main contributor to the pathogenicity of V. parahaemolyticus (Rohinee et al., 2012). The type III secretion system is a bacterial protein secretion device, which mediates bacterial cytotoxicity in a manner that induces programmed cell death or autophagy of host cells (Kwon-Sam et al., 2004; Okada et al., 2010). Li et al. (2016) reported that the vtrA/vtrC complex of V. parahaemolyticus can induce vtrB to activate T3SS2, and vtrA and vtrB deletion mutants cannot produce TDH and T3SS2 related proteins (Gotoh et al., 2010). vopV, vopZ, and vopL are the three major secretory effector proteins of T3SS2, and they play an important role in the pathogenicity and intestinal colonization of hemolytic V. parahaemolyticus.
These facts indicated that the maximum growth rate of pathogenic strains was increased, the lag time was decreased after SGF treatment, and the CV values of genotypes (tlh+/tdh+/trh–) increased evidently more than those of other genotypes (tlh+/tdh–/trh–, tlh+/tdh–/trh+ and tlh+/tdh+/trh+), as shown in Figure 5. Therefore, the results suggested a relationship between the expression of virulence genes and the (tlh+/tdh+/trh–) genotype of V. parahaemolyticus, and it was more adaptable to the changes of gastric fluids environment.
Conclusion
The growth kinetics characteristics of 50 pathogenic and non-pathogenic V. parahaemolyticus strains with different genotypes and from different sources were determined in simulated gastric fluids. Compared to the control group, the μmax of 87% of pathogenic strains significantly increased, while the μmax of 89% of non-pathogenic strains decreased. However, the LT of all pathogenic strains was shortened, and the LT of all non-pathogenic strains was prolonged in simulated gastric fluids. Meanwhile, the CV values of genotypes (tlh+/tdh+/trh–) increased evidently more than those of other genotypes (tlh+/tdh–/trh–, tlh+/tdh–/trh+, and tlh+/tdh+/trh+). Therefore, more attention should be paid to the clinical genotypes (tlh+/tdh+/trh–) associated with severe virulence, which is of great significance for the prevention and maintenance of human health. The generated knowledge will facilitate the incorporation of strain variability in predictive microbiology and microbial risk assessment and will hence provide an efficient way and scientific guidance to control the pathogens in the food industry.
Data Availability Statement
All datasets generated for this study are included in the article/supplementary material.
Author Contributions
YZ, YP, and HL conceived and supervised the study. YW designed and performed the experiments, analyzed the data, and wrote the manuscript. YZ and HL revised the manuscript.
Funding
This research was supported by the National Natural Science Foundation of China (31671779 and 31972188), the National Key R&D Program of China (2018YFC1602205 and 2018YFC1602200), the Shanghai Agriculture Applied Technology Development Program (T20170404), and the Innovation Program of Shanghai Municipal Education Commission (2017-01-07-00-10-E00056).
Conflict of Interest
The authors declare that the research was conducted in the absence of any commercial or financial relationships that could be construed as a potential conflict of interest.
References
Aguirre, J. S., and Koutsoumanis, K. P. (2016). Towards lag phase of microbial populations at growth-limiting conditions: the role of the variability in the growth limits of individual cells. Int. J. Food Microbiol. 2016, 1–6. doi: 10.1016/j.ijfoodmicro.2016.01.021
Alexandra, L., and Koutsoumanis, K. P. (2011). Effect of the growth environment on the strain variability of Salmonella enterica kinetic behavior. Food Microbiol. 28, 828–837. doi: 10.1016/j.fm.2010.04.006
Alonsohernando, A., Alonsocalleja, C., and Capita, R. (2013). Growth kinetic parameters of Gram-positive and Gram-negative bacteria on poultry treated with various chemical decontaminants. Food Control 33, 429–432. doi: 10.1016/j.foodcont.2013.03.009
Arroyo-Lopez, F. N., Blanquet-Diot, S., Denis, S., Thevenot, J., Chalancon, S., Alric, M., et al. (2014). Survival of pathogenic and lactobacilli species of fermented olives during simulated human digestion. Front. Microbiol. 5:540. doi: 10.3389/fmicb.2014.00540
Baker-Austin, C., Stockley, L., Rangdale, R., and Martinez-Urtaza, J. (2010). Environmental occurrence and clinical impact of Vibrio vulnificus and Vibrio parahaemolyticus: a european perspective. Environ. Microbiol. Rep. 2, 7–18. doi: 10.1111/j.1758-2229.2009.00096.x
Boonyawantang, A., Mahakarnchanakul, W., Rachtanapun, C., and Boonsupthip, W. (2012). Behavior of pathogenic Vibrio parahaemolyticus in prawn in response to temperature in laboratory and factory. Food Control 26, 479–485. doi: 10.1016/j.foodcont.2012.02.009
de Jesus Hernandez-Diaz, L., Leon-Sicairos, N., Velazquez-Roman, J., Flores-Villasenor, H., Guadron-Llanos, A. M., Javier Martinez-Garcia, J., et al. (2015). A pandemic Vibrio parahaemolyticus O3:K6 clone causing most associated diarrhea cases in the Pacific Northwest coast of Mexico. Front. Microbiol. 6:221. doi: 10.3389/fmicb.2015.00221
Dou, Y., Pei-Hong, H. U., and Peng-Cheng, G. U. (2013). Research progress in Vibrio parahaemolyticus TDH toxin and detection methods. Mod. Food Sci. Technol. 29, 215–218.
Fernandez-Piquer, J., Bowman, J. P., Ross, T., and Tamplin, M. L. (2011). Predictive models for the effect of storage temperature on Vibrio parahaemolyticus viability and counts of total viable bacteria in pacific oysters (Crassostrea gigas). Appl. Environ. Microbiol. 77, 8687–8695. doi: 10.1128/aem.05568-5511
Fujikawa, H., Kimura, B., and Fujii, T. (2009). Development of a predictive program for Vibrio parahaemolyticus growth under various environmental conditions. Biocontrol Sci. 14:127. doi: 10.4265/bio.14.127
Gotoh, K., Kodama, T., Hiyoshi, H., Izutsu, K., Park, K.-S., Dryselius, R., et al. (2010). Bile acid-induced virulence gene expression of Vibrio parahaemolyticus Reveals a novel therapeutic potential for bile acid sequestrants. PLoS One 5:e13365. doi: 10.1371/journal.pone.0013365
Guo, Z., Cui, X., Wang, J., Sun, X., Pan, Y., and Zhao, Y. (2014). Metabolome response to tdh expression of pathogenic Vibrio parahaemolyticus induced by different temperatures. Acta Microbiol. Sin. 54, 882–888.
Haendiges, J., Timme, R., Allard, M. W., Myers, R. A., Brown, E. W., and Gonzalez-Escalona, N. (2015). Characterization of Vibrio parahaemolyticus clinical strains from Maryland (2012-2013) and comparisons to a locally and globally diverse V. parahaemolyticus strains by whole-genome sequence analysis. Front. Microbiol. 6:125. doi: 10.3389/fmicb.2015.00125
Hazen, T. H., Lafon, P. C., Garrett, N. M., Lowe, T. M., Silberger, D. J., Rowe, L. A., et al. (2015). Insights into the environmental reservoir of pathogenic Vibrio parahaemolyticus using comparative genomics. Front. Microbiol. 6:204. doi: 10.3389/fmicb.2015.00204
Jing, J. W., Wen, S. S., Meng, T. J., Hai, Q. L., Zhang, W., Xiao, H. S., et al. (2014). Fate of Vibrio parahaemolyticus on shrimp after acidic electrolyzed water treatment. Int. J. Food Microbiol. 179, 50–56. doi: 10.1016/j.ijfoodmicro.2014.03.016
Jun, I. J., Kim, Y. H., Kim, M. J., Hwang, H. S., Lee, T. H., and Cha, J. (2003). Isolation and characterization of mucinase complex secreted from Vibrio parahaemolyticus. J. Microbiol. Biotechnol. 13, 731–737.
Kwon-Sam, P., Takahiro, O., Mitsuhiro, R., Myoung-Ho, J., Kazuhisa, O., Tetsuya, I., et al. (2004). Functional characterization of two type III secretion systems of Vibrio parahaemolyticus. Infect. Immun. 72:6659. doi: 10.1128/IAI.72.11.6659-6665.2004
Letchumanan, V., Chan, K. G., and Lee, L. H. (2014). Vibrio parahaemolyticus: a review on the pathogenesis, prevalence, and advance molecular identification techniques. Front. Microbiol. 5:705. doi: 10.3389/fmicb.2014.00705
Letchumanan, V., Yin, W.-F., Lee, L.-H., and Chan, K.-G. (2015). Prevalence and antimicrobial susceptibility of Vibrio parahaemolyticus isolated from retail shrimps in Malaysia. Front. Microbiol. 6:33. doi: 10.3389/fmicb.2015.00033
Li, H., Tang, R., Lou, Y., Cui, Z., Chen, W., Hong, Q., et al. (2017). A comprehensive epidemiological research for clinical Vibrio parahaemolyticus in shanghai. Front. Microbiol. 8:1043. doi: 10.3389/fmicb.2017.01043
Li, P., Rivera-Cancel, G., Kinch, L. N., Salomon, D., Tomchick, D. R., Grishin, N. V., et al. (2016). Bile salt receptor complex activates a pathogenic type III secretion system. eLife 5:e15718. doi: 10.7554/elife.15718
Lindqvist, R. (2006). Estimation of Staphylococcus aureus growth parameters from turbidity data: characterization of strain variation and comparison of methods. Appl. Environ. Microbiol. 72, 4862–4870. doi: 10.1128/AEM.00251-256
Liu, B., Liu, H., Pan, Y., Xie, J., and Zhao, Y. (2016). Comparison of the effects of environmental parameters on the growth variability of Vibrio parahaemolyticus coupled with strain sources and genotypes analyses. Front. Microbiol. 7:994. doi: 10.3389/fmicb.2016.00994
Lou, Y., Zhang, Z. H., Xiao, L. L., Guo, D. F., Liu, H. Q., Pan, Y. J., et al. (2015). Growth kinetic parameters of multi-drug and single-drug resistant Vibrio parahaemolyticus strains in pure culture and in Penaeus vannamei. Mod. Food Sci. Technol. 31, 181–186.
Minekus, M., Alminger, M., Alvito, P., Ballance, S., Bohn, T., Bourlieu, C., et al. (2014). A standardised static in vitro digestion method suitable for food – an international consensus. Food Funct. 5, 1113–1124. doi: 10.1039/c3fo60702j
Nauta, M. J., and Dufrenne, J. B. (1999). Variability in growth characteristics of different E. coli O157:H7 isolates, and its implications for predictive microbiology. Quant. Microbiol. 1, 137–155. doi: 10.1023/a:1010087808314
Niu, B., Hong, B., Zhang, Z., Mu, L., Malakar, P. K., Liu, H., et al. (2018a). A novel qPCR method for simultaneous detection and quantification of viable pathogenic and non-pathogenic Vibrio parahaemolyticus (tlh plus, tdh plus, and ureR(+)). Front. Microbiol. 9:1747. doi: 10.3389/fmicb.2018.01747
Niu, B., Mu, L., Xiao, L., Zhang, Z., Malakar, P. K., Liu, H., et al. (2018b). Reduction of infection risk meditated by co-culturing Vibrio parahaemolyticus and Listeria monocytogenes in refrigerated cooked shrimp. J. Sci. Food Agric. 98, 4454–4461. doi: 10.1002/jsfa.8969
Nordstrom, J., Vickery, M., Blackstone, G., and Murray, S. A. (2007). Development of a multiplex real-time PCR assay with an internal amplification control for the detection of total and pathogenic Vibrio parahaemolyticus bacteria in oysters. Appl. Environ. Microbiol. 73, 5840–5847. doi: 10.1128/AEM.00460-467
Obaidat, M. M., Salman, A., and Roess, A. A. (2017). Virulence and antibiotic resistance of Vibrio parahaemolyticus isolates from seafood from three developing countries and of worldwide environmental, seafood, and clinical isolates from 2000 to 2017. J. Food Prot. 80:2060. doi: 10.4315/0362-028X.JFP-17-156
Okada, N., Iida, T., Park, K.-S., Goto, N., Yasunaga, T., Hiyoshi, H., et al. (2009). Identification and characterization of a novel type III secretion system in trh-positive Vibrio parahaemolyticus strain TH3996 reveal genetic lineage and diversity of pathogenic machinery beyond the species level. Infect. Immun. 77, 904–913. doi: 10.1128/iai.01184-1188
Okada, N., Matsuda, S., Matsuyama, J., Park, K. S., de los Reyes, C., Kogure, K., et al. (2010). Presence of genes for type III secretion system 2 in Vibrio mimicus strains. BMC Microbiol. 10:302. doi: 10.1186/1471-2180-10-302
Petronella, N., and Ronholm, J. (2018). The mechanisms that regulate Vibrio parahaemolyticus virulence gene expression differ between pathotypes. Microb. Genom. 4:9. doi: 10.1099/mgen.0.000182
Ritchie, J. M., Haopeng, R., Xiaohui, Z., Tetsuya, I., Toshio, K., Susuma, I., et al. (2012a). Inflammation and disintegration of intestinal villi in an experimental model for Vibrio parahaemolyticus-induced diarrhea. PLoS Pathog. 8:e1002593. doi: 10.1371/journal.ppat.1002593
Ritchie, J. M., Rui, H., Zhou, X., Iida, T., Kodoma, T., Ito, S., et al. (2012b). Inflammation and disintegration of intestinal villi in an experimental model for Vibrio parahaemolyticus-induced diarrhea. PLoS Pathog. 8:e1002593.
Rohinee, P., Hamel, O. S., Asta, S., and Martin, L. (2012). Genetic diversity of clinical and environmental Vibrio parahaemolyticus strains from the Pacific Northwest. Appl. Environ. Microbiol. 78, 8631–8638. doi: 10.1128/AEM.01531-12
Shimohata, T., and Takahashi, A. (2010). Diarrhea induced by infection of Vibrio parahaemolyticus. J. Med. Invest. 57, 179–182. doi: 10.2152/jmi.57.179
Stan-Lotter, H., Fendrihan, S., Dornmayr-Pfaffenhuemer, M., Gerbl, F., Legat, A., Gruber, C., et al. (2010). Presence of T3SS2 and other virulence-related genes in tdh -negative Vibrio parahaemolyticus environmental strains isolated from marine samples in the area of the Venetian Lagoon, Italy. FEMS Microbiol. Ecol. 70, 506–514. doi: 10.1111/j.1574-6941.2009.00764.x
Takahashi, A., Kenjyo, N., Imura, K., Myonsun, Y., and Honda, T. (2000). Cl- Secretion in colonic epithelial cells induced by the Vibrio parahaemolyticus hemolytic toxin related to thermostable direct hemolysin. Infect. Immun. 68, 5435–5438. doi: 10.1128/iai.68.9.5435-5438.2000
Xu, F., Ilyas, S., Hall, J. A., Jones, S. H., Cooper, V. S., and Whistler, C. A. (2015). Genetic characterization of clinical and environmental Vibrio parahaemolyticus from the Northeast USA reveals emerging resident and non-indigenous pathogen lineages. Front. Microbiol. 6:272. doi: 10.3389/fmicb.2015.00272
Yamasaki, S., Migita, Y., Nakamura, M., Ura, N., Harakudo, Y., Misawa, N., et al. (2009). Effect of environmental factors on the occurrence of Vibrio vulnificus in costal waters of nagasaki prefecture, Japan. J. Jpn. Vet. Med. Assoc. 62, 649–655. doi: 10.12935/jvma.62.649
Yang, Z. Q., and Jiao, X. A. (2008). Molecular characterization and microbial growth kinetics model of Vibrio parahaemolyticus isolates from different sources. Chin. J. Zoon. 24, 210–215.
Yoon, J. H., Bae, Y. M., Jung, S. Y., Cha, M. H., Ryu, K., Park, K. H., et al. (2014). Predictive modeling for the growth of Listeria monocytogenes and Salmonella Typhimurium on fresh-cut cabbage at various temperatures. J. Korean Soc. Appl. Biol. Chem. 57, 631–638. doi: 10.1007/s13765-014-4096-y
Yoon, K. S., Min, K. J., Jung, Y. J., Kwon, K. Y., Lee, J. K., and Oh, S. W. (2008). A model of the effect of temperature on the growth of pathogenic and nonpathogenic Vibrio parahaemolyticus isolated from oysters in Korea. Food Microbiol. 25, 635–641. doi: 10.1016/j.fm.2008.04.007
Yoshitsugu, N., Jun, O., Tetsuya, I., and Mitsuaki, N. (2013). The urease gene cluster of Vibrio parahaemolyticus does not influence the expression of the thermostable direct hemolysin (TDH) gene or the TDH-related hemolysin gene. Microbiol. Immunol. 47, 233–239. doi: 10.1111/j.1348-0421.2003.tb03392.x
Zhang, H., and Chen, M. (2018). Comparison of different methods to identify tdh-positive pathogenic Vibrio parahaemolyticus isolates. Curr. Microbiol. 75, 1–5. doi: 10.1007/s00284-017-1332-1339
Keywords: Vibrio parahaemolyticus, growth heterogeneity, simulate gastric fluids, maximum growth rate, gene heterogeneity
Citation: Wang Y, Zhao Y, Pan Y and Liu H (2020) Comparison on the Growth Variability of Vibrio parahaemolyticus Coupled With Strain Sources and Genotypes Analyses in Simulated Gastric Digestion Fluids. Front. Microbiol. 11:212. doi: 10.3389/fmicb.2020.00212
Received: 18 October 2019; Accepted: 30 January 2020;
Published: 03 March 2020.
Edited by:
Giovanna Suzzi, University of Teramo, ItalyReviewed by:
Learn-Han Lee, Monash University Malaysia, MalaysiaPendru Raghunath, Texila American University, Guyana
Copyright © 2020 Wang, Zhao, Pan and Liu. This is an open-access article distributed under the terms of the Creative Commons Attribution License (CC BY). The use, distribution or reproduction in other forums is permitted, provided the original author(s) and the copyright owner(s) are credited and that the original publication in this journal is cited, in accordance with accepted academic practice. No use, distribution or reproduction is permitted which does not comply with these terms.
*Correspondence: Yong Zhao, yzhao@shou.edu.cn; Haiquan Liu, hqliu@shou.edu.cn