 Yang Zhou1,2†
 Yu Li1
 Lu Zhang1,3
 Zuowei Wu4Ying Huang1,5He Yan1,3
 Jiang Zhong2Li-Ju Wang1†Hafiz M. Abdullah6Hua H. Wang1,7*
- 1Department of Food Science and Technology, The Ohio State University, Columbus, OH, United States
- 2Department of Microbiology, School of Life Sciences, Fudan University, Shanghai, China
- 3College of Food Science and Engineering of Technology, Guangzhou, China
- 4College of Veterinary Preventive Medicine, Iowa State University, Ames, IA, United States
- 5College of Food Science, Fujian Agriculture and Forestry University, Fuzhou, China
- 6Department of Animal Science Poultry Facility, OARDC, Wooster, OH, United States
- 7Department of Microbiology, The Ohio State University, Columbus, OH, United States
Previous studies have identified oral administration of antibiotics and gut-impacting drugs as critical drivers for fecal antibiotic resistance (AR) and microbiome disruption in lab mice, but the practical implications of these findings have yet to be validated in hosts nurtured in conventional environment. Using ampicillin (Amp) as a way to extrapolate the general effect of antibiotics, this project examined the impact of drug administration routes on fecal microbiota and resistome using poultry raised in a teaching farm. AR genes were found to be abundant in the feces of young Leghorn chicks without previous antibiotic treatment. In chickens seeded with blaCMY–2+ Escherichia coli, 300 mg/kg body weight of Amp was orally administered for 5 days. This led to the fecal microbiota switching from Firmicutes occupied (95.60 ± 2.62%) and Lactobacillus rich, to being dominated by Proteobacteria (70.91 ± 28.93%), especially Escherichia/Shigella. However, when Amp was given via muscle injection, Firmicutes was mostly retained (i.e., from 83.6 ± 24.4% pre- to 90.4 ± 15.2% post-treatment). In control chickens without seeding with blaCMY–2+ E. coli, oral Amp also led to the increase of Proteobacteria, dominated by Klebsiella and Escherichia/Shigella, and a reduction of Firmicutes. Specifically within Firmicutes, Enterococcus, Clostridium, etc. were enriched but Lactobacillus was diminished. The fecal resistome including Ampr genes was more abundant in chickens receiving oral Amp than those treated with muscle injection, but the difference was primarily within 1 log. The data illustrated that both drug administration routes and pre-existing gut microbiota have profound impacts on gut microbiome disruption when antibiotic treatment is given. In hosts nurtured in a conventional environment, drug administration route has the most evident impact on gut microbiota rather than the size of the targeted blaCMY–2+ gene pool, likely due to the pre-existing bacteria that are (i) less susceptible to Amp, and/or (ii) with Ampr- or multidrug resistance-encoding genes other than blaCMY–2+. These results demonstrated the critical interplay among drug administration routes, microbiota seeded through the gastrointestinal tract, AR, gut microbiota disruption, and the rise of common opportunistic pathogens in hosts. The potential implications in human and animal health are discussed.
Introduction
The rapid rise of antibiotic resistance (AR) has raised serious public health concerns and led to the enforcement of policies to limit the uses of antibiotics in food animal production as well as human medicine. The evolution and enrichment of AR associated with antibiotic applications in concentrated food animal production operations is undeniable (Yurack, 1964; Levy et al., 1976; Levy, 1978; Founou et al., 2016). However, without prompt antimicrobial intervention, disease spread among animals can lead to severe losses in production, as well as more costly containment efforts (Casewell et al., 2003; McDevitt et al., 2006). So, how can these two issues be reconciled?
In the past decades, substantial studies have illustrated that multiple risk factors have contributed to AR development, enrichment, dissemination, and persistence. Therefore, targeted mitigation has become essential and deliverable. For instance, a large AR gene pool associated with foodborne microbiota was detected in ready-to-eat foods, redefining food consumption as a key avenue for disseminating AR bacteria and encoding genes to the general public. This discovery enabled successful mitigation of the largest foodborne AR gene pool associated with fermented dairy products in a few years, once multiple problematic starter and probiotic strains were removed from the product lines (Wang et al., 2006; Manuzon et al., 2007; Wang, 2010; Li et al., 2011). AR bacteria and AR genes are abundant and persistent in various hosts and environments, from wild animals, newborn babies never exposed to antibiotics, to food animals from organic production, and even EU farms that abandoned growth promotional antibiotics years ago (Borgen et al., 2000; Casewell et al., 2003; Johnsen et al., 2005; Sorum et al., 2006; Moritz and Hergenrother, 2007; Allen et al., 2010; Zhang et al., 2011). Multiple molecular mechanisms have been identified as contributors to AR persistent and niche fitness, even in the absence of antibiotic selective pressure (Andersson and Hughes, 2011; Harms et al., 2016; Singh et al., 2018; Bakkeren et al., 2019). Although eliminating AR bacteria associated with fresh produce and food animal products has been difficult to achieve so far at the production level, food processing treatments intended to inactivate pathogens are also effective against AR bacteria associated with these products (Wang, 2010). Nevertheless, the AR bacteria-rich feces released daily by billions of human and animals represent the most significant avenue impacting the pool of environmental AR bacteria and AR genes, subsequently spreading them to the global ecosystem and into food and hosts (Chee-Sanford et al., 2001; Nandi et al., 2004; Salyers et al., 2004; Doyle et al., 2006). Thus, there is an urgent need to identify key risk factors for fecal AR proliferation.
Using a lab mouse model and two antibiotics with differing pharmacological properties, Zhang et al. (2013) revealed that (i) oral administration of antibiotics, not the use of the antibiotic itself, is the direct cause of AR proliferation in feces and gut microbiota disruption, (ii) drug pharmacological properties also impact outcomes; for instance, for drugs at least partially excreted through the bile/fecal route instead of through the kidney/urine route, injection alleviates side effects, but does not eliminate them, and (iii) without oral seeding of AR bacteria, the targeted AR gene pools were not observed in feces even after 5 days of antibiotic treatment, regardless of administration route. Results from this study provided support for an alternative interpretation, that the rising trends of AR and chronic host health conditions associated with gut microbiota disruption could be largely due to oral administration of antibiotics. The potential to separate antibiotic applications from common detrimental side effects is encouraging, enabling effective drug intervention for disease prevention and treatment without fueling secondary problems. However, the results from lab animal studies need to be further validated in conventional settings.
Poultry represents the largest sector of the global food-producing animal industry. It is one of the largest consumers of antibiotics, as well as a key producer of animal waste with significant environmental impact. According to the FDA, majority of the antibiotics used in poultry production are administrated orally, mixed into feed or water (U.S. Food and Drug Administration, 2018, 2019). AR bacteria are abundant across the poultry production chain worldwide, regardless of direct exposure status to antibiotics (Baron et al., 2018; Daehre et al., 2018b; Apostolakos et al., 2019). Moreover, birds and mammals have distinctive anatomy and physiology, and zoonotic pathogens have the ability to directly impact human health, including those originating in poultry (Knudsen et al., 2018; Borges et al., 2019). Therefore, this study examined the impact of antibiotic administration routes and oral exposure to AR bacteria in a poultry production environment free of growth-promotional uses of antibiotics. This was done in order to assess the applicability of the previous findings in conventional settings and a diversified set of animal hosts, as well as to explore the potential implications for human and animal health.
Materials and Methods
Isolation and Identification of blaCMY–2+ Strains and Culture Preparation for Inoculation
Poultry fecal isolates were retrieved from Columbia Blood Agar plates and cultivated separately in Columbia Broth (Becton, 100 Dickinson and Company, Franklin Lakes, NJ, United States) at 37°C. Three blaCMY–2+ strains used in this study were isolated from the feces of two 5-day-old broiler chickens without antibiotic exposure and confirmed to be E. coli by 16S rDNA sequence analysis. The key features of the strains are summarized in Table 1.
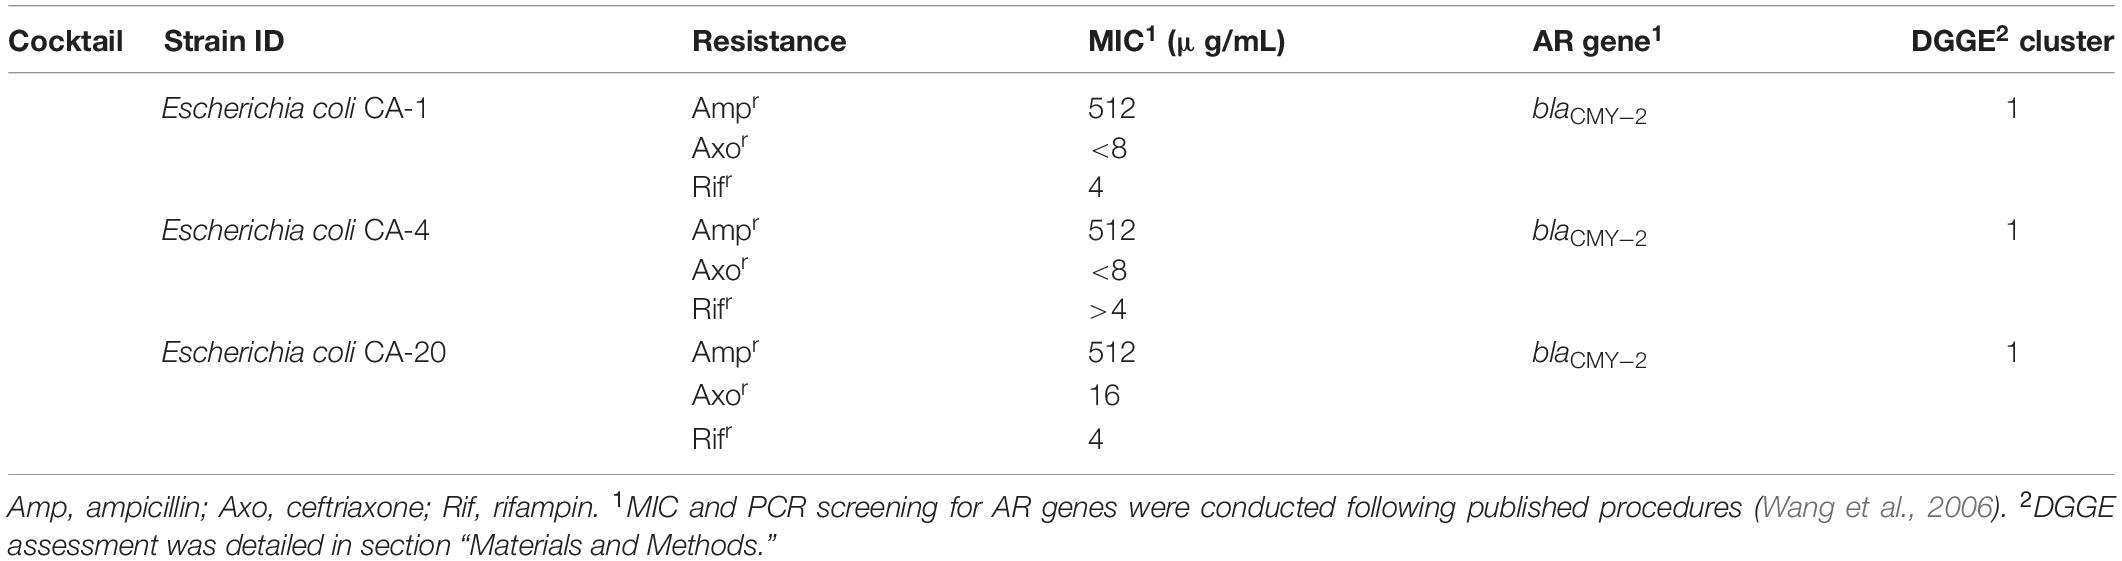
Table 1. The blaCMY–2+ E. coli strains used in the study.
To prepare for chicken inoculation, cells from 1 mL of overnight culture of each strain were collected by centrifugation (8000 × g, 1 min), washed once, and re-suspended in 1 mL saline. The final inoculation cocktail contained 106 CFU/mL E. coli cells from three strains mixed at 1:1:1 ratio and was used to seed the chicken gut by gavage feeding.
Feed Treatment and Quality Measurement
Standard chicken diet P10109 prepared by Ohio Agricultural Research and Development Center (OARDC) Poultry Facility was used in the study. Feed composition was illustrated in Supplementary Table S1. Poultry feed, two pounds each in autoclaving-safe box (30 cm × 30 cm × 10 cm) or cylinder jar (20 cm in diameter, 20 cm in height), was processed in a sterilizer (AMSCO Renaissance series 3021, Mentor, OH, United States) under gravity mode at 121°C, 103.4 kPa for 15 min, cooled down to room temperature, and heated with the same parameters again to minimize bacterial population including spore-forming cells. The bacterial population of the resulting feed was less than 5 × 10² CFU/g, assessed by plate counting on Plate Count Agar (Becton, 100 Dickinson and Company, Franklin Lakes, NJ, United States) supplemented with 100 μg/mL cycloheximide (Sigma-Aldrich) and Columbia Blood Agar base (CBA, Becton Dickinson and Company, Franklin Lakes, NJ, United States), supplemented with 5% defibrinated sheep blood (Fisher Scientific, Hampton, NH, United States) and 100 μg/mL cycloheximide (Sigma-Aldrich).
Animals, Experimental Design, and Antibiotic Administration
The experiment was conducted following animal protocol No. 2012A00000061, approved by the Institutional Animal Care and Use Committee, The Ohio State University, Columbus, OH, United States. To assess the baseline resistome in newly hatched chickens, 5 Leghorn chickens hatched within one week were purchased from a local breeder, and another 10 chickens from two batches were hatched at the OARDC Poultry Research Farm. To evaluate the impact of antibiotic administration routes, Leghorn chickens used in the controlled experiments were hatched and maintained at the OARDC Poultry Research Farm (295 chickens) or maintained at the OARDC Turkey Research Center (30 chickens).
Ampicillin (Amp) was chosen in the study because of its application history in the poultry industry, both in the U.S. and worldwide, and also because the abundance of the targeted gene was still low enough at baseline, for changes to be detected in the study, as opposed to some of the other commonly used antibiotics such as tetracycline. The range of application dosage is quite wide, ranging from 20 to 400 mg/kg body weight being used in poultry production and research (Donoghue et al., 1996; Commission of Chinese Veterinary Pharmacopoeia, 2010; Zhao et al., 2015). Thus, a dosage of 300 mg/kg was chosen in this study.
Chickens were randomly distributed into eight groups (Table 2). Supplementary Figure S1 illustrates the experimental flow for each round of the experiment. A total of 325 chickens (two birds per cage with separate feed and water supply, controlled temperature, filtered air in the room, and heat-treated feed and distilled water) were used in multiple rounds of the study. Chickens receiving intramuscular (IM) or oral (per os, PO) ampicillin administration after blaCMY–2+ strains inoculation were designated as Amp-IM and Amp-PO. Chickens receiving IM- or PO-ampicillin administration without prior inoculation of the blaCMY–2+ E. coli strains were designated as NI-Amp-IM and NI-Amp-PO. Chickens received IM- or PO-saline after the blaCMY–2+ E. coli inoculation were designated as Saline-IM and Saline-PO, which were collectively referred to as Sham group. Chicken groups received neither the blaCMY–2+ E. coli inoculation nor Amp but saline administration were defined as NI-Saline-IM and NI-Saline-PO. Both Amp-IM and Amp-PO experimental groups had at least 13 cages of chickens from 4 rounds of assessments. From Day 5 (D5) to Day 8 (D8) post-hatching, chicks were inoculated with the blaCMY–2+ E. coli cocktail (0.2 mL/bird, 106 CFU/mL) every 24 hrs for 4 consecutive days via gavage feeding using 20 ga × 1.5 in an animal feeding needle (Fine Science Tools, Foster City, CA, United States). Controls were fed with 0.2 mL of saline during the inoculation period. Chicks were then reared in cages for 11 days until Day 20 (D20), allowing the microbiota to settle. Chickens in Amp-PO, Amp-IM, NI-Amp-PO, and NI-Amp-IM groups received antibiotic administration from D20. Antibiotics were administered via gavage feeding using 20 ga × 1.5 feeding needle or via breast intramuscular injection using 1 mL insulin syringe (Becton, Dickinson and Company, Franklin Lakes, NJ, United States). Chicks were administered with ampicillin or saline once a day for 5 consecutive days.
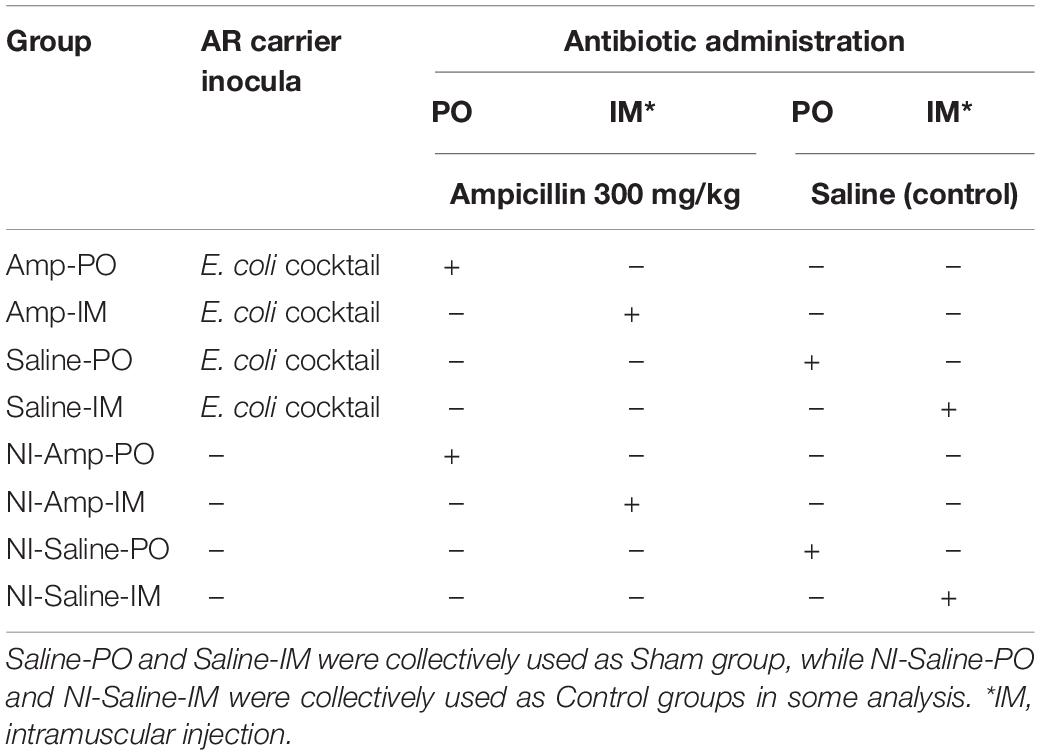
Table 2. Leghorn chicken groups subjected to marker cocktail inoculation and antibiotic administration treatments.
Fresh feces of each broiler chicken subject were collected on-site in the rearing facility, stored on ice, and transported to the lab within 4 h for microbial assessments. Fecal samples were collected once a week before antibiotic treatment, once a day during antibiotic administration, and once every three days after antibiotic withdrawal up to 14 days from initial antibiotic exposure. During antibiotic treatment, the daily fecal sample collection was carried out before drug administration practice.
Quantification of Culturable Bacteria in Fecal Microbiota
Fresh fecal samples from 20 chickens randomly picked were subjected to culture recovery from D20. Fecal microbiota was recovered on Columbia Blood Agar base (CBA, Becton Dickinson and Company, Franklin Lakes, NJ, United States) supplemented with 5% defibrinated sheep blood (Fisher Scientific, Hampton, NH, United States) and 100 μg/mL cycloheximide (Sigma-Aldrich). CBA plates supplemented with 32 μg/mL of ampicillin sodium (Life Technologies, Grand Island, NY, United States) were used to recover Ampr bacteria. The dry mass of chicken feces was spun down by centrifugation at 4°C at full speed (Eppendorf 5415R, Germany) and homogenized in stomacher bags by a stomacher (Seward Stomacher 80 Lab System, United Kingdom). Homogenized samples were serially diluted in sterile saline and plated on corresponding agar plates. The plates were incubated at 37°C for 48 h in a GasPak 150 anaerobic system with GasPak EZ anaerobe container system sachets (Becton Dickinson and Company). The upper and lower detection limits of the plate counting enumeration method are 1010 CFU/g and 102 CFU/g, respectively.
DNA Extraction
Total DNA were extracted from the dry mass of chicken feces. DNA extraction followed a published method for real-time quantitative PCR (qPCR) and denaturing gradient gel electrophoresis (DGGE) analyses (Yu and Morrison, 2004).
Real-Time Quantitative PCR
TaqMan real-time PCR protocol was used to assess representative AR genes, and 16S rDNA gene pools in total DNA extracted from chicken feces as described previously (Zhang et al., 2013). The primers and probes for gene blaCMY–2, tetL, tetM, tetS, sul1, sul2, and 16S rDNA are listed in Table 3. The primers were synthesized by Sigma-Aldrich (St. Louis, MO, United States) and the probe was synthesized by Biosearch Technology Inc. (Novato, CA, United States). Each sample was assessed and analyzed in duplicates on a CFX96 system (Bio-Rad, Hercules, CA, United States).
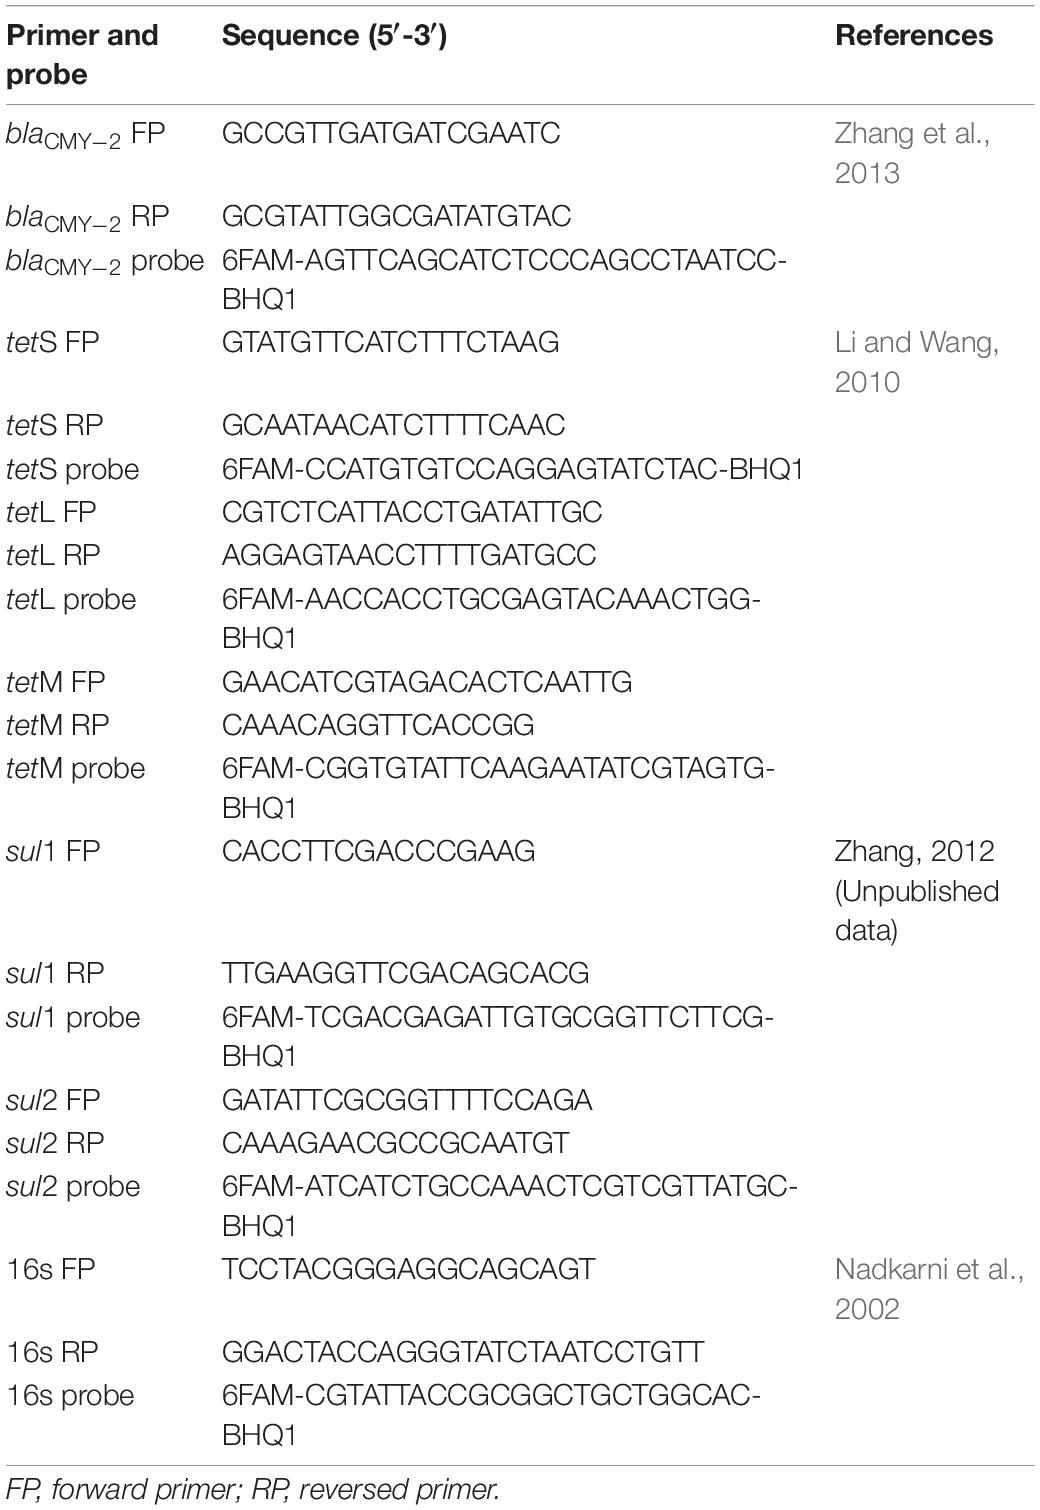
Table 3. Primers and probes used in AR gene pool quantification.
For baseline AR gene quantification, fecal samples were collected on D5 from a total of 15 chickens from 3 batches, including 5 vendor-hatched chickens and 10 local-hatched chickens from 2 batches (5/batch). To examine the impact of antibiotic administration routes on the changes of the blaCMY–2 gene abundance, a total of 181 chickens were enrolled for real-time PCR analysis from 6 rounds of experiments. In each round of experiment, fecal samples of at least three randomly picked chickens from 3 different cages were subjected to real-time quantitative PCR analysis from each treatment group. The presented figures were constructed by data from at least five fecal samples from chickens in five different cages of each group.
DGGE Analysis
While animals from different cages were used as independent unit for DGGE data presentation to avoid compounding error, in most cases both chickens from the same cage were assessed by DGGE to identify unusual outliers. A total of 111 chickens were assessed by DGGE. The experimental groups of Amp-PO and Amp-IM each had 19 chickens from 11 cages, the control groups each had at least 14 chickens from 7 cages. The 16S rDNA V3 region was used for amplification of partial 16S rDNA gene following a published procedure (Muyzer et al., 1993). The sequences of PCR primers used were 16S-357F-GC 5′-CGCCCGCCGCGCGCGGCGGGCGGGGCGGGGGCACGGG GGGCCTACGGGAGGCAGCAG-3′ and 16S-518R 5′-ATTACCGCGGCTGCTGG-3′; products were loaded on to an 8% acrylamide gel with a urea gradient from 40 to 60%. Electrophoresis was performed at 60°C, 83 V for 16 h using the Dcode system for DGGE (Bio-Rad, Hercules, CA, United States) (Muyzer et al., 1993). The finishing gel was stained with 0.01% ethidium bromide and imaged under ChemiDoc XRS system (Bio-Rad, Hercules, CA, United States). The dominant DNA band was recovered and sequenced.
16S rDNA Amplicon Sequencing and Shotgun Metagenomic Analysis
For 16S rDNA amplicon sequencing, a total of 82 chickens were enrolled. Except for the last round, individually sequenced samples were collected from chickens located in separated cages. Each pooled samples of the treatment and control groups consisted of feces from three additional chickens, which were also located in different cages. In the last round of experiment presented in Supplementary Figure S6, fecal samples all the chickens were subjected to individual sequencing. The V4/V5 region of the 16S rDNA gene were amplified following the standard protocol for 16S Metagenomic Sequencing Library Preparation (Illumina support, 2013), and the products were sequenced on Illumina Miseq (2 × 250 bp paired-end run) at OARDC Molecular and Cellular Image Center (individual samples). Paired-end reads joining and quality filtering were performed on Qiime2 following DADA2 procedure. Phylogenetic analysis and taxonomic assignments were conducted using Greengenes database (version 13_8). Diversity analysis was performed on the Qiime2 following standard procedure. Krona chart of the microbiota composition were generated from the sequences obtained from QIIME (Ondov et al., 2011).
For shotgun metagenomic analysis, total fecal DNAs, consisting of pooled samples of four chickens from two different cages per treatment or control group were sent to the Nationwide Children’s Hospital (Columbus, OH, United States) for sequencing quality control analysis, and sequenced on an Illumina HiSeq 2500 system (2 × 150 bp paired-end run) (Illumina Inc; San Diego, CA, United States). The raw reads were trimmed and quality-controlled using Trim Galore1 software with default parameters. Clean reads were processed using DeepARG platform and for AR gene quantification (Arango-Argoty et al., 2018).
Statistics
Statistical analysis of the metagenomics data was based on the complete sample profile as expressed by the pattern of operational taxonomy units (OTUs) and the relative abundance (percentage) of individual OTU in each sample. For the relative abundance of bacterial population, the results were expressed as means ± standard error (SD). Inter-group comparisons were done with unpaired t tests (Lactobacillaceae abundance analysis) or Mann–Whitney U test (Enterobacteriaceae abundance analysis). Four-way comparisons (Amp-PO vs. Amp-IM vs. Sham vs. control) were done with Kruskal–Wallis test. The impacts of administration routes on the quantity dynamic of gene blaCMY–2 and 16S rDNA gene was analyzed with Linear Mix Model in SPSS (version 19.0). Significance was declared at P < 0.05.
Results
Antibiotic Resistant Bacteria and AR Gene Reservoir in Fecal Microbiota of Newly Hatched Poultry
Figure 1 illustrated fecal AR background by real-time PCR. The abundance of fecal 16S rDNA ranged between 1010 and 1011 copies/g feces. Representative AR genes blaCMY–2, tetL, tetM, tetS, and ermB were detected in the feces of all three batches of chickens. The three tetracycline-resistance (Tetr) genes were highly abundant across all the samples, followed by gene ermB. The baseline abundance of blaCMY–2 gene was relatively low. The abundance of sul1 and sul2 varied significantly among the three batches: sul1 was highly abundant in vendor-hatched chickens and the first batch of OARDC facility-hatched chickens, but was below the detection limit in the second facility-hatched batch; the sul2 gene was barely detected only in the vendor-hatched chickens. AR gene(s) with low baseline abundance were expected to respond to antibiotic intervention with detectable changes, making blaCMY–2 and sal2 candidates as marker genes. While Amp can be delivered via drinking water, some sulfonamides have poor solubility in water. Thus, Amp was used in further antibiotic intervention assessments, and blaCMY–2 gene was chosen as the marker gene.
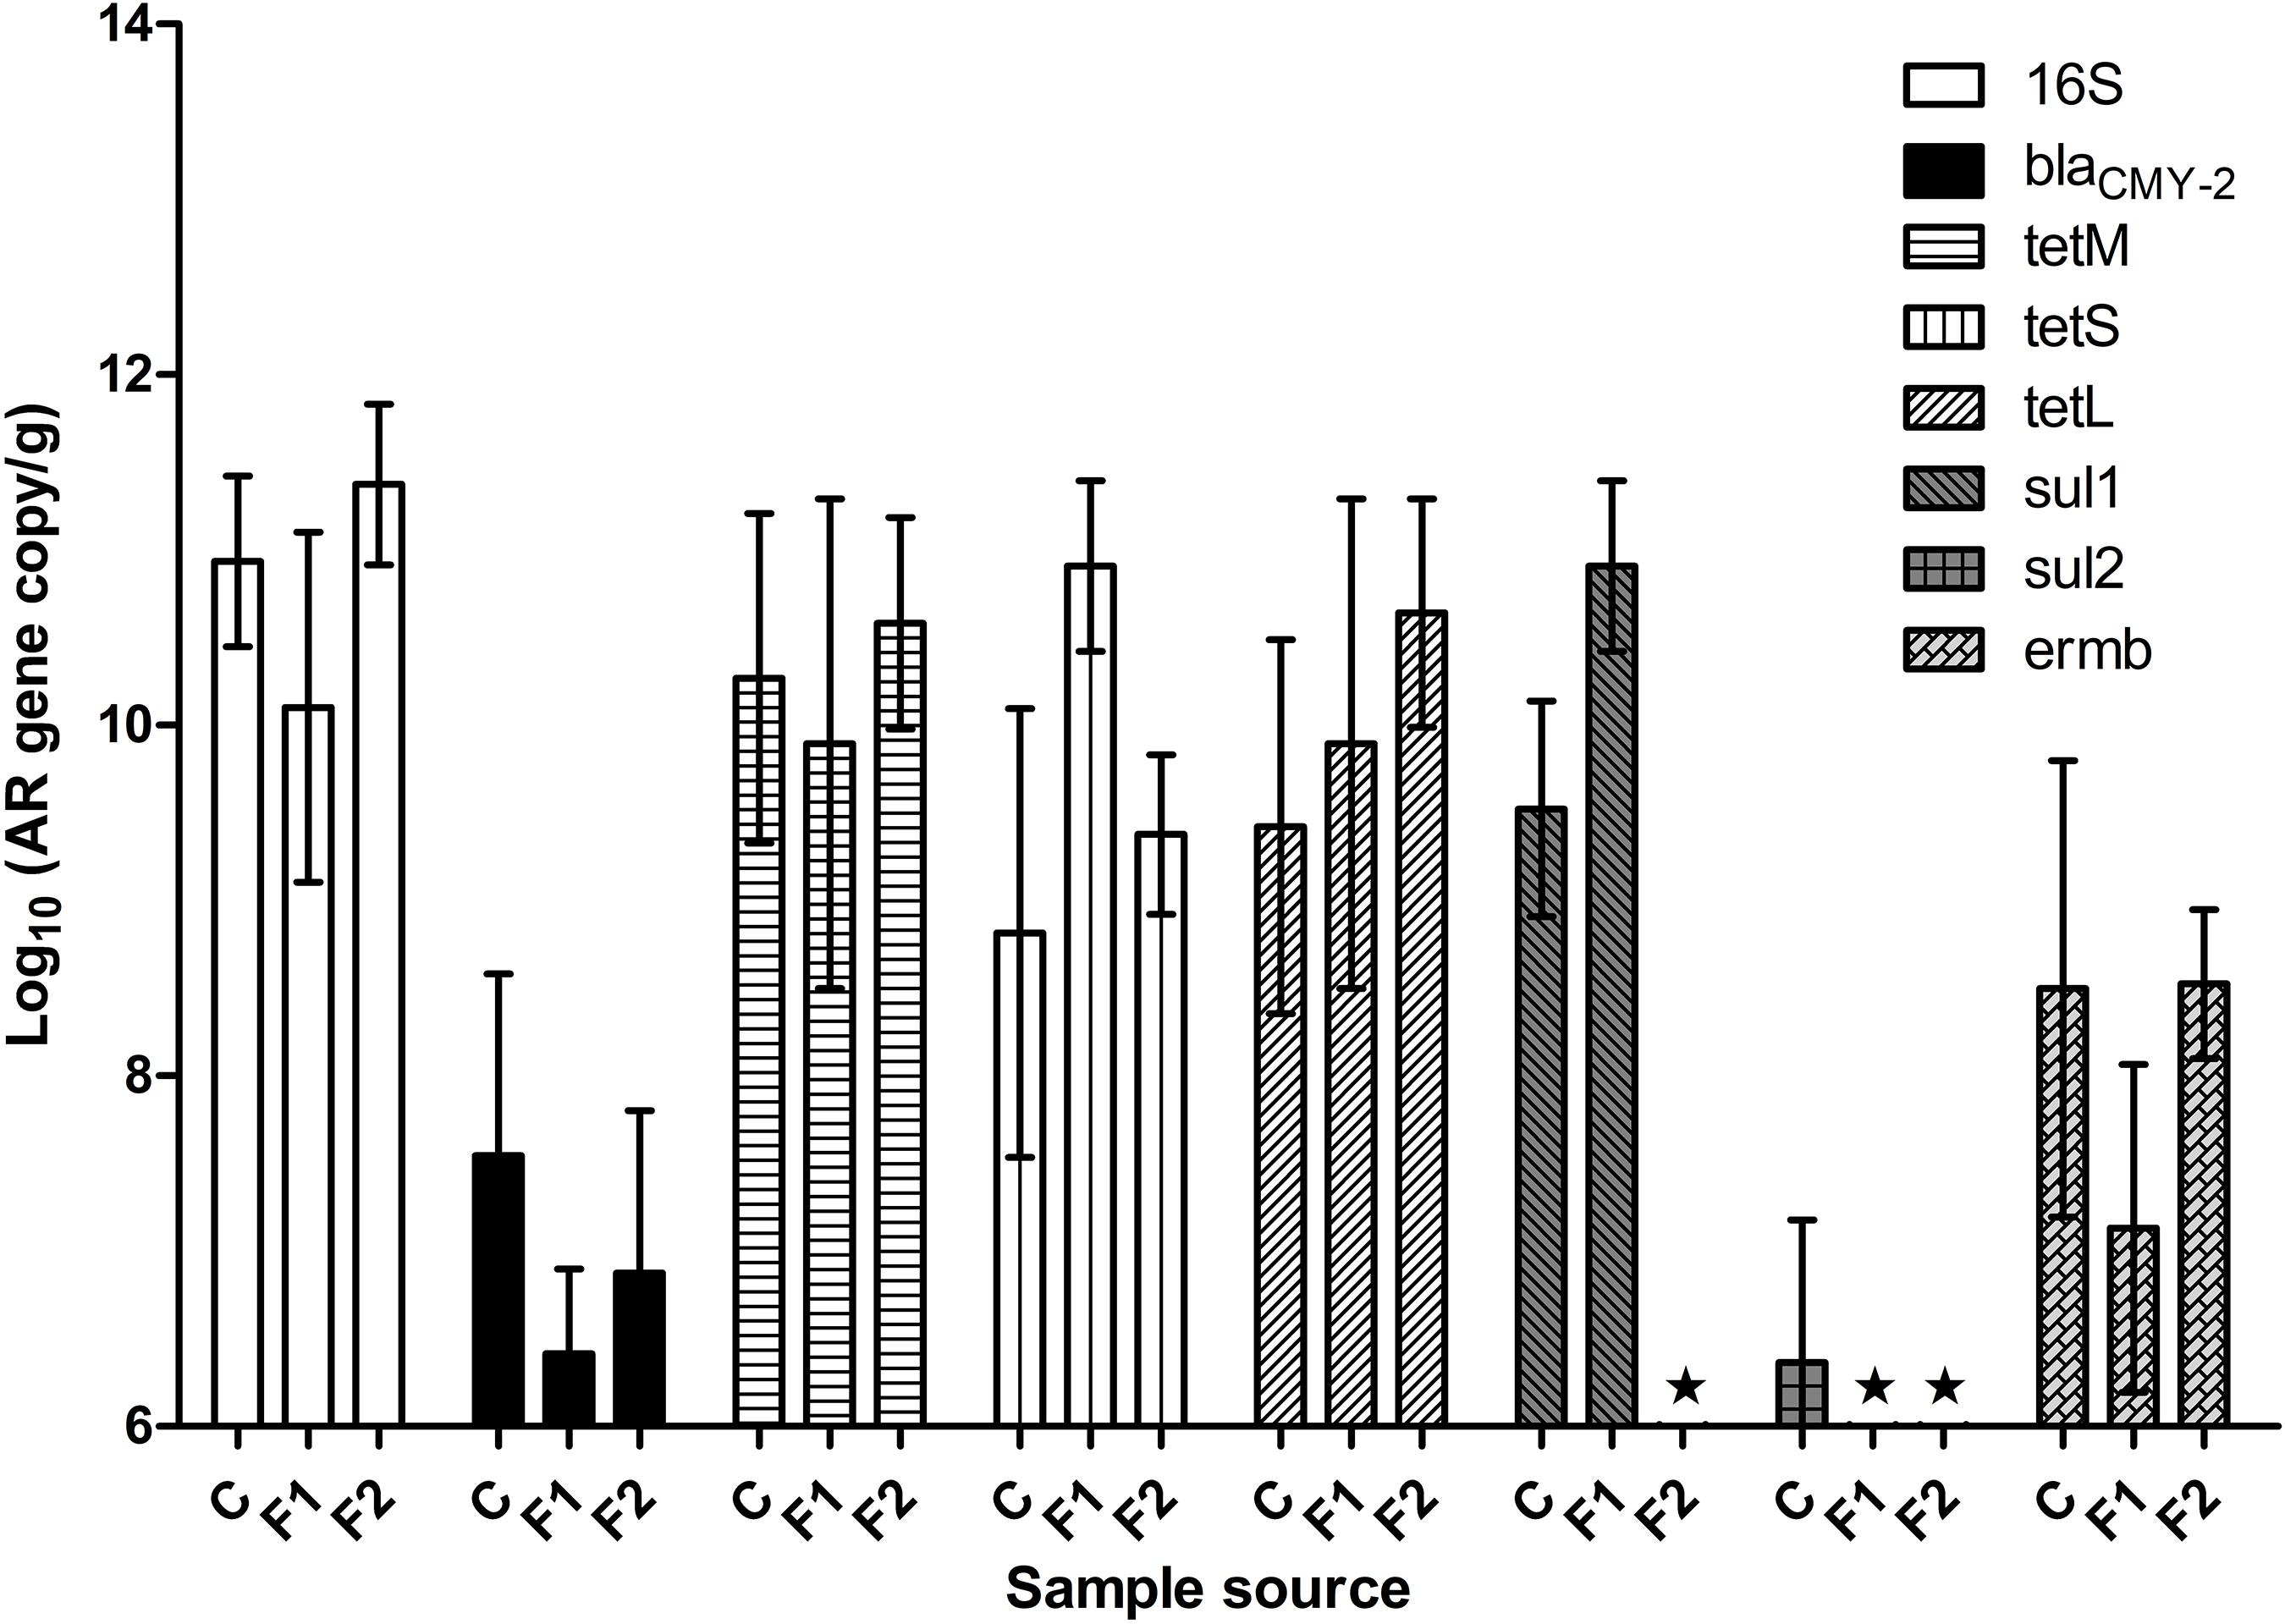
Figure 1. The abundance of representative AR genes and 16S rDNA in newly hatched chicken feces. The lowest detection limit was 106 copies/g. C, fecal samples from vendor-hatched chickens. F1&F2, fecal samples from chickens hatched within facility from different batches. ★, Below detection limit.
When fecal samples of 20 chickens hatched in facility were assessed for cultivable ampicillin-resistance (Ampr) bacterial population, an average of 8.0 ± 0.6 log CFU/g total cultivable bacteria were recovered on CBA plates, while Ampr bacteria were detected in 42% of the examined chickens. This result confirmed that Ampr bacteria naturally colonized in certain chickens.
The Impact of Antibiotic Administration on blaCMY–2 Gene Pool
The 16S rDNA gene pool of all treatment groups remained quite stable (Figure 2C), with abundance between 9 to 11 log10 copies/g of chicken feces. Compared to non-inoculated groups, inoculated groups (Amp-PO, Amp-IM) had larger blaCMY–2 gene pool before Amp treatment (D20), likely due to colonization of the inoculated blaCMY–2 + strains in chicken GI tracts (Figures 2A,B). Administration of 300 mg/kg of Amp led to a detectable increase of the blaCMY–2 gene pool in Amp-PO and Amp-IM groups, starting from the second day of antibiotic administration (D21), maintained during Amp administration period (to D24), and dropped after antibiotic withdrawal. But, despite the observation that blaCMY–2 gene pool size increased by 1.2 ± 0.7 log in Amp-PO group from D20 to D21 and by 0.5 ± 0.8 log in Amp-IM group, the difference between Amp-PO and Amp-IM treatment by real-time PCR was statistically insignificant (P = 0.054).
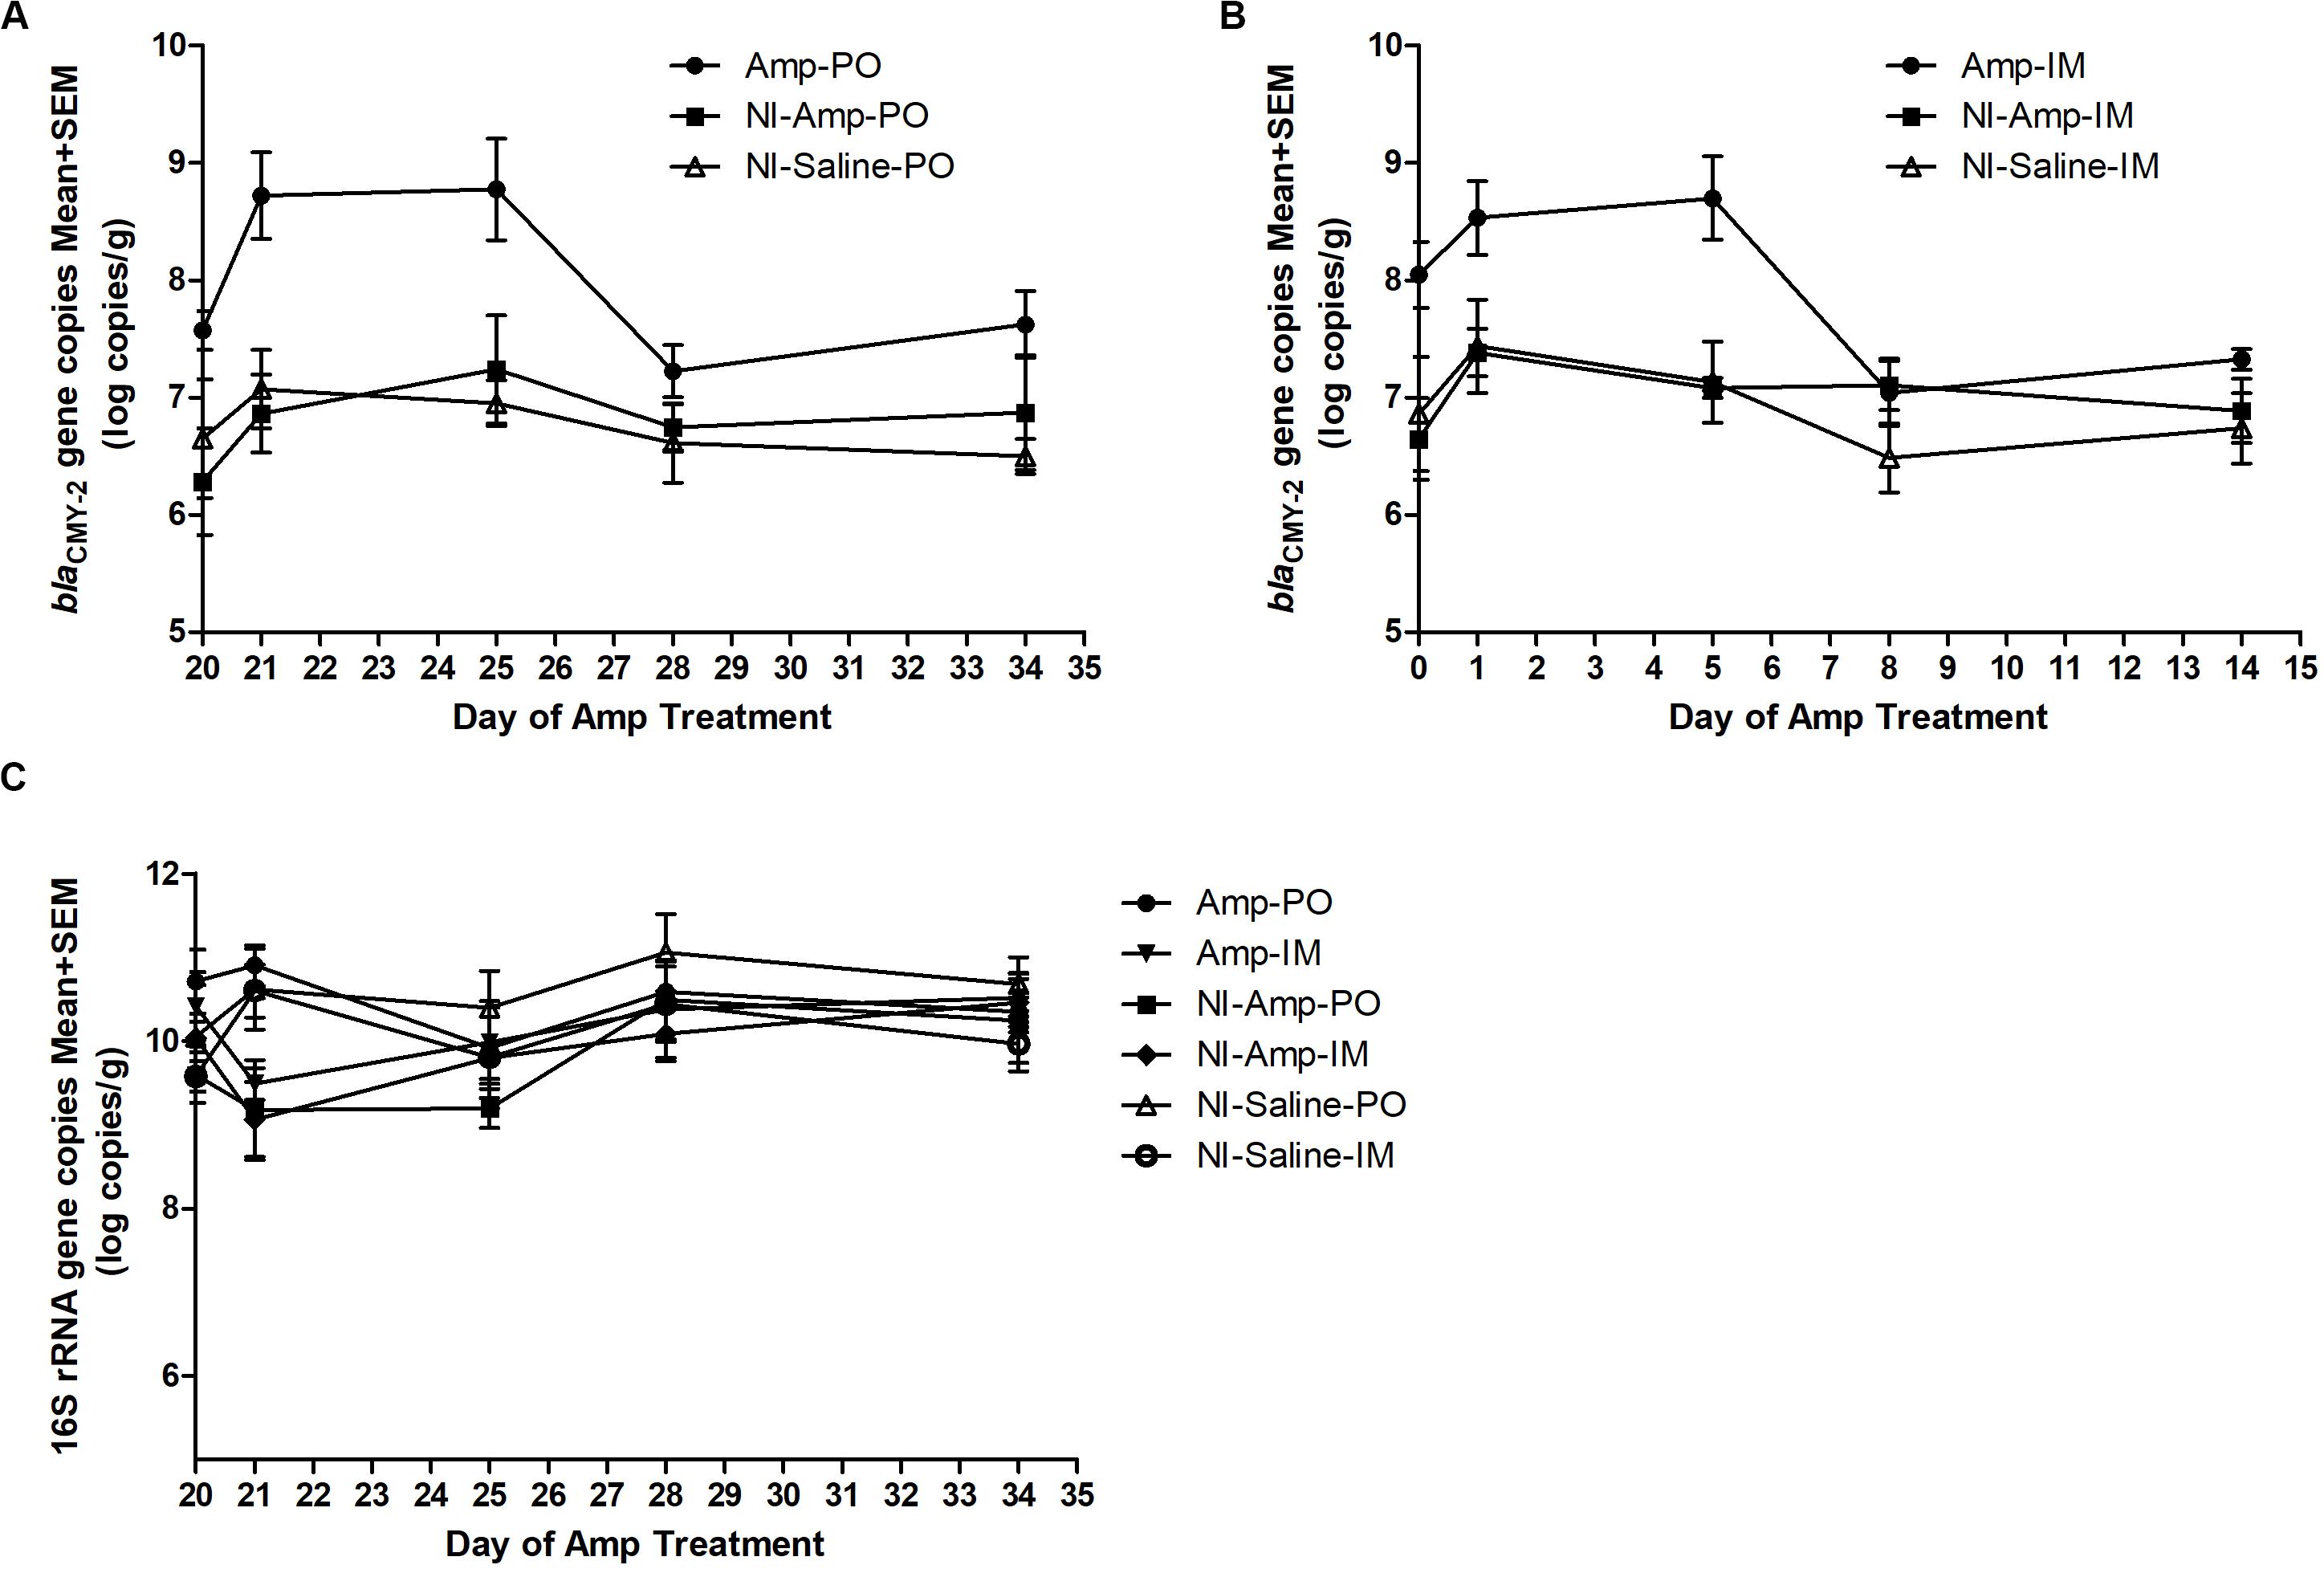
Figure 2. Real-time PCR quantification of fecal blaCMY–2 gene pool and 16S rDNA gene pool in Amp (300 mg/kg body weigh/day)-treated chickens. The change of blaCMY–2 gene pool in chicken fecal microbiome under Amp treatment by (A) oral administration and (B) muscle injection. (C) The change of 16S rDNA gene pool in chicken fecal microbiome. The detection limit of blaCMY–2 and 16S rDNA gene pools in this study is 5 log10 copies/g. The error bars represent standard deviations of the data from animal subjects used in the study. D24 was the last day of Amp administration.
Without inoculating the blaCMY–2 + marker strains, however, the natural blaCMY–2 + gene pool in NI-Amp-PO and NI-Amp-IM groups did not have a detectable response to Amp administration, similar to the blank control groups NI-Saline-PO and NI-Saline-IM (P = 0.104).
Impact of Antibiotic Administration Routes on Poultry Fecal Resistome
Figure 3 illustrated the resistome by shotgun metagenomic sequencing. Consistent with the real-time PCR results in Figure 1, Tetr genes were prevalent at early life of chickens as examined, and their abundance remained relatively high throughout the experimental period in all treatment groups. Administration of Amp, whether PO or IM, led to the increase of abundance of most AR genes in the fecal microbiota with a decrease of the Tetr genes. Particularly, the increase of β-lactam and bacitracin-resistance genes were more than fourfold in Amp-PO than those in Amp-IM. Moreover, the rapid rise of multidrug-resistance genes was most evident in Amp-PO, which was more than 10- and 2-fold of those in Sham and Amp-IM, respectively.
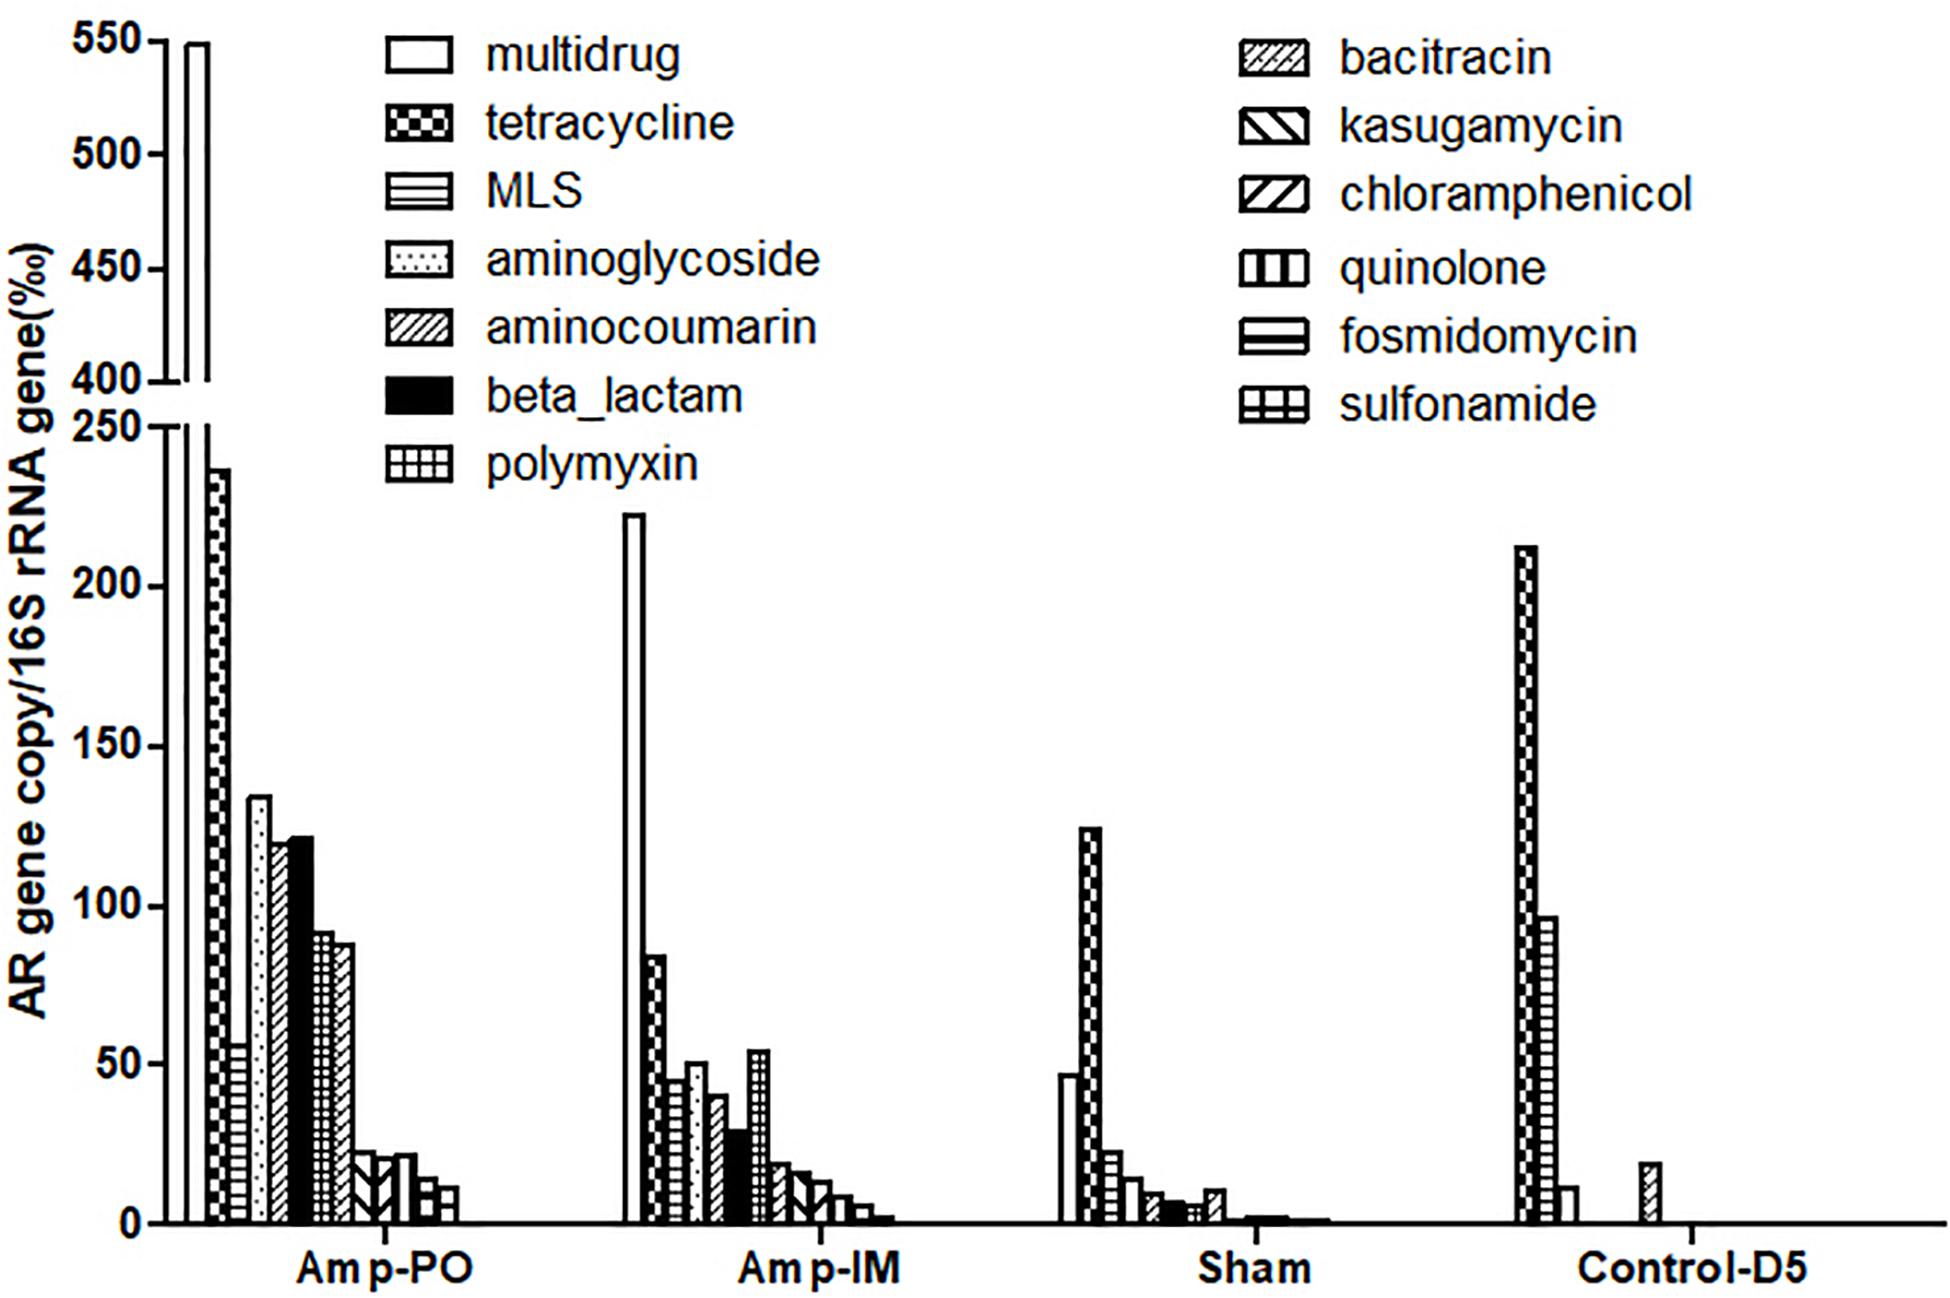
Figure 3. Abundance of AR genes in fecal microbiome of chickens after Amp or control treatments. Each bar represented the abundance of a group of AR genes against certain antibiotics.
The data indicated that switching the administration route from PO to IM had more substantial impact on the gut microbiota than simply the blaCMY gene pool, resulting in significant changes in resistome. Further analysis of the β-lactam-resistance gene pool showed significant accumulation of blaCMY and blaAMP genes in the pooled Amp-PO sample. Particularly, the blaCMY genes of Amp-PO had the most significant increase, reaching almost nine times that of Amp-IM group, and this gene family includes the blaCMY–2 gene carried by the E. coli marker strains (Supplementary Tables S2, S3).
The Impact of Administration Routes on Poultry Fecal Microbiota
As illustrated in Figure 5 and Supplementary Figure S3 (D20 before Amptreatment), phylum Firmicutes dominated in normal chicken fecal microbiota, accounting for up to over 98% detected sequences (95.6 ± 2.6%), while the abundance of phylum Proteobacteria was primarily less than 5% of the total sequences. Without further antibiotic treatment, seeding blaCMY–2+ E. coli marker strains had undetectable or very limited impact on the abundance of Proteobacteria. Supplementary Figure S3 further illustrates that although the detailed compositions of fecal microbiota varied among individual subjects, without exception the phylum Firmicutes, and within it the family Lactobacillaceae, dominated poultry fecal microbiota.
Oral administration of Amp, however, significantly changed the profile of fecal microbiota, especially the Firmicutes/Proteobacteria ratio (Figures 4A, 5 and Supplementary Figures S4A,C). The abundance of phylum Proteobacteria overturned from mostly less than 1% to an average of over 50% among examined chickens, including as much as over 99% of the total population in one subject (Figure 4, Amp-PO and Supplementary Figure S4A, Proteobacteria 70.9 ± 28.9%). The lowest detected abundance of Proteobacteria was still over 40% of the population. On the other hand, Amp delivered by muscle injection had relatively modest impact on chicken gut microbiota (Figure 4A, Amp-IM; Supplementary Figure S4B). The average abundance of Proteobacteria in Amp-IM group was less than 32% and 4 out of 6 chicks had less than 5% relative abundance, similar to the Sham group without any ampicillin exposure. These results suggested that oral administration of antibiotic posed more substantial selective pressure on the GI microbiota compared to injection.
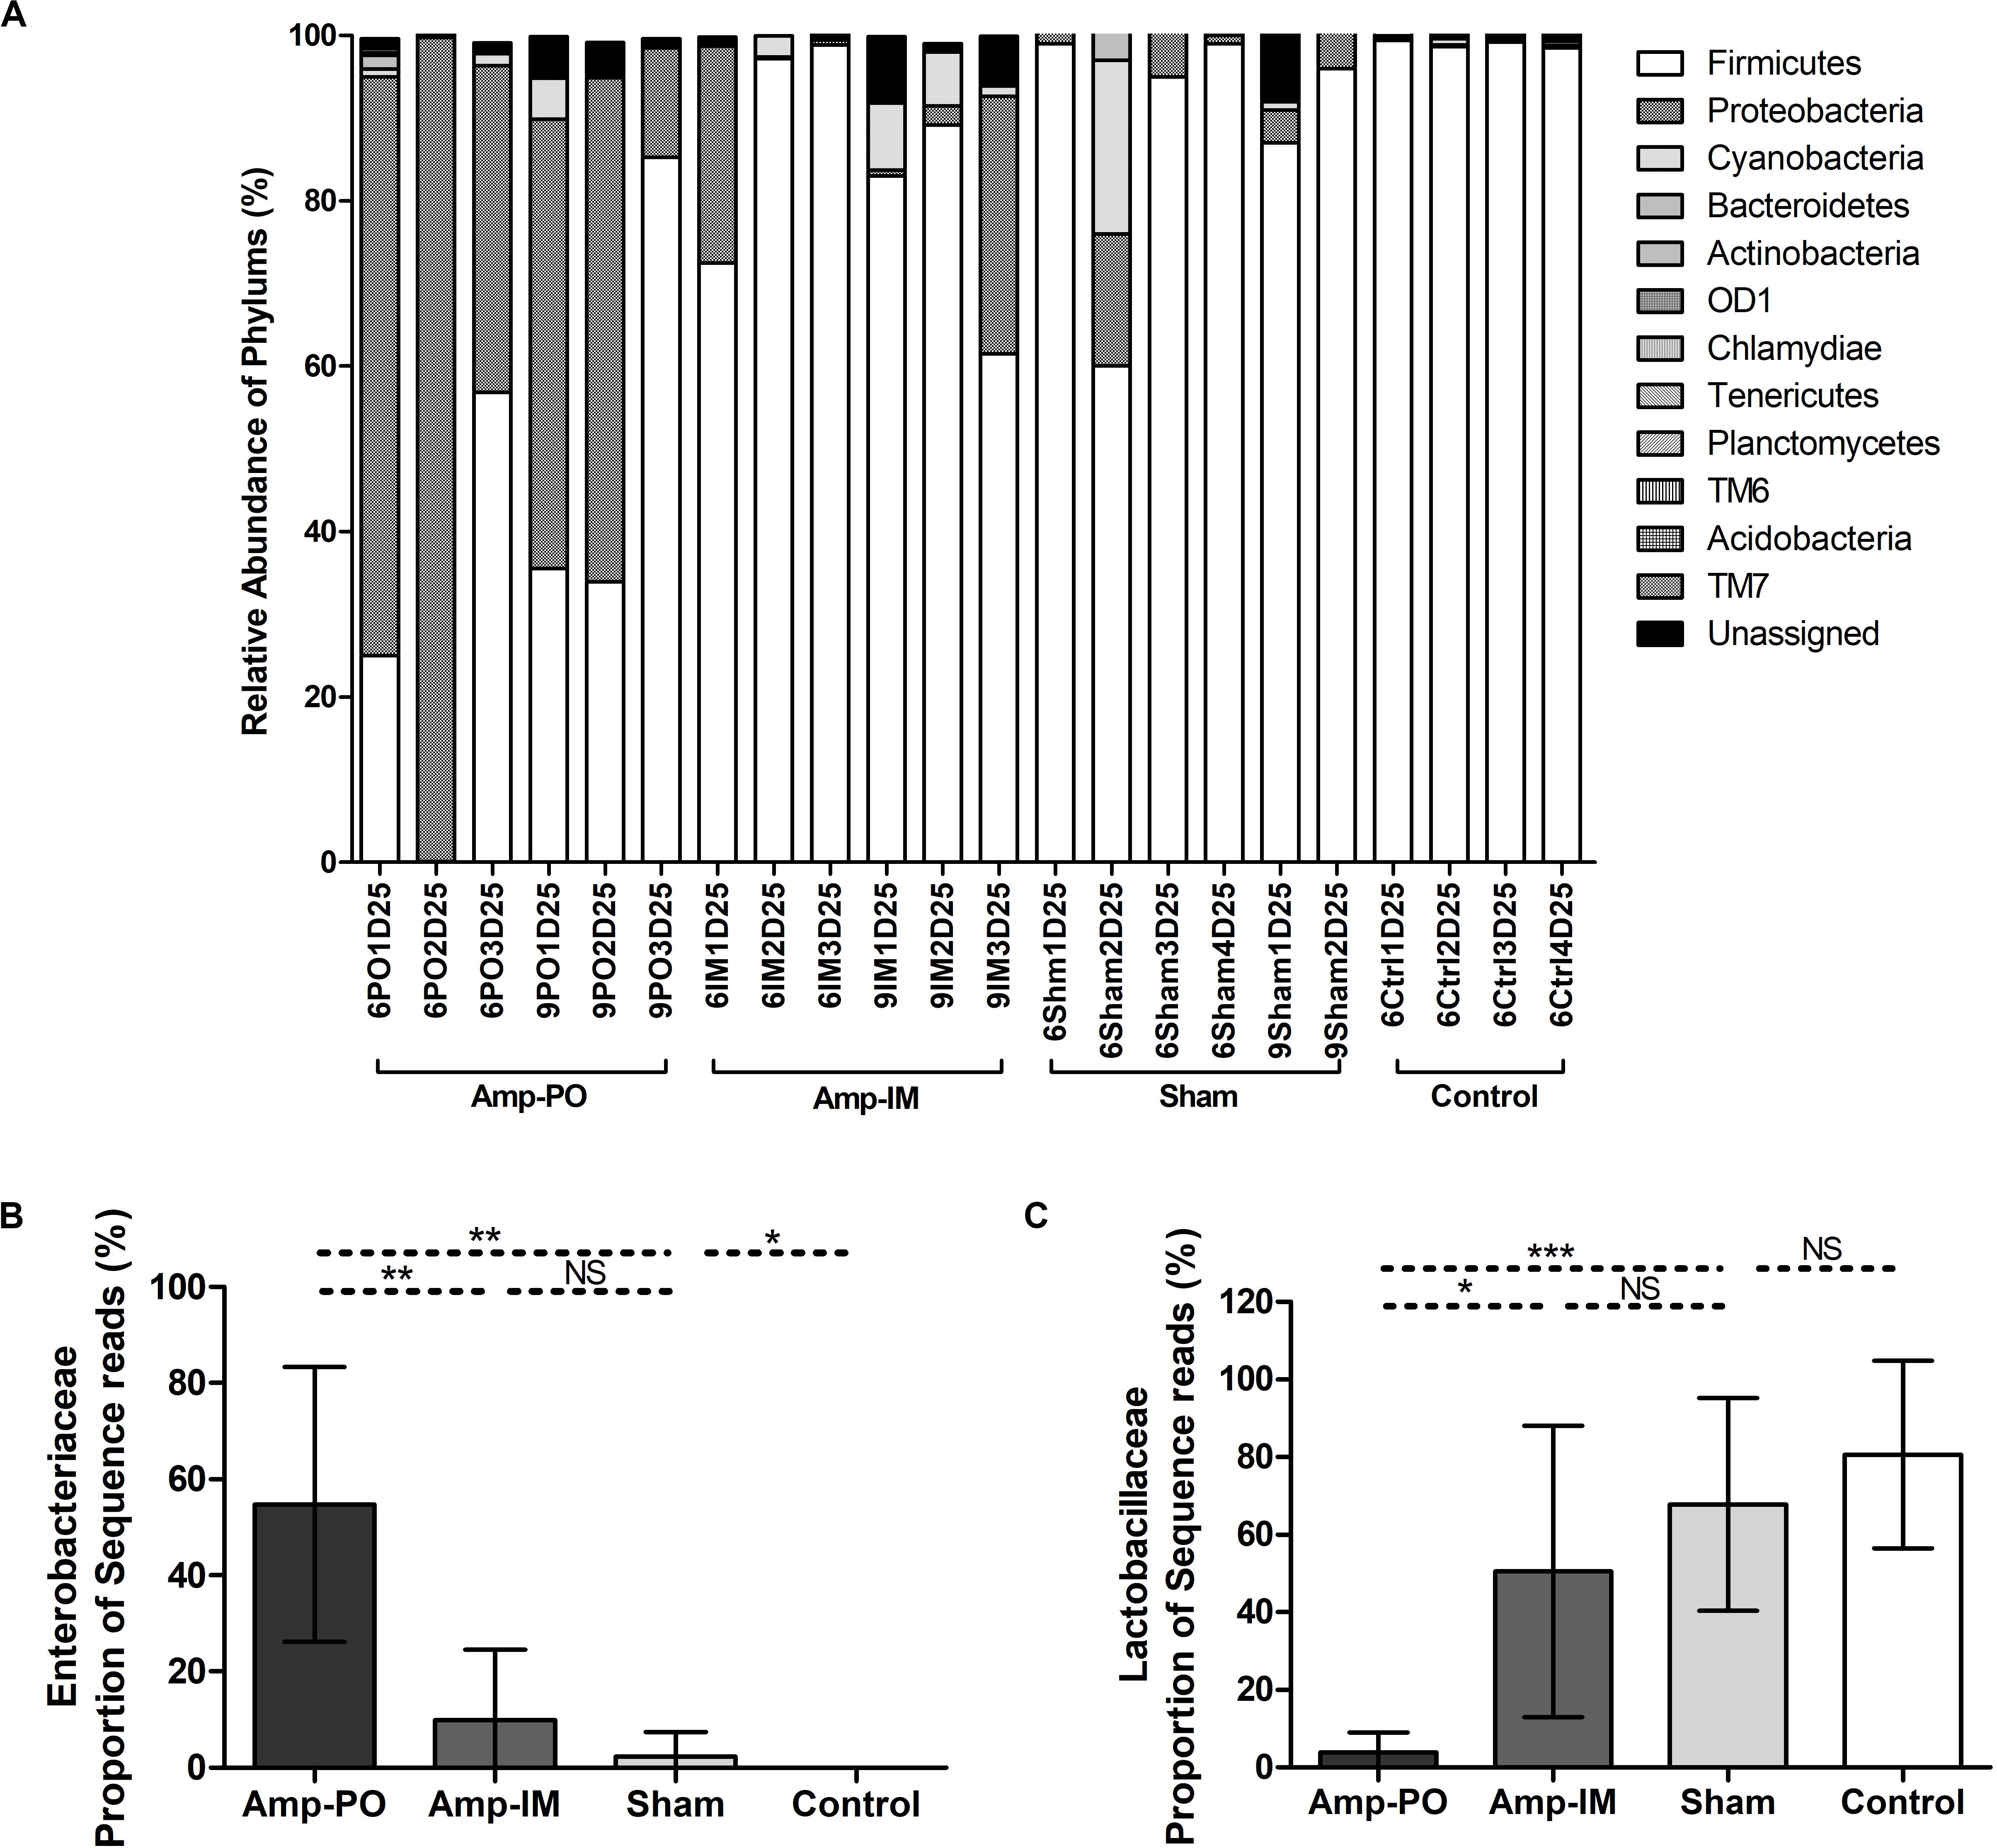
Figure 4. Impact of antibiotic administration route on the chicken fecal microbiota. (A) Overall bacterial profile plot of the detected phylum in fecal microbiota of chicken after antibiotic administration. (B) Impact of antibiotic administration route on the abundance of Enterobacteriaceae in chicken fecal microbiota. (C) Impact of antibiotic administration route on the abundance of Lactobacillaceae in chicken fecal microbiota. Sham: chicken inoculated with marker blaCMY–2+ E. coli, no Amp administration. Control: chicken without inoculation of marker blaCMY–2+ E. coli, no Amp administration. *p < 0.05; **p < 0.01; ***p < 0.001.
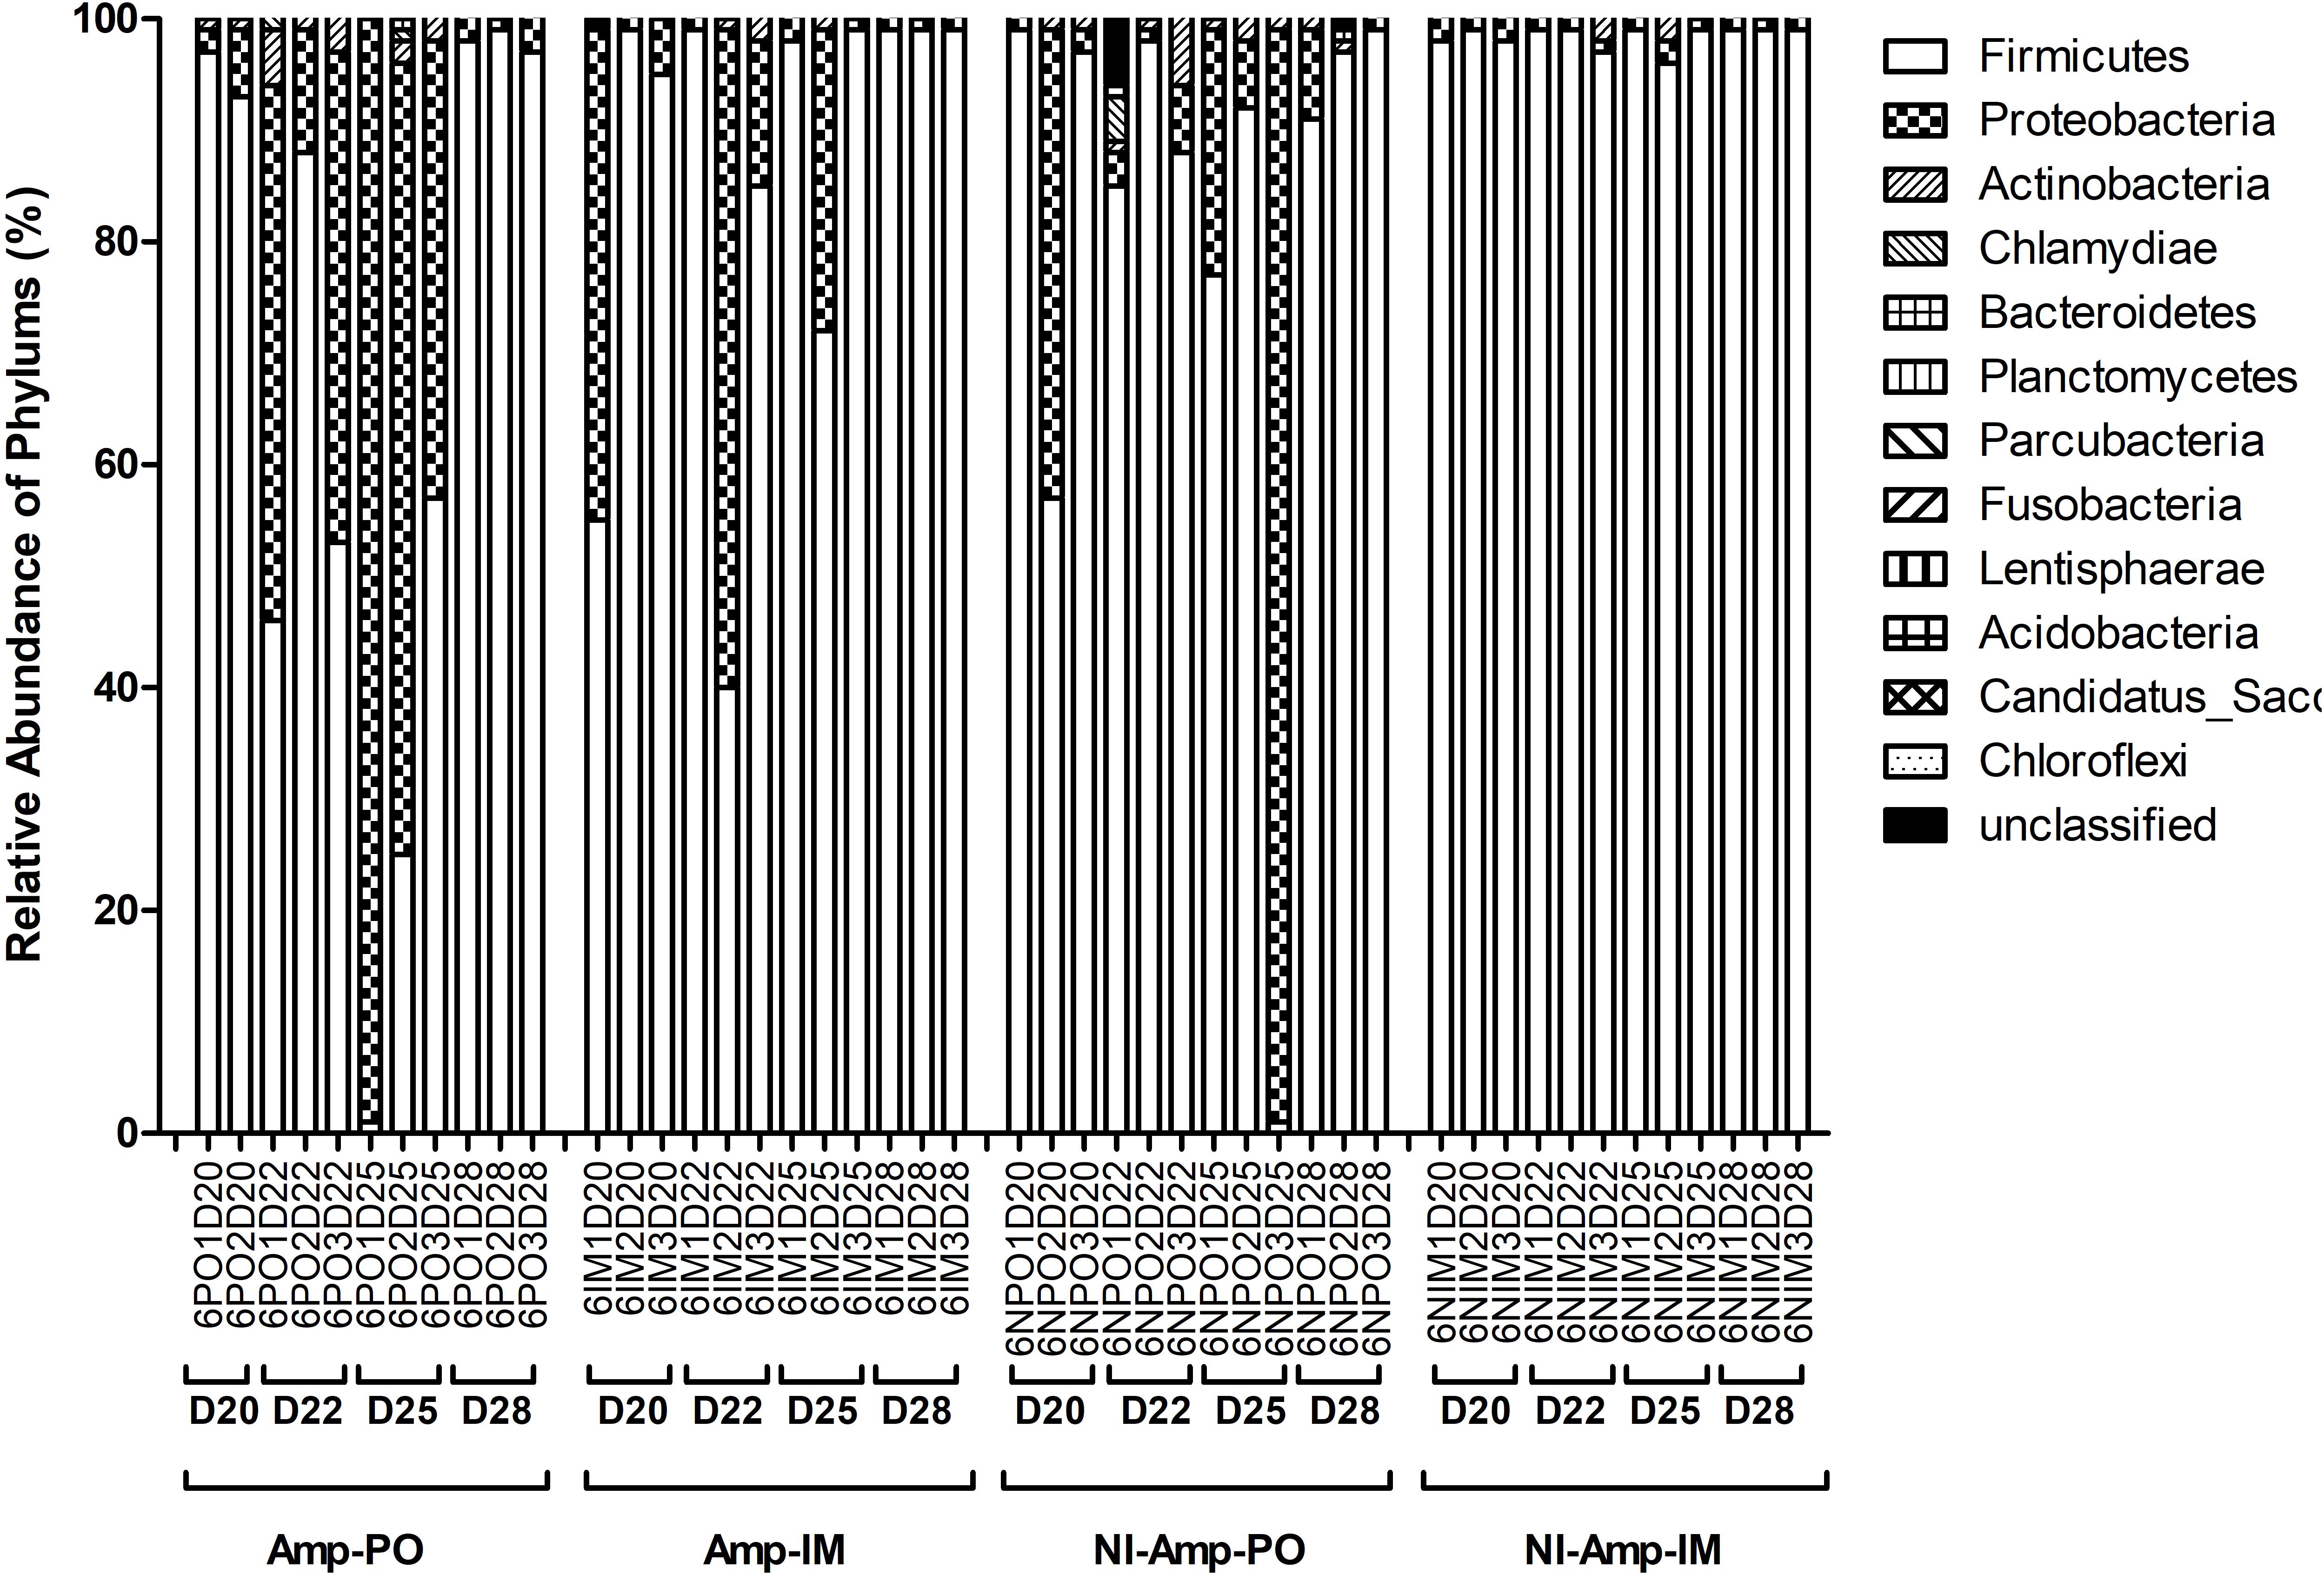
Figure 5. Dynamic change of microbial composition of chicken fecal microbiota during antibiotic treatment. Overall bacterial profile plot of the detected phylum in fecal microbiota of chicken in different treatment groups during antibiotic treatment.
The dynamic of chicken fecal microbiota was tracked by 16S rDNA high-throughput sequencing throughout the antibiotic treatment (Figure 5). Firmicutes was the most abundant phylum before antibiotic treatment, consistent with previous data on normal chicken GI microbiota composition (Wei et al., 2013). With inoculation of Ampr E. coli, the abundance of Proteobacteria in Amp-PO group increased substantially during Amp treatment, becoming the most dominant population in the fecal microbiota. However, the increase of Proteobacteria was modest in Amp-IM group and the dominance of Firmicutes was better preserved accordingly. DGGE analysis showed the similar dynamics of microbiota in Amp-PO and Amp-IM samples. Also illustrated by DGGE, oral Amp significantly induced amplification of the marker E. coli strains (M) in the chicken fecal microbiota (Figure 6A). Five days of oral feeding of Amp led to the dominance of E. coli and reduction of other bacterial subpopulations. However, the profiles of dominant fecal microbiota in chickens retained their diversity during Amp treatment by muscle injection (Figure 6B), indicating a milder selective pressure in GI tract.
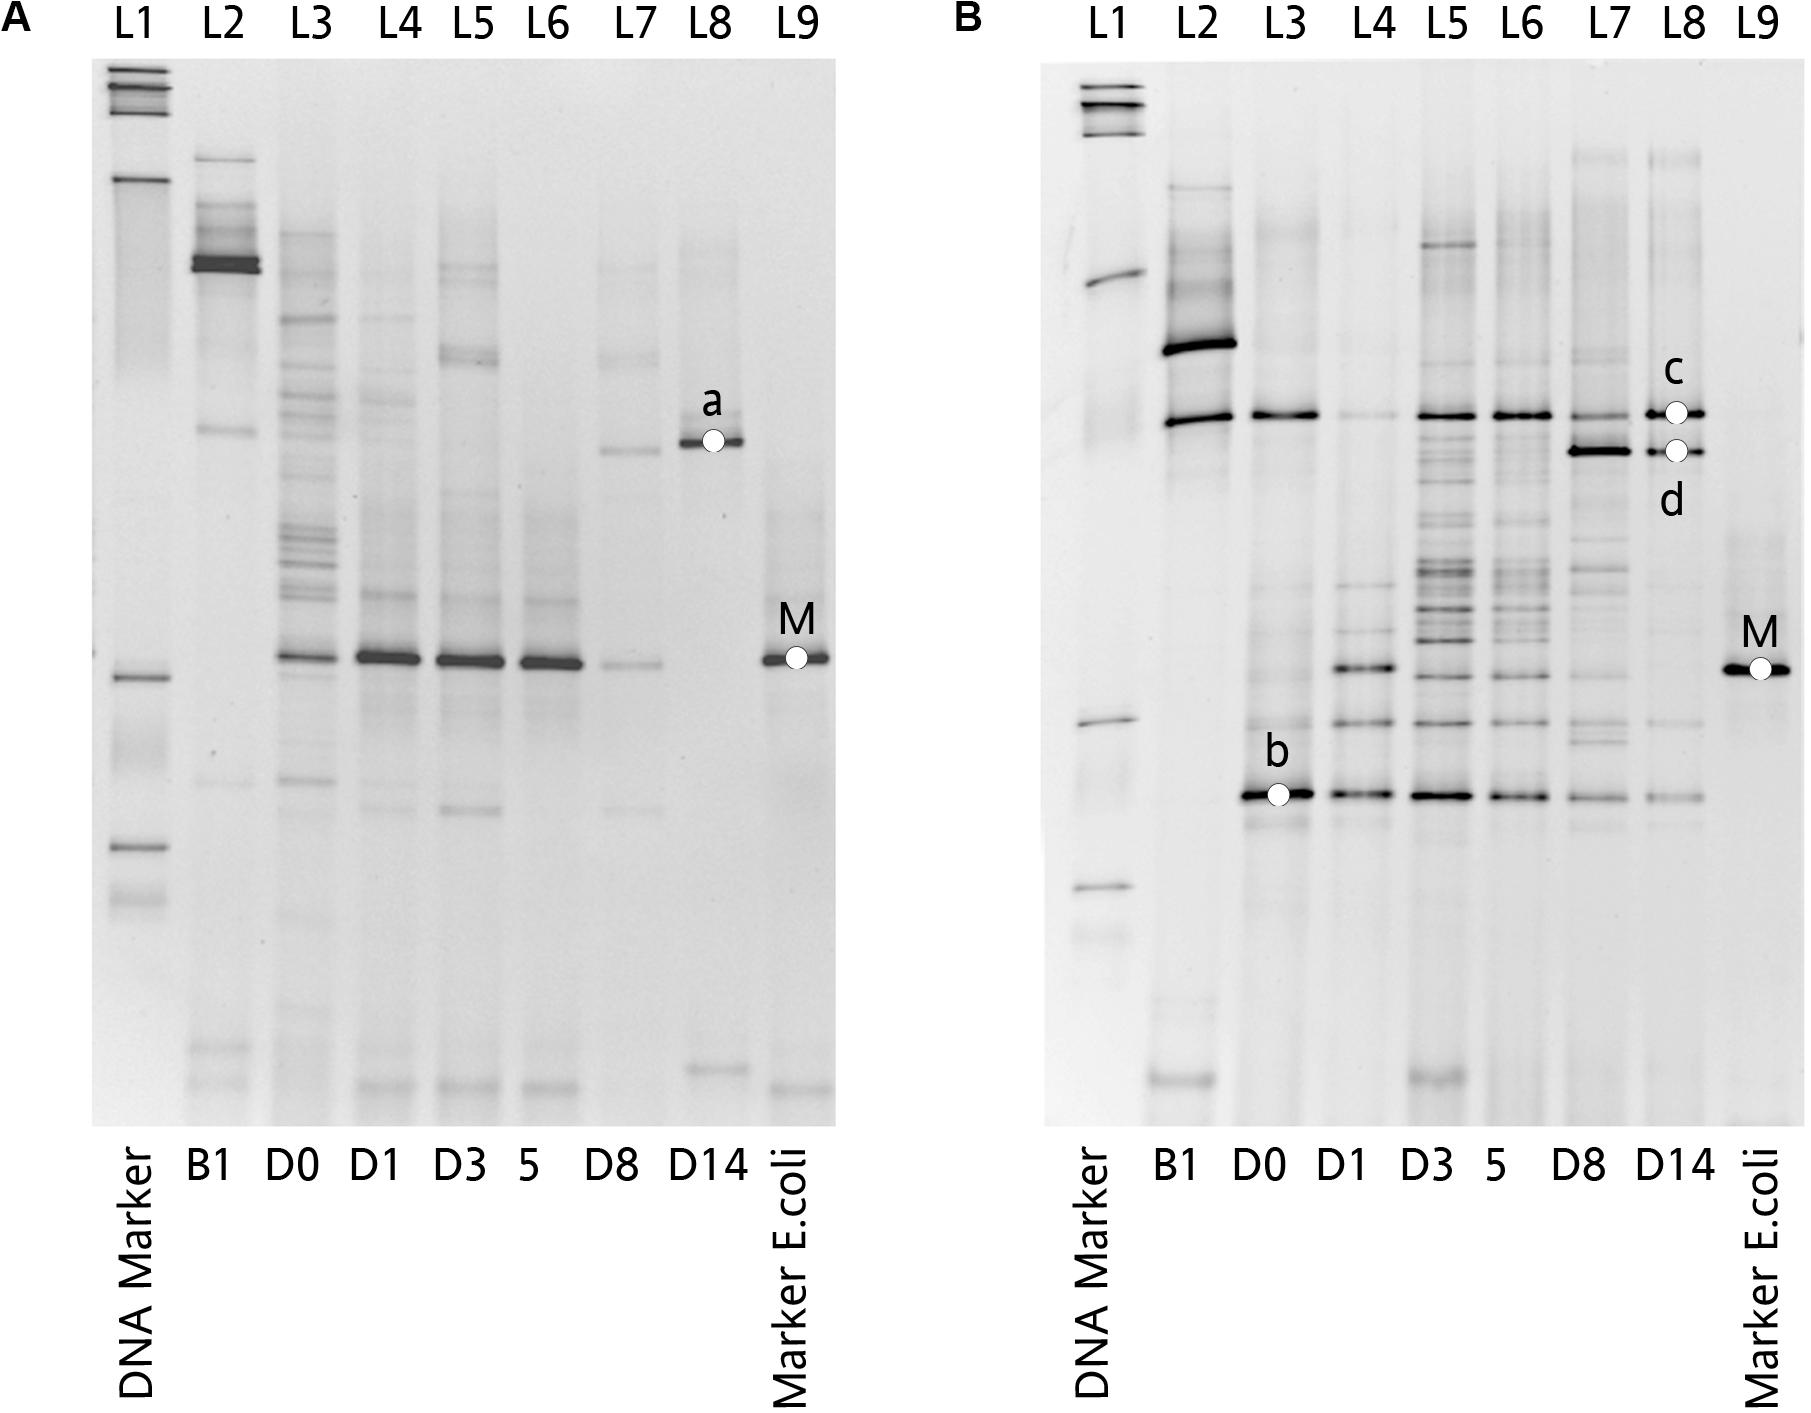
Figure 6. Impact of Amp treatment on dominant microbial profiles by DGGE assessment of 16S rDNA gene amplicons of total fecal DNA from inoculated chicken. (A) Microbial profiles of chicken fecal in Amp-PO, and (B) microbial profiles of chicken fecal in Amp-IM. Lane 1: 100 bp DNA ladder; Lane 2: before inoculation of marker strain; Lane 3: after inoculation but before Amp administration; Lane 4–6: 1st, 3rd, and 5th days with Amp exposure; Lane 7 and 8: 3rd and 9th days with Amp lifted; Lane 9: blaCMY–2+ E. coli. a: Lactobacillus sp.; b: Lactobacillus sp.; c: Lactobacillus sp.; d: Lactobacillus sp.; M: Inoculated Escherichia coli.
Without seeding the Ampr E. coli markers, the difference between antibiotic administration routes could still be recognized in NI-Amp-PO and NI-Amp-IM groups (Figure 5). Oral administration of Amp increased the population of Proteobacteria in NI-Amp-PO chickens, while the microbiota of NI-Amp-IM subjects remained stable with Firmicutes being dominant. Without the inoculation of Ampr marker E. coli, the increase of Proteobacteria might be attributed to other resistant strains, such as other members of Enterobacteriaceae. As an illustration, Klebsiella was detected as the dominant population in the NI-Amp-PO pooled and individual samples (Figure 7 and Supplementary Figure S5) after Ampicillin treatment. It is possible that fecal Klebsiella strains in the NI-Amp-PO group also had high tolerance to Amp and thus a growth advantage under Amp selective pressure. Supplementary Figures S4C,D, S6C,D further illustrate the details of diversified but similar trends in additional individual chickens.
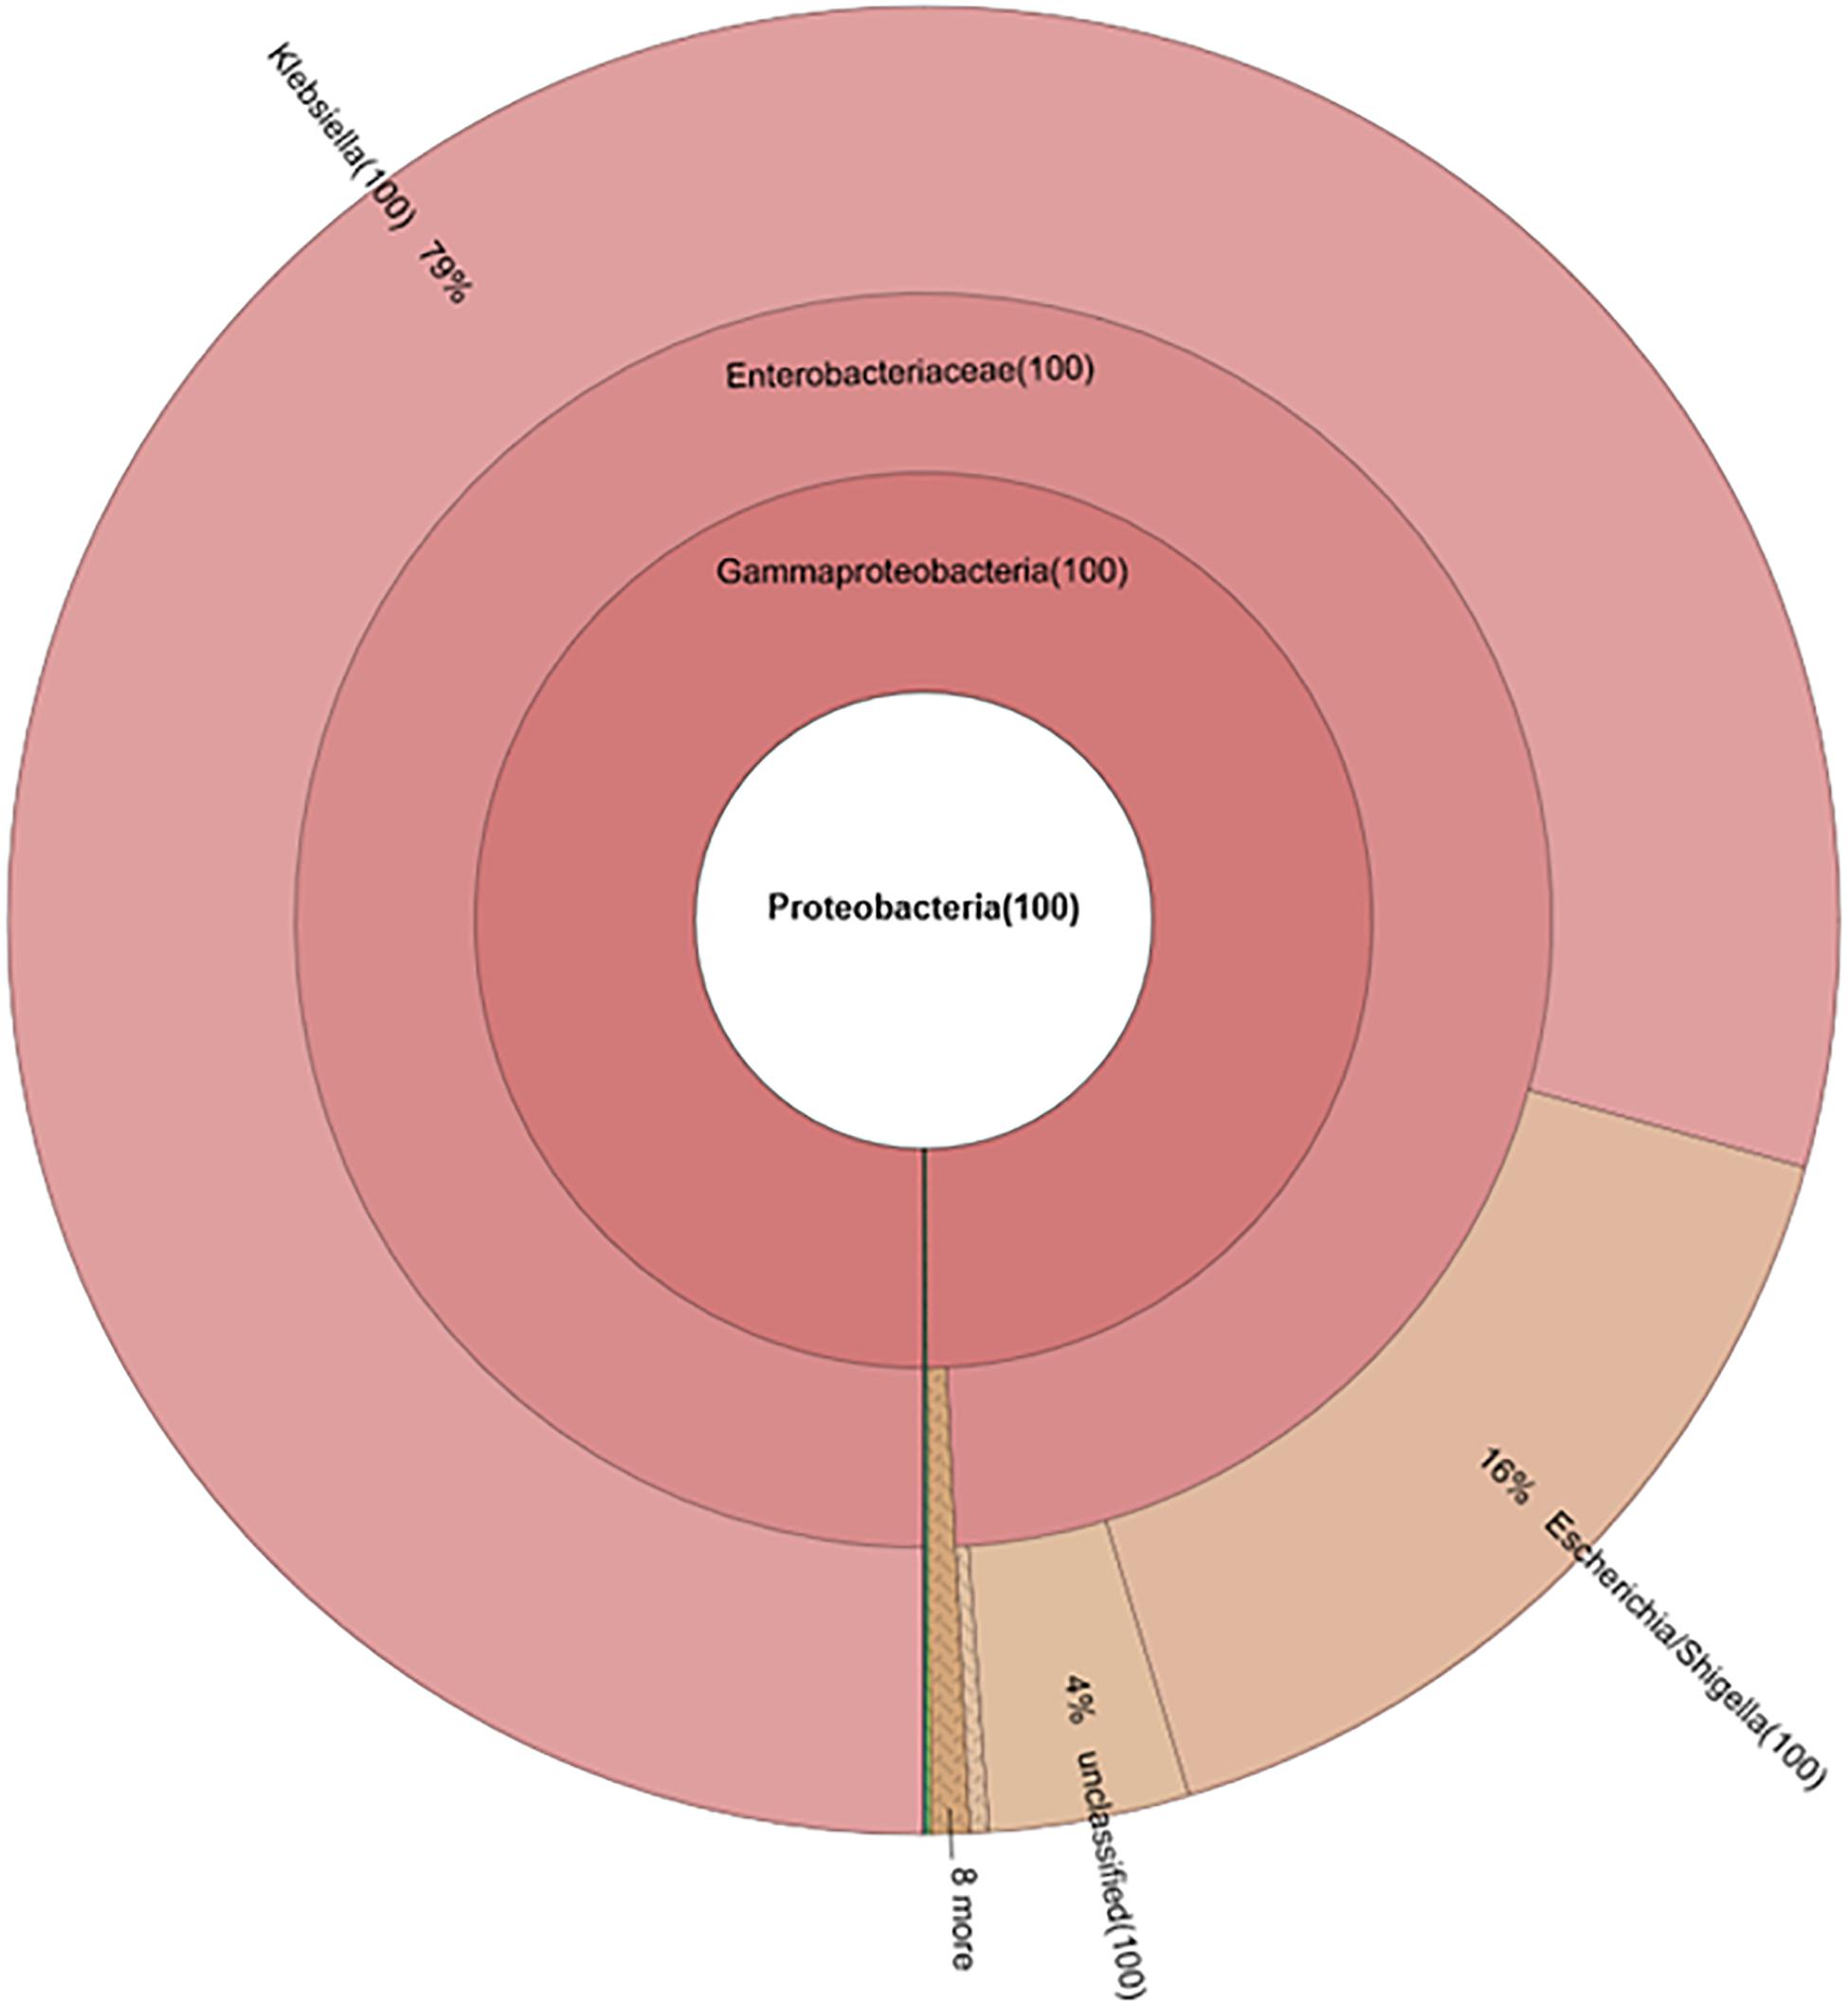
Figure 7. Composition of phylum Proteobacteria in fecal microbiota of NI-Amp-PO pooled sample after antibiotic treatment (D25).
Impact of Drug Administration Routes on Opportunistic Pathogens
Phylogenic analysis at the family level showed that the microbiota shifts after antibiotic administration were mainly induced by the increase of family Enterobacteriaceae (Figure 4B). The Amp-PO group had much higher abundance of Enterobacteriaceae (ranged from 13.24 to 99.59%, average 54.80 ± 28.57%) than Amp-IM (ranged from 0.05 to 31.03%, average 9.99 ± 14.54%) and control (ranged from 0 to 0.05%, average 0.02 ± 0.02%) groups. The population of Lactobacillaceae decreased accordingly, from 80.69 ± 24.16% (ranged from 45.18 to 97.43%) in control, to 50.52 ± 37.50% (ranged from 0.98 to 96.51%) in Amp-IM and 4.00 ± 5.05% (ranged from 0.02 to 12.66%) in Amp-PO (Figure 4C). Supplementary Figure S4A further illustrated in detail by individual subjects treated with oral Amp, that along with the switch of dominant phylum from Firmicutes to Proteobacteria, there was a significant surge of Escherichia/Shigella (ranged from 88.88 to 99.90%, average 95.64 ± 5.92%) in Proteobacteria. In the phylum of Firmicutes, the changes also included the reduction of Lactobacillus (ranged from 0.28 to 49.96%, average 24.56 ± 24.86%) and the increase of Clostridium (ranged from 12.50 to 86.08%, average 34.35 ± 44.98%). Likewise, Supplementary Figure S4B illustrates that while Amp by muscle injection had mild impact on gut microbiota by retained the dominance of Firmicutes at the phylum level, within Firmicutes the reduction of Lactobacillus (from 98.27 to 16.42% in chicken 1, from 42.53 to 1.38% in chicken 2) was accompanied by the rise of Clostridium (from 0.09% to 9.13% in chicken 1, and from 3.43% to 26.06% in chicken 2) in 2 of the 3 subjects.
Without prior seeding of the blaCMY–2+ E. coli marker strains, the dominance of Firmicutes (from 84.82 ± 23.49% on D20, to 57.00 ± 48.89% on D25) was retained in chickens that received oral Amp treatment, but the treatment triggered the increase of Proteobacteria 14.22 ± 24.21% on D20, to 60.67 ± 38.22% on D25, largely due to the rise of Klebsiella and Escherichia/Shigella in the phylum, as well as the decrease of Lactobacillus (from 66.27 ± 29.80% on D20, to 4.64 ± 6.46% on D25) and the rise of Clostridium (up to 24.13%), Enterococcus (up to 48.09%), etc. in Firmicutes (Supplementary Figures S4C, S5). Likewise, an even milder impact was observed in non-seeded chickens that received Amp by muscle injection (Supplementary Figure S4D).
Enhanced Impact of Drug Administration Associated With Oral/Environmental Microbial Exposure
As illustrated above, chickens seeded with the blaCMY–2+ E. coli marker strains prior to antibiotic treatment exhibited more profound impact on gut microbiota dysbiosis by drug administration routes than control chickens without seeding. In the last round of the validation study, the experiment was housed in the vacated OARDC turkey facility instead of the chicken facility. As illustrated in Supplementary Figure S6E, at D25, even the fecal microbiota of control chickens that received neither seeding of the marker E. coli nor Amp treatment substantially differed from the normal fecal microbiota presented in Supplementary Figures S3, S4. Although Firmicutes remained dominant (69.31 ± 21.84%), Clostridium (up to 46.25%), Enterococcus (up to 88.32%) etc. represented the main subpopulation within the phylum instead of Lactobacillus (Supplementary Figure S6E). Oral Amp led to absolute dominance of Proteobacteria in (i) all three representative chickens seeded with the E. coli marker strains, with 77, 95, and 99% of the population being Escherichia/Shigella (Supplementary Figure S6A); and (ii) all three illustrated chickens without E. coli seeding, but with 96 and 73% Escherichia/Shigella and 99% Enterobacteriaceae in the respective subjects (Supplementary Figure S6C). Amp by muscle injection led to the dominance of Proteobacteria in all three representative chickens seeded with the E. coli marker strains, but only with 23, 26, and 60% of Escherichia/Shigella in each subject, respectively (Supplementary Figure S6B); and 19, 3, and 68% of Escherichia/Shigella in chickens without seeding of the E. coli marker strains (Supplementary Figure S6D).
Discussion, Conclusion, and Perspectives
Despite selective pressure facilitating the expansion of AR, the application of antibiotics is still essential for disease treatment and prevention in both human and food-producing animals. The issue of how to properly address the need to use antibiotics while staving off resistance has been a conundrum for decades. Increasing evidence in the past decade on the correlation between disrupted gut microbiota and non-communicable diseases (Blaser, 2016) as well as host immune functions (Gopalakrishnan et al., 2018; Dhakal et al., 2019) has raised further concerns on the application of antibiotics beyond AR.
It is encouraging that effective reduction of fecal AR and gut microbial disruption as a result of shifting drug administration from oral to injection, exemplified by Amp, tetracycline and vancomycin, has now been illustrated in mice by multiple teams (Zhang et al., 2013; Isaac et al., 2017). Combined with using drugs with reduced impacts on host gut microbiota, this advancement represents a novel plausible direction for mitigating AR while combating gut microbiota disruption and protecting host health. This advancement is further supported by a range of clinical evidence. For instance, vancomycin was marketed in the late 1960s, initially by injection. Oral vancomycin was introduced in the U.S. around 1985, and vancomycin resistant enterococci (VRE) began to surge in the early 1990s. However, despite heavy vancomycin usage at the University of California San Francisco medical center, Luber et al. (1996) reported that the incidences of VRE were extremely low in their facility, as the drug had been primarily delivered by intravenous injection and the use of oral vancomycin was strictly limited. Furthermore, although vancomycin has been used in China since the 1970s, and the total utility of vancomycin-related products in China by 2006 was already around 20% of the vancomycin produced worldwide (China Data Center for Food and Drug Administration, 2008), the prevalence of VRE in China by 2017 was still less than 2% in clinical isolates (Huang et al., 2019). In comparison, the prevalence of VRE in the U.S. was around 30% in 2013 (Faron et al., 2016). While oral vancomycin is still unavailable in China, it has been a recommended treatment option for Clostridium difficile infections in the U.S. Morjaria et al. (2019) further illustrated that although a number of antibiotics, including oral vancomycin treatment, induced loss of obligate anaerobic bacteria in gut microbiota of patients, vancomycin by intravenous injection had little impact.
Despite the aforementioned evidence, further demonstration of the broad impact of antibiotic administration route on hosts in conventional settings is essential to translate laboratory findings and clinical observations into practical solutions. This study assessed the impact of drug administration routes using poultry raised in a caged production system. Benefits include controllable risk factors, sufficient numbers of subjects for repeatability, and a range of diversity among individuals. ESBL E. coli isolates were examined in the study because β-lactam antibiotics (e.g., penicillin, Amp, and cephalosporin) have been used in the poultry industry to treat or prevent infections by Gram-positive bacteria (Commission of Chinese Veterinary Pharmacopoeia, 2010; Roth et al., 2019). ESBL/AmpC Enterobacteriaceae is now prevalent in poultry production systems even without antibiotic applications (Baron et al., 2018; Daehre et al., 2018a; Apostolakos et al., 2019). Among the different types of ESBL-/AmpC-producing Enterobacteriaceae found in poultry, E. coli harboring the blaCMY–2 gene was frequently detected (Daehre et al., 2018b; Apostolakos et al., 2019; Seo et al., 2019). Despite of its prevalence, the relatively low abundance of blaCMY–2 in poultry made it a practical target for the intended assessment.
Data from this study clearly illustrated the critical impact of drug administration routes on gut resistome and microbiota in hosts. Compared to the up to 5-log reduction of the fecal AR gene pool observed in the mouse model (Zhang et al., 2013), the impact of changing Amp administration route from oral to injection on the blaCMY–2 gene pool itself, assessed by real-time PCR, was insignificant. However, the changes in resistome were still evident. The increase of multidrug-resistance genes and Ampr genes by Amp-PO was especially more palpable than those by Amp-IM. This finding could be primarily due to resistant bacteria with multidrug resistance and Ampr genes beyond blaCMY–2 already being abundant in the ecosystem and hosts, as detected in the natural gut microbiota of young chicks without experimental manipulation. Thus, there was a limited niche and advantage in the gut for the seeded blaCMY–2+ E. coli marker strains to rise. The structural difference between birds (urine and feces both excreted through the cloaca) and mammals (excretion through urinary and GI tracts) might have also contributed to the reduced difference in fecal AR gene pools between the two drug administration routes. Regardless, resistome data still clearly illustrated that oral Amp administration had larger impact than injection on related multidrug-resistance and Amp resistance-determining genes. The changes in other AR genes likely were due to indirect co-selection of multidrug-resistant bacteria, as well as the reduction of Amp-susceptible bacteria that happened to carry other AR genes, instead of the direct selective impact by Amp.
The impact of drug administration routes was most prominent on gut microbiota disruption. Amp administration, especially by oral delivery, flipped the profile from Firmicutes-occupied to dominance by Proteobacteria, and significantly reduced Lactobacillus, along with an increase of Enterococcus, Clostridium in Firmicutes, and the surge of Escherichia/Shigella, and Klebsiella etc. in Proteobacteria. It is particularly worth mentioning that many of the increased subpopulations belong to opportunistic pathogens. This finding is critically important because the impact of drug administration route on the surge of opportunistic pathogens in gut microbiota is likely also applicable to people receiving drug treatment. The accumulation of AR bacteria and opportunistic pathogens in human and animal guts, and their subsequent dissemination through feces, have significant public health implications.
Results from this study further illustrated the critical contribution of the original host gut microbiota profile to the outcome of gut microbiota disruption during antibiotic treatment. Gut microbiota disruption was much more obvious in chickens seeded with the Ampr E. coli marker strains than in control chickens without prior inoculation. This finding was true for Amp by both oral and injection administration (Supplementary Figures S4, S6). The microbiota disruption was more extreme in chickens raised in the turkey facility than those raised in the poultry facility because the chickens in the turkey facility already had an AR-rich gut microbiota, likely due to increased exposure in the less sanitized environment. This finding is also consistent with a previous report using lab mice from controlled animal facility with enhanced sanitation condition (Zhang et al., 2013). Without prior seeding of the AR bacteria, targeted AR genes were not observed even after 5 days of Amp by oral or injection. Furthermore, the integrity of the gut microbiota of the experimental mice that received Amp by injection was retained, similar to the control mice with no antibiotic treatment.
This consistent finding in multiple host models (poultry and mice) has further implications for human medicine and food animal production beyond drug administration. With the intention to treat various diseases or to establish healthy host immune functions, microbiota transplantation has become a popular medical practice in recent years. Similar practices are currently being examined in food animal production. But data from this study support a recent warning by the FDA (DeFilipp et al., 2019; U.S. Food and Drug Administration, 2019). Without proper screening of AR and other risk factors in donor microbiota, introducing and establishing microbiota in recipients (human or animals) through transplantation or environmental exposure may expose them to potential, unintended long-term health risks (Liu and Wang, 2020). Therefore, developing strategies to minimize unnecessary loss of healthy gut microbiota, when possible, becomes especially important.
While muscle injection used to be the mainstream practice in human medicine, individual injection by veterinarian(s) may be impractical in intensive food animal production operations. However, demonstrating the impact of drug administration routes in food animals lays a solid scientific foundation, and motivates further innovations in drug delivery targeted for industrial applications. It is further worth mentioning that over 30 antibiotics used in humans have injectable counterparts, covering almost all types of antibiotics. Besides searching for new antibiotics with preferred pharmacological properties for human and animal applications, it may be productive to re-evaluate existing antibiotics, considering both their oral and injectable forms. A more thorough understanding of their intended and unintended impacts on gut microbiota can direct exploration of derivatives of existing antibiotics, filtered for aimed features. First, however, targeted strategies for intended mitigation, like changing drug administration routes and using drugs with reduced gut microbiome impact, need to be clearly spelled out and disseminated to protect health, lives, and the industry.
Data Availability Statement
The datasets generated in this study including the metagenomic sequencing and 16S amplicon sequencing data protocol are available under the accession number PRJNA601052 at the Sequence Read Archive.
Ethics Statement
The animal study was reviewed and approved by The Ohio State University IACUC committee.
Author Contributions
HW designed and supervised the study, received the grants, and responsible for the overall manuscript preparation. YZ conducted most of the experiment, data analysis and wrote the draft of the manuscript. LZ, YL, YH, HY, L-JW, and HA participated in the animal experiment. LZ, ZW, and HY participated in the data analysis. JZ was co-PI of the GII grant and assisted with the study design. All authors have read and approved the submitted version.
Funding
The study was supported by Pew Foundation, US-UK Global Innovative Initiative and OSU TCO Accelerator Award grants for HW, and CSC scholarship for YZ and YH.
Conflict of Interest
The authors declare that the research was conducted in the absence of any commercial or financial relationships that could be construed as a potential conflict of interest.
Acknowledgments
We thank Dr. Michael Lilburn from Department of Animal Science and the OSU poultry facility for their help on setting up the poultry study.
Supplementary Material
The Supplementary Material for this article can be found online at: https://www.frontiersin.org/articles/10.3389/fmicb.2020.01319/full#supplementary-material
FIGURE S1 | Experimental flow chart.
FIGURE S2 | Profiles of pooled microbiota and composition of Enterobacteriaceae at D20 before Amp treatment. Inoculation of Ampr E. coli had little impact on the average microbiota profile of chicken feces. Escherichia/Shigella was the major population in Enterobacteriaceae, with low abundance of Klebsielar, Providencia, Enterobacter and other species. (A) Inoculated; (B) non-inoculated.
FIGURE S3 | Representative microbiota profiles of individual chickens at D20 before Amp treatment. (A) Amp-PO; (B) Amp-IM; (C) NI-Amp-PO; (D) NI-Amp-IM. Each chat represents fecal microbiota profile of one chicken.
FIGURE S4 | Representative microbiota profiles of individual chickens at D25 after Amp treatment. (A) Amp-PO; (B) Amp-IM; (C) NI-Amp-PO; (D) NI-Amp-IM. Each chat represents fecal microbiota profile of one chicken.
FIGURE S5 | The dominance of other Enteribacteriaceae in NI-Amp-OP group at D25 after Amp tratment. Each chat represents fecal microbiota profile of one chicken.
FIGURE S6 | Representative profiles of fecal microbiota at D25 after Amp treatment∗. (A) Amp-PO; (B) Amp-IM; (C) NI-Amp-PO; (D) NI-Amp-IM; (E) Control. Each chat represents fecal microbiota profile of one chicken. ∗Chickens were raised at the turkey teaching farm.
TABLE S1 | Composition of chicken feed (P10109 standard diet).
TABLE S2 | Abundance of antibiotic-resistance gene types in fecal microbiota of experimental chickens.
TABLE S3 | Abundance of antibiotic-resistance genes in fecal microbiota of experimental chickens.
Footnotes
References
Allen, H. K., Donato, J., Wang, H. H., Cloud-Hansen, K. A., Davies, J., and Handelsman, J. (2010). Call of the wild: antibiotic resistance genes in natural environments. Nat. Rev. Microbiol. 8, 251–259. doi: 10.1038/nrmicro2312
Andersson, D. I., and Hughes, D. (2011). Persistence of antibiotic resistance in bacterial populations. FEMS Microbiol. Rev. 35, 901–911. doi: 10.1111/j.1574-6976.2011.00289.x
Apostolakos, I., Mughini-Gras, L., Fasolato, L., and Piccirillo, A. (2019). Assessing the occurrence and transfer dynamics of ESBL/pAmpC-producing Escherichia coli across the broiler production pyramid. PLoS One 14:e0217174. doi: 10.1371/journal.pone.0217174
Arango-Argoty, G., Garner, E., Prudent, A., Heath, L. S., Vikesland, P., and Zhang, L. Q. (2018). DeepARG: a deep learning approach for predicting antibiotic resistance genes from metagenomic data. Microbiome 6:23. doi: 10.1186/s40168-018-0401-z
Bakkeren, E., Huisman, J. S., Fattinger, S. A., Hausmann, A., Furter, M., Egli, A., et al. (2019). Salmonella persisters promote the spread of antibiotic resistance plasmids in the gut. Nature 573, 276–280.
Baron, S., Le Devendec, L., Touzain, F., Jouy, E., Lucas, P., de Boisseson, C., et al. (2018). Longitudinal study of Escherichia coli plasmid resistance to extended-spectrum cephalosporins in free-range broilers. Vet. Microbiol. 216, 20–24. doi: 10.1016/j.vetmic.2018.01.012
Blaser, M. J. (2016). Antibiotic use and its consequences for the normal microbiome. Science 352, 544–545. doi: 10.1126/science.aad9358
Borgen, K., Simonsen, G., Sundsfjord, A., Wasteson, Y., Olsvik, Ø., and Kruse, H. (2000). Continuing high prevalence of VanA-type vancomycin-resistant enterococci on Norwegian poultry farms three years after avoparcin was banned. J. Appl. Microbiol. 89, 478–485. doi: 10.1046/j.1365-2672.2000.01137.x
Borges, C. A., Tarlton, N. J., and Riley, L. W. (2019). Escherichia coli from commercial broiler and backyard chickens share sequence types, antimicrobial resistance profiles, and resistance genes with human extraintestinal pathogenic Escherichia coli. Foodborne Pathog. Dis. 16, 813–822. doi: 10.1089/fpd.2019.2680
Casewell, M., Friis, C., Marco, E., McMullin, P., and Phillips, I. (2003). The European ban on growth-promoting antibiotics and emerging consequences for human and animal health. J. Antimicrob. Chemother. 52, 159–161. doi: 10.1093/jac/dkg313
Chee-Sanford, J. C., Aminov, R. I., Krapac, I. J., Garrigues-Jeanjean, N., and Mackie, R. I. (2001). Occurrence and diversity of tetracycline resistance genes in lagoons and groundwater underlying two swine production facilities. Appl. Environ. Microbiol. 67, 1494–1502. doi: 10.1128/AEM.67.4.1494-1502.2001
 30
30 .
.  2020, 32–33.
Commission of Chinese Veterinary Pharmacopoeia (2010).  (Veterinary Pharmacopoeia of the People’s Republic of China:Application Guidance for Veterinary Drugs). China: China Agricultural Press.
Daehre, K., Projahn, M., Friese, A., Semmler, T., Guenther, S., and Roesler, U. H. (2018a). ESBL-Producing Klebsiella pneumoniae in the Broiler Production Chain and the First Description of ST3128. Front. Microbiol. 9:2302. doi: 10.3389/fmicb.2018.02302
Daehre, K., Projahn, M., Semmler, T., Roesler, U., and Friese, A. (2018b). Extended-Spectrum Beta-Lactamase-/AmpC Beta-Lactamase-Producing Enterobacteriaceae in Broiler Farms: Transmission Dynamics at Farm Level. Microb. Drug Resist. 24, 511–518. doi: 10.1089/mdr.2017.0150
DeFilipp, Z., Bloom, P. P., Torres Soto, M., Mansour, M. K., Sater, M. R. A., Huntley, M. H., et al. (2019). Drug-resistant E. coli bacteremia transmitted by fecal microbiota transplant. N. Engl. J. Med. 381, 2043–2050. doi: 10.1056/NEJMoa1910437
Dhakal, S., Wang, L., Antony, L., Rank, J., Bernardo, P., Ghimire, S., et al. (2019). Amish (Rural) vs. non-Amish (Urban) infant fecal microbiotas are highly diverse and their transplantation lead to differences in mucosal immune maturation in a humanized germfree piglet model. Front. Immunol. 10:1509. doi: 10.3389/fimmu.2019.01509
Donoghue, D. J., Hairston, H., Gaines, S. A., Bartholomew, M. J., and Donoghue, A. M. (1996). Modeling residue uptake by eggs. 1. Similar drug residue patterns in developing yolks following injection with ampicillin or oxytetracycline. Poult Sci. 75, 321–328. doi: 10.3382/ps.0750321
Doyle, M. P., Busta, F., Cords, B. R., Davidson, P. M., Hawke, J., Hurd, H. S., et al. (2006). Antimicrobial resistance: implications for the food system: an expert report, funded by the IFT foundation. Compr. Rev. Food Sci. Food Saf. 5, 71–137. doi: 10.1111/j.1541-4337.2006.00004.x
Faron, M. L., Ledeboer, N. A., and Buchan, B. W. (2016). Resistance mechanisms, epidemiology, and approaches to screening for vancomycin-resistant enterococcus in the health care setting. J. Clin. Microbiol. 54, 2436–2447. doi: 10.1128/JCM.00211-16
Food and Agriculture Organization of the United Nation (2019). 2019 Food Outlook-Biannual Report on Global Food Markets Rome: Food and Aagriculture Organization of the United Nation. Paris: FAO.
Founou, L. L., Founou, R. C., and Essack, S. Y. (2016). Antibiotic resistance in the food chain: a developing country-perspective. Front. Microbiol. 7:1881. doi: 10.3389/fmicb.2016.01881
Gopalakrishnan, V., Spencer, C. N., Nezi, L., Reuben, A., Andrews, M. C., Karpinets, T. V., et al. (2018). Gut microbiome modulates response to anti-PD-1 immunotherapy in melanoma patients. Science 359, 97–103. doi: 10.1126/science.aan4236
Harms, A., Maisonneuve, E., and Gerdes, K. (2016). Mechanisms of bacterial persistence during stress and antibiotic exposure. Science 354:aaf4268. doi: 10.1126/science.aaf4268
Huang, L., Zhang, R., Hu, Y., Zhou, H., Cao, J., Lv, H., et al. (2019). Epidemiology and risk factors of methicillin-resistant Staphylococcus aureus and vancomycin-resistant enterococci infections in Zhejiang China from 2015 to 2017. Antimicrob. Resist. Infect. Control. 8:90. doi: 10.1186/s13756-019-0539-x
Isaac, S., Scher, J. U., Djukovic, A., Jimenez, N., Littman, D. R., Abramson, S. B., et al. (2017). Short- and long-term effects of oral vancomycin on the human intestinal microbiota. J. Antimicrob. Chemother. 72, 128–136. doi: 10.1093/jac/dkw383
Johnsen, P. J., Osterhus, J. I., Sletvold, H., Sorum, M., Kruse, H., Nielsen, K., et al. (2005). Persistence of animal and human glycopeptide-resistant enterococci on two Norwegian poultry farms formerly exposed to avoparcin is associated with a widespread plasmid-mediated vanA element within a polyclonal enterococcus faecium population. Appl. Environ. Microbiol. 71, 159–168. doi: 10.1128/AEM.71.1.159-168.2005
Knudsen, P. K., Gammelsrud, K. W., Alfsnes, K., Steinbakk, M., Abrahamsen, T. G., Muller, F., et al. (2018). Transfer of a bla CTX-M-1-carrying plasmid between different Escherichia coli strains within the human gut explored by whole genome sequencing analyses. Sci. Rep. 8:280. doi: 10.1038/s41598-017-18659-2
Levy, S. B. (1978). Emergence of antibiotic-resistant bacteria in the intestinal flora of farm inhabitants. J. Infect. Dis. 137, 689–690.
Levy, S. B., FitzGerald, G. B., and Macone, A. B. (1976). Changes in intestinal flora of farm personnel after introduction of a tetracycline-supplemented feed on a farm. N. Engl. J. Med. 295, 583–588. doi: 10.1056/NEJM197609092951103
Li, X., Li, Y., Alvarez, V., Harper, W. J., and Wang, H. H. (2011). Effective antibiotic resistance mitigation during cheese fermentation. Appl. Environ. Microbiol. 77, 7171–7175. doi: 10.1128/AEM.05069-11
Li, X. J., and Wang, H. H. (2010). Tetracycline resistance associated with commensal bacteria from representative ready-to-consume deli and restaurant foods. J. Food Prot. 73, 1841–1848. doi: 10.4315/0362-028x-73.10.1841
Liu, H., and Wang, H. H. (2020). Impact of microbiota transplant on resistome of gut microbiota in gnotobiotic piglets and human subjects. Front. Microbiol. 11:932. doi: 10.3389/fmicb.2020.00932
Luber, A. D., Jacobs, R. A., Jordan, M., and Guglielmo, B. J. (1996). Relative importance of oral versus intravenous vancomycin exposure in the development of vancomycin-resistant enterococci. J. Infect. Dis. 173, 1292–1294. doi: 10.1093/infdis/173.5.1292
Manuzon, M. Y., Hanna, S. E., Luo, H., Yu, Z., Harper, W. J., and Wang, H. H. (2007). Quantitative assessment of the tetracycline resistance gene pool in cheese samples by real-time TaqMan PCR. Appl. Environ. Microbiol. 73, 1676–1677. doi: 10.1128/AEM.01994-06
McDevitt, R., Brooker, J., Acamovic, T., and Sparks, N. (2006). Necrotic enteritis; a continuing challenge for the poultry industry. World’s Poultry Sci. J. 62, 221–247.
Moritz, E. M., and Hergenrother, P. J. (2007). Toxin-antitoxin systems are ubiquitous and plasmid-encoded in vancomycin-resistant enterococci. Proc. Natl. Acad. Sci. U.S.A. 104, 311–316. doi: 10.1073/pnas.0601168104
Morjaria, S., Schluter, J., Taylor, B. P., Littmann, E. R., Carter, R. A., Fontana, E., et al. (2019). Antibiotic-induced shifts in fecal microbiota density and composition during hematopoietic stem cell transplantation. Infect. Immun. 87:e00206-19. doi: 10.1128/IAI.00206-19
Muyzer, G., de Waal, E. C., and Uitterlinden, A. G. (1993). Profiling of complex microbial populations by denaturing gradient gel electrophoresis analysis of polymerase chain reaction-amplified genes coding for 16S rRNA. Appl. Environ. Microbiol. 59, 695–700. doi: 10.1128/aem.59.3.695-700.1993
Nadkarni, M. A., Martin, F. E., Jacques, N. A., and Hunter, N. (2002). Determination of bacterial load by real-time PCR using a broad-range (universal) probe and primers set. Microbiology-Sgm 148, 257–266. doi: 10.1099/00221287-148-1-257
Nandi, S., Maurer, J. J., Hofacre, C., and Summers, A. O. (2004). Gram-positive bacteria are a major reservoir of Class 1 antibiotic resistance integrons in poultry litter. Proc. Natl. Acad. Sci. U.S.A. 101, 7118–7122. doi: 10.1073/pnas.0306466101
Ondov, B. D., Bergman, N. H., and Phillippy, A. M. (2011). Interactive metagenomic visualization in a Web browser. BMC Bioinformatics 12:385. doi: 10.1186/1471-2105-12-385
Roth, N., Kasbohrer, A., Mayrhofer, S., Zitz, U., Hofacre, C., and Domig, K. J. (2019). The application of antibiotics in broiler production and the resulting antibiotic resistance in Escherichia coli: a global overview. Poult. Sci. 98, 1791–1804. doi: 10.3382/ps/pey539
Salyers, A. A., Gupta, A., and Wang, Y. (2004). Human intestinal bacteria as reservoirs for antibiotic resistance genes. Trends Microbiol. 12, 412–416. doi: 10.1016/j.tim.2004.07.004
Seo, K. W., Shim, J. B., and Lee, Y. J. (2019). Emergence of CMY-2-Producing Escherichia coli in Korean Layer Parent Stock. Microb. Drug Resist. 25, 462–468. doi: 10.1089/mdr.2018.0254
Singh, N. K., Wood, J. M., Karouia, F., and Venkateswaran, K. (2018). Succession and persistence of microbial communities and antimicrobial resistance genes associated with International Space Station environmental surfaces. Microbiome 6:204. doi: 10.1186/s40168-018-0585-2
Sorum, M., Johnsen, P. J., Aasnes, B., Rosvoll, T., Kruse, H., Sundsfjord, A., et al. (2006). Prevalence, persistence, and molecular characterization of glycopeptide-resistant enterococci in Norwegian poultry and poultry farmers 3 to 8 years after the ban on avoparcin. Appl. Environ. Microbiol. 72, 516–521. doi: 10.1128/AEM.72.1.516-521.2006
U.S. Food and Drug Administration (2018). Summary Report On Antimicrobials Sold or Distributed for Use in Food-Producing Animals, ed. C. F. V. Medicine (Paris: US Food & Drug Administration).
U.S. Food and Drug Administration (2019). Important Safety Alert Regarding Use of Fecal Microbiota for Transplantation and Risk of Serious Adverse Reactions Due to Transmission of Multi-Drug Resistant Organisms [Online]. Paris: FAO.
Wang, H. H. (2010). Antibiotic resistance mitigation: a complicated issue begging for targeted investigation. Microbe 5, 504–505.
Wang, H. H., Manuzon, M., Lehman, M., Wan, K., Luo, H., Wittum, T. E., et al. (2006). Food commensal microbes as a potentially important avenue in transmitting antibiotic resistance genes. FEMS Microbiol. Lett. 254, 226–231. doi: 10.1111/j.1574-6968.2005.00030.x
Wei, S., Morrison, M., and Yu, Z. (2013). Bacterial census of poultry intestinal microbiome. Poult. Sci. 92, 671–683. doi: 10.3382/ps.2012-02822
Yu, Z., and Morrison, M. (2004). Improved extraction of PCR-quality community DNA from digesta and fecal samples. Biotechniques 36, 808–812. doi: 10.2144/04365ST04
Yurack, J. A. (1964). Resistance of Salmonellae Isolated in 1962 to Tetracycline. Chloramphenicol, and Ampicillin. Can. J. Microbiol. 10, 521–526. doi: 10.1139/m64-065
Zhang, L., Huang, Y., Zhou, Y., Buckley, T., and Wang, H. H. (2013). Antibiotic administration routes significantly influence the levels of antibiotic resistance in gut microbiota. Antimicrob. Agents Chemother. 57, 3659–3666. doi: 10.1128/AAC.00670-13
Zhang, L., Kinkelaar, D., Huang, Y., Li, Y. L., Li, X. J., and Wang, H. H. (2011). Acquired antibiotic resistance: are we born with it? Appl. Environ. Microbiol. 77, 7134–7141. doi: 10.1128/aem.05087-11
Keywords: antibiotic, administration routes, oral, injection, poultry, resistome, gut microbiota, opportunistic pathogens
Citation: Zhou Y, Li Y, Zhang L, Wu Z, Huang Y, Yan H, Zhong J, Wang L-J, Abdullah HM and Wang HH (2020) Antibiotic Administration Routes and Oral Exposure to Antibiotic Resistant Bacteria as Key Drivers for Gut Microbiota Disruption and Resistome in Poultry. Front. Microbiol. 11:1319. doi: 10.3389/fmicb.2020.01319
Received: 19 January 2020; Accepted: 25 May 2020;
Published: 07 July 2020.
Edited by:
Ludmila Chistoserdova, University of Washington, United StatesReviewed by:
Douglas Ruben Call, Washington State University, United StatesAtin Datta, United States Food and Drug Administration, United States
Copyright © 2020 Zhou, Li, Zhang, Wu, Huang, Yan, Zhong, Wang, Abdullah and Wang. This is an open-access article distributed under the terms of the Creative Commons Attribution License (CC BY). The use, distribution or reproduction in other forums is permitted, provided the original author(s) and the copyright owner(s) are credited and that the original publication in this journal is cited, in accordance with accepted academic practice. No use, distribution or reproduction is permitted which does not comply with these terms.
*Correspondence: Hua H. Wang, wang.707@osu.edu
†Present address: Yang Zhou, State Key Laboratory of Genetic Engineering, Department of Infectious Diseases, HuaShan Hospital, School of Life Sciences, Fudan University, Shanghai, China; Li-Ju Wang, School of Mechanical and Materials Engineering, Washington State University, Pullman, WA, United States