 Long Zhang1,2,3
 Zhan-ying Liu
- 1Inner Mongolia Energy Conservation and Emission Reduction Engineering Technology Research Center for Fermentation Industry, Hohhot, Inner Mongolia, China
- 2Engineering Research Center of Inner Mongolia for Green Manufacturing in Bio-fermentation Industry, Hohhot, Inner Mongolia, China
- 3College of Chemical Engineering, Inner Mongolia University of Technology, Hohhot, Inner Mongolia, China
We subjected the components of the glycolysis and energy metabolism pathways of Rhodobacter sphaeroides (R. sphaeroides) to metabolic engineering to improve the titer and yield of coenzyme Q10 (CoQ10). Phosphofructokinase (PFK), cyclic adenylate-dependent protein kinase (PKAC), glyceraldehyde-3-phosphate dehydrogenase (GAPDH), and adenosine triphosphate hydrolase (KdpC) were overexpressed in R. sphaeroides VK-2-3 (VK-2-3). The strains were labeled R. sphaeroides PFK (RS.PFK), RS.PKAC, RS.PFK–PKAC, RS.KdpC, RS.GAPDH, and RS.KdpC–GAPDH. Results showed that the CoQ10 titers of RS.PFK, RS.PKAC, and RS.PFK–PKAC were 300.96 ± 0.87, 405.94 ± 4.77, and 379.94 ± 0.42 mg/l, respectively. The CoQ10 titers of RS.PFK and VK-2-3 were not significantly different; however, those for RS.PKAC and RS.PFK–PKAC were 13 and 6% higher than that of VK-2-3, respectively. Further, the titers of RS.KdpC, RS.GAPDH, and RS.KdpC–GAPDH were 360.17 ± 0.39, 409.79 ± 0.76, and 359.87 ± 1.14 mg/l, respectively. The titers of RS.KdpC and RS.KdpC–GAPDH were not significantly different from that for VK-2-3, whereas that for RS.GAPDH was 14% higher than that of VK-2-3. Finally, when the cultures of RS.GAPDH and VK-2-3 were scaled up in 5-L fermenters, the CoQ10 titers and RS.GAPDH yields increased by 44.3 and 37.8%, respectively, compared with VK-2-3.To the best of our knowledge, the glycolysis pathway of R. sphaeroides was studied for the first time in this study. We genetically modified the components of the energy metabolism pathway to obtain the strain with high yield of CoQ10 mutant RS.GAPDH. The findings of this study can serve as a basis for future studies involving metabolic engineering of CoQ10-producing strains.
Introduction
Coenzyme Q10 (CoQ10) acts as an electron transporter in the respiratory chain (Cluis et al., 2012) and participates in cellular biochemical reactions. CoQ10 is widely used in cosmetics, food additives, and health products (Littarru and Tiano, 2010; Brandmeyer et al., 2014; Campagnolo et al., 2017; Hernández-Camacho et al., 2018). The primary method of CoQ10 production is microbial fermentation by bacterial strains such as Rhodopseudomonas copsulata (Meganathan, 2001), Agrobacterium tumefaciens (Choi et al., 2005), and Rhodobacter sphaeroides (R. sphaeroides; Yoshida et al., 1998). R. sphaeroides is widely used in CoQ10 production. Ya (2010), Chen (2016), and Qian (2016) have previously applied physical and chemical mutagenesis in R. sphaeroides to improve the titers and yield of CoQ10. Wang et al. (2021) attempted iterative mutagenesis through room-temperature plasma treatment to increase the production of CoQ10 in R. sphaeroides. After two rounds of mutagenesis screening, a mutant strain, RS 17, exhibited an 80.37% increase in CoQ10 titers compared with the control. Zou et al. (2019) used atmospheric and room temperature plasma for mutagenesis of R. sphaeroides combined with vitamin K3 resistance screening to obtain a mutant, AR01. After 100 h of fermentation, the CoQ10 titer of AR01 was 590 mg/l, which is 25.5% higher than that of the parental strain. However, random mutation breeding has the disadvantages of requiring heavy labor, being tedious, and introducing unwanted genetic changes.
With the rapid development of molecular biology techniques and in-depth understanding of the CoQ10 synthetic pathway, rational genetic engineering was applied to induce targeted regulation (Davies and Brindle, 1992; Kolkman and Stemmer, 2001; Nielsen and Olsson, 2002; Liu et al., 2013; Lv et al., 2014) and modification (Scalcinati et al., 2012; Lu et al., 2014, 2015; Zhu et al., 2017; Tsuge et al., 2019) in cells to precisely regulate the metabolic pathway and obtain strains producing high-yield target products. For instance, Zhu (2017) induced the overexpression of glyceraldehyde-3-phosphate dehydrogenase (GAPDH) and inhibited carotenoid synthesis pathway to achieve CoQ10 production in R. sphaeroides of up to 63.7 mg/l, which was 27.8% higher than the control. Based on the literature, modifications in CoQ10 production by R. sphaeroides focus on quinone ring synthesis, quinone ring modification, and side-chain synthesis pathways (Lu et al., 2014, 2015).
The precursor for CoQ10 synthesis is derived from glycolysis, and phosphofructokinase (PFK) is the rate-limiting enzyme in the pathway. In addition, cyclic adenylate-dependent protein kinase (PKAC) can be used as a cofactor for CoQ10 synthesis (Figure 1). Moreover, as an electron transporter in the respiratory chain, CoQ10 is crucial for energy conversion. GAPDH and adenosine triphosphate hydrolase (KdpC) are associated with energy conversion; however, the mechanisms of these components have rarely been investigated. Therefore, in this study, the essential genes of the CoQ10 synthesis pathway in R. sphaeroides were subjected to metabolic regulation regarding glycolysis and energy conversion to enhance CoQ10 production. Finally, the engineered strain producing strains with high yield of CoQ10 was expanded in a bioreactor. This study aimed to provide a novel method for applying metabolic engineering to CoQ10 production.
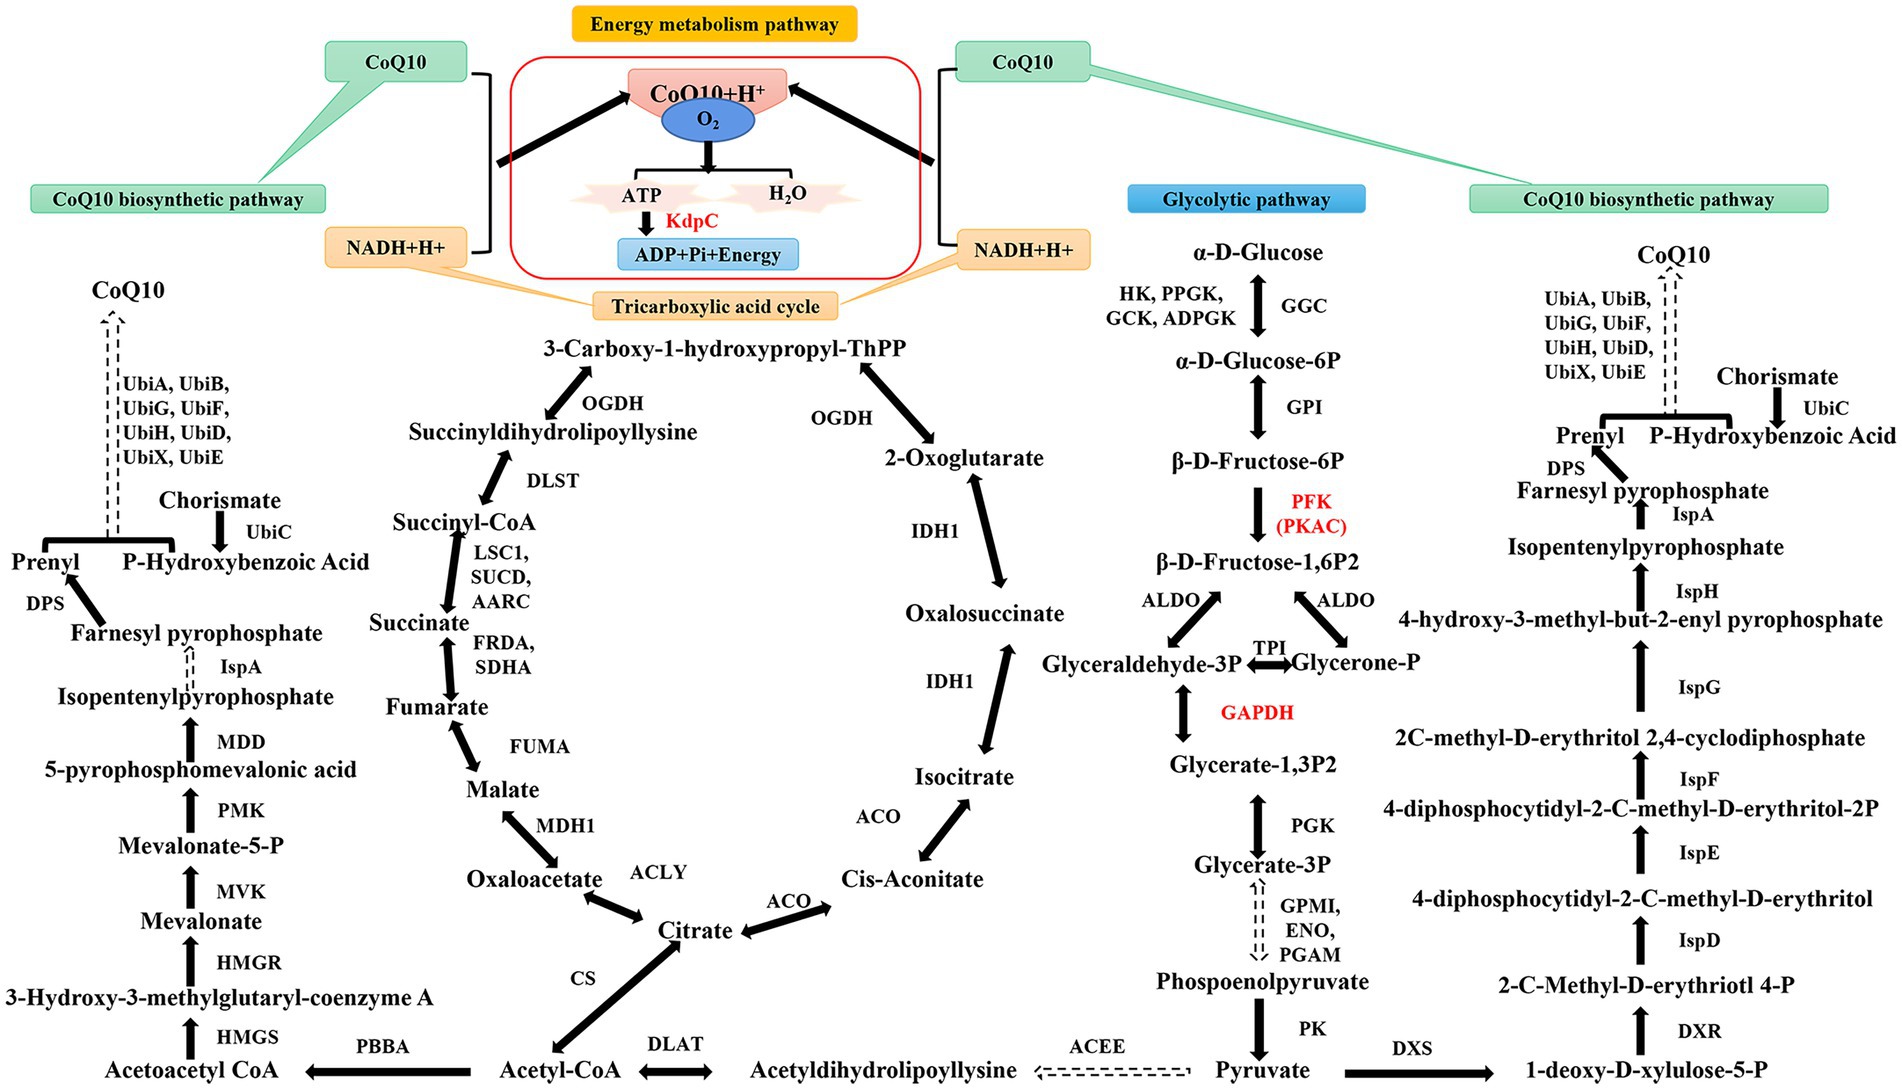
Figure 1. Simplified diagram of glycolysis, tricarboxylic acid cycle, and the coenzyme Q10 (CoQ10) synthesis pathway. HK, hexokinase; PPGK, polyphosphate glucokinase; GCK, glucokinase; ADPGK, ADP-dependent glucokinase; P, phosphate; GPI, glucose-6-phosphate isomerase; ALDO, fructose-bisphosphate aldolase; PGK, phosphoglycerate kinase; PGAM, 2,3-bisphosphoglycerate-dependent phosphoglycerate mutase; GPMI, 2,3-bisphosphoglycerate-independent phosphoglycerate mutase; ENO, enolase; PK, pyruvate kinase; ACEE, pyruvate dehydrogenase E1 component; DLAT, pyruvate dehydrogenase E2 component; CS, citrate synthase; ACLY, ATP citrate; MDH1, malate dehydrogenase; FUMA, fumarate hydratase; FRDA, fumarate reductase flavoprotein subunit; SDHA, succinate dehydrogenase flavoprotein subunit; LSC1, succinyl-CoA synthetase alpha subunit; SUCD, succinyl-CoA synthetase alpha subunit; AARC, succinyl-CoA: acetate CoA-transferase; DLST, 2-oxoglutarate dehydrogenase E2 component; OGDH, 2-oxoglutarate dehydrogenase E1 component; IDH1, isocitrate dehydrogenase; ACO, aconitate hydratase; PBBA, acetoactyl-CoA thiolase; HMGS, 3-Hydroxy-3-methylglutaryl-coenzyme A synthetase; HMGR, 3-Hydroxy-3-methylglutaryl-coenzyme A reductase; MVK, mevalonate kinase; PMK, phosphomevalonate kinase; MDD, mevalonate 5-pyrophosphate decarboxylase; IspA, farnesyl diphosphate synthase; DPS, isoprenyl diphpsphate synthase; UbiC, chorismate lyase; UbiA, 4-hydroxybenzoate polyprenyltransferase; UbiB, ubiquinone biosynthesis protein; UbiG, 3-demethylubiquinone-9 3-methyltransferase; UbiF, 3-demethoxyubiquinol 3-hydroxylase; UbiH, 2-octaprenyl-6-methoxyphenol hydroxylase; UbiD, 4-hydroxy-3-polyprenylbenzoate decarboxylase; UbiX, 3-octaprenyl-4-hydroxybenzoate carboxy-lyase; UbiE, demethylmenaquinone methyltransferase; DXS, 1-deoxy-D-xylulose-5-phosphate synthase; DXR, 1-deoxy-D-xylulose-5-phosphate reductoisomerase; IspD, 2-C-methyl-D-erythritol 4-phosphate cytidylyltransferase; IspE, 4-diphosphocytidyl-2-C-methyl-D-erythritol kinase; IspF, 2-C-methyl-D-erythritol 2,4-cyclodiphosphate synthase; IspG, (E)-4-hydroxy-3-methylbut-2-enyl-diphosphate synthase; IspH, 4-hydroxy-3-methylbut-2-enyl diphosphate reductase. PFK, PKAC, KdpC, GAPDH, and CoQ10 are the enzymes and metabolites of interest in this study. Solid lines indicate one-step reactions and dashed lines indicate the intermediate multi-step reactions. Two-way arrows represent reversible reactions.
Materials and methods
Strains and culture media
Escherichia coli DH5α containing pBBR1MCS-4 plasmid was cultivated at 37°C in Luria–Bertani medium (tryptone 10 g/l, yeast extract 5 g/l, and NaCl 10 g/l) supplemented with 100 μg/ml of ampicillin. R. sphaeroides VK-2-3 (VK-2-3, CCTCC M 2021735) was obtained by subjecting the original strain of R. sphaeroides (V-0) to compound mutagenesis using heavy ions and high-voltage prick electric fields. Information on strains and plasmid sources was described in detail in the Supplementary Table S4. VK-2-3 and its recombinant derivatives were cultivated in medium A containing 3 g/l glucose, 8 g/l yeast extract powder, 2 g/l NaCl, 1.3 g/l KH2PO4, 0.25 g/l MgSO4·7H2O, 20 g/l agar powder, and 1 ml/l auxiliary solution, and the pH of the medium was adjusted to 7.16 using 10% NaOH. Medium B was used for the shake-flask seed culture and contained 3 g/l glucose, 8 g/l yeast extract powder, 2 g/l NaCl, 1.3 g/l KH2PO4, 0.25 g/l MgSO4·7H2O, 0.01 g/l CoCl2·6H2O, and 1 ml/l auxiliary solution; the pH of this medium was adjusted to 7.0 using 10% NaOH. Medium C was used for the shake-flask fermentation culture and contained 35 g/l glucose, 12 g/l corn syrup powder, 3 g/l C5H8NO4Na, 3 g/l NaCl, 3 g/l (NH4)2SO4, 3 g/l KH2PO4, 12.5 g/l MgSO4·7H2O, 12 g/l CaCO3, 0.01 g/l CoCl2·6H2O, and 1 ml/l auxiliary solution; the pH of this medium was adjusted to 7.0 using 10% NaOH.
The basic medium of the fermentation tank comprised 25 g/l glucose, 6.5 g/l C5H8NO4Na, 4 g/l corn steep liquor, 4 g/l (NH4)2SO4, 4 g/l NaCl, 0.03 g/l MnSO4, 1.2 g/l KH2PO4, 0.01 g/l CoCl2·6H2O, 8 g/l MgSO4·7H2O, 0.08 g/l NaBO3·4H2O, 1.2 g/l FeSO4·7H2O, 0.05 g/l CaCl2, and 8 g/l CaCO3; the pH was adjusted to 6.5 using NH3·H2O. The supplemental medium of the fermentation tank comprised 6.5 g/l C5H8NO4Na, 4 g/l dry corn steep powder, 4 g/l (NH4)2SO4, 4 g/l NaCl, 0.03 g/l MnSO4, 0.01 g/l CoCl2·6H2O, 8 g/l MgSO4·7H2O, 1.2 g/l FeSO4·7H2O, 0.08 g/l NaBO3·4H2O, and 0.05 g/l CaCl2. The flow feeding for the fermentation tank was prepared using 2 l of 60% glucose solution, 150 ml of 7% KH2PO4 solution, 400 ml of NH3·H2O at a concentration of 25% for adjusting pH, and 40 ml of defoamer.
Target fragment amplification
Routine methods of molecular cloning, such as PCR, deoxyribonucleic acid restriction digestion, and ligation, were conducted in accordance with standard protocols. Whole genomes of V-0 (PRJNA818168) and VK-2-3 (PRJNA818446) were sequenced, and genes encoding PFK, PKAC, GAPDH, and KdpC were annotated using the online annotation service of the Kyoto Encyclopedia of Genes and Genomes Orthology database.1 PCR was performed using the VK-2-3 genome as a template to obtain the target fragment. The target fragment was recovered using an agarose gel recovery kit.
Construction of recombinant strains
The target fragment and pBBR1MCS-4 were double digested using BamHI, HindIII, and KpnI and ligated using T4 DNA ligase. The recombinant plasmids were transferred into E. coli DH5α culture, plated on ampicillin-coated (100 μg/ml) plates, and incubated at 37°C overnight. The recombinant plasmids were sequenced at Shanghai Biotech. The plasmids were transformed into VK-2-3 via electroporation for strain construction. Recombinant plasmid construction and other detailed methods are presented in Supplementary Figure S1. The sequencing results for pfk, pkac, kdpc, and gapdh correspond with sequences 1 (ON381190), 2 (ON381191), 3 (ON381192), and 4 (ON381193) in Supplementary material, respectively.
Setting fermenter parameters
The seed solution (250 ml) was inoculated into a 5-L fermenter at a 2.5-L loading volume. The fermentation temperature was set to 32°C, and the pH was adjusted to 6.7 using 25% NH3·H2O. The stirring paddle speed was set to 500 rpm, and the ventilation ratio was 1.8 vvm. Glucose concentration was controlled at 0.8–1.2% in the fermentation broth. A sugar-replenishing peristaltic pump replenished glucose every 50 s for 1 s. Glucose concentration in the fermentation broth was monitored online and manually corrected as required. The phosphate concentration in the fermentation broth was maintained at 80–120 ppm, and a phosphorus-replenishment peristaltic pump was used to replace phosphorus every 300 s for 1 s. Based on the readings, the phosphate concentration in the fermentation broth was monitored online and manually corrected as required. After the fermentation broth increased to 3.0 l, 500 ml of fermentation solution was collected from the pick-up port.
Real-time quantitative PCR analysis
RNA was extracted from the fermentation broth using the Bacteria Total RNA Isolation Kit [Sangon Biotech (Shanghai) Co., Ltd.]. Agarose gel electrophoresis and the ultramicro nucleic acid protein detector EVA3100 (Monad Biotech Co., Ltd.) were used to determine RNA quality and concentration, respectively. This RNA was used as a template and reverse transcribed to cDNA using the SYBR® Premix Ex Taq II (Takara) kit; this procedure was performed on ice. The primer sequences for the genes were synthesized by Sangon Biotech (Shanghai) Co., Ltd. (Supplementary material; Supplementary Table S1). Real-time quantitative PCR (RT-qPCR) was performed using the TB Green Premix Ex Taq II kit (Takara) with the reverse-transcribed cDNA as a template. The entire procedure was performed on ice and away from light. The following reaction system was used: In a 384-well plate, 9 μl of the premix was added to each well (5 μl of TB Green Premix Ex Taq II, 1 μl each of forward and reverse primers, 1 μl of ROX Reference Dye II, 1 μl of RNA-free water). Finally, 1 μl of cDNA was diluted to 500 ng/μL and added to the wells. Gene expression was measured using a 384-well QuantStudio 6 Flex real-time fluorescence PCR assay system. The PCR reaction system was as follows: 95°C for 30 s, followed by 40 cycles of 95°C for 3 s, 60°C for 30 s, and 72°C for 20 s in 10 μl. At the end of the experiment, the melting curve was analyzed using the default parameters and rpoZ was used for normalisation (Zhu, 2017). All analyses were repeated three times using biological replicates.
Analytical methods
Determining the growth curve
Absorbance values were measured at 600 nm from 0 to 30 h via spectrophotometry. The culture medium was diluted using sterile media to obtain an optical density (OD600) of 0.1–1.0. Finally, the true OD of the culture medium was multiplied by the dilution factor.
Determining residual glucose in the fermentation broth
The fermentation broth was centrifuged at 4200 rpm for 15 min. High-performance liquid chromatography (HPLC) was used to quantify residual glucose in the culture supernatants using the 1,290 Infinity System (Agilent Technologies, Waldbronn, Germany) equipped with the Aminex HPX-87H column (300 mm × 7.8 mm × 9 μm) and a refractive-index detector. The mobile phase comprised 5 mmol/l H2SO4 at a flow rate of 0.5 ml/min.
Determining the concentrations of NADH, NAD+, and ATP
The fermentation broth (5 ml) was centrifuged at 4°C and 8,000 rpm for 10 min. The obtained cell pellet was resuspended in 5 ml of 0.2 mol/l phosphate-buffered saline (pH = 7.0) and ultrasonically homogenized in an ice bath. Cell debris was removed by centrifugation and filtration. NADH, NAD+, and ATP were quantified using an HPLC system equipped with a C18 column (4.6 mm × 150 mm × 5 μm) and a UV detector at 254 nm. Specific details have been provided in the Supplementary Table S3, Supplementary Figure S2.
Determination of dry cell weight
Dry centrifuge tubes were weighed, and the mass was recorded as m1. The fermentation broth was centrifuged at 13,000 rpm for 10 min. The supernatant was removed and the tube was dried at 95°C until a constant weight was achieved; this mass was recorded as m2. Dry cell weight was calculated using the following formula: Dry cell weight = m2 − m1.
Determining CoQ10 concentration
CoQ10 was quantified using an HPLC system equipped with a C18 column (4.6 mm × 150 mm × 5 μm) and a UV detector at 275 nm. Methanol/ethanol (65: 35, v/v) was used as the mobile phase at 35°C and a flow rate of 1.0 ml/min. Quantification was conducted by calculating the peak area using the standard external method. All operations were performed in the dark.
Calculating CoQ10 yield and production
CoQ10 yield was calculated using Formula 1.
CoQ10 production performance was calculated using Formula 2.
where A refers to CoQ10 titer; B refers to dry cell weight, C refers to sugar consumption, D refers to fermentation broth volume and E refers to fermentation time.
Data analysis
The experiments were performed using three biological replicates and data are expressed as means ± error bars. Origin 2021 was used for plotting, and Statistical Analysis System 9.2 was used to evaluate significant statistical differences. Relative expressions were calculated using the 2−∆∆Ct method.
Results and discussion
Effects of overexpression of PFK and PKAC on CoQ10 production
The strains were in the lag phase within 0–10 h, began to grow after 10 h, and reached the stationary phase after 24 h. Compared with VK-2-3, RS.PKAC and RS.PFK–PKAC showed faster growth (Figure 2; Supplementary Table S2). Further, the residual sugar concentrations in the RS.PKAC and RS.PFK–PKAC fermentation broths were significantly lower than that in the VK-2-3 broth, whereas the residual sugar concentration in the RS.PFK fermentation broth was significantly higher than in the VK-2-3 (Figure 3; Supplementary Table S2). The CoQ10 titers of RS.PKAC and RS.PFK–PKAC significantly increased by 13 and 6%, respectively, compared with VK-2-3. The CoQ10 yield of RS.PKAC and RS.PFK–PKAC increased by 16.7 and 6.4% compared with VK-2-3, respectively (Figure 4; Supplementary Table S2). The RT-qPCR results revealed that the relative expression of pfk and pkac genes in the RS.PKAC strain was 1.9 and 1.6 times higher than those in VK-2-3, respectively. However, the relative expression of pkac gene decreased by 47% in RS.PFK strain compared with that in VK-2-3 (Figure 5A; Supplementary Table S2). Overexpression of PFK and PKAC to enhance target product production has rarely been reported in R. sphaeroides. Zhu et al. overexpressed PFK and PKAC in Lactococcus lactis (L. lactis). After 10 h of fermentation, The nisin yield of recombinant strain L. lactis N8-pMG36e-PFK–PKAC was increased by 20% compared with the wildtype strain (Zhu et al., 2015). Zhu et al. integrated additional copies of 1-deoxy-D-xylulose-5-phosphate synthase (dxs) and 1-deoxy-D-xylulose-5-phosphate reductoisomerase (dxr) into the R. sphaeroides genome, and the titer and yield of CoQ10 increased by 18.44 and 18.87%, respectively (Zhu et al., 2022). In this study, overexpression of pfk and pkac increased the growth and sugar consumption rates of RS.PKAC and RS.PFK–PKAC. The CoQ10 titer of RS.PKAC significantly increased compared with that of VK-2-3, indicating that the overexpression of a single gene can improve the efficiency of glucose utilization and increase cellular metabolism in R. sphaeroides. This metabolic flow pressure may be within the tolerance of the host cell, with little effect on its normal growth. However, the increase in the CoQ10 titer of RS.PFK–PKAC was less than that in the titer of RS.PKAC; this may be because two genes were coexpressed in tandem and the same promoter drove them. This further increased the metabolic load on the host cell beyond its tolerance and had a detrimental effect on its growth (Kim and Kim, 2004).
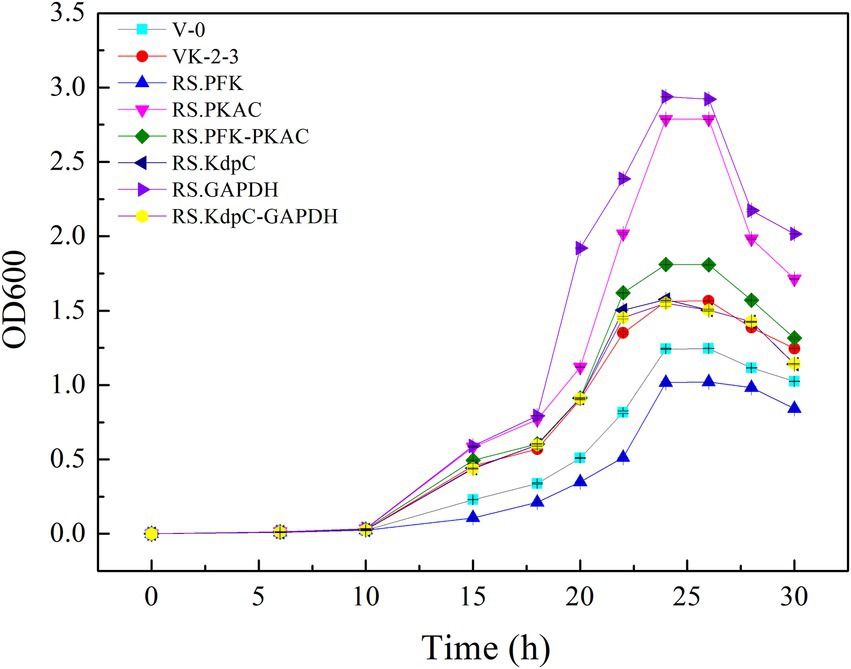
Figure 2. Growth curves of V-0, VK-2-3, and recombinant strains.
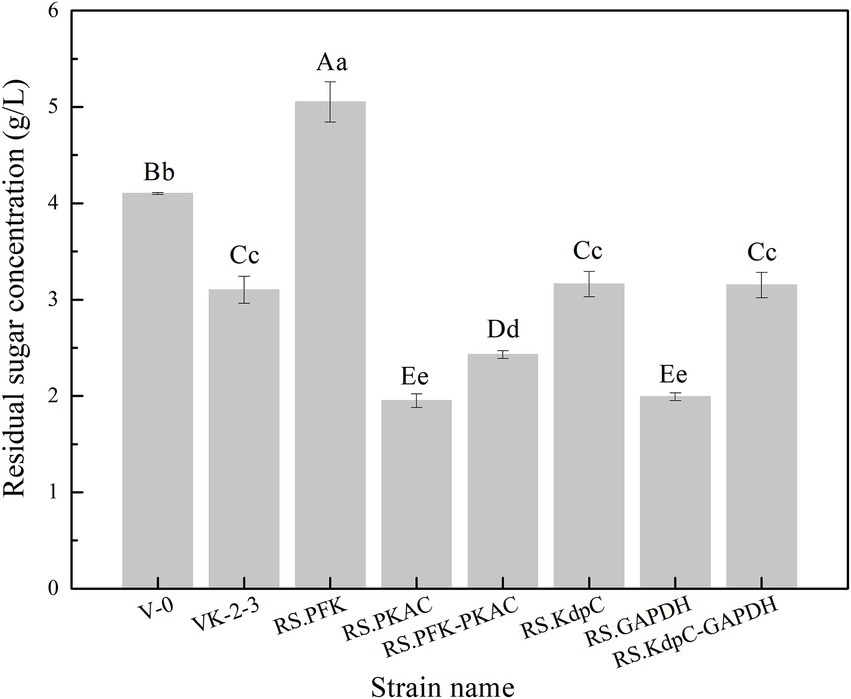
Figure 3. Residual sugar concentration in the fermentation broths of V-0, VK-2-3, and recombinant strains. Shoulder-notes in uppercase letters indicate highly significant differences (p < 0.01) and lowercase letters indicate significant differences (p < 0.05).
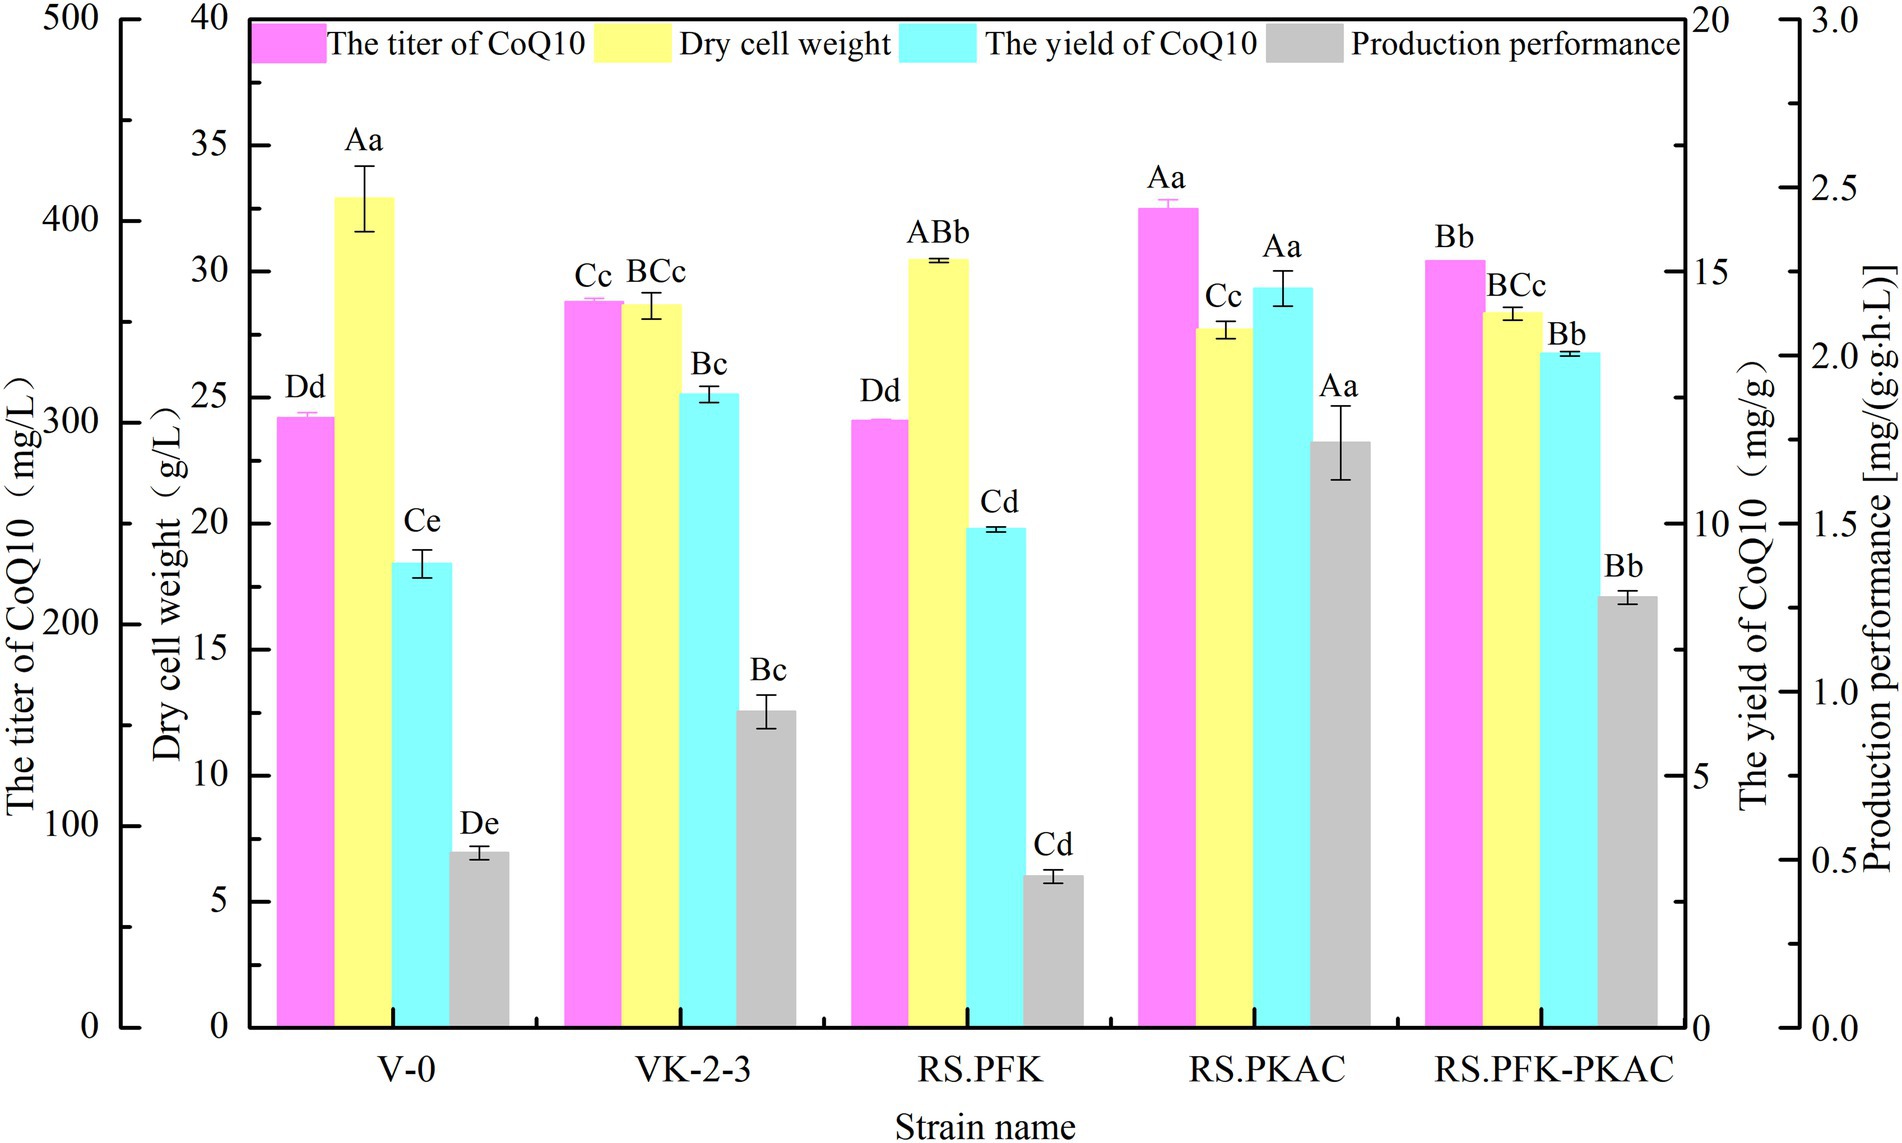
Figure 4. Fermentation test results of V-0, VK-2-3, RS.PFK, RS.PKAC, and RS.PFK–PKAC. Shoulder-notes in uppercase letters indicate highly significant differences (p < 0.01) and lowercase letters indicate significant differences (p < 0.05).
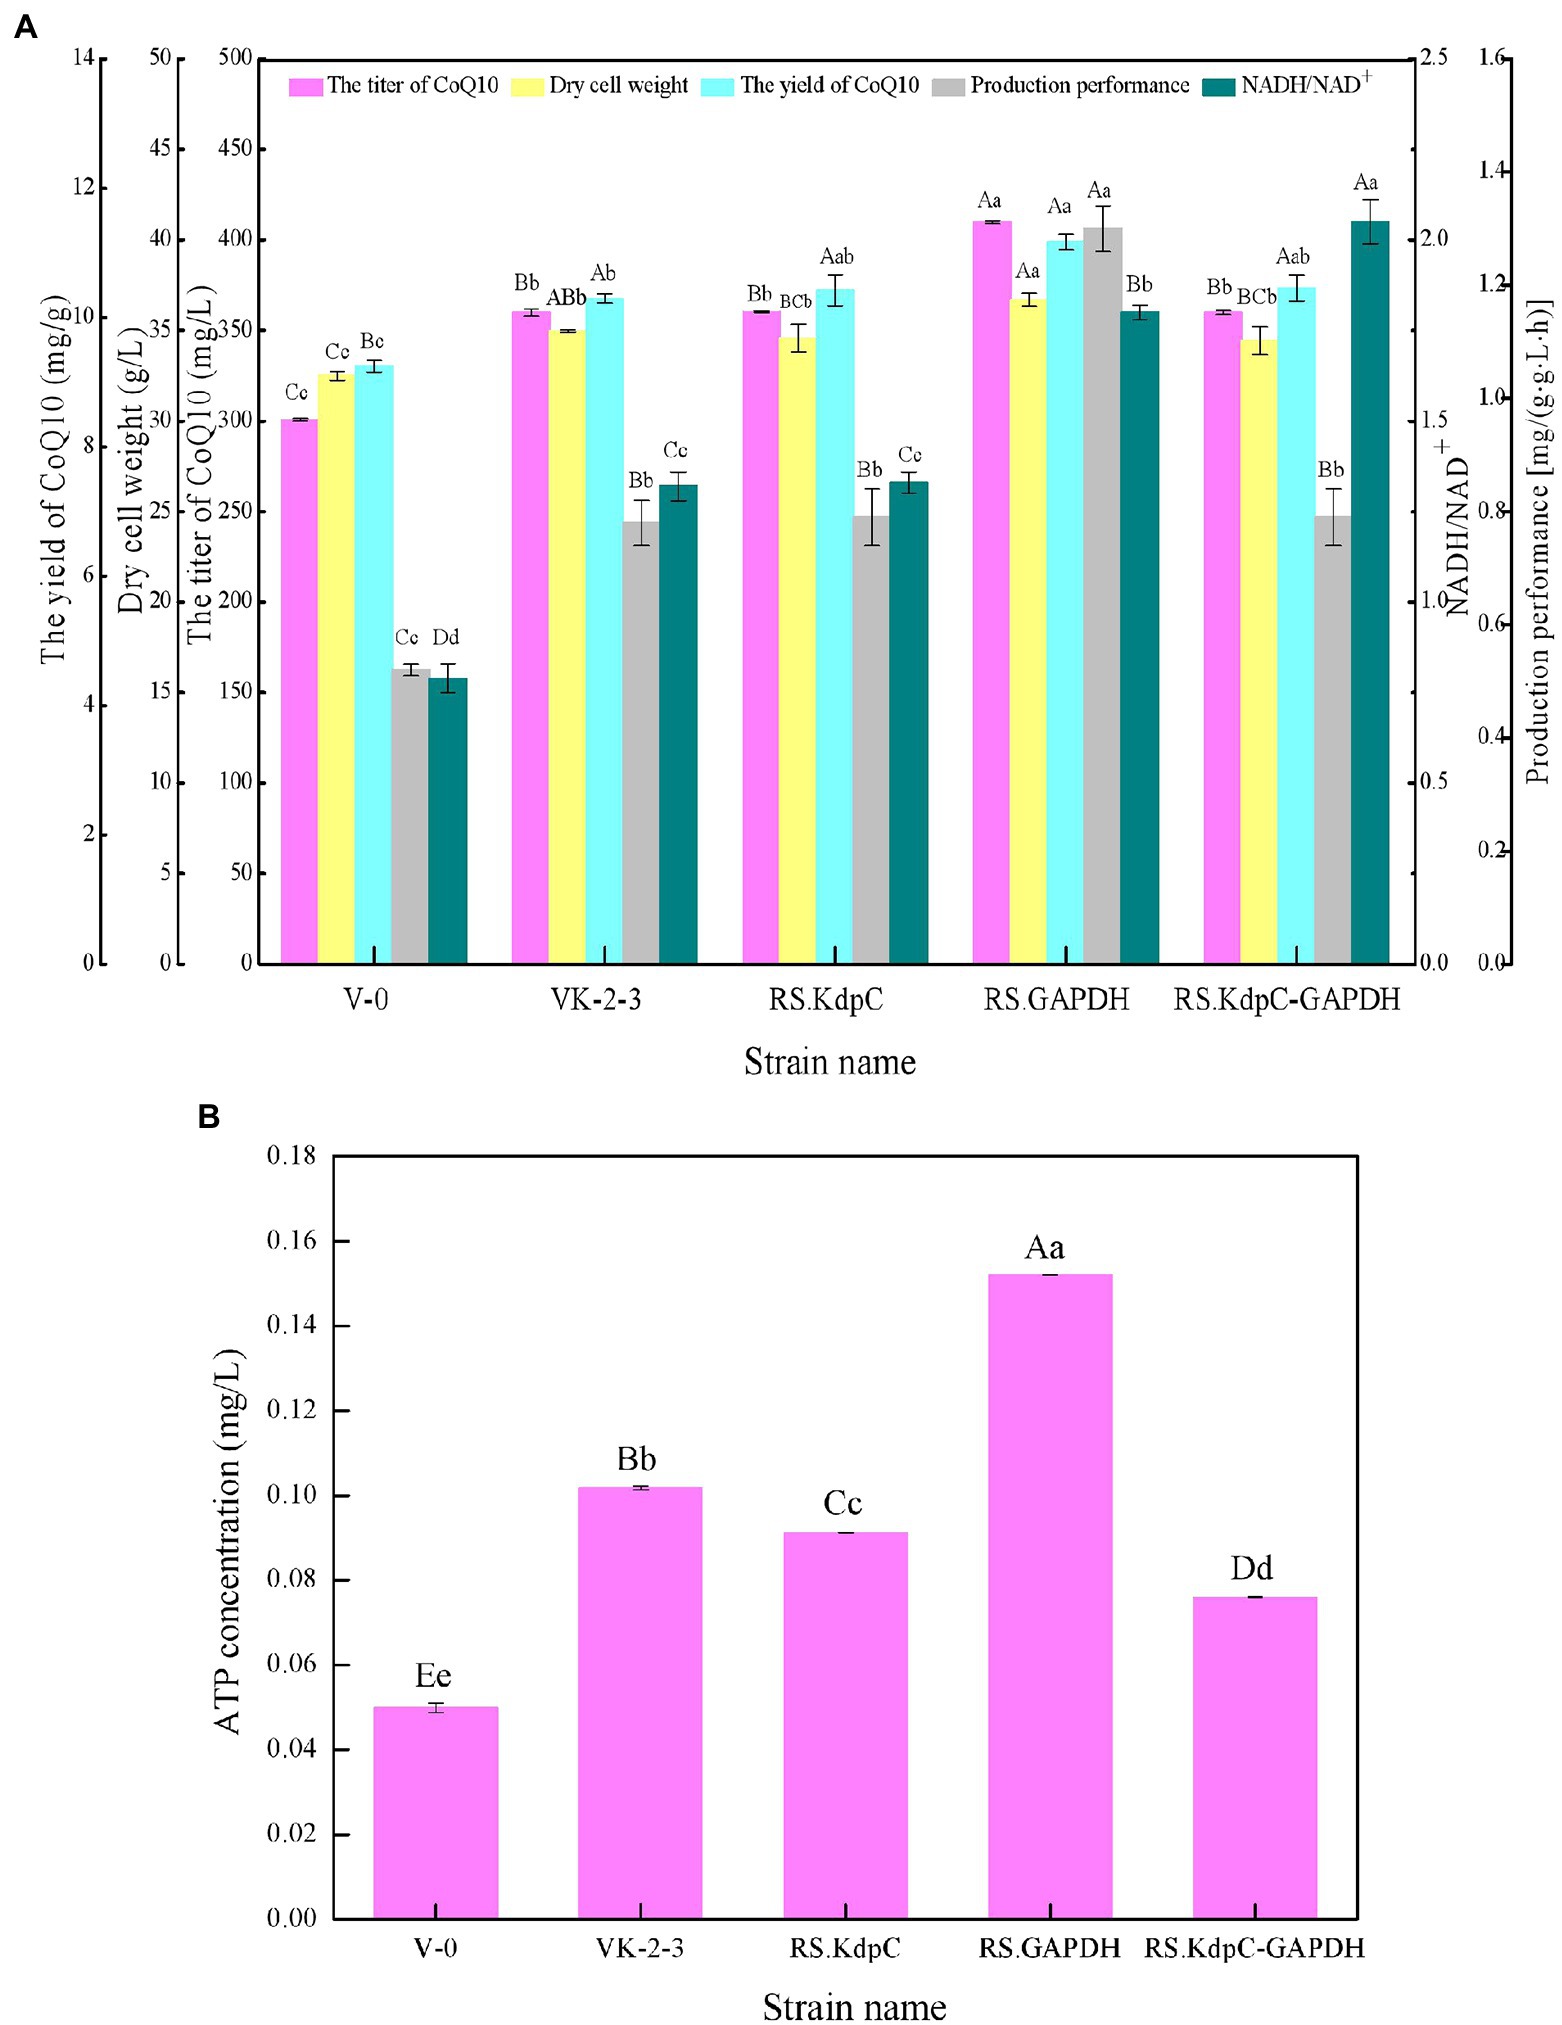
Figure 5. Relative expression of pfk, pkac, kdpc, and gapdh of V-0, VK-2-3, and recombinant bacteria. (A) Relative expression of pfk and pkac of V-0, VK-2-3, RS.PFK, RS.PKAC, and RS.PFK–PKAC. (B) Relative expression of kdpc and gapdh of V-0, VK-2-3, RS.KdpC, RS.GAPDH, and RS.KdpC–GAPDH. Shoulder-notes in uppercase letters indicate highly significant differences (p < 0.01) and lowercase letters indicate significant differences (p < 0.05).
Effects of overexpression of Kdpc and GAPDH on CoQ10 production
The results showed that RS.GAPDH grew faster than VK-2-3, whereas RS.KdpC and RS.KdpC–GAPDH grew at the same rate as VK-2-3 (Figure 2; Supplementary Table S2). The residual sugar concentration in RS.KdpC, VK-2-3, and RS.KdpC–GAPDH fermentation broths were not significantly different; however, that in the fermentation broth of RS.GAPDH was significantly lower than that in the other four strains (Figure 3; Supplementary Table S2). The titers and yields of CoQ10 for RS.KdpC, VK-2-3, and RS.KdpC–GAPDH were not significantly different. Compared with VK-2-3, RS.GAPDH CoQ10 titer increased by 14%, NADH/NAD+ increased by 1.3-fold, ATP content increased two-fold, and CoQ10 yield increased by 8.6% (Figures 6A,B; Supplementary Table S2). RT-qPCR results revealed that the relative expression of gapdh and kdpc was 2.3-and 2.2-fold higher, respectively, in RS.GAPDH than VK-2-3. In contrast, the differences in the relative expression of gapdh in VK-2-3, RS.KdpC and RS.KdpC–GAPDH were not significant (Figure 5B; Supplementary Table S2). Li et al. reported that decreasing the NADH/NAD+ ratio in E. coli DH5α cells affects succinate synthesis. E. coli YL104 was metabolically engineered to use NADH dehydrogenase in all phases of succinate synthesis, thereby lowering the NADH/NAD+ ratio. Succinate yield increased by 7% in all phases of succinate synthesis in the engineered strain (Li, 2017). Koo et al. found that the intracellular NADH/NAD+ ratio was positively correlated with CoQ10 content in A. tumefaciens A603-35, a strain with high yield of CoQ10. GAPDH expression in A603-35 increased the NADH/NAD+ ratio from 0.8 to 1.2 at 48 h, and CoQ10 yield in the corresponding shake-flask increased from 2.16 mg/g to 3.63 mg/g (Koo et al., 2010). Zhu et al. overexpressed GAPDH and inhibited carotenoid synthesis in R. sphaeroides to increase CoQ10 production to 63.7 mg/l, which was 27.8% higher than the control (Zhu, 2017). In this study, RS.GAPDH showed the greatest growth compared with other strains, indicating that the overexpression of gapdh accelerated electron transfer in the respiratory chain, which subsequently increased CoQ10 requirement, thus increasing bacterial concentration per unit volume per unit time. Moreover, overexpressing GAPDH increased NADH/NAD+. Driven by this reducing power, the metabolic process of the cell accelerated and glucose consumption increased, thus increasing CoQ10 production. Overexpressing KdpC alone reduced intracellular ATP concentration, but CoQ10 production did not increase, suggesting that KdpC might not regulate CoQ10 synthesis. The tandem overexpression of KdpC–GAPDH reduced intracellular ATP concentration and increased NADH/NAD+; however, CoQ10 titer did not increase, possibly because it affected the metabolic flow distribution of bacteria and increased metabolic pressure in cells, thus affecting CoQ10 synthesis (Perrakis and Romier, 2008). In addition, the sugar consumption of RS.GAPDH increased, indicating an increase in the ability of individual strains to use sugar. In contrast, the sugar concentration in the fermentation broth decreased, facilitating the treatment of three wastes and has social benefits.
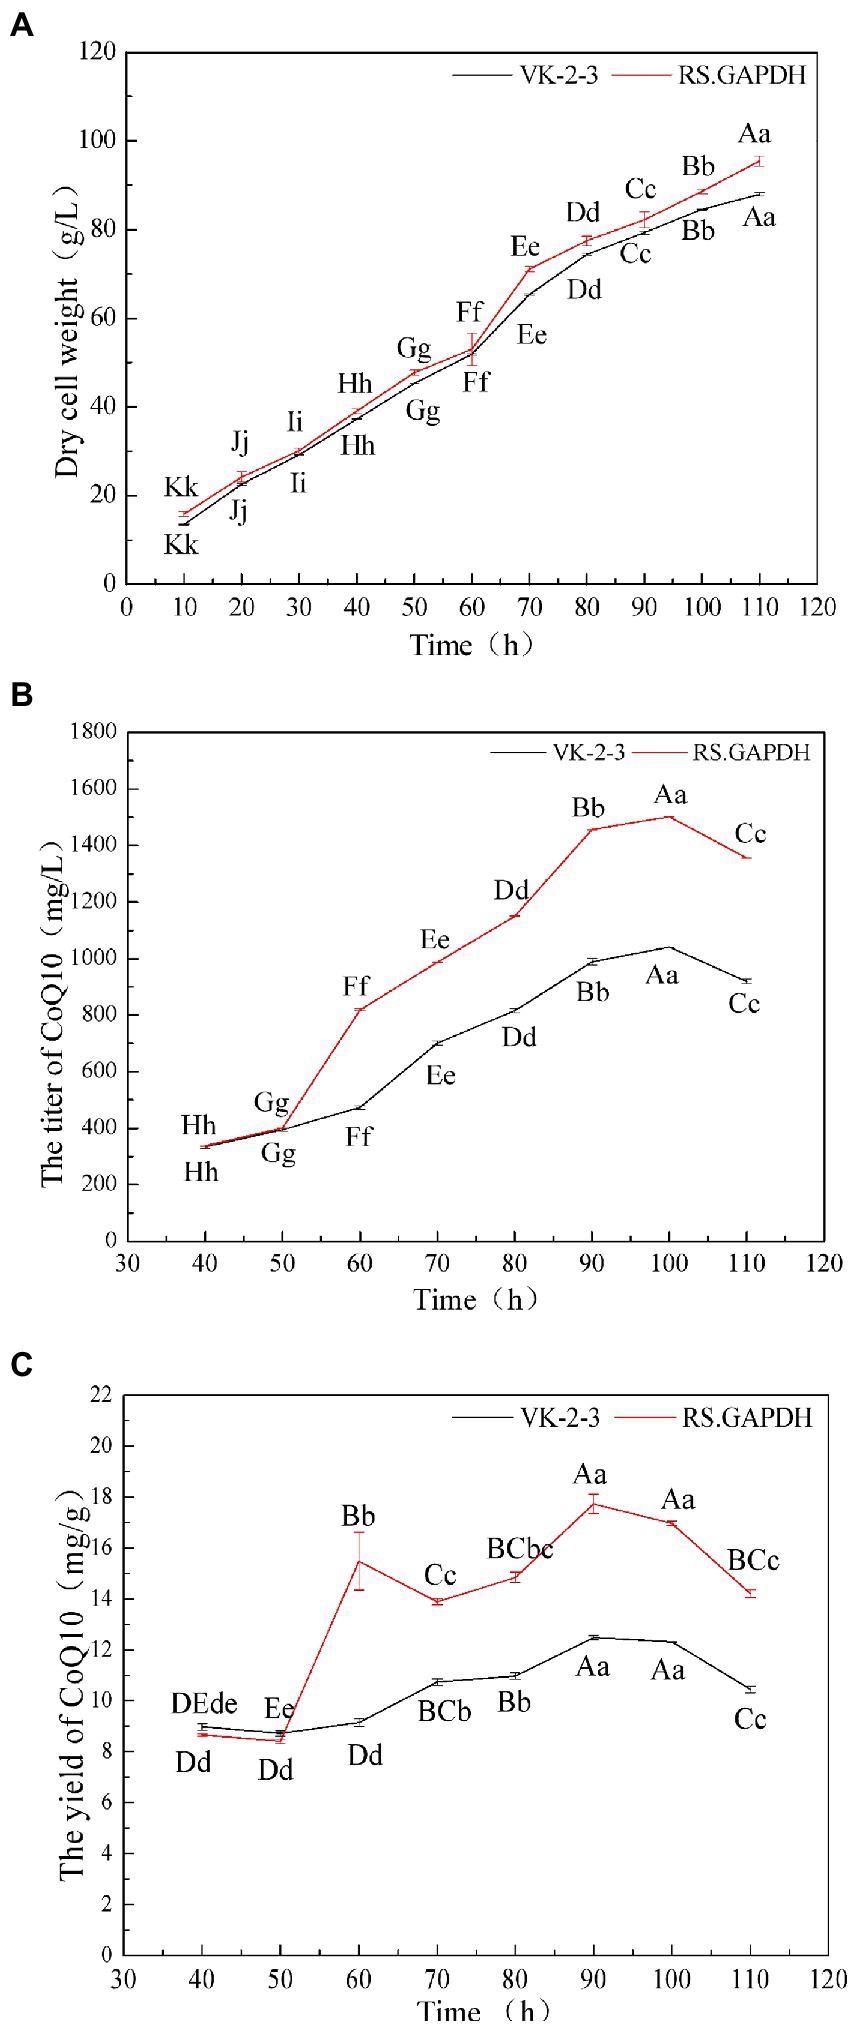
Figure 6. Fermentation test results of V-0, VK-2-3, RS.KdpC, RS.GAPDH, and RS.KdpC–GAPDH. (A) Coenzyme Q10 (CoQ10) titer, CoQ yield, dry cell weight, production performance, and NADH/NAD+. (B) ATP concentration. Shoulder-notes in uppercase letters indicate highly significant differences (p < 0.01) and lowercase letters indicate significant differences (p < 0.05).
Results of the 5-L fermenter experiment
The dry cell weight of the bacteria gradually increased during fermentation. The dry cell weight of RS.GAPDH was 9% higher than that of VK-2-3 at the end of fermentation (Figure 7A; Supplementary Table S2). After 40–100 h, the CoQ10 titers of VK-2-3 and RS.GAPDH gradually increased with fermentation time. When the fermentation period reached 110 h, the CoQ10 titer declined. The CoQ10 yield of VK-2-3 was the maximum at 90 h, but the difference was not significant compared with the CoQ10 yield at 100 h. The CoQ10 yield of RS.GAPDH was the maximum at 90 h, but it was not significantly different from that at 100 h. Further, CoQ10 titers and yields of RS.GAPDH increased by 44.3 and 37.8%, respectively, compared with VK-2-3 after fermentation for 100 h (Figures 7B,C; Supplementary Table S2). Yang et al. used 15-L tanks to ferment and culture R. sphaeroides EIM-8, supplementing them intermittently with complete medium and continuously with glucose to extend culture time. CoQ10 yields and biomass values were 1289.76 mg/l and 40.92 g/l, respectively (Yang et al., 2013). Ren et al. increased CoQ10 production in R. sphaeroides to 129.97 mg/l by adding fermentation precursors in a 5-L fermenter, an increase of 42.9% compared with no addition of precursor (Ren, 2010). Han et al. cultured R. sphaeroides CF02-AF3-674 in a 2-L fermenter for 90 h and using HPLC, determined that the CoQ10 yield was 2037.4 μg/ml. The fermentation tank was scaled-up to verify the results. After 90 h of culture, the CoQ10 yield was 2693.5 μg/ml, which is 32% higher than that in the 2-L fermentation tank (Han et al., 2019). In this study, CoQ10 titer and yield of RS.GAPDH reached a value maximum after 100 h of batch fermentation and subsequently began decreasing; one possible reason for this could be that in RS.GAPDH, electron transfer in the respiratory chain gets accelerated under high-density culture conditions; bacterial growth and glucose consumption correspondingly increased. Therefore, cells need more CoQ10 to conduct metabolic processes. Simultaneously, because oxygen demand differs with the stages of fermentation, a controlled oxygen mode with regulated speed and ventilation is used in batch replenishment fermentation to optimize fermentation conditions. Low dissolved oxygen is used at the initial stages of cell growth to enable rapid plateauing, and higher dissolved oxygen levels during product synthesis help achieve remarkable results. CoQ10 and its structural analogs share some common pathways, and changing conditions of oxygen supply may affect its metabolic flux distribution; therefore, more precursor substances were used CoQ10 synthesis. CoQ10 production began to decline in the later stages of fermentation, indicating that cell density was extremely high, and some cells died from insufficient oxygen in the fermentation broth, thus rapidly reducing CoQ10 accumulation.
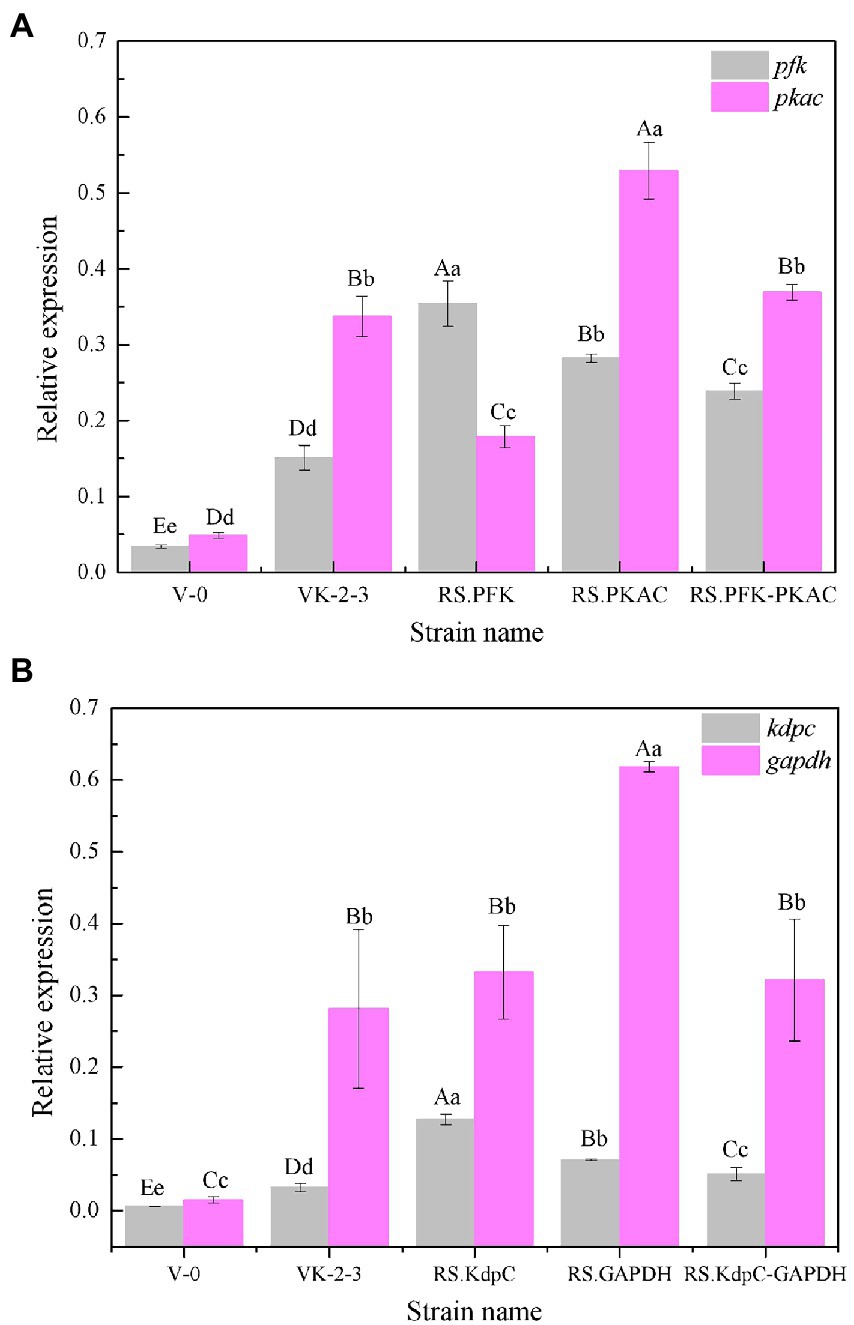
Figure 7. 5-L fermenter experiment results. (A) The dry cell weights of the VK-2-3 and RS.GAPDH fermenters. (B) Coenzyme Q10 titer of VK-2-3 and RS.GAPDH (C) coenzyme Q10 yields of VK-2-3 and RS.GAPDH. Shoulder-notes in uppercase letters indicate highly significant differences (p < 0.01) and lowercase letters indicate significant differences (p < 0.05).
Conclusion
In this study, we subjected the components of the glycolytic and energy conversion pathways to metabolic engineering and generated three strains with high yield of CoQ10, RS.PKAC, RS.PFK–PKAC, and RS.GAPDH. CoQ10 titers for RS.PKAC, RS.PFK–PKAC, and RS.GAPDH were 13, 6, and 14% higher and the yields were 16.7, 6.4, and 4% higher than those for VK-2-3, respectively. The sugar consumption and production performance of the three strains were higher than that for VK-2-3. The RT-qPCR results revealed that the relative expression of pfk and pkac genes in the RS.PKAC strain was 1.9 and 1.6 times higher than those in VK-2-3, respectively. However, the relative expression of pkac gene decreased by 47% in RS.PFK strain compared with that in VK-2-3. And the relative expression of gapdh and kdpc genes was 2.3-and 2.2-fold higher, respectively, in RS.GAPDH than VK-2-3. In contrast, the differences in the relative expression of gapdh gene in VK-2-3, RS.KdpC and RS.KdpC–GAPDH were not significant. Further, VK-2-3 and RS.GAPDH were cultured in a 5-L fermenter, and the results showed that the CoQ10 output and yield of RS.GAPDH increased by 44 and 38%, respectively. Our findings provide insights into the advantages of metabolic engineering for improving product yield and strain expansion.
Data availability statement
The datasets presented in this study can be found in online repositories. The names of the repository/repositories and accession number(s) can be found in the article/Supplementary material.
Author contributions
LZ performed the material preparation, data collection, and analysis, operated the experiment, analyzed the experimental data, and wrote the first draft of the manuscript. LZ and Z-yL designed the experiment. Y-lL and J-hH provided the analysis tools. All authors contributed to the article and approved the submitted version.
Funding
This research was supported by the funds from the National Natural Science Foundation of China (32060017), Inner Mongolia Science and Technology plan project, Scientific and Technological Achievements Transformation project of Inner Mongolia (CGZH2018133), and Inner Mongolia Grassland Talent projects for team and individual.
Acknowledgments
We are grateful to the Institute of Modern Physics, Chinese Academy of Sciences, for funding the Heavy Ion Beam Instrument. We thank Hua-cong Zhou and Zhi-qing Song for funding the equipment.
Conflict of interest
The authors declare that the research was conducted in the absence of any commercial or financial relationships that could be construed as a potential conflict of interest.
Publisher’s note
All claims expressed in this article are solely those of the authors and do not necessarily represent those of their affiliated organizations, or those of the publisher, the editors and the reviewers. Any product that may be evaluated in this article, or claim that may be made by its manufacturer, is not guaranteed or endorsed by the publisher.
Supplementary material
The supplementary material for this article can be found online at: https://www.frontiersin.org/articles/10.3389/fmicb.2022.931470/full#supplementary-material.
Abbreviations
PFK, phosphofructokinase; PKAC, cyclic AMP-dependent protein kinase; KdpC, adenosine triphosphate hydrolase; GAPDH, glyceraldehyde-3-phosphate dehydrogenase; VK-2-3, Rhodobacter sphaeroides VK-2-3; V-0, Rhodobacter sphaeroides V-0; HPLC, High performance liquid chromatography; L. lactis, Lactococcus lactis; SAS, statistical analysis system; A603-35, Agrobacterium tumefaciens A603-35; dxs, 1-deoxy-D-xylulose-5-phosphate synthase; dxr, 1-deoxy-D-xylulose-5-phosphate reductoisomerase; HK, hexokinase; PK, pyruvate kinase; PC, pyruvate carboxylase.
Footnotes
References
Brandmeyer, E. A., Shen, Q. H., Thimmesch, A. R., and Pierce, J. D. (2014). Using coenzyme Q10 in clinical practice. Nursing 44, 63–66. doi: 10.1097/01.nurse.0000443317.81231.d3
Campagnolo, N., Johnston, S., Collatz, A., Staines, D., and Marshall-Gradisnik, S. (2017). Dietary and nutrition interventions for the therapeutic treatment of chronic fatigue syndrome/myalgic encephalomyelitis: a systematic review. J. Hum. Nutr. Diet. 30, 247–259. doi: 10.1111/jhn.12435
Chen, J. (2016). Selection of high-yielding strains of fermented coenzyme Q10. Amino Acids Biotic Resour. 38, 53–57. doi: 10.14188/j.ajsh.2016.01.010
Choi, G. S., Kim, Y., Seo, J., and Ryu, Y. (2005). Restricted electron flux increases coenzyme Q10 production in agrobacterium tumefaciens ATCC 4452. Process Biochem. 40, 3225–3229. doi: 10.1016/j.procbio.2005.03.038
Cluis, C. P., Pinel, D., and Martin, V. J. (2012). The production of coenzyme Q10 in microorganisms. Subcell. Biochem. 64, 303–326. doi: 10.1007/978-94-007-5055-5_15
Davies, S. E. C., and Brindle, K. M. (1992). Effects of overexpression of phosphofructokinase on glycolysis in the yeast saccharomyces cereviseae. Biochemist 31, 4729–4735. doi: 10.1021/bi00134a028
Han, Y. J., Zou, R. S., Li, J., Zhang, J. C., Yang, D., Liu, Y. X., et al. (2019). A high yield coenzyme Q10 type Rhodobacter sphaeroides and its mutagenesis breeding and application, China. 201811590191.
Hernández-Camacho, J. D., Bernier, M., López-Lluch, G., and Navas, P. (2018). Coenzyme Q10 supplementation in aging and disease. Front. Physiol. 9:44. doi: 10.3389/fphys.2018.00044
Kim, K. J., and Kim, H. E. (2004). Two-promoter vector is highly efficient for overproduction of protein complexes. Protein Sci. 13, 1698–1703. doi: 10.1110/ps.04644504
Kolkman, J. A., and Stemmer, W. P. C. (2001). Directed evolution of proteins by exon shuffling. Nat. Biotechnol. 19, 423–428. doi: 10.1038/88084
Koo, B. S., Gong, Y. J., Kim, S. Y., Kim, C. W., and Lee, H. C. (2010). Increasing the ratio of NADH/NAD(+) increases the production of coenzyme Q10 in agrobacterium tumefaciens. Biosci. Biotechnol. Biochem. 74, 895–898. doi: 10.1271/bbb.100034
Li, J. J. (2017). Regulation of ATP and NADH/NAD+ ratio to Improve the Synthesis of succinic acid from Escherichia coli. Dissertation. China: Shandong University.
Littarru, G. P., and Tiano, L. (2010). Clinical aspects of coenzyme Q10: an update. Nutrition 8, 641–646. doi: 10.1097/01.mco.0000171123.60665.16
Liu, P. H., Xie, B. G., Deng, Y. J., and Jiang, Y. J. (2013). Cloning, structure and expression analysis of Volvariella volvacea phosphofructokinase (PFK) gene in different strains. Acta Mycol. Sin. 32, 253–260. doi: 10.13346/j.mycosystema.2013.02.004
Lu, W. Q., Ye, L. D., Lv, X. M., Xie, W. P., Gu, J. L., Chen, Z. F., et al. (2015). Identifification and elimination of metabolic bottlenecks in the quinone modifification pathway for enhanced coenzyme Q10 production in Rhodobacter sphaeroides. Metab. Eng. 29, 208–216. doi: 10.1016/j.ymben.2015.03.012
Lu, W. Q., Ye, L. D., Xu, H. M., Xie, W. P., Gu, J. L., and Yu, H. W. (2014). Enhanced production of coenzyme Q10 by self regulating the engineered MEP pathway in Rhodobacter sphaeroides. Biotechnol. Bioeng. 111, 761–769. doi: 10.1002/bit.25130
Lv, X. M., Xie, W. P., Lu, W. Q., Guo, F., Gu, J. L., Yu, H. W., et al. (2014). Enhanced isoprene biosynthesis in Saccharomyces cerevisiae by engineering of the native acetyl-CoA and mevalonic acid pathways with a push-pull-restrain strategy. J. Biotechnol. 186, 128–136. doi: 10.1016/j.jbiotec.2014.06.024
Meganathan, R. (2001). Ubiquinone biosynthesis in microorganisms. FEMS Microbiol. Lett. 203, 131–139. doi: 10.1111/j.1574-6968.2001.tb10831.x
Nielsen, J., and Olsson, L. (2002). An expanded role for microbial physiology in metabolic engineering and functional genomics: moving towards systems biology. FEMS Yeast Res. 2, 175–181. doi: 10.1111/j.1567-1364.2002.tb00083.x
Perrakis, K., and Romier, C. (2008). Assembly of protein complexes by coexpession in prokaryotic and eukaryotic hosts: an overview. Methods Mol. Biol. 426:247. doi: 10.1007/978-1-60327-058-8_15
Qian, D. W. (2016). Strain breeding and fermentation process optimization of coenzyme Q10. Dissertation. China: Suzhou University of Science and Technology.
Ren, P. (2010). Breeding of Coenzyme Q (10) Producing Strains of Rhodobacter sphaeroides and Optimization of Fermentation Conditions. Dissertation. China: Academy of Military Medical Sciences of People’s Liberation Army.
Scalcinati, G., Otero, J. M., Vleet, J. R. H. V., Jeffries, T. W., Olsson, L., and Nielsenet, J. (2012). Evolutionary engineering of Saccharomyces cerevisiae for effificient aerobic xylose consumption. FEMS Yeast Res. 12, 582–597. doi: 10.1111/j.1567-1364.2012.00808.x
Tsuge, Y., Kato, N., Yamamoto, S., Suda, M., and Inui, M. (2019). Enhanced production of D-lactate from mixed sugars in Corynebacterium glutamicum by overexpression of glycolytic genes encoding phosphofructokinase and triose phosphate isomerase. J. Biosci. Bioeng. 127, 288–293. doi: 10.1016/j.jbiosc.2018.08.002
Wang, Y., Chen, S. F., Huo, K., Wang, B., Liu, J. G., Zhao, G. Q., et al. (2021). Iterative mutagenesis induced by atmospheric and room temperature plasma treatment under multiple selection pressures for the improvement of coenzyme Q10 production by Rhodobacter sphaeroides. FEMS Microbiol. Lett. 368:fnab 154. doi: 10.1093/femsle/fnab154
Ya, W. (2010). Rational selection and fermentation optimization of coenzyme Q10 high-yielding strains. Dissertation. China: Fujian Normal university, 2010.
Yang, W., Ke, C. R., Shao, Q. W., Zhu, Y. F., and Huang, J. Z. (2013). Optimization of fermentation process for coenzyme Q10 production of Rhodobacter sphaeroides. Food Ferment. Ind. 39, 75–79. doi: 10.13995/j.cnki.11-1802/ts.2013.02.017
Yoshida, H., Kotani, Y., Ochiai, K., and Araki, K. (1998). Production of Ubiquinone-10 using bacteria. J. Gen. Appl. Microbiol. 44, 19–26. doi: 10.2323/jgam.44.19
Zhu, Y. Q. (2017). Biosynthesis of Coenzyme Q10 by Metabolically Engineering-Modified Rhodobacter sphaeroides. Dissertation. China: Zhejiang University.
Zhu, Y. Q., Lu, W. Q., Ye, L. D., Chen, Z. F., Hu, W. J., Wang, C. F., et al. (2017). Enhanced synthesis of coenzyme Q10 by reducing the competitive production of carotenoids in Rhodobacter sphaeroides. Biochem. Eng. J. 125, 50–55. doi: 10.1016/j.bej.2017.03.019
Zhu, Y. Q., Pan, M. Y., Wang, C. F., Ye, L. D., Xia, C. M., and Yu, H. W. (2022). Enhanced CoQ10 production by genome modification of Rhodobacter sphaeroides via Tn7 transposition. FEMS Microbiol. Lett. 369:fnab160. doi: 10.1093/femsle/fnab160
Zhu, D. L., Zhao, K., Xu, H. J., Bai, Y. L., Zhang, X. M., and Qiao, M. Q. (2015). Effects of overexpression of pfk gene on nisin production rate of Lactococcus lactis N8. Chinese J. Microbiol. 55, 440–447. doi: 10.13343/j.cnki.wsxb.20140401
Keywords: Rhodobacter sphaeroides, metabolic engineering, coenzyme Q10, glycolysis metabolic pathways, energy metabolic pathways
Citation: Zhang L, Li Y-l, Hu J-h and Liu Z-y (2022) Overexpression of enzymes in glycolysis and energy metabolic pathways to enhance coenzyme Q10 production in Rhodobacter sphaeroides VK-2-3. Front. Microbiol. 13:931470. doi: 10.3389/fmicb.2022.931470
Edited by:
Jun Feng, University of Wisconsin-Madison, United StatesReviewed by:
Xiaojin Song, Qingdao Institute of Bioenergy and Bioprocess Technology (CAS), ChinaGao-Yi Tan, East China University of Science and Technology, China
Jie Zhang, Institute of Animal Sciences (CAAS), China
Copyright © 2022 Zhang, Li, Hu and Liu. This is an open-access article distributed under the terms of the Creative Commons Attribution License (CC BY). The use, distribution or reproduction in other forums is permitted, provided the original author(s) and the copyright owner(s) are credited and that the original publication in this journal is cited, in accordance with accepted academic practice. No use, distribution or reproduction is permitted which does not comply with these terms.
*Correspondence: Zhan-ying Liu, hgxylzy2008@imut.edu.cn