Identification of Tamoxifen-Resistant Breast Cancer Cell Lines and Drug Response Signature
 Qingzhou Guan
 Xuekun Song
 Zhenzhen Zhang1
  Yizhi Zhang
 Yating Chen
 Jing Li
- 1Co-construction Collaborative Innovation Center for Chinese Medicine and Respiratory Diseases by Henan & Education Ministry of P.R. China, Academy of Chinese Medical Sciences, Henan University of Chinese Medicine, Zhengzhou, China
- 2College of Information Technology, Henan University of Chinese Medicine, Zhengzhou, China
- 3Department of Bioinformatics, Key Laboratory of Ministry of Education for Gastrointestinal Cancer, School of Basic Medical Sciences, Fujian Medical University, Fuzhou, China
Breast cancer cell lines are frequently used to elucidate the molecular mechanisms of the disease. However, a large proportion of cell lines are affected by problems such as mislabeling and cross-contamination. Therefore, it is of great clinical significance to select optimal breast cancer cell lines models. Using tamoxifen survival-related genes from breast cancer tissues as the gold standard, we selected the optimal cell line model to represent the characteristics of clinical tissue samples. Moreover, using relative expression orderings of gene pairs, we developed a gene pair signature that could predict tamoxifen therapy outcomes. Based on 235 consistently identified survival-related genes from datasets GSE17705 and GSE6532, we found that only the differentially expressed genes (DEGs) from the cell line dataset GSE26459 were significantly reproducible in tissue samples (binomial test, p = 2.13E-07). Finally, using the consistent DEGs from cell line dataset GSE26459 and tissue samples, we used the transcriptional qualitative feature to develop a two-gene pair (TOP2A, SLC7A5; NMU, PDSS1) for predicting clinical tamoxifen resistance in the training data (logrank p = 1.98E-07); this signature was verified using an independent dataset (logrank p = 0.009909). Our results indicate that the cell line model from dataset GSE26459 provides a good representation of the characteristics of clinical tissue samples; thus, it will be a good choice for the selection of drug-resistant and drug-sensitive breast cancer cell lines in the future. Moreover, our signature could predict tamoxifen treatment outcomes in breast cancer patients.
Introduction
The overall recurrence rate of estrogen receptor positive (ER+) early breast cancer can be reduced by adjuvant treatment with tamoxifen. However, approximately 30–40% of ER + breast cancer patients receiving adjuvant tamoxifen therapy still would relapse or progress to deadly advanced metastatic stages within 15 years follow-up; this is largely attributed to tamoxifen resistance (Ye et al., 2019). Therefore, it is of great clinical significance to identify the efficacy of tamoxifen in ER + breast cancer patients. Cell lines are a common modeling tool in cancer research (Domcke et al., 2013); they can help us to better understand the biological processes and molecular mechanisms of cancer and aid in the development of anticancer drugs (Kong and Yamori, 2012; Knudsen et al., 2014). However, whether cell line models could adequately reflect the characteristics of clinical tissue samples is controversial (American Type Culture Collection Standards Development Organization Workgroup ASN-0002, 2010; Liedtke et al., 2010; Bayer et al., 2013; Capes-Davis et al., 2019; Wass et al., 2019). It is well known that tumor cell lines might lose some of their tumor-related characteristics owing to the culture environment (Masters, 2000). Cross-contamination (International Cell Line Authentication Committee, 2014) and misidentification (American Type Culture Collection Standards Development Organization Workgroup ASN-0002, 2010) of cell lines exacerbates such issues. Moreover, there is no unified gold standard for the identification of drug-resistant cell lines, which also results in some cell lines poorly reflecting the characteristics of clinical tissue samples (Liedtke et al., 2010). Thus, it is of great value to find resistant/sensitive cell line models that are more representative of clinical tissue samples.
Considering tamoxifen survival-related genes from breast cancer tissue samples as the gold standard, we screened for the optimal cell line model. In the survival-related analysis of tissue samples, we assumed that genes that were positively (negatively) correlated with survival risk in tissue samples were comparable with genes that are upregulated (downregulated) in resistant compared with sensitive cell lines. In this study, through evaluating the consistency of prognosis-related genes in tissue samples from patients undergoing tamoxifen treatment with drug-resistance genes in cell lines, we selected the optimal cell line model to represent the characteristics of clinical tissue samples; the consistent genes between tissues and cell lines were identified as clinical drug-resistance-related genes.
Moreover, the relative expression orderings (REOs) of gene pairs within individual samples, also called qualitative transcriptional characteristics, are robust against experimental batch effects and can be directly applied to samples at an individual level (Eddy et al., 2010; Guan et al., 2019). The robustness property of the qualitative transcriptional characteristics enables integration of multiple datasets from different sources to develop disease signatures or classifiers, which improves the probability of finding robust signatures (Xu et al., 2008; Guan et al., 2019). Thus, based on qualitative transcriptional characteristics and the clinical drug-resistance-related genes that we identified, we developed a tamoxifen-resistance signature for ER + breast cancer and verified it in independent data.
Materials and Methods
Data and Preprocessing
Breast cancer gene expression data and corresponding clinical information were downloaded from the GEO database (Gene Expression Omnibus, http://www.ncbi.nlm.nih.gov/geo/). Relapse-free survival (RFS) time was defined as the interval between the first day of surgery and the date of death from any cause or of recurrence (local and/or distant) (Punt et al., 2007; Merok et al., 2013). Breast cancer tissue samples from ER+ patients who had received post-operative tamoxifen treatment were selected from the seven datasets, as described in Table 1. Nine gene expression datasets for breast cancer tamoxifen-resistant/sensitive cell lines were also downloaded from the GEO database, as shown in Table 1.
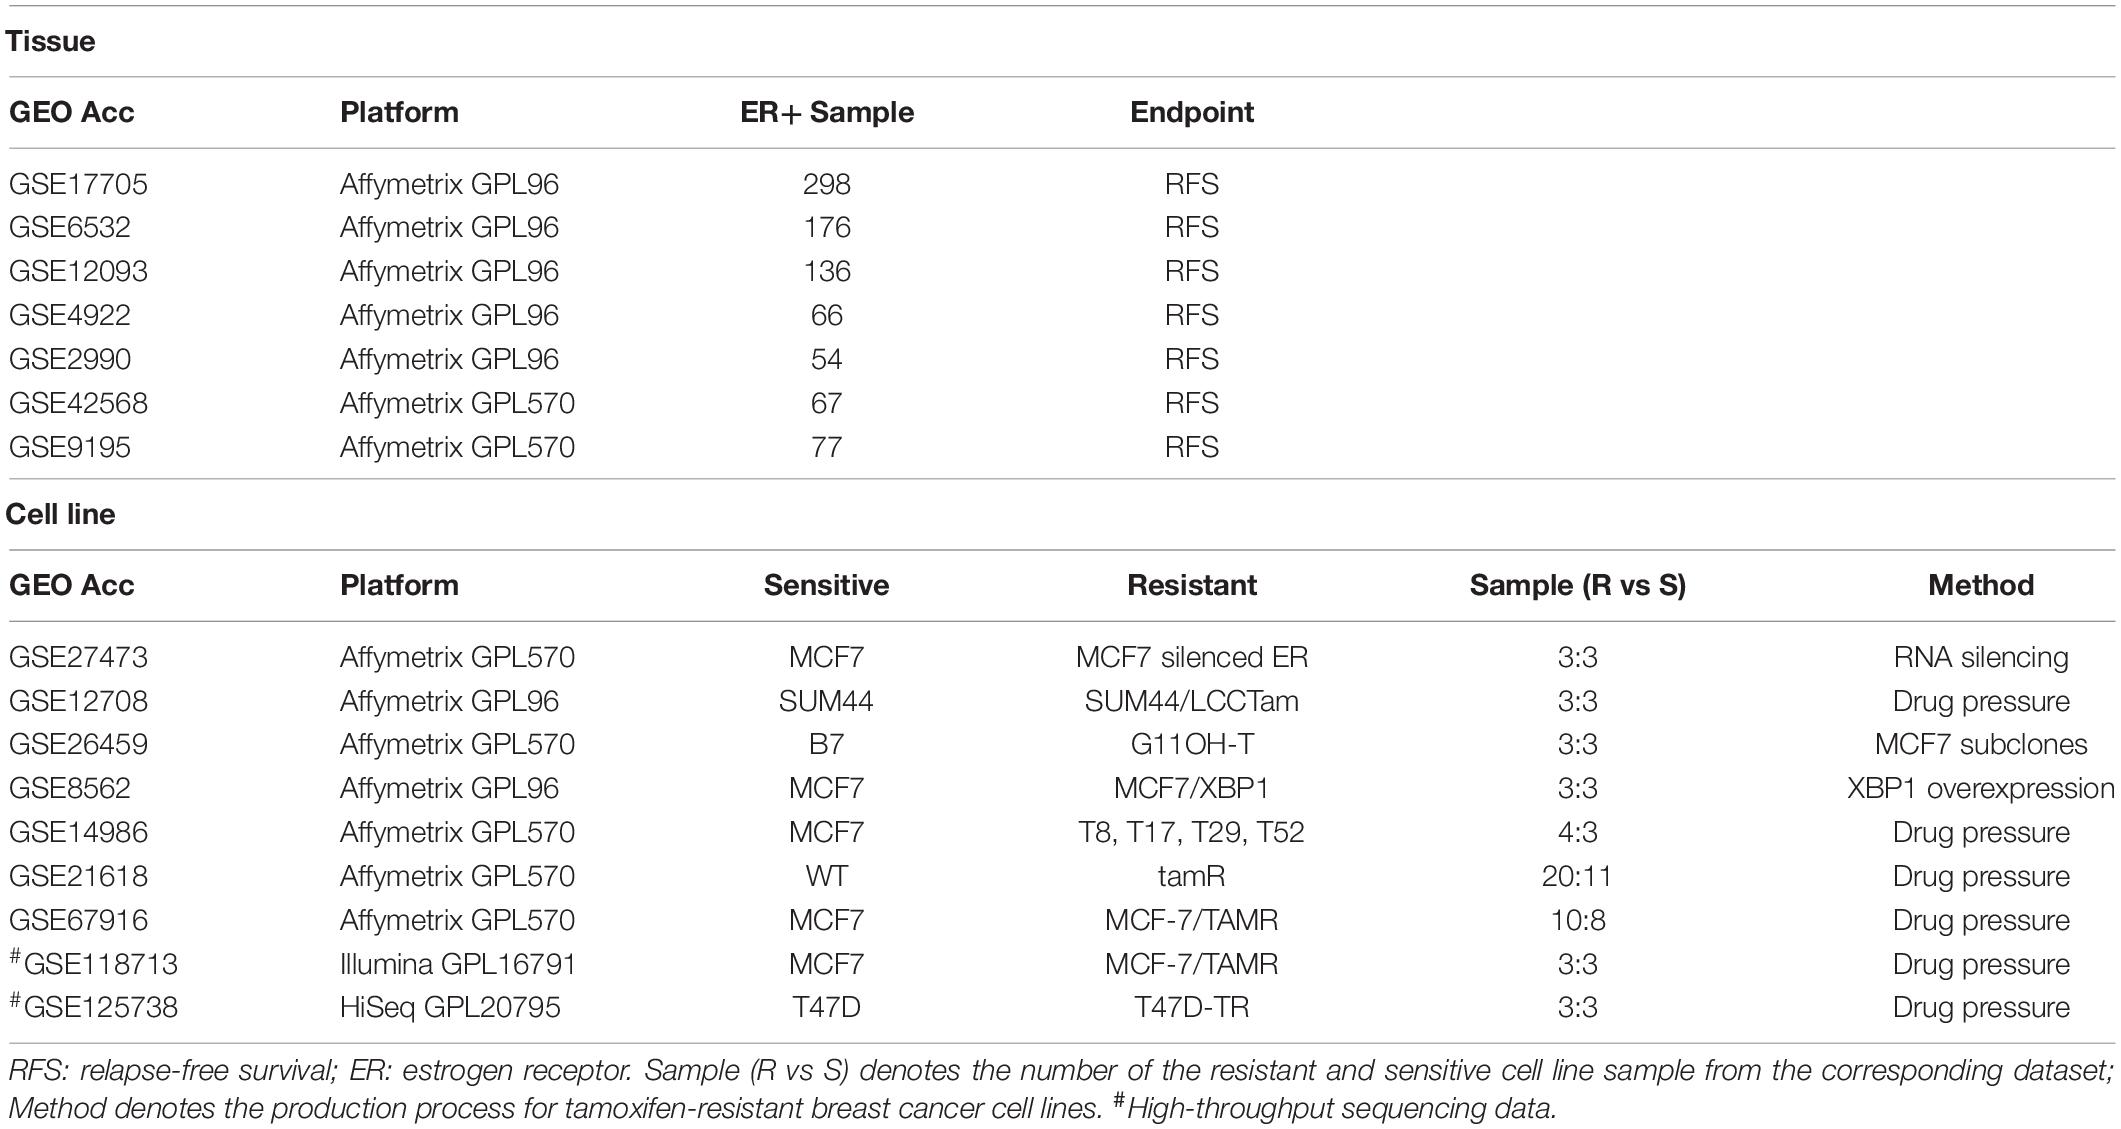
Table 1. Data used in this study.
For the array data measured by Affymetrix platform, raw mRNA expression data (.CEL files) were downloaded, and the Robust Multi-array Average algorithm was used for normalization with Affy package in R software (Bolstad et al., 2003; Irizarry et al., 2003). For sequence-based data, the processed data were directly downloaded.
Identification of Survival-related Genes in Tissue
The Cox proportional hazard model was used to study the relationships between gene expression levels and survival (Kreike et al., 2010). For the coefficient β obtained from the Cox model, if β > 0 for a certain gene, this gene was considered to be positively correlated with survival risk and was comparable with the upregulated gene between resistant and sensitive cell lines. Similarly, if β < 0, the gene was comparable with the downregulated gene between resistant and sensitive cell lines.
Identification of Differentially Expressed Genes (DEGs) in Cell Lines
In this study, the SAM (significance analysis of microarrays) algorithm (Tusher et al., 2001) was used to identify DEGs between resistant and sensitive cell lines.
Consistency Evaluation Between Tissues and Cell Lines
In this study, we hypothesized that genes positively (negatively) associated with survival in tissues corresponded to those genes upregulated (downregulated) between resistant and sensitive cell lines.
The consistency ratio, which is the number of overlapping and consistent DEGs/number of overlapping DEGs, was used to evaluate the similarity between tissues and cell lines. The significance was evaluated by the binomial distribution test as follows:
where n denotes the number of overlapping DEGs between tissue and cell line, and k denotes the number of those overlapping DEGs with the same dysregulation direction.
Then, the p-values were adjusted using the Benjamini-Hochberg method (Benjamini and Hochberg, 1995).
KEGG Pathway Enrichment
The hypergeometric distribution model was used to determine the significance of KEGG (Kanehisa and Goto, 2000) (Kyoto Encyclopedia of Genes and Genomes) pathways enriched with the genes of interest using the following statistical model:
where N denotes the number of background genes, n denotes the number of genes of interest, m denotes the number of genes in a given pathway, and k denotes the number of genes of interest in that pathway.
Identification of REO-based Tamoxifen-resistance Signature
Taking the consistent DEGs between tissues and cell lines as candidate genes, we used the Cox model and C-index analysis (Harrell et al., 1984) to develop a tamoxifen-resistance signature. The detailed process was described as follows.
Step 1: Selecting Survival-related Gene Pairs
(1) For the n candidate DEGs, pairwise comparisons were performed for all genes (generating a total of gene pairs), and this gene pair set was defined as Set 1. (2) From all gene pairs (Gi, Gj) in Set 1, the Cox model was used to select those that were significantly correlated with RFS of the tamoxifen-treated breast cancer patients. The set of significantly correlated gene pairs (FDR < 10%) was defined as Set 2.
Step 2: Optimizing the Gene Pair Signature
First, we enumerated all the gene pair combinations in Set 2. For each gene pair combination in a sample, if at least half of the gene pairs in the combination were consistent with tamoxifen sensitivity, the sample was identified as low risk; otherwise, it was considered high risk. Then, we calculated the C-index value for each gene pair combination, and selected the combination with maximum C-index as our tamoxifen-resistance signature (Set 3).
Results
Identification and Evaluation of DEGs in Cell Lines
A flowchart of the analysis procedure is shown in Figure 1. We identified the DEGs between tamoxifen-resistant and tamoxifen-sensitive cell line samples within each of the nine datasets using the SAM method (FDR < 20%). We also evaluated the consistency of DEGs among different datasets (a total of combinations). Among the 36 combinations, only 16 showed significant consistency (p < 0.05), as described in Table 2. These results indicate that there is greater heterogeneity among cell lines from different sources.
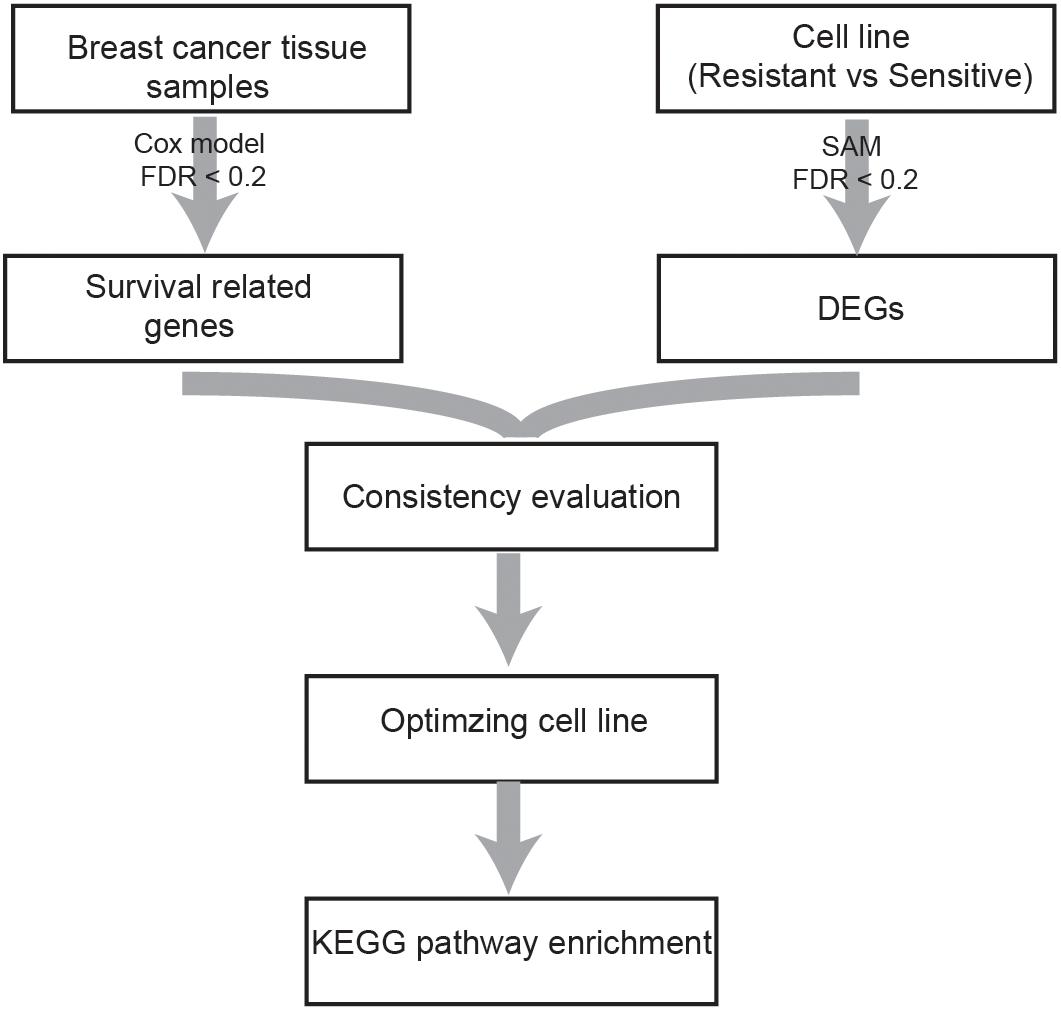
Figure 1. Flowchart of the analysis procedure.
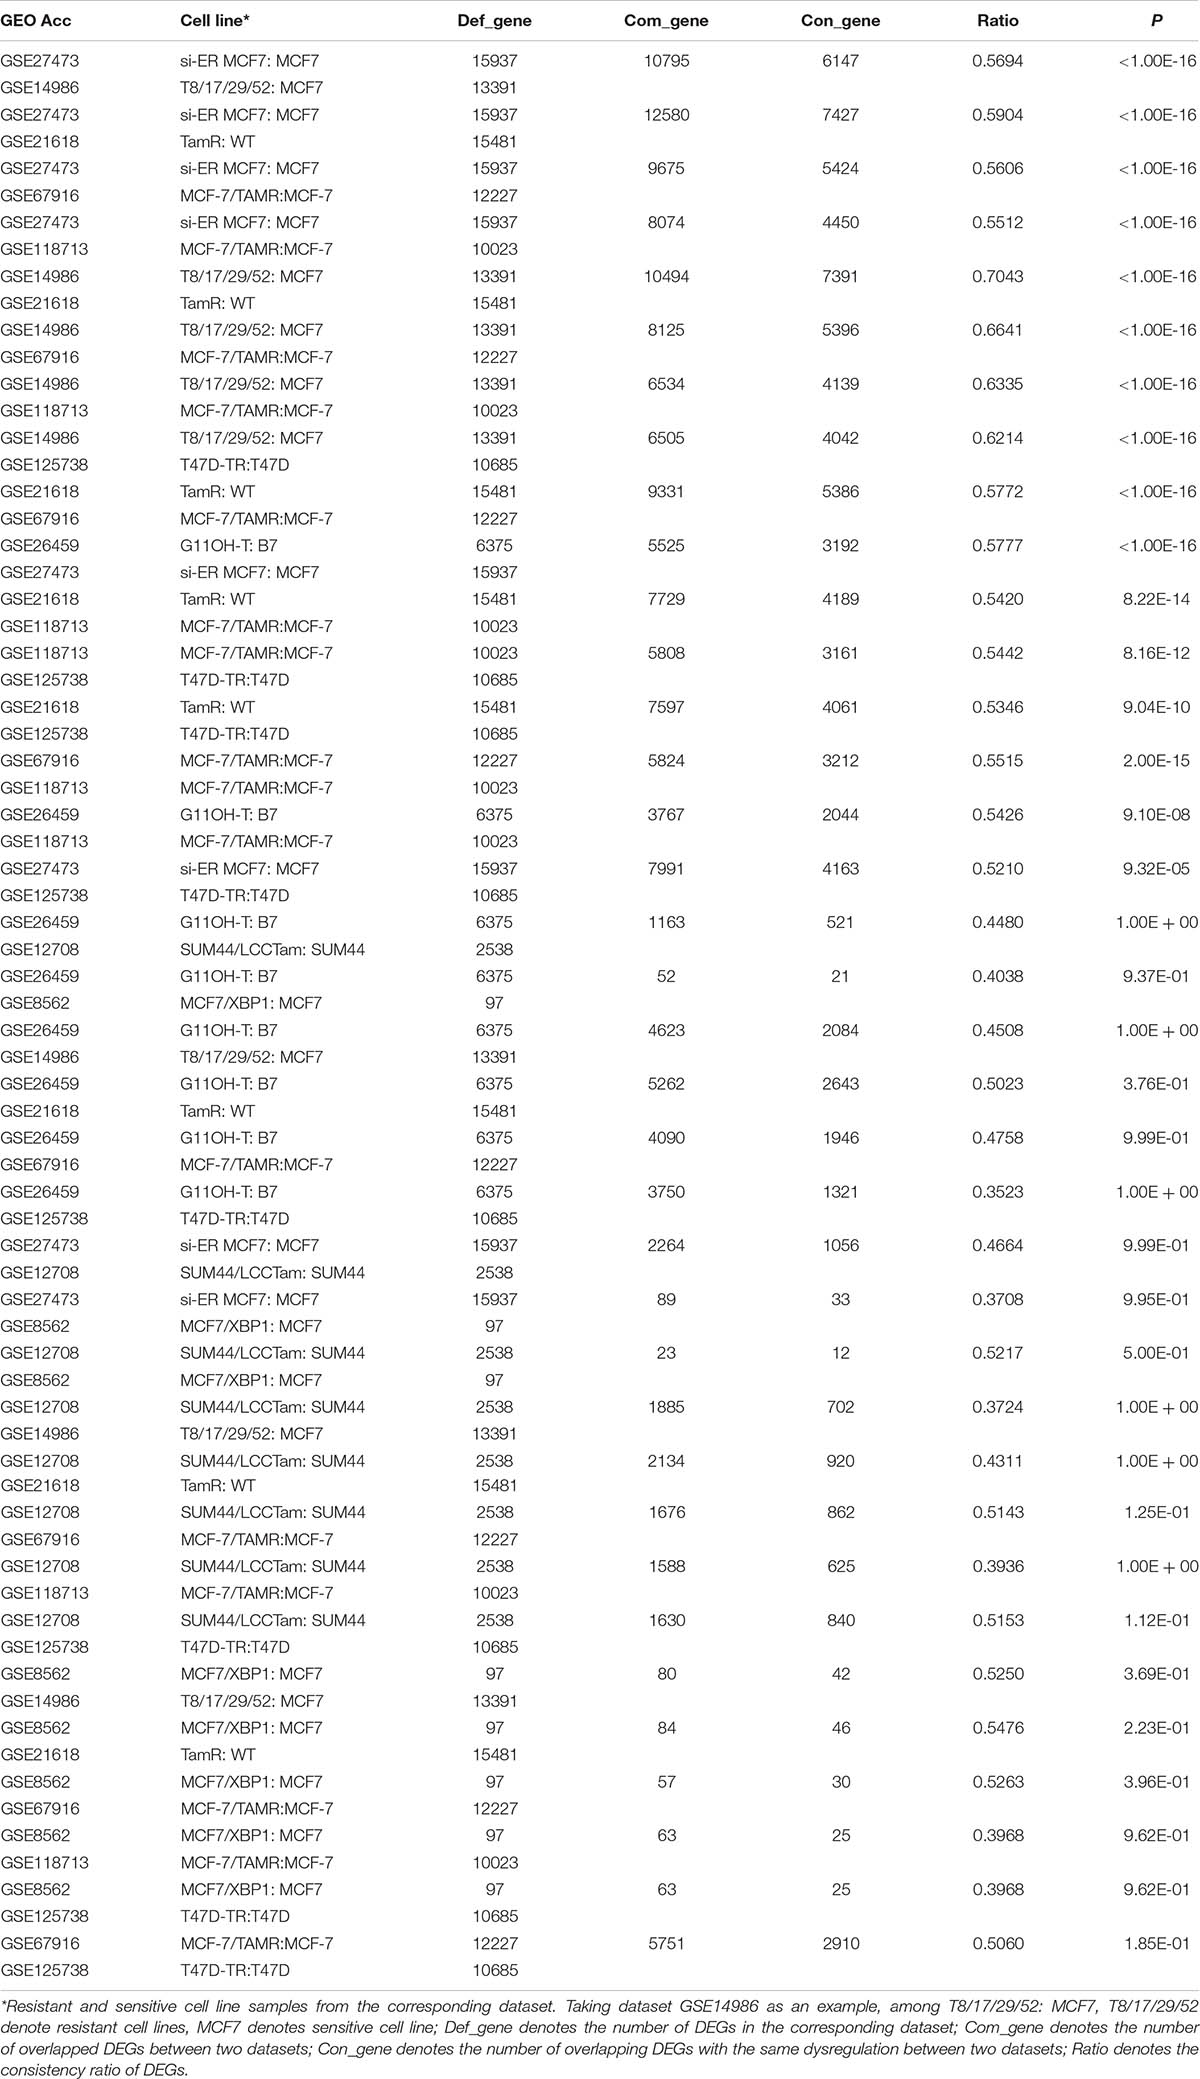
Table 2. Consistency evaluation of DEGs from different cell line datasets.
Identification of Tamoxifen Survival-related Genes in Tissues
Based on the univariate Cox regression model with FDR < 20%, 893 and 968 tamoxifen survival-related genes were identified in datasets GSE17705 and GSE6532, respectively; 235 genes were common to the two groups, all of which had the same dysregulation direction (which could not occur by chance; binomial test, p < 1.0E-16), further verifying the reliability of the results. These 235 genes were considered to be breast cancer tissue candidate genes.
Owing to the heterogeneity among cell lines, we evaluated the consistency between tissue candidate genes and DEGs from different cell line datasets (resistant vs sensitive) to select an optimal cell line model that could well represent the characteristics of clinical tissue samples. We found that only the DEGs from dataset GSE26459 were well reproduced among tissue candidate genes; the consistency ratio was above 73%, indicating that this did not occur by chance (binomial test, p = 2.13E-07). The DEGs from the other cell line datasets were not well reproduced among the tissue candidate genes (Table 3). These results demonstrate that the cell line data from dataset GSE26459 could well represent the characteristics of clinical breast cancer tissue samples.
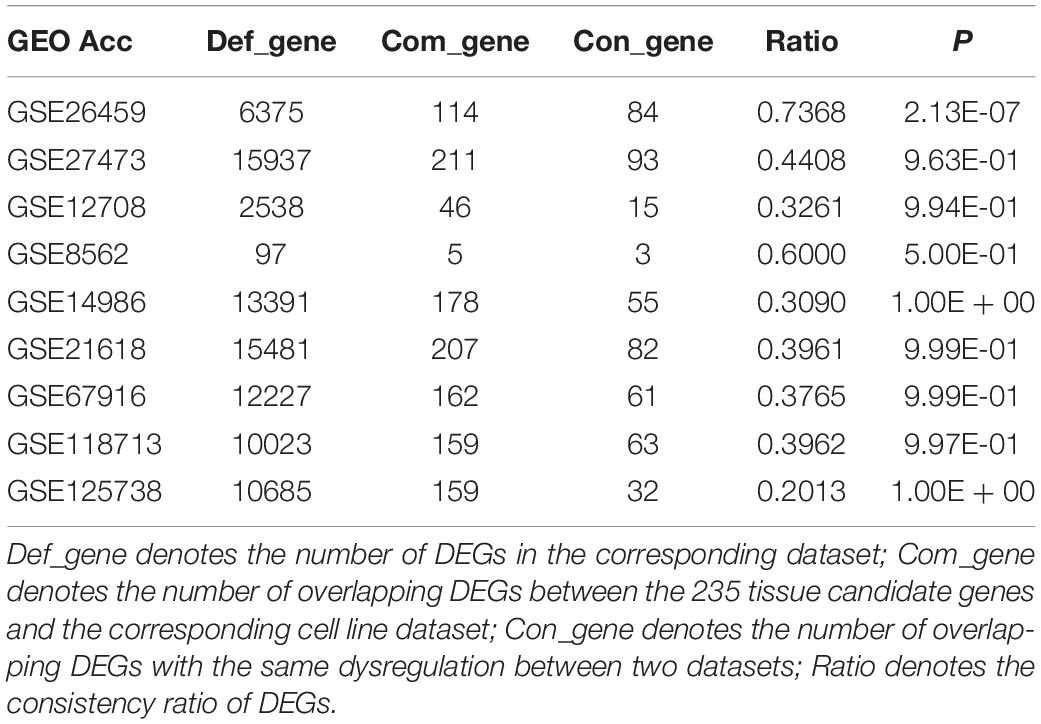
Table 3. Consistency evaluation between tissues and cell lines.
KEGG Pathway Enrichment
KEGG pathway enrichment analysis was performed for the 235 tissue candidate genes from datasets GSE17705 and GSE6532 using a threshold of FDR < 0.2, and for the DEGs from cell line dataset GSE26459 using the same threshold (Table 4). There was no pathway commonly enriched between tissues and the cell line, possibly owing to the low statistical power (Zou et al., 2011) or to partial differences between resistant and sensitive cell lines induced by tamoxifen treatment (Dancik et al., 2011). Thus, taking the pathways enriched in tissues as the gold standard, we obtained the p-values of these pathways in dataset GSE26459 (Table 4). With p < 0.2, the cell cycle, p53 signaling pathway, oocyte meiosis, and progesterone-mediated oocyte maturation were recurring themes in the pathway analysis for both tissues and cell lines. These pathways have been reported to be correlated with tamoxifen resistance.
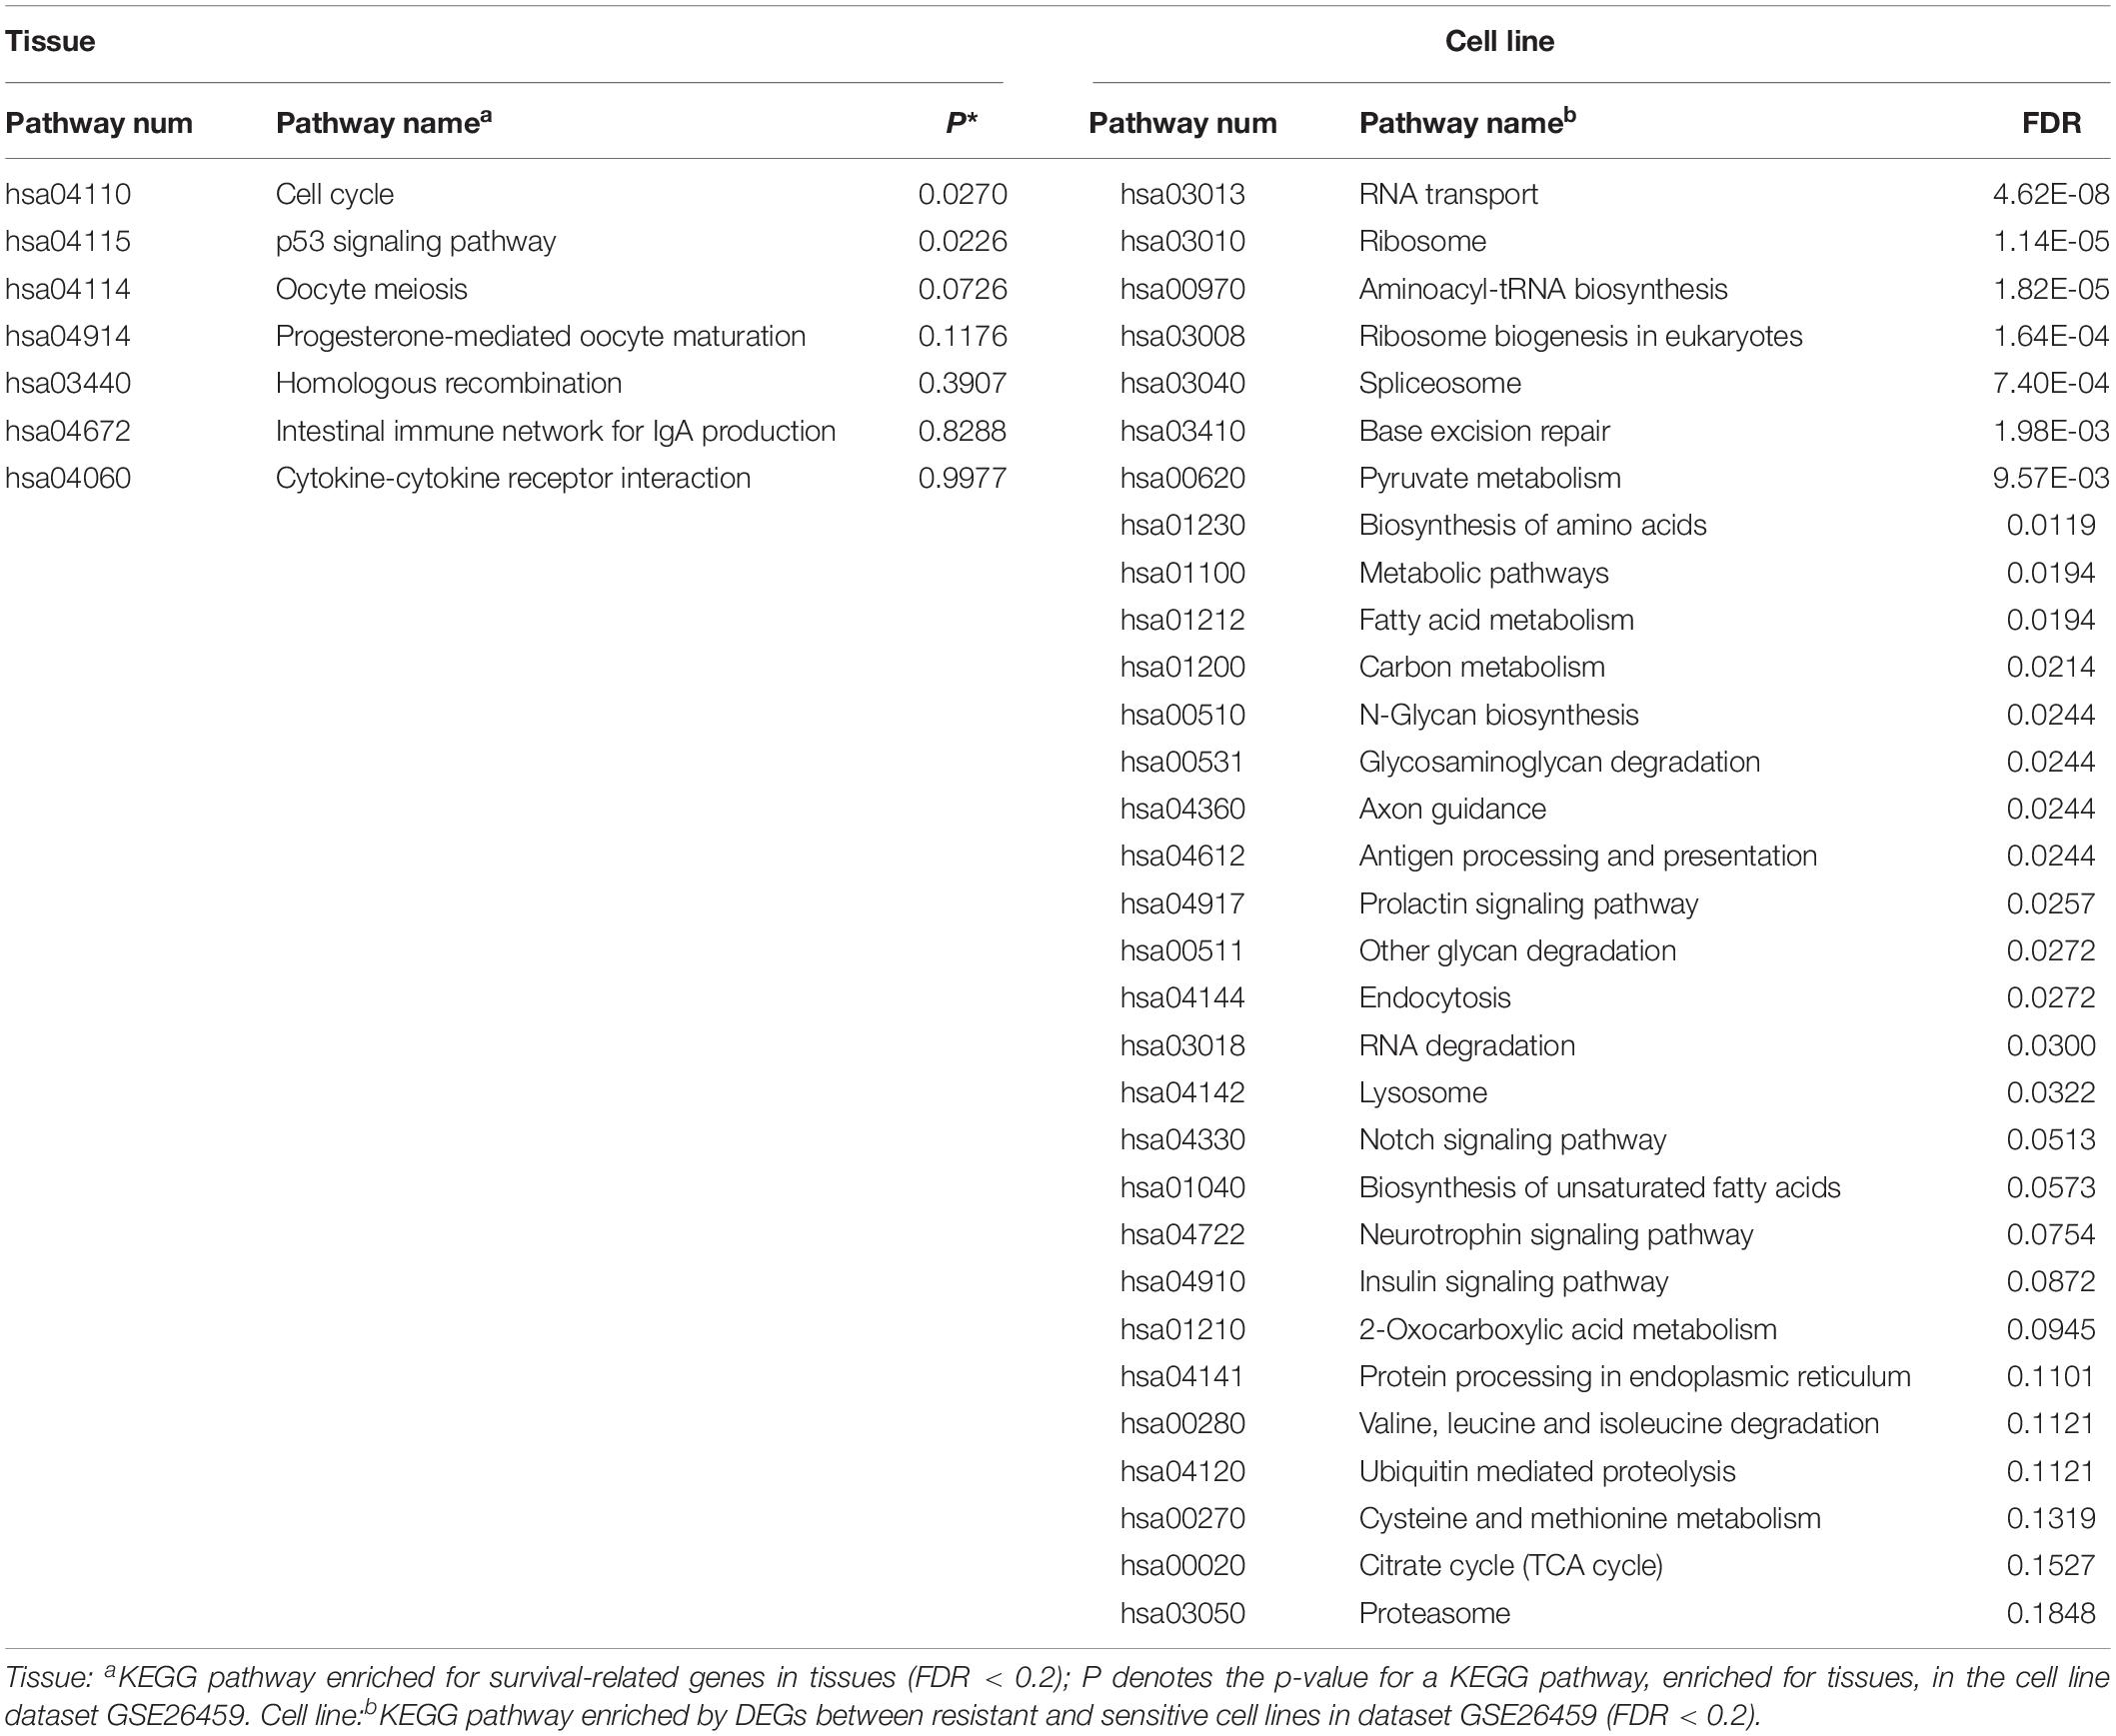
Table 4. KEGG pathway enrichment of tissue and cell line.
Studies have shown that tamoxifen could affect the cell cycle of human breast cancer cell lines, the major sensitivity to tamoxifen in terms of both inhibition of cell cycle progression and drug cytotoxicity occurring particularly in the G0-G1 stage (Taylor et al., 1983). Tamoxifen could also affect the mitosis of oocytes and lead to premature centromere separation (London and Mailhes, 2001). The PTEN protein, encoded by the gene, in the p53 signaling pathway has been shown to be associated with tamoxifen resistance (Shoman et al., 2005). Similarly, the PGR protein in the progesterone-mediated oocyte maturation signaling pathway has been shown to be associated with tamoxifen response (Elledge et al., 2000). In summary, the pathways found to be enriched in tissues and also in cell line dataset GSE26459 (p < 0.2) were correlated with tamoxifen resistance, further demonstrating that the cell line model from dataset GSE26459 could represent the characteristics of clinical tissue samples.
Moreover, with FDR < 20%, the DEGs from cell line dataset GSE26459 were enriched in 31 pathways, compared with only seven pathways for the genes from tissue samples. However, as shown in Table 4, many of the pathways enriched for the cell lines from dataset GSE26459 are associated with tamoxifen treatment. For example, the prolactin signaling pathway and neurotrophin signaling pathway are related to side effects of tamoxifen (Lamberts et al., 1982; El-Ashmawy and Khalil, 2014), indicating that some of the differences between resistant and sensitive cell lines were due to tamoxifen treatment.
Identification of Tamoxifen Response Signature
First, we considered the 84 consistent DEGs between tissues and cell line dataset GSE26459 to be clinical tamoxifen-resistance-related genes. In the training dataset GSE12093, pairwise comparisons were performed for all clinical tamoxifen-resistance-related genes, and all the gene pairs were analyzed with a univariate Cox regression model. With FDR < 10%, 20 gene pairs were identified that were significantly associated with RFS. Then, among the 20 gene pairs, we enumerated all the gene pair combinations to calculate their C-index values, and selected the gene combination with the maximum C-index as the tamoxifen response signature. Finally, two gene pairs (TOP2A, SLC7A5; NMU, PDSS1) were identified. Based on our signature and the majority vote rule, the training dataset samples could be divided into high- and low-risk samples, which had significantly different RFS (hazard ratio [HR] = 9.509, logrank p = 1.98E-07). Our signature was also verified in an independent validation test using combined data from datasets GSE4922 and GSE2990 (HR = 2.191, logrank p = 0.009909), as shown in Figure 2A. Moreover, we searched public databases again for breast cancer tissue samples treated only with post-operative tamoxifen, for which associated RFS information was available, to further verify the performance of our signature. Finally, two new independent datasets were obtained. For the breast cancer tissue samples from dataset GSE42568, 37 samples were identified as high risk, and 30 were identified as low risk (HR = 1.804, logrank p = 0.2), as shown in Figure 2B. For the breast cancer tissue samples from dataset GSE9195, 41 samples were identified as high risk and 36 as low risk (HR = 1.516, logrank p = 0.5), as shown in Figure 2C. Although the difference between the groups was not significant according to statistical tests, there was a clear trend indicating a difference in RFS between the high- and low-risk groups identified by our signature (Figure 2B-C). Moreover, we combined the above two datasets to further verify the performance of our signature. In the combined data from datasets GSE42568 and GSE9195, 78 samples were identified as high risk and 66 samples were identified as low risk (HR = 1.7, logrank p = 0.1), as shown in Figure 2D. In summary, the results indicate that our signature (consisting of two gene pairs) can predict drug efficacy to some extent.
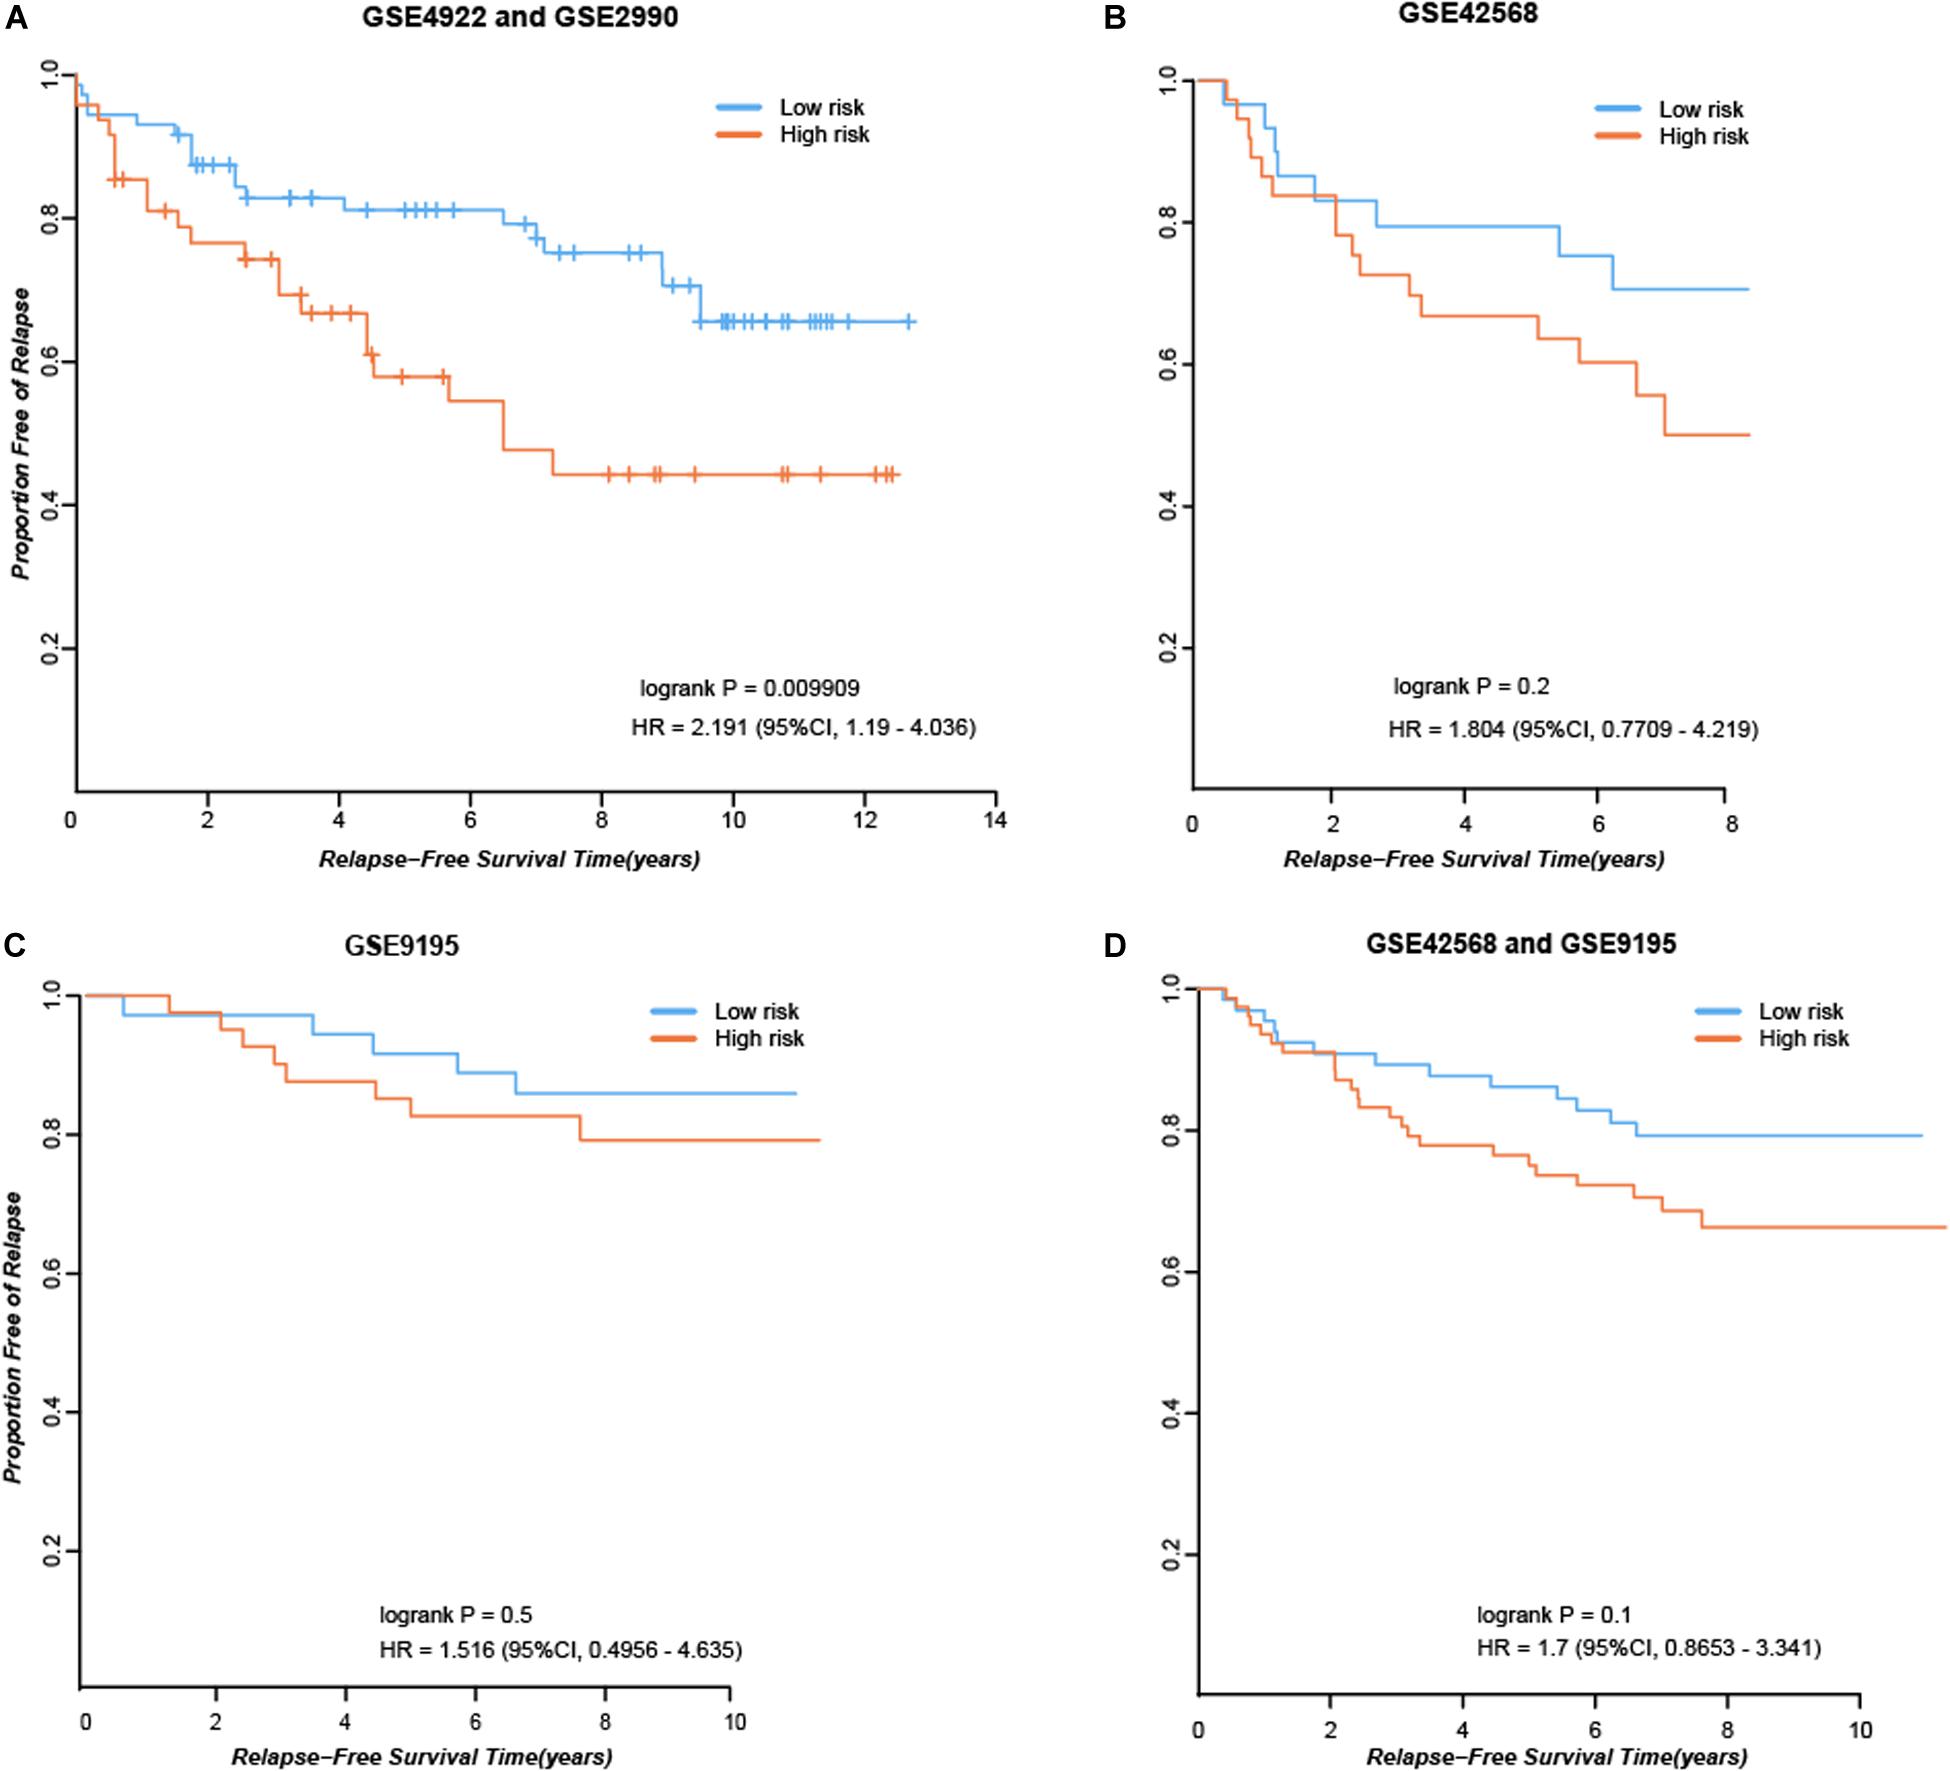
Figure 2. Performance of our signature in independent dataset. (A) RFS curves in the combined data from datasets GSE4922 and GSE2990. (B) RFS curves in the dataset GSE42568. (C) RFS curves in the dataset GSE9195. (D) RFS curves in the combined data from datasets GSE42568 and GSE9195.
Discussion
Cell line models are widely used in various fields of medical research, especially in basic cancer research and drug discovery (Masters, 2000; Mirabelli et al., 2019). Despite the successful application of cell lines in basic research, their use as model systems remains controversial (Masters, 2002; Sandberg and Ernberg, 2005; Peng et al., 2018; Hallas-Potts et al., 2019). Owing to issues such as cross-contamination, mislabeling, or the identification of drug resistance, some cell line models do not adequately represent the characteristics of clinical tissues. In this study, based on evaluation of the consistency of DEGs between tissues and cell lines, we selected the optimal cell line model to represent the characteristics of clinical tissue samples; this was further verified by pathway analysis. Our analysis method is also suitable for other types of cell line modes.
The tamoxifen survival-related genes identified in tissue samples from different datasets were significantly consistent, suggesting that the results were reliable. However, the DEGs found in tamoxifen-resistant and tamoxifen-sensitive cell lines from different sources were less reproducible, indicating that cell line models from different sources show more heterogeneity. Therefore, it will be of great clinical significance to screen for drug-resistant and drug-sensitive cell line models that better represent the characteristics of clinical tissue samples. According to our results, the DEGs from cell line dataset GSE26459 were reproducible in tissue samples, indicating that the cell line model from this dataset was representative of the characteristics of clinical tissue samples. Tissue samples were obtained by surgical resection before tamoxifen therapy. Thus, the survival-related genes obtained from tissues were intrinsic to the patient and not induced by tamoxifen treatment. The resistant and sensitive cell lines from dataset GSE26459 were selected from MCF subclones (Gonzalez-Malerva et al., 2011); this might partly explain why the cell lines from GSE26459 could represent the characteristics of clinical tissue samples. The pathways enriched in tissues and in cell line dataset GSE26459 (p < 0.2) have been reported to be associated with tamoxifen resistance (Lamberts et al., 1982; El-Ashmawy and Khalil, 2014). Moreover, the clinical tamoxifen-resistance gene-pair signature we developed was verified in independent validation dataset, which indicates that our signature has some power to predict response to tamoxifen therapy, and further demonstrates that we have selected appropriate tamoxifen-resistant and tamoxifen-sensitive cell line models.
Although the cell line models identified by our analytical method could well reflect the information of clinical tissue samples, there were some limitations. As patients with breast cancer usually have good prognosis, the endpoint of their follow-up is usually survival or recurrence time. Furthermore, as well as the effects of drugs, many factors including mood, marital status, and economic status could affect the survival of patients. The above factors might cause that some of the survival-related genes that we have identified are not involved in tamoxifen resistance. In future work, use of more tissue sample data or an improved algorithm should be considered. Moreover, as DNA methylation patterns, genomic changes, etc., might also predict sensitivity to drugs, the use of other types of data (such as microRNAs, DNA methylations, and genomic changes) in cell line model optimization deserve consideration in future studies.
Data Availability Statement
All datasets presented in this study are included in the article/supplementary material.
Author Contributions
QZG and XKS conceived the study, analyzed the data, produced the figures, performed the statistical analysis, and drafted the manuscript. ZZZ participated in the revision of the manuscript. YZZ and YTC searched the data and participated in the statistical analysis. JL conceived the study and participated in its design and coordination, helped to draft the manuscript, and supervised the work. All authors contributed to the article and approved the submitted version.
Funding
This work was supported by the China National Postdoctoral Program for Innovative Talents (BX20200115), National Natural Science Foundation of China (Grant numbers: 61602119 and 61702164), the Joint Technology Innovation Fund of Fujian Province (Grant number: 2017Y9109), Scientific and Technological Project of Henan Province (Grant numbers: 162102310461 and 172102310535), Natural Science Foundation of Henan Province (Grant number: 162300410184), and Scientific Research Project of Zhengzhou (Grant number: 153PKJGG128).
Conflict of Interest
The authors declare that the research was conducted in the absence of any commercial or financial relationships that could be construed as a potential conflict of interest.
Acknowledgments
I would like to especially thank my doctoral mentor Zheng Guo for help in my scientific research and life.
Abbreviations
DEGs, differentially expressed genes; GEO, Gene Expression Omnibus; ER +, estrogen receptor positive; KEGG, Kyoto Encyclopedia of Genes and Genomes; REO, relative expression ordering; RFS, relapse-free survival; SAM, significance analysis of microarrays.
References
American Type Culture Collection Standards Development Organization Workgroup ASN-0002 (2010). Cell line misidentification: the beginning of the end. Nat. Rev. Cancer 10, 441–448. doi: 10.1038/nrc2852
Bayer, I., Groth, P., and Schneckener, S. (2013). Prediction errors in learning drug response from gene expression data - influence of labeling, sample size, and machine learning algorithm. PLoS One 8:e70294. doi: 10.1371/journal.pone.0070294
Benjamini, Y., and Hochberg, Y. (1995). Controlling the false discovery(Rate): a practical and powerful approach to multiple testing. J. R. Statist. Soc. 57, 289–300. doi: 10.1111/j.2517-6161.1995.tb02031.x
Bolstad, B. M., Irizarry, R. A., Astrand, M., and Speed, T. P. (2003). A comparison of normalization methods for high density oligonucleotide array data based on variance and bias. Bioinformatics 19, 185–193. doi: 10.1093/bioinformatics/19.2.185
Capes-Davis, A., Bairoch, A., Barrett, T., Burnett, E. C., Dirks, W. G., Hall, E. M., et al. (2019). Cell lines as biological models: practical steps for more reliable research. Chem. Res. Toxicol. 32, 1733–1736. doi: 10.1021/acs.chemrestox.9b00215
Dancik, G. M., Ru, Y., Owens, C. R., and Theodorescu, D. (2011). A framework to select clinically relevant cancer cell lines for investigation by establishing their molecular similarity with primary human cancers. Cancer Res. 71, 7398–7409. doi: 10.1158/0008-5472.CAN-11-2427
Domcke, S., Sinha, R., Levine, D. A., Sander, C., and Schultz, N. (2013). Evaluating cell lines as tumour models by comparison of genomic profiles. Nat. Commun. 4:2126. doi: 10.1038/ncomms3126
Eddy, J. A., Sung, J., Geman, D., and Price, N. D. (2010). Relative expression analysis for molecular cancer diagnosis and prognosis. Technol. Cancer Res. Treat. 9, 149–159. doi: 10.1177/153303461000900204
El-Ashmawy, N. E., and Khalil, R. M. (2014). A review on the role of L-carnitine in the management of tamoxifen side effects in treated women with breast cancer. Tumour. Biol. 35, 2845–2855. doi: 10.1007/s13277-013-1477-1475
Elledge, R. M., Green, S., Pugh, R., Allred, D. C., Clark, G. M., Hill, J., et al. (2000). Estrogen receptor (ER) and progesterone receptor (PgR), by ligand-binding assay compared with ER, PgR and pS2, by immuno-histochemistry in predicting response to tamoxifen in metastatic breast cancer: a Southwest oncology group study. Int. J. Cancer 89, 111–117. doi: 10.1002/(sici)1097-0215(20000320)89:2<111::aid-ijc2>3.0.co;2-w
Gonzalez-Malerva, L., Park, J., Zou, L., Hu, Y., Moradpour, Z., Pearlberg, J., et al. (2011). High-throughput ectopic expression screen for tamoxifen resistance identifies an atypical kinase that blocks autophagy. Proc. Natl. Acad. Sci. U.S.A. 108, 2058–2063. doi: 10.1073/pnas.1018157108
Guan, Q., Zeng, Q., Yan, H., Xie, J., Cheng, J., Ao, L., et al. (2019). A qualitative transcriptional signature for the early diagnosis of colorectal cancer. Cancer Sci. 110, 3225–3234. doi: 10.1111/cas.14137
Hallas-Potts, A., Dawson, J. C., and Herrington, C. S. (2019). Ovarian cancer cell lines derived from non-serous carcinomas migrate and invade more aggressively than those derived from high-grade serous carcinomas. Sci. Rep. 9:5515. doi: 10.1038/s41598-019-41941-41944
Harrell, F. E. Jr., Lee, K. L., Califf, R. M., Pryor, D. B., and Rosati, R. A. (1984). Regression modelling strategies for improved prognostic prediction. Stat. Med. 3, 143–152. doi: 10.1002/sim.4780030207
International Cell Line Authentication Committee (2014). Cell line cross-contamination: WSU-CLL is a known derivative of REH and is unsuitable as a model for chronic lymphocytic Leukaemia. Leuk. Res. 38, 999–1001. doi: 10.1016/j.leukres.2014.05.003
Irizarry, R. A., Bolstad, B. M., Collin, F., Cope, L. M., Hobbs, B., and Speed, T. P. (2003). Summaries of Affymetrix GeneChip probe level data. Nucleic Acids Res. 31:e15. doi: 10.1093/nar/gng015
Kanehisa, M., and Goto, S. (2000). KEGG: kyoto encyclopedia of genes and genomes. Nucleic Acids Res. 28, 27–30. doi: 10.1093/nar/28.1.27
Knudsen, S., Jensen, T., Hansen, A., Mazin, W., Lindemann, J., Kuter, I., et al. (2014). Development and validation of a gene expression score that predicts response to fulvestrant in breast cancer patients. PLoS One 9:e87415. doi: 10.1371/journal.pone.0087415
Kong, D., and Yamori, T. (2012). JFCR39, a panel of 39 human cancer cell lines, and its application in the discovery and development of anticancer drugs. Bioorg. Med. Chem. 20, 1947–1951. doi: 10.1016/j.bmc.2012.01.017
Kreike, B., Hart, G., Bartelink, H., and van de Vijver, M. J. (2010). Analysis of breast cancer related gene expression using natural splines and the Cox proportional hazard model to identify prognostic associations. Breast Cancer Res. Treat. 122, 711–720. doi: 10.1007/s10549-009-0588-586
Lamberts, S. W., Verleun, T., and Oosterom, R. (1982). Effect of tamoxifen administration on prolactin release by invasive prolactin-secreting pituitary adenomas. Neuroendocrinology 34, 339–342. doi: 10.1159/000123324
Liedtke, C., Wang, J., Tordai, A., Symmans, W. F., Hortobagyi, G. N., Kiesel, L., et al. (2010). Clinical evaluation of chemotherapy response predictors developed from breast cancer cell lines. Breast Cancer Res. Treat. 121, 301–309. doi: 10.1007/s10549-009-0445-447
London, S. N., and Mailhes, J. B. (2001). Tamoxifen-induced alterations in meiotic maturation and cytogenetic abnormalities in mouse oocytes and 1-cell zygotes. Zygote 9, 97–104. doi: 10.1017/s0967199401001101
Masters, J. R. (2000). Human cancer cell lines: fact and fantasy. Nat. Rev. Mol. Cell Biol. 1, 233–236. doi: 10.1038/35043102
Masters, J. R. (2002). HeLa cells 50 years on: the good, the bad and the ugly. Nat. Rev. Cancer 2, 315–319. doi: 10.1038/nrc775
Merok, M. A., Ahlquist, T., Royrvik, E. C., Tufteland, K. F., Hektoen, M., Sjo, O. H., et al. (2013). Microsatellite instability has a positive prognostic impact on stage II colorectal cancer after complete resection: results from a large, consecutive Norwegian series. Ann. Oncol. 24, 1274–1282. doi: 10.1093/annonc/mds614
Mirabelli, P., Coppola, L., and Salvatore, M. (2019). Cancer cell lines are useful model systems for medical research. Cancers 11:1098. doi: 10.3390/cancers11081098
Peng, A., Xu, X., Wang, C., Ye, L., and Yang, J. (2018). A Bioinformatic profile of gene expression of colorectal carcinoma derived organoids. Biomed. Res. Int. 2018:2594076. doi: 10.1155/2018/2594076
Punt, C. J., Buyse, M., Kohne, C. H., Hohenberger, P., Labianca, R., Schmoll, H. J., et al. (2007). Endpoints in adjuvant treatment trials: a systematic review of the literature in colon cancer and proposed definitions for future trials. J. Natl. Cancer Inst. 99, 998–1003. doi: 10.1093/jnci/djm024
Sandberg, R., and Ernberg, I. (2005). Assessment of tumor characteristic gene expression in cell lines using a tissue similarity index (TSI). Proc. Natl. Acad. Sci. U.S.A. 102, 2052–2057. doi: 10.1073/pnas.0408105102
Shoman, N., Klassen, S., McFadden, A., Bickis, M. G., Torlakovic, E., and Chibbar, R. (2005). Reduced PTEN expression predicts relapse in patients with breast carcinoma treated by tamoxifen. Mod. Pathol. 18, 250–259. doi: 10.1038/modpathol.3800296
Taylor, I. W., Hodson, P. J., Green, M. D., and Sutherland, R. L. (1983). Effects of tamoxifen on cell cycle progression of synchronous MCF-7 human mammary carcinoma cells. Cancer Res. 43, 4007–4010.
Tusher, V. G., Tibshirani, R., and Chu, G. (2001). Significance analysis of microarrays applied to the ionizing radiation response. Proc. Natl. Acad. Sci. U.S.A. 98, 5116–5121. doi: 10.1073/pnas.091062498
Wass, M. N., Ray, L., and Michaelis, M. (2019). Understanding of researcher behavior is required to improve data reliability. Gigascience 8:giz017. doi: 10.1093/gigascience/giz017
Xu, L., Tan, A. C., Winslow, R. L., and Geman, D. (2008). Merging microarray data from separate breast cancer studies provides a robust prognostic test. BMC Bioinform. 9:125. doi: 10.1186/1471-2105-9-125
Ye, L., Lin, C., Wang, X., Li, Q., Li, Y., Wang, M., et al. (2019). Epigenetic silencing of SALL2 confers tamoxifen resistance in breast cancer. EMBO Mol. Med. 2019:e10638. doi: 10.15252/emmm.201910638
Keywords: breast cancer, tamoxifen, cell line, resistant, sensitive
Citation: Guan Q, Song X, Zhang Z, Zhang Y, Chen Y and Li J (2020) Identification of Tamoxifen-Resistant Breast Cancer Cell Lines and Drug Response Signature. Front. Mol. Biosci. 7:564005. doi: 10.3389/fmolb.2020.564005
Received: 20 May 2020; Accepted: 15 October 2020;
Published: 04 December 2020.
Edited by:
Cheng Zhang, KTH Royal Institute of Technology, SwedenReviewed by:
Khyati Shah, University of California, San Francisco, United StatesAnkita Thakkar, Burke Medical Research Institute, United States
Copyright © 2020 Guan, Song, Zhang, Zhang, Chen and Li. This is an open-access article distributed under the terms of the Creative Commons Attribution License (CC BY). The use, distribution or reproduction in other forums is permitted, provided the original author(s) and the copyright owner(s) are credited and that the original publication in this journal is cited, in accordance with accepted academic practice. No use, distribution or reproduction is permitted which does not comply with these terms.
*Correspondence: Jing Li, haerbinlisa@hotmail.com
†These authors have contributed equally to this work