Efficiency measurement based on novel performance measures in total productive maintenance (TPM) using a fuzzy integrated COPRAS and DEA method
 Ebru Turanoglu Bekar
- Department of Industrial and Materials Science, Chalmers University of Technology, Gothenburg, Sweden
Total Productive Maintenance (TPM) has been widely recognized as a strategic tool and lean manufacturing practice for improving manufacturing performance and sustainability, and therefore it has been successfully implemented in many organizations. The evaluation of TPM efficiency can assist companies in improving their operations across a variety of dimensions. This paper aims to propose a comprehensive and systematic framework for the evaluation of TPM performance. The proposed total productive maintenance performance measurement system (TPM PMS) is divided into four phases (e.g., design, evaluate, implement, and review): i) the design of new performance measures, ii) the evaluation of the new performance measures, iii) the implementation of the new performance measures to evaluate TPM performance, and iv) the reviewing of the TPM PMS. In the design phase, different types of performance measures impacting TPM are defined and analyzed by decision-makers. In the evaluation phase, novel performance measures are evaluated using the Fuzzy COmplex Proportional Assessment (FCOPRAS) method. In the implementation phase, a modified fuzzy data envelopment analysis (FDEA) is used to determine efficient and inefficient TPM performance with novel performance measures. In the review phase, TPM performance is periodically monitored, and the proposed TPM PMS is reviewed for successful implementation of TPM. A real-world case study from an international manufacturing company operating in the automotive industry is presented to demonstrate the applicability of the proposed TPM PMS. The main findings from the real-world case study showed that the proposed TPM PMS allows measuring TPM performance with different indicators especially soft ones, e.g., human-related, and supports decision makers by comparing the TPM performances of production lines and so prioritizing the most important preventive/predictive decisions and actions according to production lines, especially the ineffective ones in TPM program implementation. Therefore, this system can be considered a powerful monitoring tool and reliable evidence to make the implementation process of TPM more efficient in the real-world production environment.
1 Introduction
In today’s dynamic environment, having a consistent and sustainable production system is crucial for competitiveness; accordingly, Total Productive Maintenance (TPM) has become a prominent subject as a strategic power for manufacturing organizations (Brah and Chong, 2004; Pinjala et al., 2006). In the literature, a number of studies present the relationship between TPM and manufacturing performance (McKone et al., 2001; Brah and Chong, 2004; Bartz et al., 2014; Belekoukias et al., 2014; Singh and Ahuja, 2015; Wickramasinghe and Perera, 2016). According to the results of these studies, proper implementation of TPM has a positive impact on manufacturing performance. Thus, the relevant literature has defined several critical success factors for TPM implementation (Bamber et al., 1999; Ireland and Dale, 2006). In this context, measurement of TPM performance is significantly required for continuous improvement of the TPM implementation program (Piechnicki et al., 2015). When it comes to performance evaluation in TPM, overall equipment effectiveness (OEE) has widely been used as a performance measure, because TPM aims to maximize equipment effectiveness (Schippers, 2001; Waeyenbergh and Pintelon, 2002). Although OEE has been considered a standard measure for equipment performance (Chan et al., 2005), what it captures is only the effectiveness of TPM, not its efficiency.
OEE provides productivity behavior of only individual equipment. However, the evaluation of TPM performance should include an objective and comprehensive method based on multiple inputs and outputs instead of OEE and its extensions (Muchiri and Pintelon, 2008). For this context, in the literature, a few studies have been made related to the performance measurement in TPM implementation (Park, 2002; F.-K; Wang, 2006; Jeon et al., 2011). In these studies, Wang (2006) and Jeon et al. (2011) used Data Envelopment Analysis (DEA) to measure the efficiency of TPM implementation. Furthermore, a number of studies have been conducted to identify important factors in TPM (Ljungberg, 1998; Cua et al., 2001; McKone et al., 2001; Swanson, 2001; Sharma et al., 2006; Wang, 2006; Ahuja and Khamba, 2008; Singh and Gurtu, 2022). However, the findings from these studies demonstrate that there is still a lack of a methodological approach to determining how these important factors need to be selected, evaluated, and measured in a systematic way in a maintenance performance measurement system. Additionally, recent studies have also investigated that companies should also consider human-oriented factors as critical success factors in combination with the technical and economical ones when they are implementing TPM (Arunraj et al., 2014; Bekar and Kahraman, 2016; Peach et al., 2016; Sharma et al., 2016). Based on the aforementioned gap and gained knowledge from the literature, the motivation of this study is to develop a systematic framework to measure TPM performance using novel performance indicators including quantitative and qualitative information (e.g., availability of maintenance personnel, human-oriented indicators such as competence of maintenance personnel, the experience of operators in a production line, operator reliability, training, and continuing education, new ideas generated and implemented, level of 5S and employee satisfaction indicators such as employee absenteeism, employee turn-over rate and refusal of extended hours or overtimes). In this context, the developed framework is called the Total Productive Maintenance Performance Measurement System (TPM PMS) consisting of four phases from designing novel TPM performance indicators to reviewing the proposed TPM PMS. In each phase of the proposed framework, the different research questions are aimed to answer (e.g., what indicators are to be measured in the design phase of TPM PMS? How to evaluate the proposed indicators under some attributes in the evaluation phase of TPM PMS? How to use them to measure the performance of TPM in the implementation phase of TPM PMS? How to use TPM performance results for preventive/predictive decisions and actions in the review phase of TPM PMS? How to review and modify this system accordingly?). Overall, developing such TPM PMS is important because it allows companies to monitor their progress, identify areas for improvement, and continuously optimize their maintenance efforts to maximize equipment effectiveness and minimize downtime. This can result in lower maintenance costs, increased equipment reliability, improved product quality, and higher production capacity.
The rest of the paper is organized as follows. Section 2 explains related literature. Section 3 introduces the fundamentals of the proposed TPM PMS. In Section 4, an application of the proposed TPM PMS for the evaluation of TPM performance based on a real manufacturing case is presented. The results from the case study and contributions of the proposed TPM PMS are discussed in Section 5, and in the last section, conclusions are given.
2 State of the art
2.1 The positioning of the proposed TPM PMS in the literature
Park (2002) proposed a TPM analysis model including three stages. The first stage represents the effect of TPM factors on TPM performance. The second stage represents how TPM performance factors influence productivity. The third stage also represents the testing of the TPM analysis model with univariate and multivariate regression and correlation analyses and the results show that TPM performance factors improve productivity through TPM activity’s characteristics. Wang (2006) suggested a simple methodology for efficiency evaluation in TPM. In this study, DEA was used to evaluate the efficiency score when the utility function considers its many attributes. A prediction model by the multiple regression method was performed to obtain the expected efficiency score for checking the performance of implementing TPM. Wang (2006) measured TPM efficiency at the factory level using the DEA method, which has some limitations. Therefore, Jeon et al. (2011) measured three types of TPM efficiency by self-directed work teams (SDWTs) using DEA. Firstly, DEA efficiency scores of SDWTs were measured for three stages (stage 1: from TPM input to TPM intermediate output; stage 2: from TPM intermediate output to TPM final output, and stage 3: from TPM input to TPM final output). Then, the relationships between the three types of efficiency scores were analyzed by Spearman correlation analysis (Gibbons and Chakraborti, 1971). SDWTs were also clustered by the three types of TPM efficiency. Based on the results of the literature review, there are a few studies related to efficiency measurement in TPM implementation. In summary, while there are a few studies in the literature on TPM performance measurement, there are still gaps in the research that need to be addressed in order to develop best practices for TPM implementation (e.g., lack of standardization and lack of research on human factors of TPM). For instance, lack of standardization means that there is currently no widely accepted standard for TPM performance measurement, and many companies measure different metrics or use different approaches. This makes it difficult to compare results across companies and industries. Additionally, while TPM is often viewed as a technical or engineering-focused approach, there is a need for research that examines the human factors involved in TPM implementation. This includes factors such as employee engagement, training, and development as this study examines in the designing of novel performance indicators.
The aim of this study is to develop a new framework for the measurement of TPM performance based on novel performance indicators which include uncertain information or imprecise data. Fuzzy set theory, introduced by Zadeh (1965), provides a new mathematical tool to deal with the uncertainty of information (Zadeh, 2008). In the proposed TPM PMS, after the design of novel TPM performance indicators, these indicators are evaluated and measured using some methods under a fuzzy environment. For example, in the evaluation phase, since the evaluation involves multiple attributes, it can be thought of as multi-attribute decision-making (MADM) problem, and thus a method called COmplex PRoportional ASsessment of alternatives with Grey relations (COPRAS-G), which is one of the most popular MADM methods, is modified with fuzzy numbers, and thus fuzzy COmplex PRoportional ASsessment of alternatives (FCOPRAS) proposed by Turanoglu Bekar and Kahraman, (2016) is used for evaluation of novel TPM performance indicators. Then, in the implementation phase, a fuzzy data envelopment analysis (FDEA), which is a mathematical programming approach for the evaluation of performance with uncertainty pertinent to the existence of qualitative data set, is utilized to evaluate TPM performance based on these indicators. The fuzzy utility degrees obtained by the FCOPRAS method are integrated into the Generalized Fuzzy Data Envelopment Analysis with Assurance Region (GFDEA/AR) models in order to find efficient and inefficient TPM performance. In these models, desirable and undesirable performance indicators (inputs and outputs) are also considered which are explained in Section 3. The positioning and contributions of the proposed TPM PMS are summarized in Table 1.
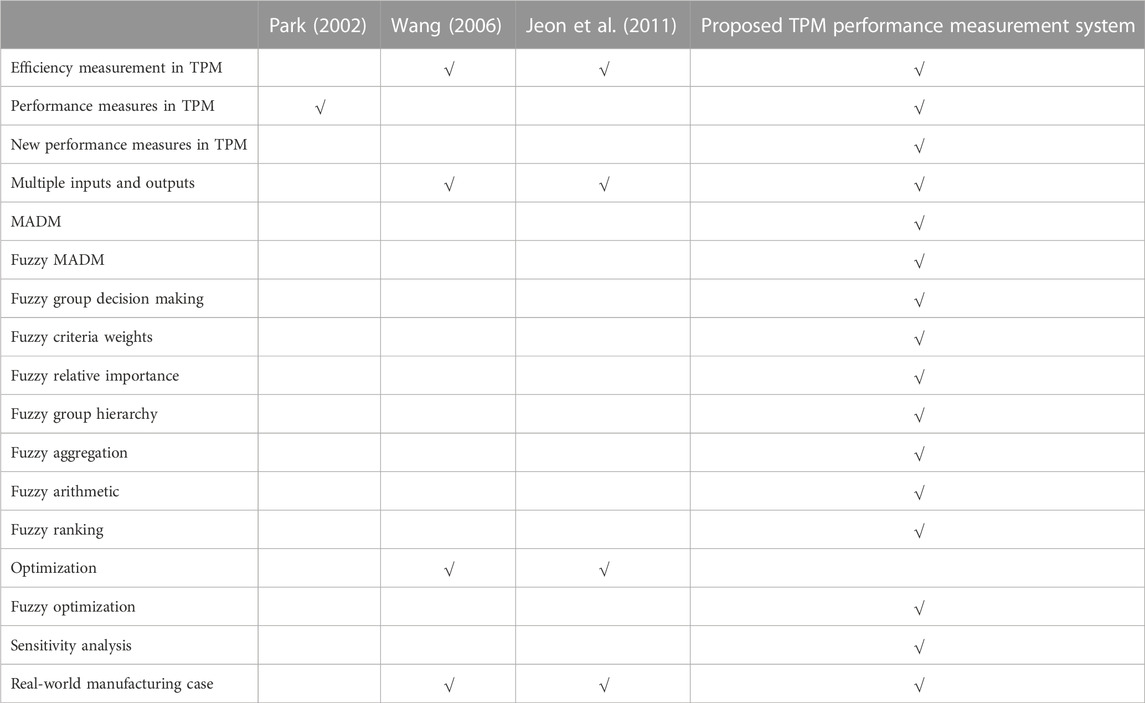
TABLE 1. The positioning of the proposed TPM PMS.
2.2 Literature review on FDEA methods integrated with MADM
DEA can be described as a series of models, whereas the type of returns to scale is what characterizes the two main ones: a) CRS (constant returns to scale), or CCR which is an acronym for Charnes, Cooper, and Rhodes (Charnes et al., 1978); and b) VRS (variable returns to scale) or BCC which is an acronym for Banker, Charnes, and Cooper (Banker et al., 1984) which is one of the broadenings of the CCR model where the efficient frontiers set is characterized by a convex curve passing through all efficient decision-making units (DMUs) and structured by both constant and -decreasing returns to scale (Faizrahnemoona et al., 2012). In brief, while the CCR model assumes that outputs always grow proportionally to inputs, in the BCC model this proportionality is not required, as a DMU may display returns to scale: a) increasing: where outputs grow proportionally more than inputs; b) constant: where there is proportionality; or c) decreasing: where outputs grow proportionately less than inputs (Mariano et al., 2015).
The traditional DEA models require accurate and precise performance data since it is a methodology focused on frontiers or boundaries (Gua and Tanaka, 2001). However, in real-world applications such as in a manufacturing system, a production process, or a service system, the observed data are volatile and complex and generally include uncertainty (Emrouznejad and Mustafa, 2012). In this context, the data with crisp numbers will not satisfy the real requirements and this restriction will diminish the practical flexibility of DEA in an application (Agarwal, 2014). Thus, imprecise or vague data can be represented with bounded intervals, ordinal (rank order) data or fuzzy numbers (Hatami-Marbini et al., 2011). Fuzzy set theory, established by Zadeh (1965), has been proven to be useful as a way to quantify imprecise and vague (expressed by linguistic variables) data in DEA models. Therefore, the DEA models with fuzzy data can more realistically represent real-world applications than the conventional DEA models (Lertworasirikul et al., 2003), which is also preferred to be used as a basis in this study. The applications of fuzzy set theory in DEA are generally classified into four groups (Lertworasirikul et al., 2003; Karsak, 2008) such as the tolerance approach, the α-level based approach, the fuzzy ranking approach, and the possibility approach. Emrouznejad et al. (2014) extended this classification and attached two new groups: the fuzzy arithmetic and the fuzzy random variables and other extensions of fuzzy sets. In this study, an integrated FCOPRAS-FDEA method is conducted. Therefore, this paper examines some articles that combine different MADM methods with FDEA; and then develops hybrid methods. According to the literature, AHP and FAHP are the most widely used MADM methods with FDEA, specifically for the application areas, which are facility layout design and supplier evaluation and selection, as summarized in Table 2. There has not been any study in the literature about the application and theory of combined FCOPRAS-FDEA methodology. Additionally, to the best knowledge of the author, this can be the first study that integrates the FCOPRAS-FDEA method to evaluate the performance of TPM with novel performance measures, which can be considered a significant contribution to the TPM literature.
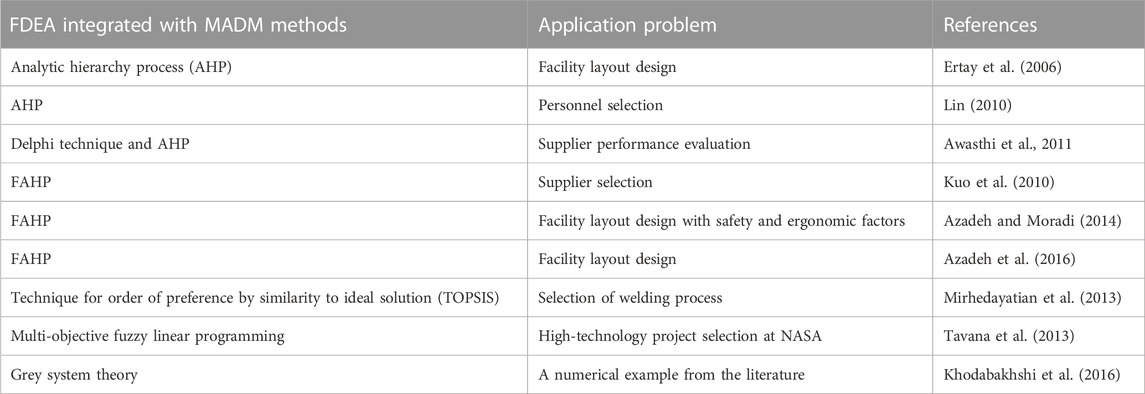
TABLE 2. The review on FDEA integrated with MCDM methods
3 Proposed TPM PMS
TPM implementation and practice is an organization-wide activity. Thus, to measure TPM implementation effectiveness, an organization-wide program is required based on some factors having an impact on TPM. In this study, the proposed TPM PMS is divided into four phases: i) the design of new performance measures, ii) the evaluation of the new performance measures, iii) the implementation of the new performance measures to evaluate TPM performance, and iv) the monitoring the TPM performance and reviewing the TPM PMS. Figure 1 shows the general overview of the proposed TPM PMS.
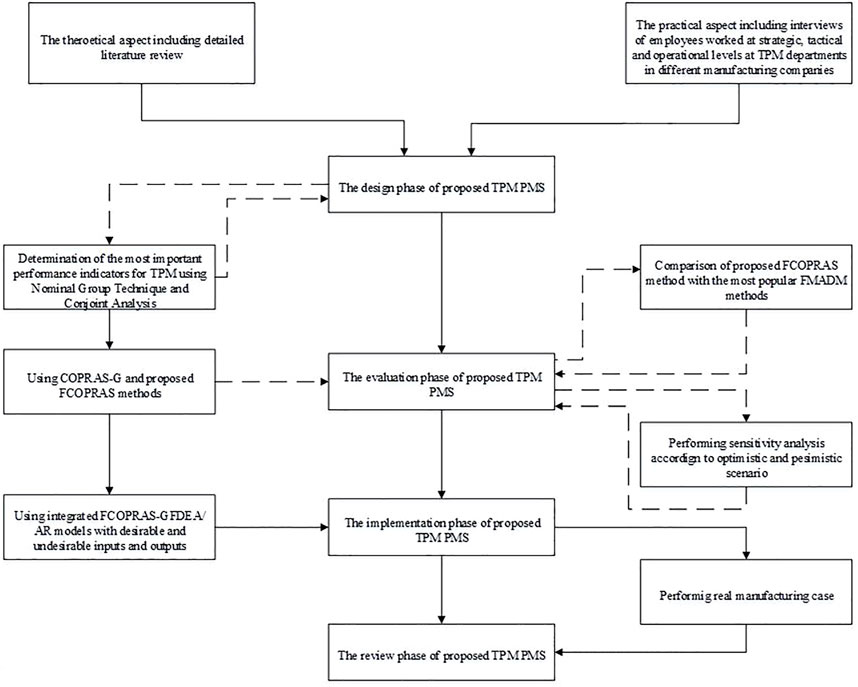
FIGURE 1. The general overview of the proposed TPM PMS.
In the design phase, various types of indicators which might impact TPM performance are designed based on the theoretical and practical aspects. Then, these TPM performance indicators (TPM PIs) are analyzed by the experts to identify the most important ones using the nominal group technique which is a group decision-making method, and the conjoint analysis which is a MADM method based on experimental design. In the evaluation phase, the TPM PIs proposed in the design phase are evaluated by using COPRAS-G, which is one of the recently developed and most popular MADM methods. Since the proposed TPM PIs include both quantitative and qualitative data, these are represented by linguistic variables, which are essentially from the insufficient and/or imprecise nature of data as well as the subjective and evaluative preferences of the expert. To evaluate these TPM PIs, the FCOPRAS method based on fuzzy group decision-making is also proposed in this phase. In the proposed FCOPRAS method, all fuzzy judgments and numbers are not converted to crisp values (or real numbers), and all calculations are performed in accordance with the fuzzy arithmetic operations and fuzzy ranking method (Turanoglu Bekar et al., 2016). In the implementation phase, the proposed TPM PIs are used to evaluate TPM performance using FDEA, which is a very effective method to evaluate the relative efficiency of decision-making units (DMUs) on the basis of multiple fuzzy inputs and outputs. The fuzzy relative significances of the proposed TPM PIs obtained by the FCOPRAS method are integrated into the FDEA models based on assurance region (AR) and undesirability approaches. In this regard, different GFDEA/AR models in the presence of desirable and undesirable inputs and outputs are proposed to measure TPM performance. The flow diagram of the integrated FCOPRAS-FDEA method is also illustrated in Figure 2. Finally, in the review phase, the proposed TPM PMS is periodically monitored and reviewed. Afterward, the necessary improvement, preventive decisions, and other actions should be made for the successful implementation of TPM.
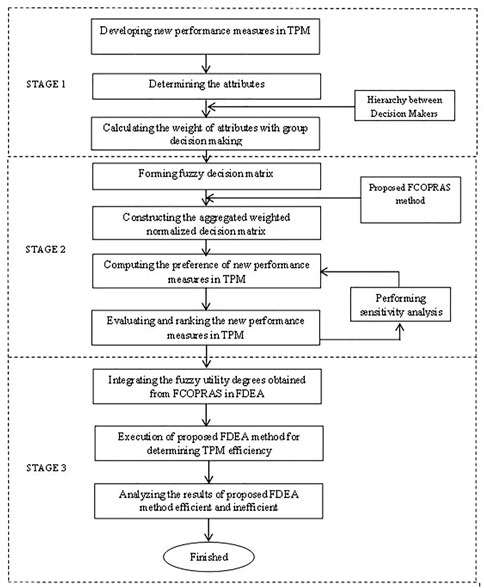
FIGURE 2. The flow diagram of the integrated FCOPRAS-FDEA method.
3.1 Mathematical description of the proposed FCOPRAS-FDEA models
The GFDEA/AR model proposed by Zhou et al. (2012) is one of the adapted models within the scope of this study. For a comprehensive overview of the GFDEA with AR, the reader is referred to Zhou et al. (2012). The fuzzy
Subject to;
where
In Model 1), the objective function in Eq. 1 calculates the lower bound of efficiency at any given α-cut level for the
In Model 2), the objective function in Eq. 9 calculates the upper bound of the efficiency at any given α-cut level for the
Subject to;
Secondly, Models 1) and 2) are extended by adding three different undesirability approaches. The first approach is the ignorance of undesirable outputs and desirable inputs. Thus, Models 1) and 2) are solved without any modifications. The second approach is to treat the undesirable outputs as inputs and the desirable inputs as outputs. In this way, Models 1) and 2) are solved without any modifications. Therefore, in these models, the number of inputs and outputs is only changed. Therefore, these models are called “Models 3) and 4)”. The third approach is to apply the FDEA model proposed by Puri and Yadav (2014) with ignorance of the desirable inputs. In this context, Models 1) and 2) are integrated with the FDEA model, and then Models 5) and 6) are obtained as demonstrated in Eqs 17–34. Here it should be also noted that Puri and Yadav (2014) used a method developed by Saati et al. (2002) to solve the FDEA model. However, Models 5) and 6) are proposed based on the approach developed by Kao and Liu (2000). In the Models 5) and 6), it is assumed that the performance of a homogeneous set of n DMUs (
Subject to;
where
In Model 5), the objective function in Eq. 17 calculates the lower bound of the efficiency at any given α-cut level for the
Subject to;
where
In Model 6), the objective function in Eq. 26 calculates the upper bound of the efficiency at any given α-cut level for the
The proposed models as mentioned above have some computational and practical implications, which are summarized below.
• They consider AR for inputs and outputs and perform together with the fuzzy multiattribute decision-making (FMADM) method, e.g., FCOPRAS, to increase their computational effort and reliability;
• They handle both desirable and undesirable inputs and outputs that are very suitable for analyzing complicated real-world problems;
• They account for the uncertainties inherent to real-world data using fuzzy sets to provide more flexibility for dealing with real-world cases;
• Solving these models leads to a fuzzy efficiency score (i.e., optimistic and pessimistic efficiency values according to different α-cut levels) for each DMU. This provides a practical and broader approach for the decision-makers.
4 Implementation of the proposed TPM PMS: A real manufacturing case study
This section presents a case study to implement the proposed TPM PMS in a manufacturing company that is operating in the automotive industry. Along with the core operating departments, there are support functions including the TPM department. In the TPM department, there are one lead engineer and four supervisors and 28 maintenance technicians. The overall TPM activities of this company are managed by the TPM-office. This company produces components of fuel injection systems. These components are tubular rail (CR), high pressure valve (HPV), and nozzle holder body (NHB). CR is manufactured in two segments which are “CR Machining” and “CR and Test”. HPV is manufactured in a separate assembly line and being assembled to rail in CR A&T line. NHB is manufactured in two segments as well as those “NHB Beginning of Line (BOL)” and “NHB End of Line (EOL)”. The selected production lines for this study to evaluate TPM performance, which are also called decision-making units in short DMUs, were “Rail Machining (DMU1)”, “Rail Assembly and HPV (DMU2)”, “NHB BOL (DMU3)”and “NHB EOL (DMU4)”.
Firstly, the proposed TPM performance indicators (TPM PIs) were evaluated by using the COPRAS-G and developed FCOPRAS methods, as presented in the study done by Turanoglu Bekar and Kahraman, (2016). The results obtained by the FCOPRAS method were compared with the most popular FMADM methods and its reliability is also validated by the sensitivity analysis. Afterward, these TPM PIs were classified as desirable and undesirable inputs and outputs, and then their fuzzy relative significances (i.e., fuzzy
4.1 Proposed TPM PIs in the design phase
This section answers the question what indicators are to be measured in the design phase of TPM PMS. Turanoglu Bekar and Kahraman, (2016) proposed an outline for defining different types of PIs impacting TPM and evaluated these PIs using COPRAS-G and proposed FCOPRAS methods. A detailed list of the proposed TPM PIs is given in Table 3.
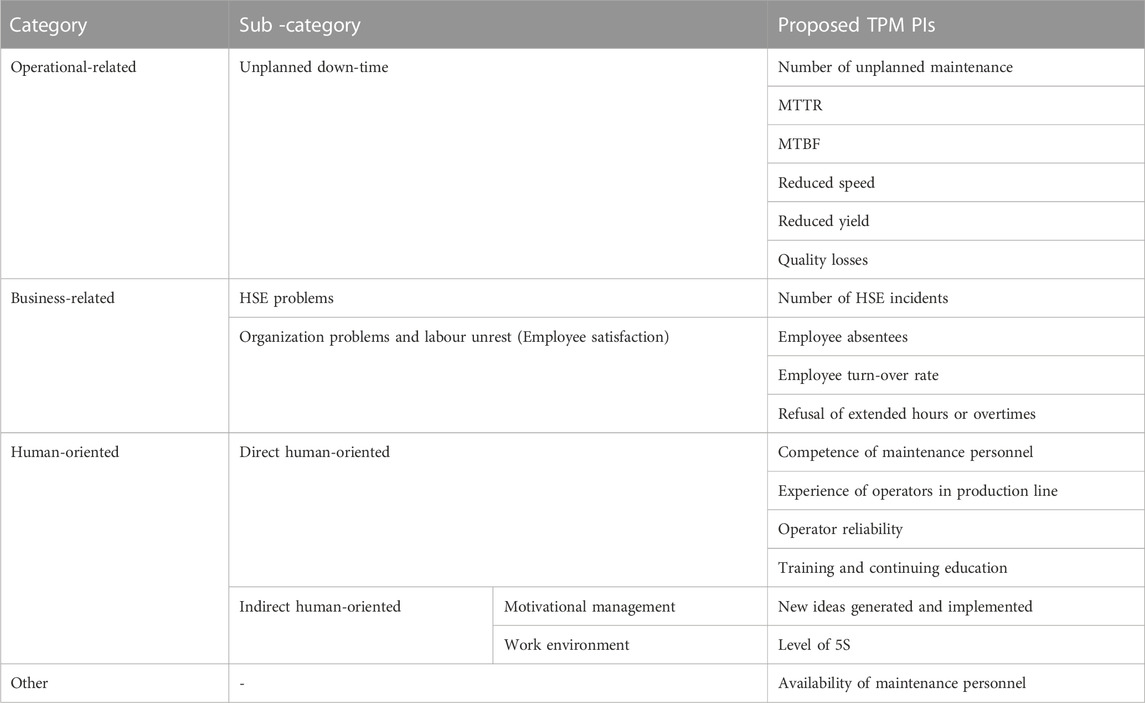
TABLE 3. A detailed list for the proposed TPM PIs.
According to Table 3, “operational-related indicators” are the production losses observed while running the plant. Since these are the most common problems observed in production, they are the ones analyzed regularly. “Business-related indicators” consist of problems at the entire business level. “Organizational problems or labor unrest” are stated employee satisfaction and also may cause the production to shut down leading to production loss. “Employee satisfaction indicators” can include morale, teamwork, and industrial harmony. Some of these are “employee absentees”, “employee turnover rate”, and “refusal of extended hours or overtime” (Parida and Chattopadhyay, 2007). “HSE problems” cause production to be slowed down or stopped. An indicator of HSE problems is the number of HSE incidents (Muchiri and Pintelon, 2010). Human factors represented by maintenance technicians and other related staff (e.g., machine operators are in direct contact with the maintenance activities and efforts because of the autonomous maintenance concept in TPM) are the backbone of the maintenance system in any organization (Ljungberg, 1998; Cabahug et al., 2004). Qualified and well-trained machine operators and maintenance technicians are the driving force behind any effective maintenance measurement system (Simoes et al., 2011). As such, the effectiveness of the different facets of the performance system is very much dependent on the competency, training, and motivation of the human factor in charge of the maintenance system (Peach et al., 2016). In this context, human-oriented factors are proposed to measure TPM performance. These factors are divided into two groups, direct and indirect human-oriented factors. Proposed indicators for direct human-oriented factors are “Competence of maintenance personnel”, “experience of operators in production line”, “operator reliability”, and “training and continuing education”. The indirect human-oriented factor is addressed from two different points such as motivation management and work environment. Proposed indicators for the motivational management and work environment are “new ideas generated and implemented”, and “5S level”, respectively. Another proposed indicator is “the availability of maintenance personnel”. This indicator is very important when breakdowns occur and should urgently be repaired. Thus, the availability of maintenance personnel needs to be looked into, because otherwise, it can act as a performance killer.
4.2 Evaluation of proposed TPM PIs using COPRAS-G and proposed FCOPRAS methods
This section answers the question how to evaluate the proposed indicators under some attributes in the evaluation phase of TPM PMS. The proposed TPM PIs are evaluated by COPRAS-G and the proposed FCOPRAS methods under some attributes determined by the committee according to the literature investigation. The committee consisted of three experts (TPM, Production, and Quality Managers), which were selected based on their knowledge and professional expertise about the subject under investigation according to the purposive sampling (Palys, 2008). Then, six criteria were identified, e.g., the specificity (i.e., clear and concentrated to keep away misunderstanding and it should contain measure suppositions and descriptions and be simply explained); the measurability (i.e., can be quantified and resemble other data; the attainability (i.e., is achievable, rational, and reliable under the conditions expected); the practicalness (i.e., conforms to the organization’s restrictions and is profitable); the timely (i.e., is available within the time frame given); and the cost of measure. The first five criteria are benefit attributes, while the last one is cost. The committee provided linguistic assessments for the six criteria and alternatives (TPM PIs) using the scales proposed by Jamalnia and Soukhakian (2009) as given in Table 4. It should be noted that the reader is referred to the study done by Turanoglu Bekar and Kahraman, (2016) for a more detailed explanation of the steps of the methods and the obtained result. Since the hierarchy between the experts in the committee was defined, thereby they were ranked in a fuzzy way, i.e.;
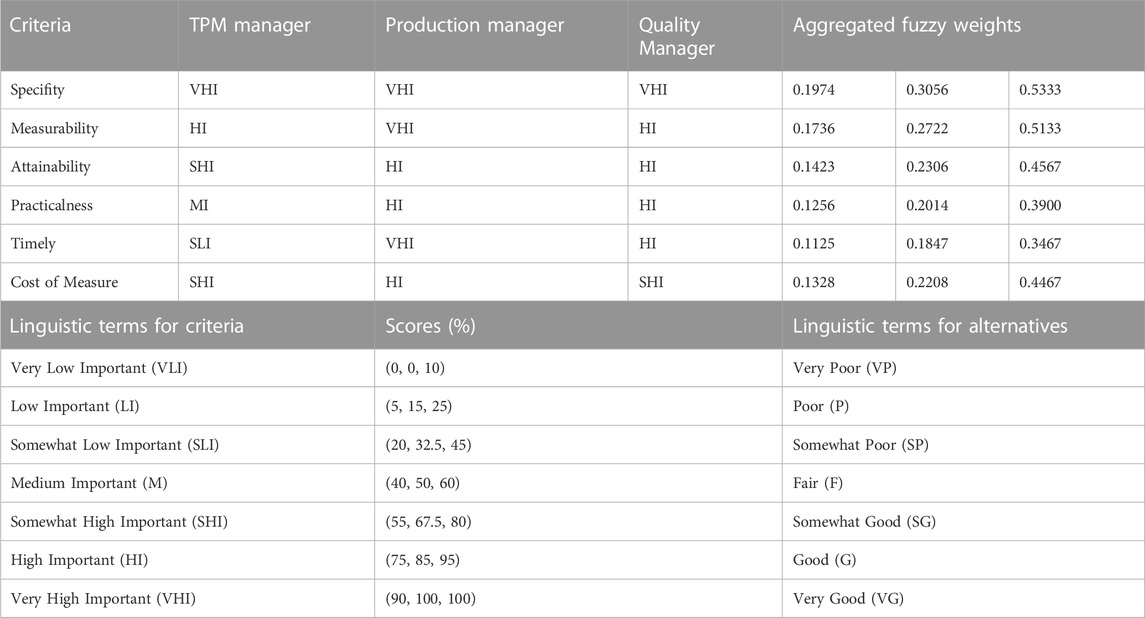
TABLE 4. Linguistic assessments for all of the criteria and their aggregated fuzzy weights.
The experts gave the linguistic terms presented in Table 4 to each criterion with respect to all alternatives based on their own judgments to construct the fuzzy decision matrix. The proposed method requires aggregation, averaging and normalization process of the fuzzy decision matrix as explained in detail in Turanoglu Bekar and Kahraman, (2016). In the proposed FCOPRAS method, all fuzzy judgments were not converted to real numbers and all calculations were performed in accordance with the fuzzy arithmetic and ranking. The ranking results of the proposed FCOPRAS method based on the different α-cut levels from 0 to 0.9 are given in Table 5.
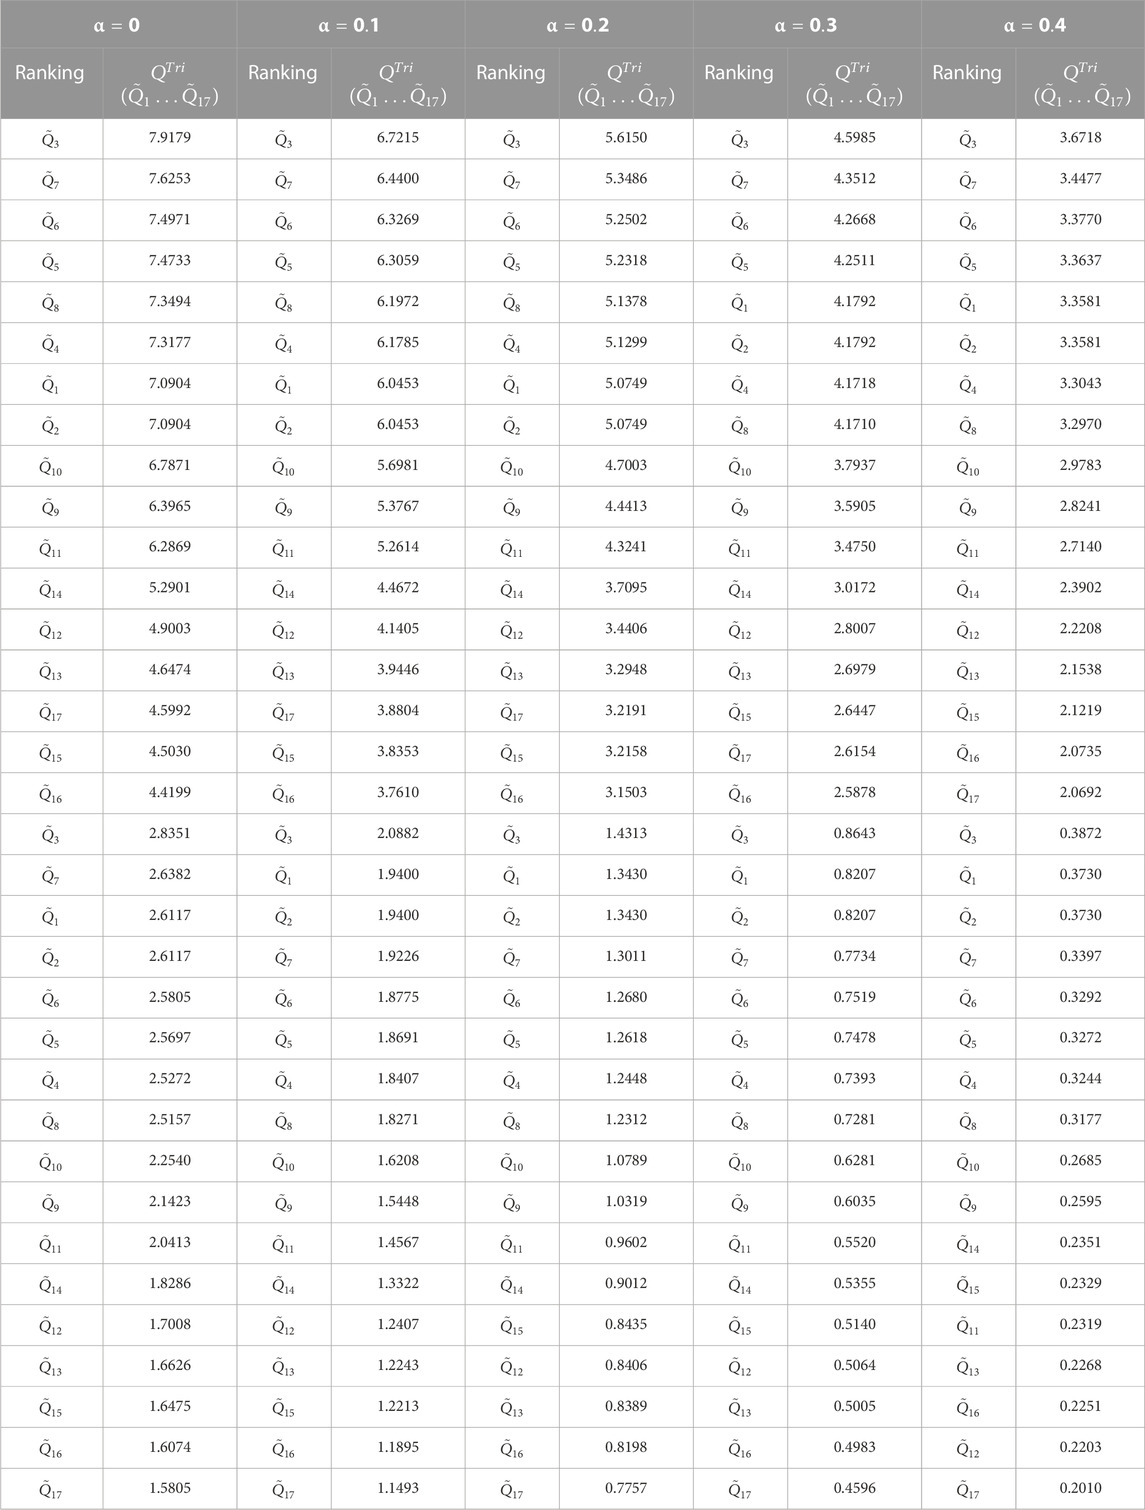
TABLE 5. The ranking of fuzzy
According to Table 5, the best alternative for all levels of α-cut is “the number of unplanned maintenance”. When transitioning from non-deterministic conditions (e.g., levels of α-cut being 0, 0.1, 0.2, and 0.3) to deterministic conditions (levels of α-cut approaching to 1), the ranking orders of the alternatives change. For example, at the deterministic conditions (e.g., levels of α-cut equal 0.6, 0.7, 0.8, and 0.9), while the best three alternatives are “the number of unplanned maintenance”, “MTTR”, and “MTBF”, the worst alternative is “refusal of extended hours or overtimes” for these α-cut levels. Furthermore, at the non-deterministic conditions (e.g., levels of α-cut equal 0, 0.1, 0.2, 0.3 and 0.4), while the best three alternatives are “the number of unplanned maintenance”, “quality defects”, and “reduced yield”, the worst alternative is “employee turn-over rate” for these α-cut levels. As a conclusion, the other alternatives have almost the same rankings for the different levels of α-cut.
The proposed FCOPRAS method was also compared to the other most popular FMADM methods, e.g., TOPSIS-F, fuzzy ARAS, VIKOR-F, fuzzy MULTIMOORA and fuzzy ELECTRE I (Kaya and Kahraman, 2010; Turskis and Zavadskas, 2010; Awasthi, et al., 2011; Balazentis et al., 2012; Hatami-Marbini et al., 2013; Kahraman et al., 2016). In order to measure the similarity between the ranks by the proposed FCOPRAS method and benchmarked FMADM methods, Spearman rank correlation coefficient (Gibbons and Chaakraborti, 2014) was calculated. The results of the Spearman test are given in Table 6.
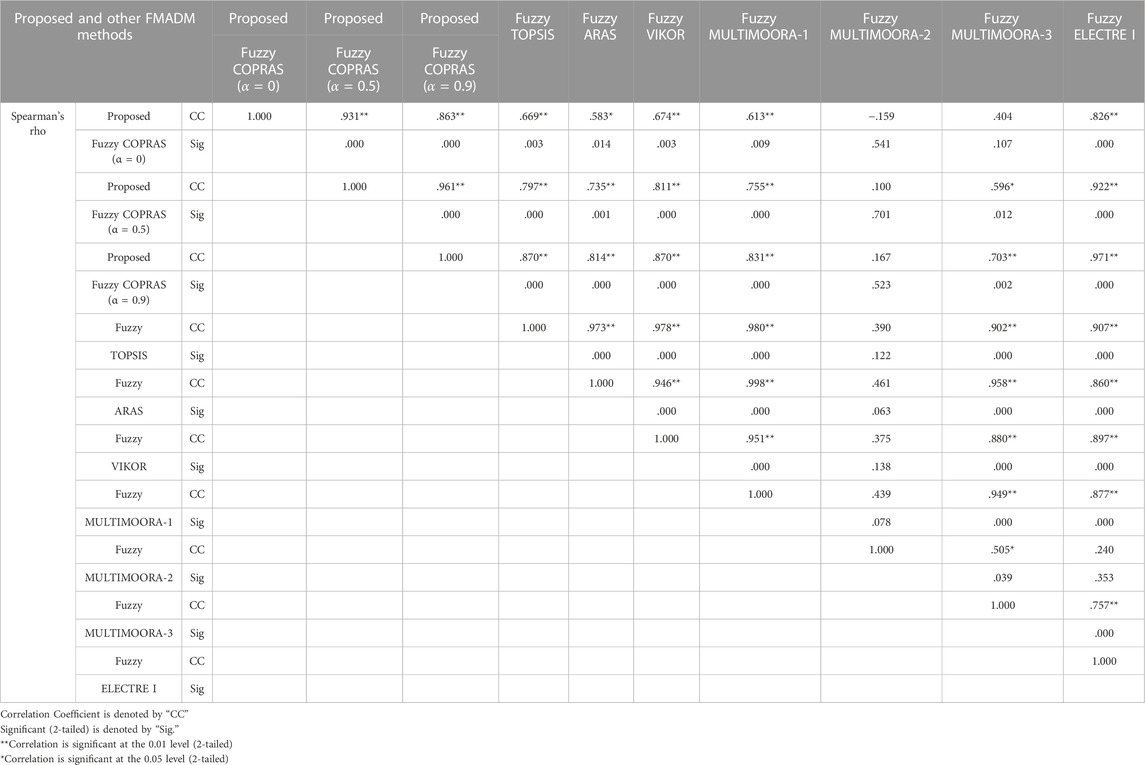
TABLE 6. Results of the Spearman test.
According to Table 6, the minimum and maximum correlation coefficient values are provided as −0.159 (fuzzy MULTIMOORA-2 that is fuzzy reference point) and 0.826 (fuzzy ELECTRE I) for α = 0, respectively. Furthermore, the maximum and minimum correlation coefficient values are provided as 0.1 (fuzzy MULTIMOORA-2) and 0.922 (fuzzy ELECTRE I) for α = 0.5. Finally, these values are yielded as 0.167 (fuzzy MULTIMOORA-2) and 0.971 (fuzzy ELECTRE I) in case of α = 0.9. These values support the similarity of the results and indicate that the proposed method has high correlation or substantial relationship with the selected most popular FMADM methods. Additionally, the correlations between fuzzy VIKOR and the proposed FCOPRAS methods for α = 0, α = 0.5 and α = 0.9 are high (0.674, 0.811 and 0.870, respectively). This means that these methods produce rankings that are statistically similar since there is not enough evidence to accept the null hypothesis in accordance with significant values 0.003, 0.000 and 0.000, respectively. In summary, the maximal correlation values can be provided by the calculation of the proposed FCOPRAS with α = 0.5 and α = 0.9.
4.2.1 Sensitivity analysis
In order to see the effects of the optimistic and pessimistic changes in the weights of the criteria, a sensitivity analysis were performed. The new weights of criteria were determined using the randomly generated linguistic assessment values for ten different cases. These cases were examined and the obtained results using by the proposed FCOPRAS method were illustrated in Figure 3.
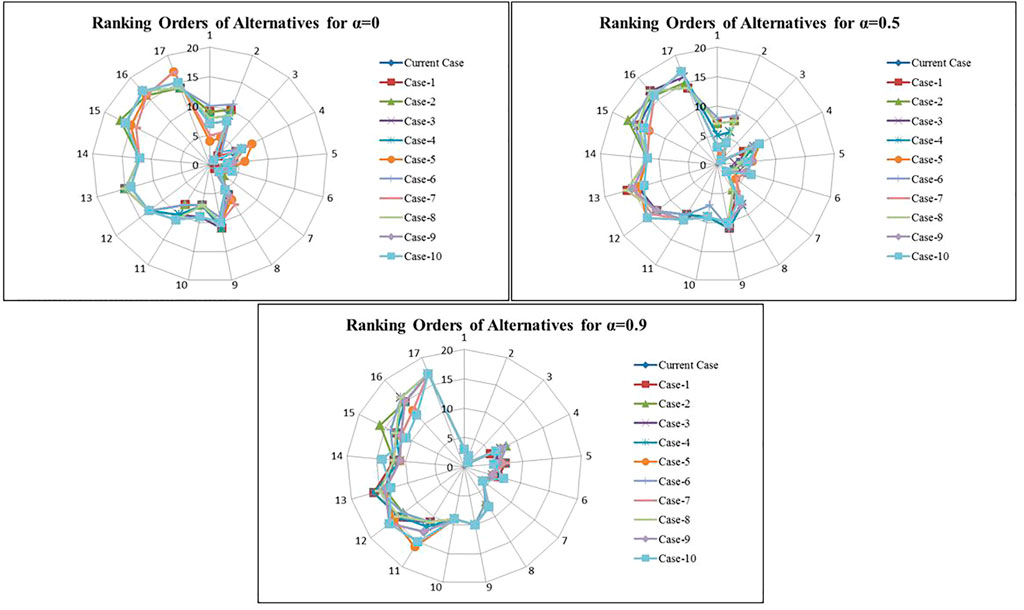
FIGURE 3. Ranking orders of alternatives for α = 0, 0.5, and 0.9 according to ten different cases.
Figure 3 shows the ranking orders of the alternatives according to the current and ten different cases for three α-cut levels, e.g., 0, 0.5, and 0.9. Here the current case represents the ranking order of the results obtained by the criteria weights originally assigned by the experts. When the α-cut level is 0, the alternative “the number of unplanned maintenance” is the best option in the current and other cases except for cases 1 and 6. In case 1, this alternative ranks as the second order and the best alternative is “quality defects”. In case 6, this alternative ranks as the third order and the best alternative is also “quality defects”. Additionally, the alternatives like “refusal of extended hours or overtimes” and “employee turn-over rate” are the worst options in most cases. Furthermore, the rank orders of the other alternatives generally change the bottom or the top order from the current order in all cases. When the α-cut levels are 0.5 and 0.9, the alternative “the number of unplanned maintenance” is still the best option in all cases for these α-cut levels. The alternatives such as “refusal of extended hours or overtimes” and “employee turn-over rate” are the worst options in most cases except case 2. In this case, the worst alternative is “employee absentees”. The alternatives such as “number of HSE incidents”, “reduced speed”, “reduced yield”, “quality defects”, “availability of maintenance personnel”, “competence of maintenance personnel”, and “experience of operators in production line” take place almost in the same rank order in all cases. The rank orders of the other alternatives generally change the bottom or the top order from the current order in all cases. As a result of the sensitivity analysis, even when weights of the criteria retrieve optimistic and pessimistic values, the rank orders of the alternatives do not change considerably. This indicates that the proposed FCOPRAS method is reliable for the evaluation of the proposed TPM PIs. Additionally, this method can be also used to assess different application problems.
4.3 Performance evaluation of TPM using the proposed TPM PIs
This section answers the question how to use the proposed TPM PIs to measure the performance of TPM in the implementation phase of TPM PMS. The GFDEA/AR models (see section 3.1.1) that integrate the proposed FCOPRAS and FDEA methods were implemented to evaluate the performance efficiency of TPM for four production lines in other words the DMUs as described at the beginning of Section 4.
4.3.1 Determination of desirable and undesirable inputs and outputs
Firstly, the proposed TPM PIs (alternatives) given in Table 3 were classified as inputs and outputs, and then they were determined as desirable and undesirable inputs and outputs; Table 7 presents a list of the desirable and undesirable inputs and outputs and their corresponding fuzzy
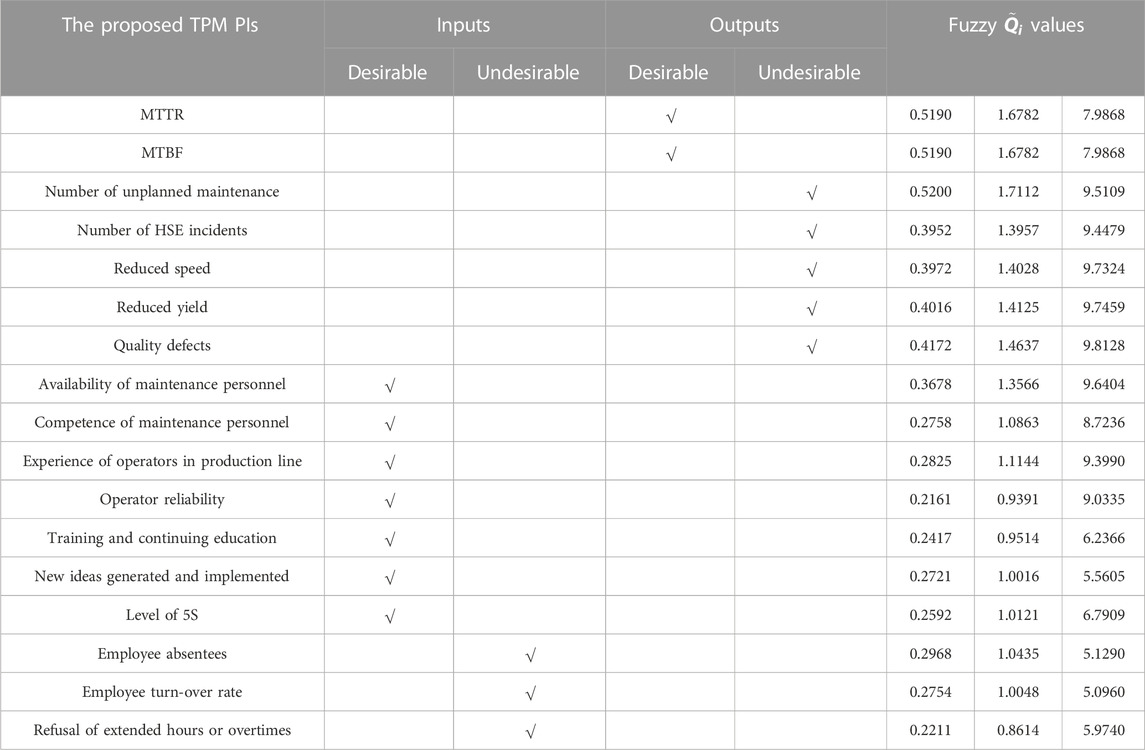
TABLE 7. A list for desirable and undesirable inputs and outputs and their fuzzy
The relevant data of “MTRR”, “MTBF”, “the number of unplanned maintenance”, “quality defects”, “the number of HSE incidents”, and “reduced yield” are crisp values, which can be treated as degenerated Triangular Fuzzy Numbers (TFNs). “Reduced speed” which cannot be assessed by exact data, is represented as TFNs. In these inputs, “new ideas generated and implemented”, “level of 5S” and “employee absentees” are crisp, which can be treated as degenerated TFNs. In addition, “employee turn-over rate” and “training and continuing education” were scored by approximate value according to production lines. Hence, they were represented as TFNs. The inputs “availability of maintenance personnel”, “operator reliability” and “refusal of extended hours or overtimes” are evaluated from the observations of the production line supervisor and team leader using fuzzy linguistic scale such as “very low”, “low”, “medium”, “high” and “very high”. The membership functions of these inputs are shown in Figure 4, which can be regarded as degenerated TFNs. The relevant data of “competence of maintenance personnel” is a crisp value, which can be treated as degenerated TFN and it was obtained from the table of ability for maintenance personnel in the company. Finally, the relevant data of the input “experience of operators in production line” was assessed according to years of relevant work experience on a specific machine and operation and also working time in the company, which is a crisp value, and can be treated as a degenerated TFN.
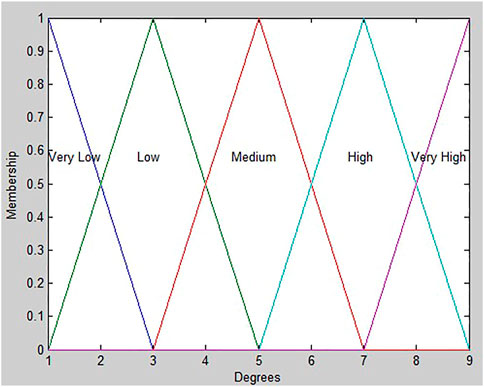
FIGURE 4. The membership functions of the inputs “availability of maintenance personnel”, “operator reliability” and “refusal of extended hours or overtimes”.
In order to rectify the problems due to the significant differences in the magnitude of inputs and outputs, the linear scale transformation was used to convert the various inputs and outputs scales into a comparable scale. In this context, the obtained fuzzy normalized values of all inputs and outputs regarding the DMUs are listed in Table 8.
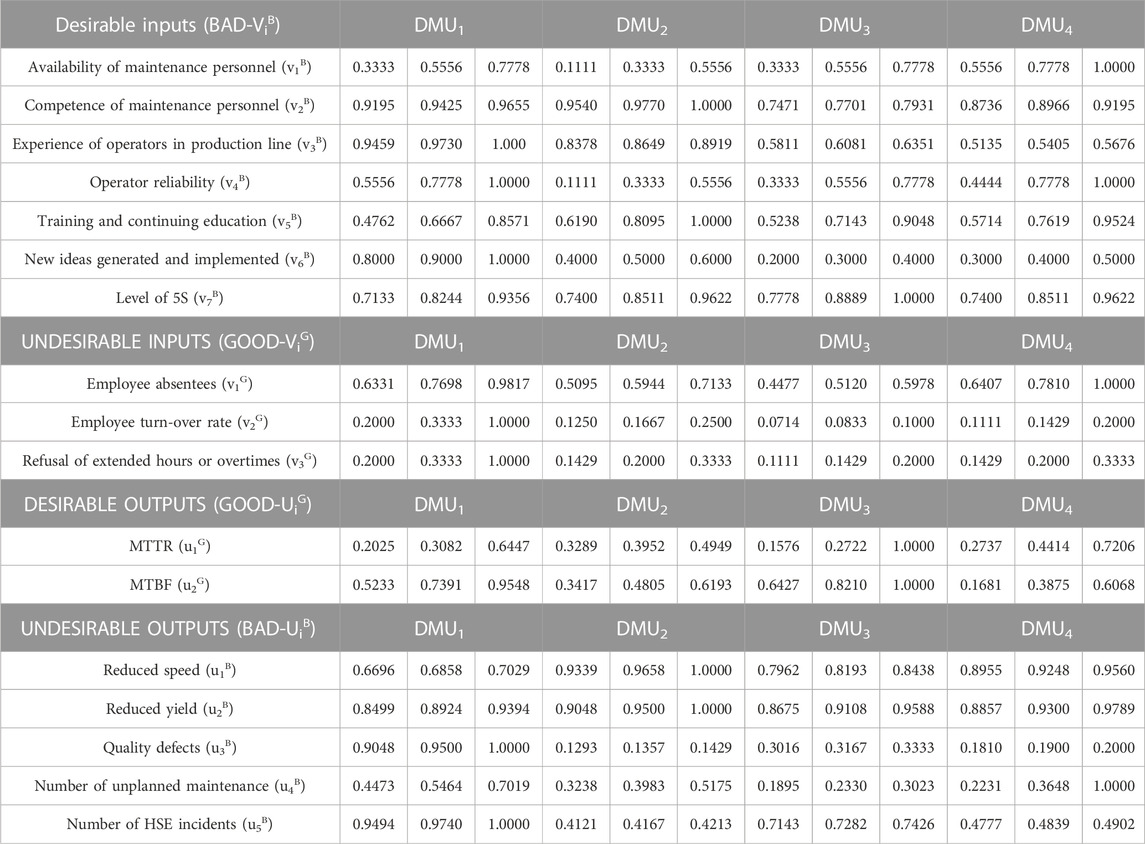
TABLE 8. Fuzzy normalized values of the relevant data for inputs and outputs.
4.3.2 Solving the proposed GFDEA/AR models
The proposed GFDEA/AR models in the presence of desirable and undesirable inputs and outputs, which are explained in detail in Section 3.1, were used to evaluate TPM performance for DMUs. In this context, firstly the α-cut sets of inputs and outputs for each DMU were obtained using the fuzzy normalized values given in Table 8. Afterwards, the proposed Models (1–6) based on the first, second third approaches (see Section 3.3.1) were performed according to the concept of α-cut for the lower and upper bounds of each DMU. Each model includes eighty-eight different mathematical models (for the lower and upper bounds of each DMU at eleven different α-cut levels) and these were solved by using General Algebraic Modeling System (GAMS) 23.5. By solving the proposed Models (1–6) for each DMU, the fuzzy efficiencies scores were obtained under the different α-cut levels from 0 to 1 and the results are presented in Table 9.
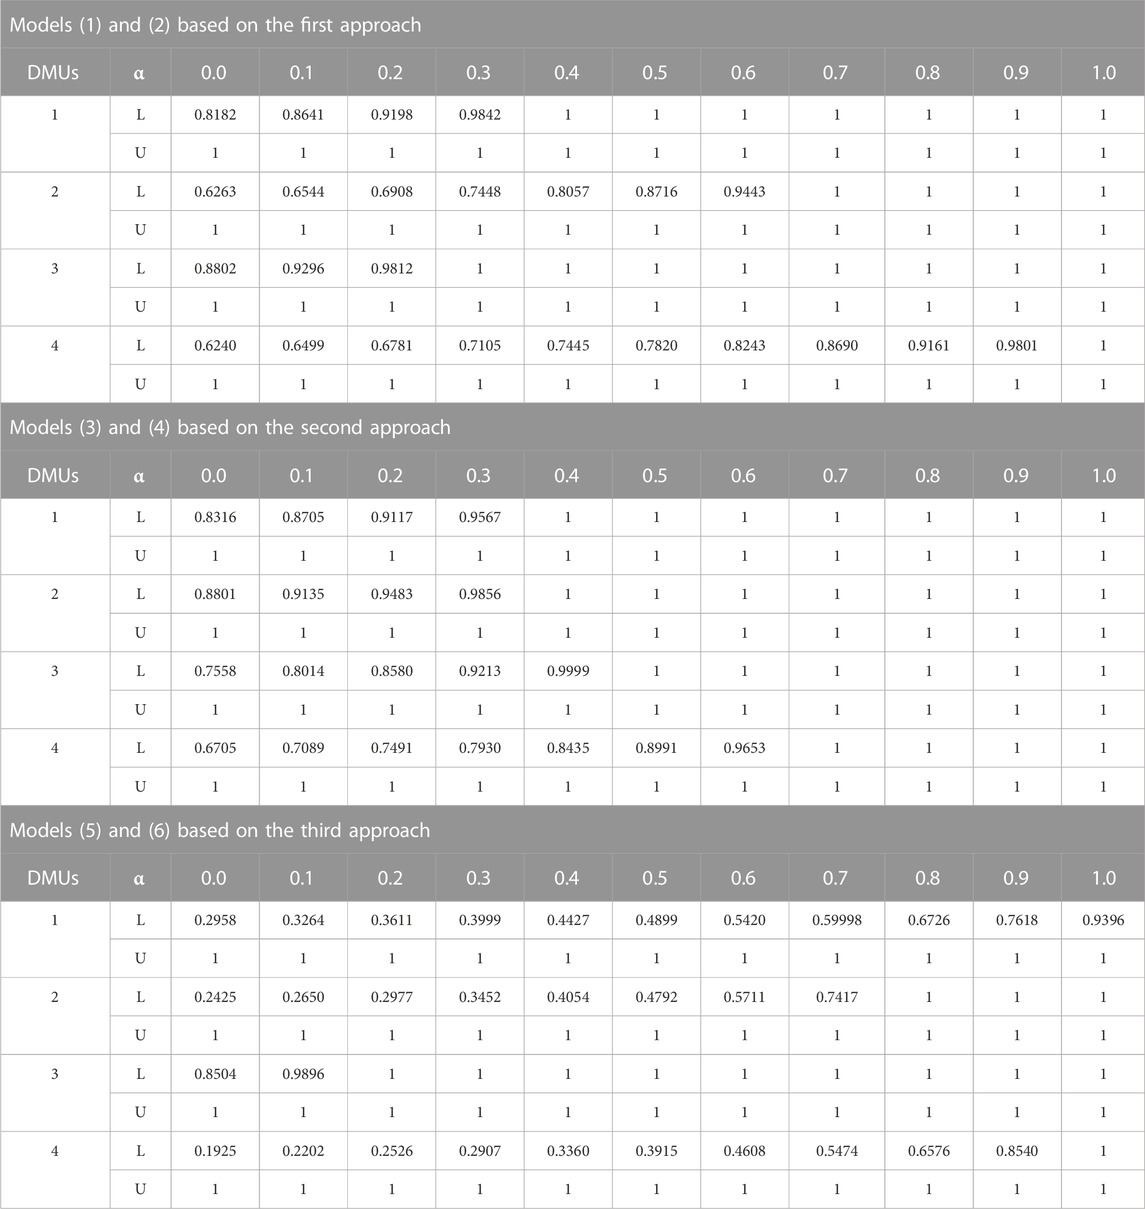
TABLE 9. The fuzzy efficiencies obtained by solving Models (1–6).
In order to compare the fuzzy efficiency scores of DMUs as listed in Table 9, a ranking method needs to be used. In the literature, while many methods for ranking fuzzy numbers have been proposed, the area measurement method proposed by Chen and Klein (1997) is a proper method for this study, since it does not need the exact membership functions of the fuzzy numbers to be ranked. Therefore, this ranking method is implemented to evaluate the production lines according to TPM performance using the following equation:
where
In this context, the ranking indices of the four fuzzy efficiency scores for each models are calculated using Eq. 35 and given in the first row of Table 9. Based on the ranking indices, the TPM performances of the four production lines are ranked accordingly.
Table 10 reveals that DMU3 (NHB BOL) has the highest TPM performance value while DMU4 (NHB EOL) has the lowest TPM performance value according to the ranking results of Models 1) and 2) based on the first approach. However, in Models 3) and 4) based on the second approach, the best TPM performance value is obtained by DMU2 (Rail assembly and HPV) and DMU4 again has the worst TPM performance value. Furthermore, DMU1 (Rail machining) has the same ranking order in Models (1–4) based on the first and second approaches. In this table, according to the ranking results of Models 5) and 6) based on the third approach, the DMU3 is the most efficient production line with respect to TPM performance. DMU4 has also the lowest TPM performance value. As conclusion, it is observed that the production lines DMU2 and DMU3 together define an efficient Frontier and DMU1 is the production line with the best performance followed by these production lines according to TPM performance.
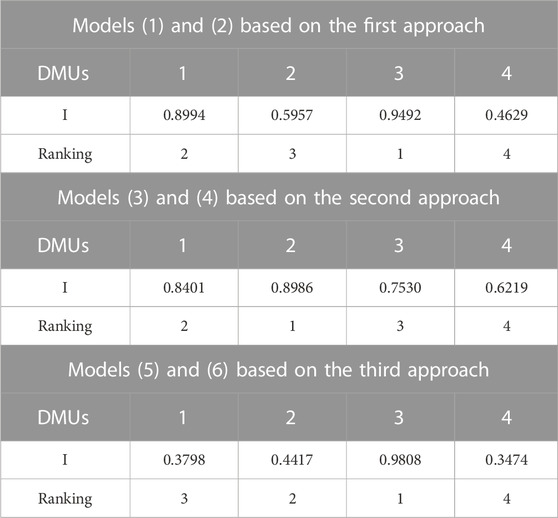
TABLE 10. The ranking results of DMUs according to the models.
5 Discussion
In most organizations, the performance of TPM is measured by the OEE metric which gives information about only equipment-related performance. However, different factors such as business-related factors, external-related factors, and, especially human-related factors (e.g., operators who are most familiar with the daily operation of the equipment and maintenance personnel who are most familiar with the technical specifications and long-run performance of the equipment) have a great impact on successful implementation of TPM.
According to the literature, although several critical success factors for TPM implementation have been defined in various studies, a few studies have been made related to the performance measurement in TPM implementation (Park, 2002; F.-K; Wang, 2006; Jeon et al., 2011). Therefore, the results from this study demonstrated a standardized and systematic way of how the critical factors impacting on TPM performance can be evaluated under some conflicting attributes and how they can be further used for the measurement of TPM performance. Therefore, it can fulfill the gap in knowledge in the field, which is lack of standardization. In the following paragraphs, the contributions of the proposed TPM PMS according to its each phase.
In the design phase, the human-related factors were also identified as significant TPM PIs having an impact on TPM, which was previously studies in the literature (Arunraj et al., 2014; Bekar and Kahraman, 2016; Peach et al., 2016; Sharma et al., 2016; Turanoglu Bekar et al., 2016), and this result contributed to the research on human factors of TPM. In the evaluation phase, the proposed FCOPRAS method was applied for the evaluation of the proposed TPM PIs. The proposed FCOPRAS method was also compared to the most popular FMADM methods using Spearman’s rank correlation coefficient in the evaluation phase. It is concluded that the proposed FCOPRAS method produces statistically similar rankings with the other FMADM methods in the literature. Finally, its validity and robustness were tested by using sensitivity analysis according to optimistic and pessimistic changes in the linguistic assessments of attributes. The innovative side of the proposed FCOPRAS method is that all calculations were performed in accordance with the fuzzy arithmetic operations and fuzzy ranking method, and therefore it does not include any defuzzification step for avoiding information loss.
According to the fuzzy efficiencies of the GFDEA/AR models with coexisting desirable and undesirable inputs and outputs proposed in the implementation phase, Models 3) and 4) based on the second approach gave the best fuzzy efficiencies while Models 5) and 6) based on the third approach presented the worst fuzzy efficiencies for each DMU at any given α-cut level. However, Models 1) and 2) based on the first approach calculated the intermediate fuzzy efficiencies for each DMU at any given α-cut level among the proposed models. Accordingly, Models 3) and 4) provided optimistic efficiency values while Models 5) and 6) gave pessimistic efficiency values. Models 1) and 2) found the efficiencies between the optimistic and pessimistic values. Consequently, the proposed models give an opportunity to see the different approaches for the performance evaluation of TPM. According to the best knowledge of the author, the GFDEA/AR models were firstly integrated with the proposed FCOPRAS method. Additionally, these models were extended in the presence of desirable and undesirable inputs and outputs. Thus, the proposed models make a significant contribution to the TPM literature.
In the review phase answers to the questions about how to use TPM performance results for preventive/predictive decisions and actions and how to review and modify this system accordingly. In this context, the comparisons were made between the TPM performance values obtained by the proposed models (I indexes as seen in Table 10) and the OEE values (the average values of 36 weeks) which were measured by the company with respect to each DMU. Figure 5 illustrates these comparisons.
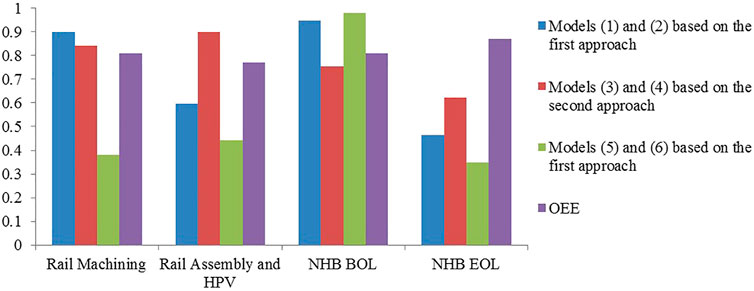
FIGURE 5. The comparisons of TPM performance values with the OEE values with respect to each DMU.
As seen in Figure 5, the production lines such as “Rail Machining” and “NHB BOL” have the highest OEE values after the production line “NHB EOL” while the production line “Rail Assembly and HPV” has the lowest OEE value. However, “NHB EOL” has the lowest TPM performance value according to Models (1–6). It can be concluded that other indicators (e.g., “operator reliability”, “competence of maintenance personnel”, “level of 5S, etc.) have a greater impact than the operational related indicators (e.g., “reduced speed”, “reduced yield”, “quality defects”, MTTR and MTBF) in this production line. Furthermore, the ranking orders of the production lines, namely, “Rail Machining”, “NHB BOL” and “Rail Assembly and HPV” according to OEE values are similar to the ranking orders of these lines according to TPM performance values obtained by Models (1–4). Furthermore, experts responsible for the TPM program implementation in the company were invited to fill out a form with their judgments, regarding their expertise and experiences in a successful TPM implementation. In this context, in the review phase by monitoring the performance of TPM, it was validated by the experts (e.g., TPM, Production, and Quality managers) in order to control TPM plans, compare the TPM performances of production lines and so prioritize the most important preventive and predictive decisions and actions according to production lines, especially the ineffective ones in TPM program implementation. In conclusion, the real manufacturing case study as presented in the previous section demonstrated the applicability of the proposed TPM PMS. The following contributions and benefits of the proposed TPM PMS are identified from the results of the case study.
• It standardizes the performance of TPM;
• It allows measuring TPM performance with different indicators especially soft ones, e.g., human-related. Thus, it uses both quantitative and qualitative data;
• It supports a true picture of the current state of the production processes in terms of TPM performance;
• It offers a powerful control tool and reliable evidence in order to make effective decisions and actions;
• It provides a holistic and systematic approach and supports the TPM implementation process to be more effective;
• It provides important information to the annual meeting of the company;
• It is also applicable to all industries.
6 Conclusion
TPM has been widely implemented as a lean production tool for improving manufacturing performance in many organizations in today’s competitive environment. The performance of TPM should be measured by some factors since it can make a significant contribution to companies in advancing their manufacturing operations. In this study, a new framework is proposed to measure TPM performance with novel performance indicators. The proposed framework provides a comprehensive and systematic way to measure TPM performance since it covers all phases of a performance measurement system, namely, design, evaluation, implementation, and review. In the design phase, various types of indicators which tend to impact TPM performance were designed based on the theoretical and practical aspects. In the evaluation phase, the TPM PIs proposed in the design phase were evaluated by using the proposed FCOPRAS method. Additionally, it was compared with the most popular FMADM methods and its reliability was also represented by the sensitivity analysis. In the implementation phase, the proposed TPM PIs were used to evaluate TPM performance using FDEA which is a very effective method for evaluating the relative efficiency of DMUs on the basis of multiple fuzzy inputs and outputs. The fuzzy relative significance of the proposed TPM PIs obtained by the FCOPRAS method is integrated into the FDEA models based on AR and undesirability approaches. In this regard, different GFDEA/AR models in the presence of desirable and undesirable inputs and outputs were proposed to measure TPM performance. The results from a real-world manufacturing case study demonstrated the applicability and superiority of the integrated method based on FCOPRAS-FDEA in performance measurement for TPM.
Overall, this TPM PMS can provide valuable insights and learning opportunities for companies, and can help to improve the effectiveness of maintenance practices, increase equipment reliability, enhance product quality, optimize asset utilization using qualitative and quantitative indicators, and continuous improvement in their maintenance practices, production processes, and overall business operations. This can help to drive innovation and create a culture of continuous improvement within the organization. Thereby, in a longer term, this would contribute toward future competitiveness and sustainability of manufacturing systems. Moreover, the proposed TPM PMS can be simply applied for measuring TPM performance using different real-cases from various industries. While the proposed TPM PMS can be a valuable tool, there might be some limitations which are reliance on data accuracy (i.e., it relies on accurate and reliable data to be effective) and potential for over-reliance on the proposed TPM PIs (i.e., it can be highly focused on the indicators, which may lead to a narrow focus on short-term improvements rather than long-term goals). Therefore, for further research, the proposed TPM PMS can be used in conjunction with other improvement methodologies and business strategies. Additionally, other extensions of the fuzzy sets such as type-2, intuitionistic, multi-sets, and hesitant might be used or different undesirability approaches might be adopted to the proposed models in the implementation phase. Using these alternative fuzzy sets and approaches can help to improve the accuracy and flexibility of fuzzy logic-based models, particularly in situations where uncertainty, complexity, and ambiguity are present. This can lead to more effective decision-making and better outcomes.
Data availability statement
The original contributions presented in the study are included in the article/supplementary materials, further inquiries can be directed to the corresponding author.
Author contributions
ETB developed the conceptual design, collected data from the case company, developed and applied the methods by using the necessary software, and wrote the paper. This article was produced from the Ph.D. thesis of the author.
Acknowledgments
The author would like to thank Prof Cengiz Kahraman and Prof Mehmet Cakmakci for their immense support during the study. The author would also like to thank the Production Area of Advance at the Chalmers University of Technology for the research support.
Conflict of interest
The author declares that the research was conducted in the absence of any commercial or financial relationships that could be construed as a potential conflict of interest.
Publisher’s note
All claims expressed in this article are solely those of the authors and do not necessarily represent those of their affiliated organizations, or those of the publisher, the editors and the reviewers. Any product that may be evaluated in this article, or claim that may be made by its manufacturer, is not guaranteed or endorsed by the publisher.
References
Agarwal, S. (2014). Efficiency measure by fuzzy data envelopment analysis model. Fuzzy Inf. Eng. 6 (1), 59–70. doi:10.1016/j.fiae.2014.06.005
Ahuja, I. P. S., and Khamba, J. S. (2008). An evaluation of TPM initiatives in Indian industry for enhanced manufacturing performance. Int. J. Qual. Reliab. Manag. 25 (2), 147–172. doi:10.1108/02656710810846925
Arunraj, K., Maran, M., and Manikandan, G. (2014).A review of intangible benefits of total productive maintenance implementation, Proceedings of Second International Conference on Advances in Industrial Engineering Applications (ICAIEA2014). Kotturpuram.
Awasthi, A., Chauhan, S. S., and Goyal, S. K. (2011). A multi-criteria decision making approach for location planning for urban distribution centers under uncertainty. Math. Comput. Model. 53 (1-2), 98–109. doi:10.1016/j.mcm.2010.07.023
Azadeh, A., Moghaddam, M., Nazari, T., and Sheikhalishahi, M. (2016). Optimization of facility layout design with ambiguity by an efficient fuzzy multivariate approach. Int. J. Adv. Manuf. Technol. 84 (1), 565–579. doi:10.1007/s00170-015-7714-x
Azadeh, A., and Moradi, B. (2014). Simulation optimization of facility layout design problem with safety and ergonomics factors. Int. J. Industrial Eng. 21 (4), 209–230.
Balezentis, A., Balezentis, T., and Brauers, W. K. (2012). Personnel selection based on computing with words and fuzzy MULTIMOORA. Expert Syst. Appl. 39 (9), 7961–7967. doi:10.1016/j.eswa.2012.01.100
Bamber, C. J., Sharp, J. M., and Hides, M. T. (1999). Factors affecting successful implementation of total productive maintenance: A UK manufacturing case study perspective. J. Qual. Maintenance Eng. 5 (3), 162–181. doi:10.1108/13552519910282601
Banker, R. D., Charnes, A., and Cooper, W. W. (1984). Some models for estimating technical and scale inefficiencies in data envelopment analysis. Manag. Sci. 30 (9), 1078–1092. doi:10.1287/mnsc.30.9.1078
Bartz, T., Siluk, J. C. M., and Bartz, A. P. B. (2014). Improvement of industrial performance with TPM implementation. J. Qual. Maintenance Eng. 20 (1), 2–19. doi:10.1108/jqme-07-2012-0025
Bekar, E. T., and Kahraman, C. (2016). Measuring efficiency of total productive maintenance (TPM) with newly developed performance measures using fuzzy data envelopment analysis. Proc. World Congr. Eng. 1.
Belekoukias, I., Garza-Reyes, J. A., and Kumar, V. (2014). The impact of lean methods and tools on the operational performance of manufacturing organisations. Int. J. Prod. Res. 52 (18), 5346–5366. doi:10.1080/00207543.2014.903348
Brah, S. A., and Chong, W. K. (2004). Relationship between total productive maintenance and performance. Int. J. Prod. Res. 42 (12), 2383–2401. doi:10.1080/00207540410001661418
Cabahug, R. R., Edwards, D. J., and Nicholas, J. (2004). Classifying plant operator maintenance proficiency: Examining personal variables. Build. Res. Inf. 32 (2), 119–127. doi:10.1080/0961321032000105403
Chan, F. T. S., Lau, H. C. W., Ip, R. W. L., Chan, H. K., and Kong, S. (2005). Implementation of total productive maintenance: A case study. Int. J. Prod. Econ. 95 (1), 71–94. doi:10.1016/j.ijpe.2003.10.021
Charnes, A., Cooper, W. W., and Rhodes, E. (1978). Measuring the efficiency of decision making units. Eur. J. Operational Res. 2 (6), 429–444. doi:10.1016/0377-2217(78)90138-8
Cua, K. O., McKone, K. E., and Schroeder, R. G. (2001). Relationships between implementation of TQM, JIT, and TPM and manufacturing performance. J. Operations Manag. 19 (6), 675–694. doi:10.1016/s0272-6963(01)00066-3
Emrouznejad, A., and Mustafa, A. (2012). Fuzzy data envelopment analysis: A discrete approach. Expert Syst. Appl. 39 (3), 2263–2269. doi:10.1016/j.eswa.2011.07.118
Emrouznejad, A., Tavana, M., and Hatami-Marbini, A. (2014). “The state of the art in fuzzy data envelopment analysis,” in Studies in fuzziness and soft computing: Performance measurement with fuzzy data envelopment analysis. Editors A. Emrouznejad,, and M. Tavana (Heidelberg: Springer-Verlag), 1–46.
Ertay, T., Ruan, D., and Tuzkaya, U. R. (2006). Integrating data envelopment analysis and analytic hierarchy for the facility layout design in manufacturing systems. Inf. Sci. 176 (3), 237–262. doi:10.1016/j.ins.2004.12.001
Faizrahnemoon, M., Hosseinzadeh Lotfi, F., and Alimardani Jondabeh, M. (2012). Sensitivity analysis of the additive model in data envelopment analysis while inputs and outputs are fuzzy data. Int. J. Comput. Math. 89 (5), 625–638. doi:10.1080/00207160.2011.648185
Gibbons, J. D., and Chakraborti, S. (2014). Nonparametric statistical inference. Florida, United States: CRC Press.
Guo, P., and Tanaka, H. (2001). Fuzzy DEA: A perceptual evaluation method. Fuzzy sets Syst. 119 (1), 149–160. doi:10.1016/s0165-0114(99)00106-2
Hatami-Marbini, A., Emrouznejad, A., and Tavana, M. (2011). A taxonomy and review of the fuzzy data envelopment analysis literature: Two decades in the making. Eur. J. Operational Res. 214 (3), 457–472. doi:10.1016/j.ejor.2011.02.001
Hatami-Marbini, A., Tavana, M., Moradi, M., and Kangi, F. (2013). A fuzzy group Electre method for safety and health assessment in hazardous waste recycling facilities. Saf. Sci. 51 (1), 414–426. doi:10.1016/j.ssci.2012.08.015
Ireland, F., and Dale, B. G. (2006). Total productive maintenance: Criteria for success. International J. Prod. Qual. Manag. 1 (3), 207–223. doi:10.1504/IJPQM.2006.008475
Jamalnia, A., and Soukhakian, M. A. (2009). A hybrid fuzzy goal programming approach with different goal priorities to aggregate production planning. Comput. Industrial Eng. 56 (4), 1474–1486. doi:10.1016/j.cie.2008.09.010
Jeon, J., Kim, C., and Lee, H. (2011). Measuring efficiency of total productive maintenance (TPM): A three-stage data envelopment analysis (DEA) approach. Total Qual. Manag. Bus. Excell. 22 (8), 911–924. doi:10.1080/14783363.2011.593865
Kahraman, C., Suder, A., and Bekar, E. T. (2016). Fuzzy multiattribute consumer choice among health insurance options. Technol. Econ. Dev. Econ. 22 (1), 1–20. doi:10.3846/20294913.2014.984252
Kao, C., and Liu, S. T. (2000). Fuzzy efficiency measures in data envelopment analysis. Fuzzy Sets Syst. 113 (3), 427–437. doi:10.1016/s0165-0114(98)00137-7
Karsak, E. E. (2008). Using data envelopment analysis for evaluating flexible manufacturing systems in the presence of imprecise data. Int. J. Adv. Manuf. Technol. 35 (9), 867–874. doi:10.1007/s00170-006-0765-2
Kaya, T., and Kahraman, C. (2010). Multicriteria renewable energy planning using an integrated fuzzy VIKOR and AHP methodology: The case of Istanbul. Energy 35 (6), 2517–2527. doi:10.1016/j.energy.2010.02.051
Khodabakhshi, M., Tavana, M., and Abootaleb, F. B. (2016). Optimistic and pessimistic performance and congestion analysis in fuzzy data envelopment analysis. Int. J. Logist. Syst. Manag. 24 (1), 1–17. doi:10.1504/ijlsm.2016.075660
Kuo, R. J., Lee, L. Y., and Hu, T. L. (2010). Developing a supplier selection system through integrating fuzzy AHP and fuzzy DEA: A case study on an auto lighting system company in taiwan. Prod. Plan. Control 21 (5), 468–484. doi:10.1080/09537280903458348
Lertworasirikul, S., Fang, S. C., Joines, J. A., and Nuttle, H. L. (2003). Fuzzy data envelopment analysis (DEA): A possibility approach. Fuzzy sets Syst. 139 (2), 379–394. doi:10.1016/s0165-0114(02)00484-0
Lin, H. T. (2010). Personnel selection using analytic network process and fuzzy data envelopment analysis approaches. Comput. Industrial Eng. 59 (4), 937–944. doi:10.1016/j.cie.2010.09.004
Ljungberg, O. (1998). Measurement of overall equipment effectiveness as a basis for TPM activities. Int. J. Operations Prod. Manag. 18 (5), 495–507. doi:10.1108/01443579810206334
Malczewski, J. (1999). GIS and multicriteria decision analysis. New Jersey, United States: John Wiley and Sons.
Mariano, E. B., Sobreiro, V. A., and do Nascimento Rebelatto, D. A. (2015). Human development and data envelopment analysis: A structured literature review. Omega 54, 33–49. doi:10.1016/j.omega.2015.01.002
McKone, K. E., Schroeder, R. G., and Cua, K. O. (2001). The impact of total productive maintenance practices on manufacturing performance. J. Operations Manag. 19 (1), 39–58. doi:10.1016/s0272-6963(00)00030-9
Mirhedayatian, S. M., Vahdat, S. E., Jelodar, M. J., and Saen, R. F. (2013). Welding process selection for repairing nodular cast iron engine block by integrated fuzzy data envelopment analysis and TOPSIS approaches. Mater. Des. 43, 272–282. doi:10.1016/j.matdes.2012.07.010
Muchiri, P., and Pintelon, L. (2008). Performance measurement using overall equipment effectiveness (OEE): Literature review and practical application discussion. Int. J. Prod. Res. 46 (13), 3517–3535. doi:10.1080/00207540601142645
Parida, A., and Chattopadhyay, G. (2007). Development of a multi-criteria hierarchical framework for maintenance performance measurement (MPM). J. Qual. Maintenance Eng. 13 (3), 241–258. doi:10.1108/13552510710780276
Park, C. H. (2002). The effect and influencing mechanism of TPM factors to performance. J. Korean Soc. Qual. Manag. 30 (4), 154–163.
Peach, R., Ellis, H., and Visser, J. K. (2016). A maintenance performance measurement framework that concluded maintenance human factors: A case study from the electricity transmission industry. South Afr. J. Industrial Eng. 27 (2), 177–189.
Piechnicki, A. S., Sola, A. V. H., and Trojan, F. (2015). Decision-making towards achieving world-class total productive maintenance. Int. J. Operations Prod. Manag. 35 (12), 1594–1621. doi:10.1108/ijopm-11-2013-0479
Pinjala, S. K., Pintelon, L., and Vereecke, A. (2006). An empirical investigation on the relationship between business and maintenance strategies. Int. J. Prod. Econ. 104 (1), 214–229. doi:10.1016/j.ijpe.2004.12.024
Puri, J., and Yadav, S. P. (2014). A fuzzy DEA model with undesirable fuzzy outputs and its application to the banking sector in India. Expert Syst. Appl. 41 (14), 6419–6432. doi:10.1016/j.eswa.2014.04.013
Saati, S. M., Memariani, A., and Jahanshahloo, G. R. (2002). Efficiency analysis and ranking of DMUs with fuzzy data. Fuzzy Optim. Decis. Mak. 1 (3), 255–267. doi:10.1023/a:1019648512614
Schippers, W. A. (2001). An integrated approach to process control. Int. J. Prod. Econ. 69 (1), 93–105. doi:10.1016/s0925-5273(98)00243-6
Sharma, R. K., Kumar, D., and Kumar, P. (2006). Manufacturing excellence through TPM implementation: A practical analysis. Industrial Manag. Data Syst. 106 (2), 256–280. doi:10.1108/02635570610649899
Sharma, R., Singh, J., and Rastogi, V. (2016). Importance and effectiveness of human related issues in implementing total productive maintenance: A study of Indian manufacturing organisations. Int. J. Industrial Syst. Eng. 23 (4), 420–434. doi:10.1504/ijise.2016.077694
Simoes, J. M., Gomes, C. F., and Yasin, M. M. (2011). A literature review of maintenance performance measurement: A conceptual framework and directions for future research. J. Qual. Maintenance Eng. 17 (2), 116–137. doi:10.1108/13552511111134565
Singh, R. K., and Gurtu, A. (2022). Prioritizing success factors for implementing total productive maintenance (TPM. ). J. Qual. Maintenance Eng. 28 (4), 810–830. doi:10.1108/jqme-09-2020-0098
Singh, U., and Ahuja, I. S. (2015). Evaluating the contributions of total productive maintenance on manufacturing performance. Int. J. Process Manag. Benchmarking 5 (4), 425–455. doi:10.1504/ijpmb.2015.072324
Swanson, L. (2001). Linking maintenance strategies to performance. Int. J. Prod. Econ. 70 (3), 237–244. doi:10.1016/s0925-5273(00)00067-0
Tavana, M., Khalili-Damghani, K., and Sadi-Nezhad, S. (2013). A fuzzy group data envelopment analysis model for high-technology project selection: A case study at nasa. Comput. Industrial Eng. 66 (1), 10–23. doi:10.1016/j.cie.2013.06.002
Turanoglu Bekar, E., Cakmakci, M., and Kahraman, C. (2016). Fuzzy COPRAS method for performance measurement in total productive maintenance: A comparative analysis. J. Bus. Econ. Manag. 17 (5), 663–684. doi:10.3846/16111699.2016.1202314
Turskis, Z., and Zavadskas, E. K. (2010). A new fuzzy additive ratio assessment method (ARAS-F). Case study: The analysis of fuzzy multiple criteria in order to select the logistic centers location. Transport 25 (4), 423–432. doi:10.3846/transport.2010.52
Waeyenbergh, G., and Pintelon, L. (2002). A framework for maintenance concept development. Int. J. Prod. Econ. 77 (3), 299–313. doi:10.1016/s0925-5273(01)00156-6
Wang, F. K. (2006). Evaluating the efficiency of implementing total productive maintenance. Total Qual. Manag. Bus. Excell. 17 (5), 655–667. doi:10.1080/14783360600588232
Wickramasinghe, G. L. D., and Perera, A. (2016). Effect of total productive maintenance practices on manufacturing performance: Investigation of textile and apparel manufacturing firms. J. Manuf. Technol. Manag. 27 (5), 713–729. doi:10.1108/jmtm-09-2015-0074
Zadeh, L. A. (2008). Is there a need for fuzzy logic? Inf. Sci. 178 (13), 2751–2779. doi:10.1016/j.ins.2008.02.012
Keywords: efficiency measurement, total productive maintenance, sustainable manufacturing, multi-criteria decision making, optimization, fuzzy set theory
Citation: Turanoglu Bekar E (2023) Efficiency measurement based on novel performance measures in total productive maintenance (TPM) using a fuzzy integrated COPRAS and DEA method. Front. Manuf. Technol. 3:1072777. doi: 10.3389/fmtec.2023.1072777
Received: 17 October 2022; Accepted: 23 March 2023;
Published: 31 March 2023.
Edited by:
Christos Emmanouilidis, University of Groningen, NetherlandsReviewed by:
Idriss El-Thalji, University of Stavanger, NorwayDamjan Maletic, University of Maribor, Slovenia
Copyright © 2023 Turanoglu Bekar. This is an open-access article distributed under the terms of the Creative Commons Attribution License (CC BY). The use, distribution or reproduction in other forums is permitted, provided the original author(s) and the copyright owner(s) are credited and that the original publication in this journal is cited, in accordance with accepted academic practice. No use, distribution or reproduction is permitted which does not comply with these terms.
*Correspondence: Ebru Turanoglu Bekar, ebrut@chalmers.se