Preprocessing of 18F-DMFP-PET Data Based on Hidden Markov Random Fields and the Gaussian Distribution
 Fermín Segovia1*
  Juan M. Górriz1,2
  Javier Ramírez1
  Francisco J. Martínez-Murcia1
  Diego Salas-Gonzalez1
- 1Department of Signal Theory, Networking and Communications, University of Granada, Granada, Spain
- 2Department of Psychiatry, University of Cambridge, Cambridge, United Kingdom
18F-DMFP-PET is an emerging neuroimaging modality used to diagnose Parkinson's disease (PD) that allows us to examine postsynaptic dopamine D2/3 receptors. Like other neuroimaging modalities used for PD diagnosis, most of the total intensity of 18F-DMFP-PET images is concentrated in the striatum. However, other regions can also be useful for diagnostic purposes. An appropriate delimitation of the regions of interest contained in 18F-DMFP-PET data is crucial to improve the automatic diagnosis of PD. In this manuscript we propose a novel methodology to preprocess 18F-DMFP-PET data that improves the accuracy of computer aided diagnosis systems for PD. First, the data were segmented using an algorithm based on Hidden Markov Random Field. As a result, each neuroimage was divided into 4 maps according to the intensity and the neighborhood of the voxels. The maps were then individually normalized so that the shape of their histograms could be modeled by a Gaussian distribution with equal parameters for all the neuroimages. This approach was evaluated using a dataset with neuroimaging data from 87 parkinsonian patients. After these preprocessing steps, a Support Vector Machine classifier was used to separate idiopathic and non-idiopathic PD. Data preprocessed by the proposed method provided higher accuracy results than the ones preprocessed with previous approaches.
1. Introduction
Neuroimaging data have become an essential tool to diagnose the most frequent neurodegenerative disorders: Alzheimer's and Parkinson's disease. Initially, the neuroimages were visually inspected by experienced clinicians in order to corroborate a previous tentative diagnosis based on neuropsychological and behavioral tests. To this end, they looked for areas of low activation located in specific brain regions that are known to be affected by the supposed disorder. During the last decade, the neuroimaging community has progressively increased the use of computer toolboxes to analyze neuroimaging data (Friston et al., 2006; Schrouff et al., 2013). These tools are able to carry out statistical analyses that perform a more exhaustive examination of the huge amounts of information contained in the data and remove the subjectivity inherent to the visual inspection of the neuroimages (Górriz et al., 2017). However, these statistical analyses require additional preprocessing steps that make neuroimages from different subjects comparable. Two procedures are usually performed: spatial registration and intensity normalization (Saxena et al., 1998; Dukart et al., 2013). The former ensures that a given voxel from different neuroimages corresponds to the same anatomical position while the latter removes the differences due to the scanner used or the amount of radiopharmaceutical injected (Salas-Gonzalez et al., 2013). Even when all the data are acquired using a single scanner, an intensity normalization of the data is desirable. Several studies suggested that the absolute values of cerebral blood flow and other metabolic measurements have a coefficient of variance about 15% in healthy elderly subjects and as high as 30% in patients suffering neurodegenerative disorders (Leenders et al., 1990; Huang et al., 2007; Borghammer et al., 2009). In addition to spatial registration and intensity normalization, a segmentation step can be carried out. This procedure consists on partitioning the data into two or more maps each one containing information of different classes. For example, brain Magnetic Resonance Imaging (MRI) data are usually segmented into gray matter, white matter and cerebrospinal fluid. Segmentation is common in studies that use structural data but it has been also used for functional data. In Moussallem et al. (2012) the authors used a threshold (adjusted by an ad hoc function) to segment 18F-FDG-PET data in order to delimit tumors. A more sophisticated approach for the same purpose was demonstrated in Li et al. (2017).
18F-DMFP-PET is a neuroimage modality that is increasingly being used as an effective tool to distinguish between idiophatic and non-idiophatic parkinsonian patients and therefore to assist the diagnosis of Parkinson's disease (PD) (la Fougère et al., 2010). In contrast to DaTSCAN (widely used for PD diagnosis; Towey et al., 2011; Illán et al., 2012; Segovia et al., 2012; Martínez-Murcia et al., 2014), 18F-DMFP-PET is able to image the postsynaptic striatal dopaminergic deficit that characterizes non-idiopathic parkinsonian variants such as multiple system atrophy (MSA) or progressive supranuclear palsy (PSP). Because of this, most of the studies with 18F-DMFP-PET are focused on analyzing the striatal region, even though this neuroimaging modality contains moderate signal intensities in regions other than the striatum that can be useful in PD diagnosis (Segovia et al., 2015, 2017).
In this work, we propose a methodology to preprocess 18F-DMFP-PET data that improves the results of subsequent analyses. The proposed method consists of two steps: data segmentation using Hidden Markov Random Fields (HMRF) and intensity normalization using the Gaussian distribution. The segmentation step divides each neuroimage into 4 maps: (i) high-signal voxels (located in the striatum), (ii) medium-signal voxels (located in most of the regions other than the striatum), (iii) low-signal voxels (most of then correspond to the cerebrospinal fluid), and (iv) voxels with intensities around zero (located outside the brain). The second step normalizes the intensities of each map using a Gaussian model. This approach was evaluated and compared with previous approaches using 87 neuroimages and a system based on Support Vector Machine (SVM) classification (Vapnik, 2000). The obtained results suggest that our procedure improves the automatic separation of idiopathic and non-idiopathic parkinsonian patients. In addition, it allows us to independently analyze the striatum and the remaining regions of the brain.
2. Materials and Methods
2.1. Ethics Statement
Each patient (or a close relative) gave written informed consent to participate in the study and the protocol was accepted by the Ethics Committee of the University of Munich. All the data were anonymized by the clinicians who acquired them before being considered in this work.
2.2. 18F-DMFP-PET Neuroimaging Database
Eighty-seven 18F-DMFP-PET neuroimages were used to evaluate the preprocessing approach proposed in this work. These data were collected during a longitudinal study carried out by the University of Munich (la Fougère et al., 2010). The neuroimages were acquired 55 min after the 18F-DMFP injection (which was synthesized using an automatic synthesis module as described in la Fougère et al., 2010) by means of a Siemens/CTI camera. Neuroleptics, metoclopramide and other medications and dopamine agonists that could potentially interfere were withdrawn before the data acquisition according to their biologic half-life. The emission recording consisted of 3 frames of 10 min each, acquired in 3-dimensional mode. The resulting images were reconstructed as 128 × 128 matrices of 2 × 2 mm voxels by filtered backprojection using a Hann filter.
All the patients included in the study were referred to 18F-DMFP-PET examination from local movement disorder clinics. They showed parkinsonian movement disorders and nigrostriatal degeneration that were confirmed by a 123I-FP-CIT SPECT scan according to widely accepted criteria (Koch et al., 2005). They were monitored during 2 years after the 18F-DMFP-PET acquisition and at this time the neuroimaging data were labeled according to the last diagnosis. Specifically, the last diagnosis was based on the response to an apomorphine challenge test or the response to dopamine replacement therapy and follow-up clinical examinations, paying special attention to orthostatic hypotension, cerebellar signs, eye movement disorders, spasticity or other atypical symptoms. Table 1 shows the resulting groups and some demographic details.
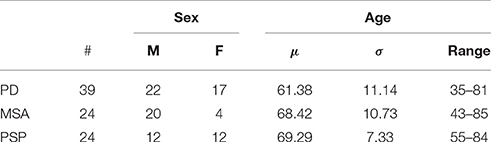
Table 1. Group distribution of the neuroimaging data considered in this work (μ and σ stand for the mean and the standard deviation, respectively).
Before applying the proposed method and the subsequent classification, the data were spatially registered using the template matching algorithm implemented in Statistical Parametric Mapping (SPM) (Friston et al., 2006). This procedure makes each neuroimage matches a given template, pursuing the same position (in the neuroimage space) in different neuroimages corresponds to the same anatomical position. The template was computed as follows: first all the neuroimages were registered to a randomly chosen one. The registered images and their hemisphere midplane reflections were then averaged (this step ensured a symmetric template). Finally the resulting image was smoothed and used to register the whole dataset (Ashburner et al., 1997).
2.3. Markov Models
A Markov model (a.k.a. Markov chain) is a discrete stochastic process in which the next state only depends on the current state. If unobserved (hidden) states are assumed, the model is known as hidden Markov model (HMM). This work is focused on Markov random fields (MRF) that can be considered a generalization of Markov models for multiple-dimensions problems.
2.3.1. Markov Random Fields
Markov random field theory is a branch of probability theory for analyzing the spatial or contextual dependencies of physical phenomena. A MRF is a family of random variables that satisfies the Markovianity property and can be described by an undirected graphical model.
Let S = {1, 2, …, N} be the set of indexes in space, and a neighborhood system, with being the set of sites neighboring i and satisfying that and . A random field is said to be a MRF on S with respect to a neighborhood system if and only if Li (2001):
where x = (x1, x2, …, xN) is a configuration in S and χ is the set of all possible configurations in S. A MRF can be characterized by a Gibbs distribution, allowing us to redefine the probability P(x) as (Hammersley-Clifford theorem):
where:
is a normalizing constant, T is a constant called temperature and usually fixed to 1 and U(x) is the energy function, defined as a sum of clique potentials Vc(x) over all possible cliques, C:
In this context, a clique c for the graph constituted by S and (S contains the nodes and the links) is defined as a subset of S whose elements are neighbors to one another (Li, 2001).
2.3.2. Hidden Markow Random Fields
Hidden Markow random fields are a generalization of HMMs that assume MRFs (more than one dimension) instead of Markov models (one dimension) and therefore, they can be directly applied to two and three-dimensional problems, such as neuroimage segmentation.
A HMRF is characterized by an unobservable (hidden) MRF X = {Xi, i ∈ S} assuming values in a finite state space L, an observable random field Y = {Yi, i ∈ S} assuming values in a finite state space D, and a conditional independence restriction (Zhang et al., 2001). For any particular configuration x ∈ χ, every Yi follows a known conditional probability distribution p(yi|xi) of the same functional form f(yi; θxi). Given that (conditional independence):
the joint probability of (X, Y) can be written as:
Since (because of the local characteristics of MRFs), the marginal probability distribution of Yi can be computed in function of the parameter set θ and :
2.4. Automatic Segmentation Based On HMRF
The segmentation based on HMRF assigns a label li ∈ L = {1, 2, 3, 4}, i = {1, …N} to each voxel in a 18F-DMFP-PET neuroimage according to both intensity and neighborhood. Let y = {y1, y2, …, yN} be the intensity levels of the N voxels that form a 18F-DMFP-PET neuroimage. In this procedure we looked for a labeling x = (x1, x2, …, xN), where xi ∈ L is the label assigned to the voxel yi. Formally we estimated (MAP criterion):
where is an estimation of x and considered a particular realization of the MRF X. Using the equivalence between MRFs and Gibb distributions the Equation (8) can be written as Zhang et al. (2001):
where U(y|x) is the likelihood energy. Estimating involves estimating the parameter set θ = {θl, l ∈ L}, where θl = (μl, σl), since we assumed a Gaussian function for each of the maps resulting from the segmentation of y. A k-means algorithm was used to initialize the labeling . Then, an Expectation-Maximization (EM) algorithm was carried out to alternatively estimate the parameter set, θ, and the label set, .
Altogether, this segmentation procedure divides a neuroimage into 4 maps: (i) voxels with intensity close to zero (mainly voxels outside the brain), (ii) low-signal voxels, with very limited diagnostic value, (iii) medium-signal voxels, and (iv) high-signal voxels, with high diagnostic value (located in the striatal region). In order to reduce the computational burden, the segmentation procedure was only applied to an ad-hoc neuroimage computed as the average of all the 18F-DMFP-PET images in our dataset (the result is shown in Figure 1). Then, the resulting maps were used as binary masks to segment the neuroimages in our dataset.
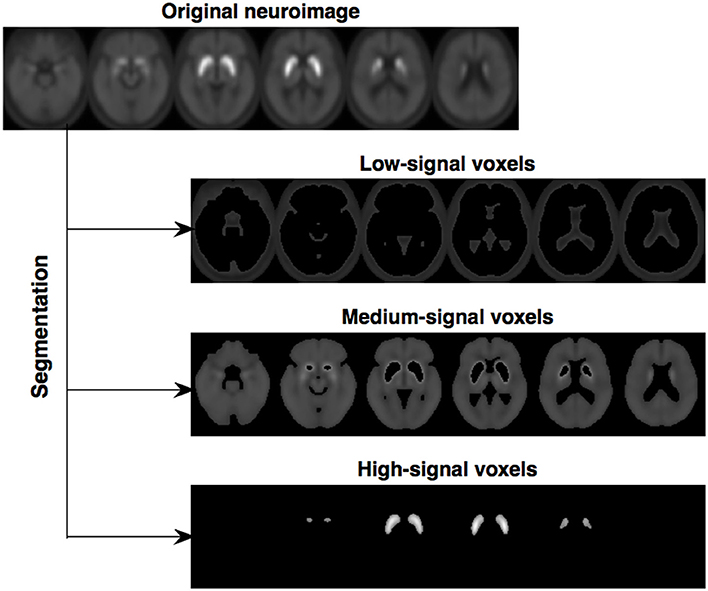
Figure 1. Segmentation of the image computed as the average of all the 18F-DMFP-PET neuroimages (the map with the voxels outside the brain was not represented). Note that two regions of interest, containing medium-signal and high-signal voxels, are clearly delimited.
In this initial work, only striatal voxels were considered to separate idiopathic and non-idiopathic patients. Thus, only the maps containing high-signal voxels (one map per neuroimage) were used in the subsequent analyses.
2.5. Intensity Normalization Based on the Gaussian Distribution
The intensity of high-signal voxels largely differs from one patient to another, even among patients suffering the same parkinsonian disorder. This can be noted on Figure 2, which shows the histogram of the map containing these voxels for the first 20 patients in our dataset (all of them were diagnosed with idiopathic parkinsonim).
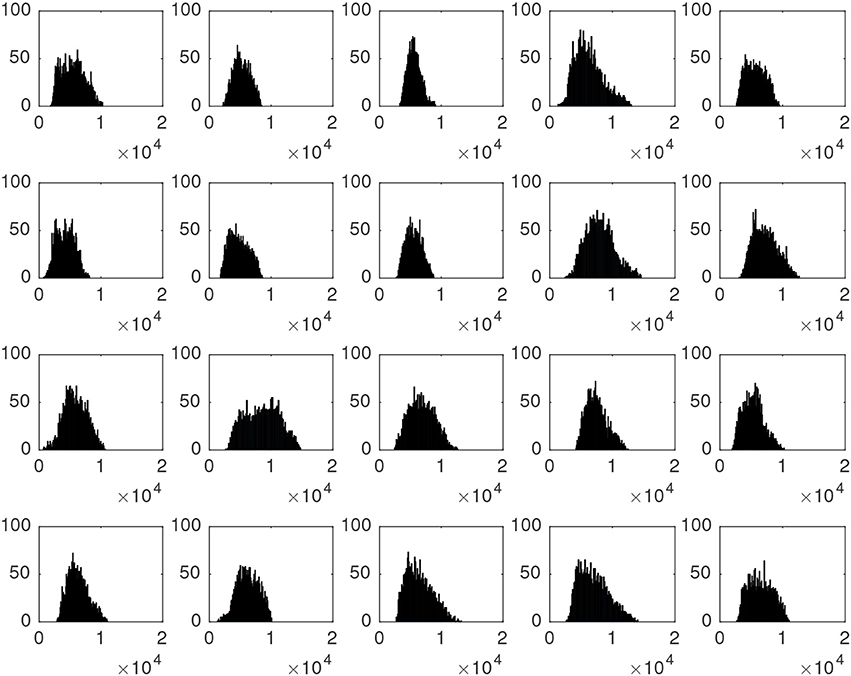
Figure 2. Histograms associated to the striatal voxels of the first 20 neuroimages in our dataset. All of them correspond to idiopathic parkinsonian patients.
In order to reduce these differences without losing the discriminant information contained in the data, an additional normalization step was performed. This procedure modeled the histogram of a given map of each patient by a Gaussian distribution. Then, these data were modified so that the Gaussians corresponding to all the patients have approximately same mean and standard deviation. First, parameters Gμ and Gσ were computed:
where μpi and σpi respectively stand for the mean and standard deviation of the Gaussian associated to data from patient pi, and n is number of patients/neuroimages in our dataset. The data from each patient were then modified as follows:
Figure 3 illustrates the transformation carried out by this procedure. It shows the shape of the histograms of our data before and after the normalization. Note that this procedure was independently applied to the data of each patient and in our case, it was only used to normalize the maps with high-signal voxels, however it can be also applied other maps obtained from the segmentation.
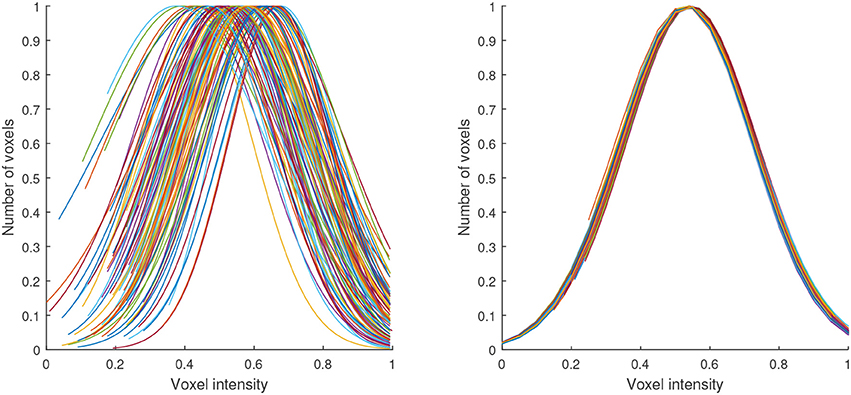
Figure 3. Gaussian distributions modeling the histograms of the maps with high-signal voxels from all the neuroimages in our database before (left) and after (right) the proposed intensity normalization. Note that after normalization the histogram corresponding to all the maps can be modeled by a Gaussian with the same shape.
3. Results and Discussion
In order to evaluate the advantages of preprocessing 18F-DMFP-PET data with our methodology, a statistical classification analysis was carried out. To this purpose, a SVM classifier (Vapnik, 2000) was used after the preprocessing steps to separate the idiopathic and non-idiopathic patients in our database (i.e., PD vs. MSA and PSP). As it is common in PD diagnosis (Winogrodzka et al., 2001; Constantinescu et al., 2011; Niccolini et al., 2014; Prashanth et al., 2014) we used only the voxels at the striatum, as selected by the maps with high-signal voxels (the other maps resulting from the segmentation were discarded). The normalized intensity values of the selected voxels were directly used as feature.
The classification performance was estimated by means of a k-fold cross-validation scheme (k = 5). In order to avoid biased results, all the parameters required by the method were fit inside the cross-validation loop, using only the training data. A nested loop was also used to adjust the parameter C of the SVM classifier (Varma and Simon, 2006). Table 2 shows the achieved accuracy, sensitivity and specificity (idiopathic patients were considered as positive) and compares these results with the ones obtained by other approaches: (i) selecting voxels at the striatum by means of an atlas and, (ii) using all the voxels of the brain. In these cases, the intensity of the voxels was normalized using the normalization to the maximum (Saxena et al., 1998).
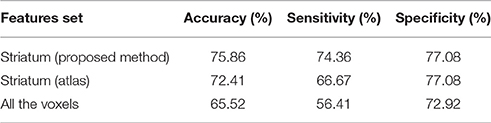
Table 2. Accuracy, sensitivity and specificity obtained by a SVM classifier when separating idiopathic and non-idiopathic Parkinsonism.
The results shown in Table 2 suggest that our preprocessing method allows improving the automatic separation of parkinsonian patients. The relatively low rates achieved by the SVM classifier are due to the dataset used in this work. Most of the neuroimages correspond to patients in a very initial stage. In fact they were acquired 2 years before obtaining the final diagnosis used to label the data. In addition, the whole brain approach also suffers from the small sample size problem (Duin, 2000). In this classification the number of features is larger and many of these features correspond to regions of low signal in 18F-DMFP-PET data, which are not useful to separate the groups. In terms of sensitivity and specificity, the obtained results show that the proposed method largely improve (about 8%) the ability of the classifier to correctly detect the positive subjects (idiopathic Parkinsonism) however the improvement in the true negative rate is limited, specially when compared with the atlas-based approach. This fact can be explained by the heterogeneity of the negative group (composed by subjects diagnosed with MSA and PSP), which makes more difficult to characterize the data.
As mentioned above, the analysis of neuroimaging data for diagnostic purposes in PD-related studies is commonly focused on the striatum. In fact, post-mortem studies reveled that most of the neuropathological hallmarks of PD are gathered in this area (Rinne et al., 1991; Hartmann, 2004; Nagatsu and Sawada, 2007). Nonetheless the region to be analyzed highly depends on the neuroimage modality or, more specifically, on the binding properties of the radiotracer used. For example, studies using 123I-FP-CIT (Winogrodzka et al., 2001; Spiegel et al., 2007) frequently constraint their analyses to the striatum, since this radiotracer binds to dopamine transporters, whereas studies based on 18F-FDG usually analyze the whole brain (Hellwig et al., 2012; Garraux et al., 2013) since this drug measures the brain metabolism. 18F-DMFP is commonly used to study the striatal dopamine (Schreckenberger et al., 2004) and indeed, the vast majority of high-intensity voxels in 18F-DMFP-PET images are gathered in the striatum. However, these data show a not insignificant part of the total intensity in regions other than the striatum (Segovia et al., 2017). The segmentation methodology proposed in this work allows scientists to independently analyze high-signal and medium-signal voxels (respectively located in the striatum and in the remaining regions in 18F-DMFP-PET data) while low-signal voxels (with low signal-noise ratio) are discarded.
Compared with an atlas-based approach, our segmentation method not only provides a higher accuracy in the subsequent classification procedure but also allows the separation of regions of interest in the image space. Thus, it is not necessary to transform the data to the atlas space, avoiding the distortions introduced by these procedures (Ashburner and Friston, 2007).
A comparison between the striatum region obtained by the HMRF-based segmentation method and the atlas-based approach is shown in Figure 4. A quantitative analysis of this comparison reveals that: (i) the striatum region is about 30% larger when obtained by means of the atlas-based approach; (ii) most of the voxels selected by the proposed method (about 72%) were also selected by the other approach. Thus, the improvements in the classification procedure are probably because the HMRF-based segmentation provide a more accurate delimitation of the discriminant voxels. Most of these voxels are located in the striatum but not all the voxels in the striatum should be considered to separate idiopathic and non-idiopathic Parkinsonism. According to the results shown in Table 2, discarding these moderately discriminant voxels of the striatum provides larger sensitivity rates but have a reduced impact in the specificity.
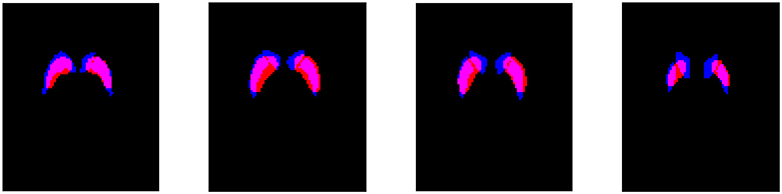
Figure 4. Overlap of the striatum mask obtained by the HMRF-based segmentation (red) and the atlas-based approach (blue). Four axial slices located respectively at −6, 0, 6, and 12 mm from the anterior commissure are shown.
The motivation to use Gaussian distributions to model the histogram of the maps resulting from the segmentation is explained by the Figure 5, which shows the histogram of a 18F-DMFP-PET neuroimage. The two Gaussians corresponding to maps with the low-signal and medium-signal-voxels can be clearly identified. The Gaussian for high-signal voxels has much less height than the remaining ones and can not be appreciated in Figure 5 but it can be identified in the histograms of Figure 2. Finally, the voxels with intensity very close to zero could be modeled by a fourth Gaussian. Indeed, the segmentation of a 18F-DMFP-PET neuroimage using this algorithm is similar to model the histogram of that neuroimage by a sum (or mixture) of 4 Gaussians (Segovia et al., 2010; Górriz et al., 2011). Nevertheless, the HMRF approach takes into account both, the voxel intensity and the voxel neighborhood to associate each voxel to a specific map/Gaussian.
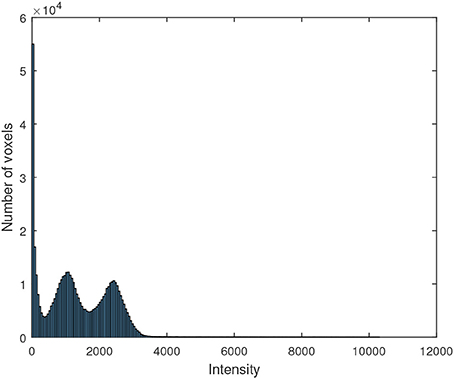
Figure 5. Histogram of a 18F-DMFP-PET neuroimage corresponding to a patient diagnosed with idiopathic Parkinsonism.
In this work, the segmentation method was applied only to an average neuroimage and the result was used to parcel each individual neuroimage. This approach requires lower computational burden than the straightforward alternative consisting on applying the segmentation algorithm to each neuroimage. Additionally the resulting maps are of equal size for all the neuroimages, what allows us to directly use the voxels as feature in the subsequent classification step.
4. Conclusion
In this manuscript we described a novel methodology to preprocess 18F-DMFP-PET data in order to improve the diagnosis of Parkinsonism. The preprocessing method was carried out in two steps. First, using a HMRF-based approach, each neuroimage was divided into 4 maps according to the intensity and the neighborhood of the voxels. Then, the intensity of the voxels was normalized using the properties of the Gaussian distribution. To this end, the histogram of each map was modeled by a Gaussian distribution with the same parameters for all the neuroimages.
This methodology was evaluated using a dataset with neuroimaging data from 87 patients diagnosed with idiopathic or non-idiopathic Parkinsonism. Using the proposed methodology, we selected and normalized the high-signal voxels of each neuroimage. These data were used to train a SVM classifier in order to separate idiopathic and non-idiopathic subjects, obtaining an accuracy rate about 75%. These results outperform those reported by previous approaches, what suggests that our preprocessing method improves the computer tools currently used to assist the diagnosis of Parkinsonism.
Author Contributions
Drafting the article and conception or design of the work: FS. Critical revision of the article, data analysis and interpretation: FS, JG, JR, FM, and DS.
Conflict of Interest Statement
The authors declare that the research was conducted in the absence of any commercial or financial relationships that could be construed as a potential conflict of interest.
Acknowledgments
The authors are grateful to Johannes Levin, Axel Rominger, Madeleine Schuberth, and Matthias Brendel from the University of Munich for their help in data management. This work was supported by and the MINECO under the TEC2012-34306 and TEC2015-64718-R projects and the Ministry of Economy, Innovation, Science and Employment of the Junta de Andalucía under the Excellence Projects P09-TIC-4530 and P11-TIC-7103 and a Talent Hub project approved by the Andalucía Talent Hub Program launched by the Andalusian Knowledge Agency, co-funded by the European Union's Seventh Framework Program, Marie Sklodowska-Curie actions (COFUND — Grant Agreement no. 291780) and the Ministry of Economy, Innovation, Science and Employment of the Junta de Andalucía. The work was also supported by the Vicerectorate of Research and Knowledge Transfer of the University of Granada and the Salvador de Madariaga Mobility Grants 2017.
References
Ashburner, J., and Friston, K. (2007). “Segmentation,” in Statistical Parametric Mapping, eds K. Friston, J. Ashburner, S. Kiebel, T. Nichols, and W. Penny (London: Academic Press), 81–91. doi: 10.1016/B978-012372560-8/50006-1
Ashburner, J., Neelin, P., Collins, D. L., Evans, A., and Friston, K. (1997). Incorporating prior knowledge into image registration. NeuroImage 6, 344–352. doi: 10.1006/nimg.1997.0299
Borghammer, P., Aanerud, J., and Gjedde, A. (2009). Data-driven intensity normalization of PET group comparison studies is superior to global mean normalization. NeuroImage 46, 981–988. doi: 10.1016/j.neuroimage.2009.03.021
Constantinescu, C. C., Coleman, R. A., Pan, M.-L., and Mukherjee, J. (2011). Striatal and extrastriatal microPET imaging of D2/D3 dopamine receptors in rat brain with [18F]fallypride and [18F]desmethoxyfallypride. Synapse (New York, N.Y.) 65, 778–787. doi: 10.1002/syn.20904
Duin, R. (2000). “Classifiers in almost empty spaces,” in 15th International Conference on Pattern Recognition, 2000. Proceedings, Vol. 2 (Barcelona), 1–7.
Dukart, J., Perneczky, R., Förster, S., Barthel, H., Diehl-Schmid, J., Draganski, B., et al. (2013). Reference cluster normalization improves detection of frontotemporal lobar degeneration by means of FDG-PET. PLoS ONE 8:e55415. doi: 10.1371/journal.pone.0055415
Friston, K. J., Ashburner, J. T., Kiebel, S. J., Nichols, T. E., and Penny, W. D. (2006). Statistical Parametric Mapping: The Analysis of Functional Brain Images, 1st Edn. Amsterdam; Boston: Academic Press.
Garraux, G., Phillips, C., Schrouff, J., Kreisler, A., Lemaire, C., Degueldre, C., et al. (2013). Multiclass classification of FDG PET scans for the distinction between Parkinson's disease and atypical parkinsonian syndromes. NeuroImage 2, 883–893. doi: 10.1016/j.nicl.2013.06.004
Górriz, J. M., Ramírez, J., Suckling, J., Illán, I. A., Ortiz, A., Martinez-Murcia, F. J., et al. (2017). Case-based statistical learning: a non-parametric implementation with a conditional-error rate SVM. IEEE Access 5, 11468–11478. doi: 10.1109/ACCESS.2017.2714579
Górriz, J. M., Segovia, F., Ramírez, J., Lassl, A., and Salas-Gonzalez, D. (2011). GMM based SPECT image classification for the diagnosis of Alzheimer's disease. Appl. Soft Comput. 11, 2313–2325. doi: 10.1016/j.asoc.2010.08.012
Hartmann, A. (2004). Postmortem studies in Parkinson's disease. Dialogues Clin. Neurosci. 6, 281–293.
Hellwig, S., Amtage, F., Kreft, A., Buchert, R., Winz, O. H., Vach, W., et al. (2012). 18F-FDG-PET is superior to 123I-IBZM-SPECT for the differential diagnosis of parkinsonism. Neurology 79, 1314–1322. doi: 10.1212/WNL.0b013e31826c1b0a
Huang, C., Tang, C., Feigin, A., Lesser, M., Ma, Y., Pourfar, M., et al. (2007). Changes in network activity with the progression of Parkinson's disease. Brain 130, 1834–1846. doi: 10.1093/brain/awm086
Illán, I. A., Górriz, J. M., Ramírez, J., Segovia, F., Jiménez-Hoyuela, J. M., and Lozano, S. J. O. (2012). Automatic assistance to Parkinson's disease diagnosis in DaTSCAN SPECT imaging. Med. Phys. 39, 5971–5980. doi: 10.1118/1.4742055
Koch, W., Radau, P. E., Hamann, C., and Tatsch, K. (2005). Clinical testing of an optimized software solution for an automated, observer-independent evaluation of dopamine transporter SPECT studies. J. Nucl. Med. 46, 1109–1118.
la Fougère, C., Pöpperl, G., Levin, J., Wängler, B., Böning, G., Uebleis, C., et al. (2010). The value of the dopamine D2/3 receptor ligand 18F-desmethoxyfallypride for the differentiation of idiopathic and nonidiopathic parkinsonian syndromes. J. Nucl. Med. 51, 581–587. doi: 10.2967/jnumed.109.071811
Leenders, K., Perani, D., Lammertsma, A., Heather, J., Buckingham, P., Jones, T., et al. (1990). Cerebral blood flow, blood volume and oxygen utilization: normal values and effect of age. Brain 113, 27–47. doi: 10.1093/brain/113.1.27
Li, L., Wang, J., Lu, W., and Tan, S. (2017). Simultaneous tumor segmentation, image restoration, and blur kernel estimation in PET using multiple regularizations. Comput. Vis. Image Understand. 155, 173–194. doi: 10.1016/j.cviu.2016.10.002
Li, S. Z. (2001). Markov Random Field Modeling in Image Analysis, 2 Edn. Computer Science Workbench. Tokyo: Springer. doi: 10.1007/978-4-431-67044-5
Martínez-Murcia, F. J., Górriz, J. M., Ramírez, J., Illán, I. A., and Ortiz, A. (2014). Automatic detection of Parkinsonism using significance measures and component analysis in DaTSCAN imaging. Neurocomputing 126, 58–70. doi: 10.1016/j.neucom.2013.01.054
Moussallem, M., Valette, P.-J., Traverse-Glehen, A., Houzard, C., Jegou, C., and Giammarile, F. (2012). New strategy for automatic tumor segmentation by adaptive thresholding on PET/CT images. J. Appl. Clin. Med. Phys. 13:3875. doi: 10.1120/jacmp.v13i5.3875
Nagatsu, T., and Sawada, M. (2007). Biochemistry of postmortem brains in Parkinson's disease: historical overview and future prospects. J. Neural Transm. Suppl. 72, 113–120. doi: 10.1007/978-3-211-73574-9_14
Niccolini, F., Su, P., and Politis, M. (2014). Dopamine receptor mapping with PET imaging in Parkinson's disease. J. Neurol. 261, 2251–2263. doi: 10.1007/s00415-014-7302-2
Prashanth, R., Dutta Roy, S., Mandal, P. K., and Ghosh, S. (2014). Automatic classification and prediction models for early Parkinson's disease diagnosis from SPECT imaging. Exp. Syst. Appl. 41, 3333–3342. doi: 10.1016/j.eswa.2013.11.031
Rinne, J. O., Laihinen, A., Lönnberg, P., Marjamäki, P., and Rinne, U. K. (1991). A post-mortem study on striatal dopamine receptors in Parkinson's disease. Brain Res. 556, 117–122. doi: 10.1016/0006-8993(91)90554-9
Salas-Gonzalez, D., Górriz, J. M., Ramírez, J., Illán, I. A., and Lang, E. W. (2013). Linear intensity normalization of FP-CIT SPECT brain images using the α-stable distribution. NeuroImage 65, 449–455. doi: 10.1016/j.neuroimage.2012.10.005
Saxena, P., Pavel, D. G., Quintana, J. C., and Horwitz, B. (1998). “An automatic threshold-based scaling method for enhancing the usefulness of Tc-HMPAO SPECT in the diagnosis of Alzheimer's disease,” in Medical Image Computing and Computer-Assisted Interventation — MICCAI'98, Lecture Notes in Computer Science, eds W. M. Wells, A. Colchester, and S. Delp (Cambridge MA: Springer Berlin Heidelberg), 623–630. doi: 10.1007/BFb0056248
Schreckenberger, M., Hägele, S., Siessmeier, T., Buchholz, H.-G., Armbrust-Henrich, H., Rösch, F., et al. (2004). The dopamine D2 receptor ligand 18F-desmethoxyfallypride: an appropriate fluorinated PET tracer for the differential diagnosis of parkinsonism. Eur. J. Nucl. Med. Mol. Imaging 31, 1128–1135. doi: 10.1007/s00259-004-1465-5
Schrouff, J., Rosa, M. J., Rondina, J. M., Marquand, A. F., Chu, C., Ashburner, J., et al. (2013). PRoNTo: pattern recognition for neuroimaging toolbox. Neuroinformatics 11, 319–337. doi: 10.1007/s12021-013-9178-1
Segovia, F., Górriz, J. M., Ramírez, J., Álvarez, I., Jiménez-Hoyuela, J. M., and Ortega, S. J. (2012). Improved Parkinsonism diagnosis using a partial least squares based approach. Med. Phys. 39, 4395–4403. doi: 10.1118/1.4730289
Segovia, F., Górriz, J. M., Ramírez, J., Martínez-Murcia, F. J., Levin, J., Schuberth, M., et al. (2017). Multivariate analysis of 18F-DMFP PET data to assist the diagnosis of parkinsonism. Front. Neuroinformatics 11:23. doi: 10.3389/fninf.2017.00023
Segovia, F., Górriz, J. M., Ramírez, J., Salas-González, D., Álvarez, I., López, M., et al. (2010). Classification of functional brain images using a GMM-based multi-variate approach. Neurosci. Lett. 474, 58–62. doi: 10.1016/j.neulet.2010.03.010
Segovia, F., Illán, I. A., Górriz, J. M., Ramírez, J., Rominger, A., and Levin, J. (2015). Distinguishing Parkinson's disease from atypical parkinsonian syndromes using PET data and a computer system based on support vector machines and Bayesian networks. Front. Comput. Neurosci. 9:137. doi: 10.3389/fncom.2015.00137
Spiegel, J., Hellwig, D., Samnick, S., Jost, W., Möllers, M.-O., Fassbender, K., et al. (2007). Striatal FP-CIT uptake differs in the subtypes of early Parkinson's disease. J. Neural Transm. 114, 331–335. doi: 10.1007/s00702-006-0518-2
Towey, D. J., Bain, P. G., and Nijran, K. S. (2011). Automatic classification of 123I-FP-CIT (DaTSCAN) SPECT images. Nucl. Med. Commun. 32, 699–707. doi: 10.1097/MNM.0b013e328347cd09
Varma, S., and Simon, R. (2006). Bias in error estimation when using cross-validation for model selection. BMC Bioinformatics 7:91. doi: 10.1186/1471-2105-7-91
Winogrodzka, A., Bergmans, P., Booij, J., van Royen, E. A., Janssen, A. G., and Wolters, E. C. (2001). [123I]FP-CIT SPECT is a useful method to monitor the rate of dopaminergic degeneration in early-stage Parkinson's disease. J. Neural Transm. 108, 1011–1019. doi: 10.1007/s007020170019
Keywords: PET image segmentation, 18F-DMFP-PET data, intensity normalization, Hidden Markov Models, Gaussian distribution, Parkinson's disease
Citation: Segovia F, Górriz JM, Ramírez J, Martínez-Murcia FJ and Salas-Gonzalez D (2017) Preprocessing of 18F-DMFP-PET Data Based on Hidden Markov Random Fields and the Gaussian Distribution. Front. Aging Neurosci. 9:326. doi: 10.3389/fnagi.2017.00326
Received: 18 March 2017; Accepted: 20 September 2017;
Published: 09 October 2017.
Edited by:
Pedro Rosa-Neto, McGill University, CanadaReviewed by:
Manuel Grana, University of the Basque Country (UPV/EHU), SpainAna Maria Tome, University of Aveiro, Portugal
Copyright © 2017 Segovia, Górriz, Ramírez, Martínez-Murcia and Salas-Gonzalez. This is an open-access article distributed under the terms of the Creative Commons Attribution License (CC BY). The use, distribution or reproduction in other forums is permitted, provided the original author(s) or licensor are credited and that the original publication in this journal is cited, in accordance with accepted academic practice. No use, distribution or reproduction is permitted which does not comply with these terms.
*Correspondence: Fermín Segovia, fsegovia@ugr.es