Adenosine A2A Receptor in Bone Marrow-Derived Cells Mediated Macrophages M2 Polarization via PPARγ-P65 Pathway in Chronic Hypoperfusion Situation
 Ke-Jie Mou1†
  Kai-Feng Shen
- 1Department of Neurosurgery, Bishan Hospital of Chongqing, Chongqing, China
- 2Department of Neurosurgery, Xinqiao Hospital, Army Medical University, Chongqing, China
- 3Department of Neurology, Xinqiao Hospital, Army Medical University, Chongqing, China
- 4Department of Pediatrics, Xinqiao Hospital, Army Medical University, Chongqing, China
Background: The role of adenosine A2A receptor (A2AR) in the ischemic white matter damage induced by chronic cerebral hypoperfusion remains obscure. Here we investigated the role of A2AR in the process of macrophage polarizations in the white matter damage induced by chronic cerebral hypoperfusion and explored the involved signaling pathways.
Methods: We combined mouse model and macrophage cell line for our study. White matter lesions were induced in A2AR knockout mice, wild-type mice, and chimeric mice generated by bone marrow cells transplantation through bilateral common carotid artery stenosis. Microglial/macrophage polarization in the corpus callosum was detected by immunofluorescence. For the cell line experiments, RAW264.7 macrophages were treated with the A2AR agonist CHS21680 or A2AR antagonist SCH58261 for 30 min and cultured under low-glucose and hypoxic conditions. Macrophage polarization was examined by immunofluorescence. The expression of peroxisome proliferator activated receptor gamma (PPARγ) and transcription factor P65 was examined by western blotting and real-time polymerase chain reaction (RT-PCR). Inflammatory cytokine factors were assessed by enzyme-linked immunosorbent assay (ELISA) and RT-PCR.
Results: Both global A2AR knockout and inactivation of A2AR in bone marrow-derived cells enhanced M1 marker expression in chronic ischemic white matter lesions. Under low-glucose and hypoxic conditions, CGS21680 treatment promoted macrophage M2 polarization, increased the expression of PPARγ, P65, and interleukin-10 (IL-10) and suppressed the expression of tumor necrosis factor-α (TNF-α) and interleukin-1β (IL-1β). The CGS21680-induced upregulation of P65 and IL-10 was abolished in macrophages upon PPARγ knockdown. The downregulation of TNF-α and IL-1β by CGS21680 was less affected by PPARγ knockdown.
Conclusions: In the cerebral hypoperfusion induced white matter damage, A2AR signaling in bone marrow-derived cells induces macrophage M2 polarization and increases the expression of the anti-inflammatory factor IL-10 via the PPARγ-P65 pathway, both of which might explain its neuroprotective effect.
Introduction
The role of adenosine A2A receptor (A2AR) in ischemic brain injury has attracted increasing attention in recent years. It has been shown that A2AR knockout (KO) could significantly inhibit the local inflammatory response and ameliorate acute ischemic brain injury (Chen et al., 1999). However, we found that A2AR KO significantly enhanced the local inflammatory response and aggravated ischemic white matter injury induced by chronic cerebral hypoperfusion (Duan et al., 2009). Therefore, the pathological mechanisms of the ischemic white matter lesion induced by chronic cerebral hypoperfusion remain obscure and the detailed effects of A2AR on ischemic brain injury are still unclear. Interestingly, a recent research found that selective inactivation of A2AR in bone marrow-derived cells (BMDCs) promotes inflammatory cytokine expression and aggravates chronic hypoperfusion-induced white matter lesions (Ran et al., 2015), suggesting that A2AR in BMDCs might play a crucial role in such type of white matter injury. In line with this result, activation of A2AR was found to inhibit inflammatory injury in peripheral organs (e.g., the lung and liver), and peripheral macrophages might be the key inflammatory cells involved in the aggravation of white matter injury induced by chronic cerebral hypoperfusion (Patel et al., 2020; Wang et al., 2020). Therefore, further studies are needed to clarify the role of A2AR in BMDCs in regulating inflammatory responses and white matter injury induced by chronic hypoperfusion.
The release of inflammatory factors is determined by the state of inflammatory cells (Ahmad et al., 2017a, 2018b, 2019; Ansari et al., 2017a; Lan et al., 2017). Resident microglia and peripheral macrophages are rapidly mobilized to the site of injury and initiate the release of effective molecules and recruitment of other immune cells. Microglia and macrophages are highly plastic cells that can adopt diverse phenotypes and activate different functional programs in response to specific microenvironmental signals, thus been implicated in the pathology of numerous diseases involving acute ischemic brain injury (Hu et al., 2012; Qin et al., 2017), multiple sclerosis (Chu et al., 2019), spinal cord injury (Paterniti et al., 2011), Alzheimer's disease, and other central nervous system associated diseases (Hu, 2020; Lei et al., 2021). However, the modulating role of A2AR in microglia/macrophage polarization in the development of white matter injury has not yet been comprehensively characterized.
In this study, we investigated the effect of A2AR on microglia/macrophage polarization with a mouse model of chronic cerebral hypoperfusion induced white matter lesions by bilateral common carotid artery stenosis (BCAS). Furthermore, we established chimeric mice by BMDCs transplantation to analyze the role of A2AR in bone marrow derived microglia/macrophage polarization after cerebral hypoperfusion. In addition, in vitro cell line study was performed to verify the effect of A2AR on macrophage polarization and explore related molecular mechanisms.
Materials and Methods
Animals
The A2AR KO C57BL/6 mice were a gift from Dr. Jiang-Fan Chen (Boston University School of Medicine, Boston, MA). The genotype of each mouse was determined using polymerase chain reaction (PCR), as previously reported (Chen et al., 1999). Age-matched KO and wild-type (WT) mice (10 weeks old) were used for this study. The mice were housed under standard conditions (temperature: 23 ± 1°C; illumination: 12-h light/12-h dark cycle; food and water: ad libitum). All surgeries were performed under anesthesia with sodium pentobarbital (50 mg/kg). All animal care and experimental procedures were approved by the Institutional Animal Care and Use Committee of the Army Medical University (SYXK-PLA-2007035), where the principle of the 3Rs (Replacement, Reduction, and Refinement) has been developed and enhanced.
Generation of Chimeric Mice
Chimeric mice were generated via BMDC transplantation as previously reported (Yu et al., 2004; Ran et al., 2015). Male recipient mice were irradiated with a total dose of 12.5 Gy of 60Co. Bone marrow cells were isolated from female donor mice after scarification with a lethal dose of sodium pentobarbital. Recipient male mice were injected with an aliquot of ~2 × 10⁸ BMDCs in 300 μl RPMI-1640 medium containing 10% fetal bovine serum via the tail vein. The efficiency of selective reconstitution of BMDCs in the chimeric mice was assessed seven weeks after the transplantation according to previous studies (Yu et al., 2004; Ran et al., 2015).
Establishment of Chronic Cerebral Hypoperfusion by BCAS
BCAS was performed according to the previously established methods (Shibata et al., 2004). The microcoils (Invitrotech, Osaka, Japan) used for BCAS were composed of piano wire with an inner diameter of 0.18 mm. The bilateral common carotid arteries of the mice were exposed through a midline cervical incision and freed from their sheaths after anesthetization. Subsequently, the right artery was gently placed between the loops of the microcoil directly beneath the carotid bifurcation and was wrapped around the common carotid artery. After 30 min, another microcoil of the same size was wrapped around the left common carotid artery. The rectal temperature was maintained between 36.5 and 37.5°C throughout the procedure. Cerebral blood flow was monitored by laser Doppler flowmetry as previously described (Shibata et al., 2004). In sham group, the common carotid arteries were exposed but not wrapped by microcoil.
Immunofluorescence Staining
Mice were deeply anesthetized with pentobarbital and transcardially perfused with PBS followed by 4% paraformaldehyde at 3, 7, 14, and 28 d after BCAS. The brains were harvested, postfixed in 4% paraformaldehyde for 12 h, and subsequently stored in 30% sucrose. Serial coronal sections (30 μm) spanning the anterior region of the callosum (bregma-0.26 mm) to the anterior region of the hippocampus (bregma-0.94 mm) were cut with a cryostat. The serial coronal sections were preincubated in 5% goat serum and incubated overnight at 4°C in the primary antibody solution followed by three-time washes in the PBS. The sections were then incubated in the secondary antibody solution for 1 h at room temperature and PBS-washed. Finally, the sections were evaluated by confocal microscopy. The following primary antibodies were used in the study: anti-inducible nitric oxide synthase (iNOs) antibody (M1 polarization marker, 1:200, NB300-605, NOVUS Biologicals, Building IV Centennail, CO 80112,USA), goat anti-CD16/32 antibody (M1 polarization marker, 1:200, AF1460, R&D Systems, Minneapolis, Toll Free USA, Canada), rabbit anti-Arginase-1 (Arg-1) antibody (M2 polarization marker, 1:200, NBP1-32731, NOVUS Biologicals, Building IV Centennial, CO 80112, USA), rabbit anti-CD206 antibody (M2 polarization marker, 1:100, NBP1-90020, NOVUS Biologicals, Building IV Centennial, CO 80112, USA) and rabbit anti-Iba1 antibody (1:200, ab178847, Abcam, Waltham, MA 02453, USA), and the following secondary antibodies were used: fluorescent-conjugated sheep anti-rabbit or anti-goat IgG (1:50, ZF0311; ZF0314; ZF0316; ZF0317, Zhongshan JinQiao Biotechnology Co., Ltd, Beijing, China).
For confocal microscopy detection, 200× non-overlapping high-power fields (0.5 × 0.5 mm, total area of 0.25 mm2) in the center of the corpus callosum were selected using a square grid inserted into the eyepiece. The integrated optical density (IOD) of the target protein in the corpus callosum in five mice from each group was analyzed using the Image-Pro Plus 4.5 (Media Cybernetics, Silver Spring, MD). The IODs in the regions of interest were measured as gray values. Three fields within the regions of interest in three sections per animal were examined. For each section, the IODs in three selected fields of the corpus callosum were averaged.
Cell Culture and Stimulation
The RAW264.7 macrophage cell line was purchased from ScienCell Laboratory (San Diego, California, USA) and cultured in the DMEM with 10% FBS (Gibco, USA), 100 U/mL penicillin, and 100 μg/mL streptomycin at 37°C in 5% CO2 in a humidified incubator. For the A2AR manipulation experiment, 1 × 10⁶ macrophage cells per well were treated by the A2AR agonist CGS21680 (1.0 μM) or antagonist SCH58261 (1.0 μM) for 30 min and transferred to the low-glucose DMEM and cultured under a hypoxic condition (1% O2, 5% CO2, and 94% N2; 37°C). For the shRNA experiment, macrophage cells were transfected with a lentivirus carrying the shRNA targeting PPARγ (5'-3': GCTGGCCTCCCTGATGAATAA). Following experiments were performed after the cells were cultured in low-glucose and hypoxic conditions for 2, 6, 12, or 24 h.
Western Blot
Total protein was extracted from cells using a whole protein extraction kit (Key GEN, China). Total protein concentrations were determined on a UV spectrophotometer using a modified Bradford assay (Beckman Coulter, Fullerton, CA; Ran et al., 2015). Equal amounts of protein from each sample were separated via electrophoresis on 8% polyacrylamide gels and then transferred to polyvinylidene fluoride (PVDF) membranes. The membranes were blocked by 5% skimmed milk and incubated overnight at 4°C with the following primary antibodies: a rabbit anti-PPARγ antibody (1:1000, AF6284, Affinity Bioscience, Beijing, China), rabbit anti-P65 antibody (1:1000, NB100-2176, NOVUS Biologicals, Building IV Centennial, CO 80112, USA), or rabbit anti-p-P65 antibody (1:1000, NB100-82088, NOVUS Biologicals, Building IV Centennial, CO 80112, USA). After washed with TBST for three times, the membranes were incubated with goat anti-rabbit secondary antibody (1:1000, ZB2301, ZhongShan JinQiao Biotechnology Co., Ltd, Beijing, China) or goat anti-mouse secondary antibody (1:100, ZB2305, ZhongShan JinQiao Biotechnology Co., Ltd, Beijing, China). The amount of β-actin (detected by anti-beta-actin, 1:2000, SC-47778, Santa Cruz Biotechnology, Santa Cruz, CA) was used as the internal control. The PVDF membranes were developed and visualized, and the optical density (OD) of each specific protein band was measured using an image analysis software (QuantityOne 4.4.0.36; Bio-Rad, Hercules, CA) and normalized to the OD of the β-actin.
Real-Time Quantitative PCR (RT-PCR)
Total RNA was isolated from macrophages and reversely transcribed using MMLV Reverse Transcriptase (Thermo Fisher Scientific, USA). Complementary DNA was amplified by PCR using a SYBR Green kit (TaKaRa BioInc, Dalian, China) and an ABI 7500 qPCR system (Applied Biosystems). Each PCR cycle consisted of 6 min of denaturation at 95°C, 30 s of denaturation at 95°C, 45 s of annealing at 65°C and 30 s of extension at 72°C, and 40 PCR cycles were performed. β-actin was used as the internal control. The 2−ΔΔct method was used for the quantification. The sequences of the primers used for PPARγ, P65, inflammatory cytokines, and β-actin were shown in the Supplementary Table 1. For each sample, at least three independent PCR experiments were performed.
Enzyme-Linked Immunosorbent Assay (ELISA)
The protein expression of inflammatory cytokines from macrophages cultured under low-glucose and hypoxic conditions was examined by ELISA. Mouse Quantikine ELISA kits for tumor necrosis factor-α (TNF-α), interleukin-1β (IL-1β), and IL-10 (R&D Systems, MTA00B, MLB00C, and M1000B) were used in the study. Working reagents were prepared and 50 μl of standard controls and cell supernatants from each group were added to the wells of a plate according to manufactures instructions. The antibody was added and incubated for two hours at room temperature, followed by incubation with the substrate solution for 30 min. The absorbance was read using a FLvostar Omega microplate reader at 450 nm and 540 nm.
Immunocytochemistry
Briefly, cultured macrophages were fixed in 4% formaldehyde for 1 h and incubated with a rabbit anti-iNOs antibody (M1 polarization marker, 1:200, NB300-605, NOVUS Biologicals, Building IV Centennial, CO 80112, USA) or rabbit anti-Arg-1 antibody (M2 polarization marker, 1:200, NBP1-32731, NOVUS Biologicals, Building IV Centennial, CO 80112, USA) overnight at 4°C. The cells were then PBS-washed and incubated with fluorescein isothiocyanate FITC/TRITC-conjugated goat anti-rabbit secondary antibodies (1:50, ZF0311; ZF0316, Zhongshan JinQiao Biotechnology Co., Ltd, Beijing, China). After washed with PBS, the cells were stained with DAPI (40 mg/ml) for 5 min and examined with a laser-scanning microscope (ZEISS, Germany). The IODs of the target proteins were analyzed using the Image-Pro Plus 4.5 software (Media Cybernetics, Silver Spring, MD). Briefly, a Leica DMIRB microscope was used to examine each cell section, and 200× non-overlapping high-power fields (0.5 × 0.5 mm, total area of 0.25 mm2) in the center of the eyepiece were selected. The IODs in the regions of interest were measured as gray values, and the number of positive cells in these regions was counted. Three fields within the regions of interest in three slices from each group were examined. For each slice, the ratios of the IOD to the number of positive cells in three selected fields were averaged.
Statistical Analysis
The data were expressed as the mean ± SEM. Two-way ANOVA test followed by Turkey's multiple comparisons test was used to detect the difference among more than two groups. All of data used for the analysis were viewed in a blinded manner. The data were plotted and analyzed with GraphPad Prism 6. P < 0.05 was considered statistically significant.
Results
A2AR Deletion Affected the Expression of M1 and M2 Markers in Mice With BCAS
In the present study, we induced chronic cerebral hypoperfusion in A2AR KO mice and WT mice by BCAS and then measured the M1 and M2 markers by immunofluorescence staining in a time series manner (i.e., 3, 7, 14, and 28 d after BCAS). Glia in the corpus callosum was activated after BCAS, as indicated by the increase of Iba1 positive cells (Figure 1A). Representative immunofluorescence staining images for M1 makers including inducible nitric oxide synthase (iNOs) and CD16/32 in the corpus callosum in the sham group (WT without BCAS), WT group and KO group after BCAS were shown (Figures 1B,D). Statistical analysis showed that the IODs of iNOs were increased after BCAS both in the WT and KO groups, while the ones in the sham group remained constant (***P < 0.001 versus the same time point in sham group, Two-way ANOVA test followed by Turkey's multiple comparisons test; Figure 1C). Moreover, the IODs of iNOs were peaked at 7 d in the WT group and decreased later at 14 and 28 d, while the IODs of iNOs in KO group were continuously increased from 3 to 28 d and reached a greater level than that in the WT group from 14 d (***P < 0.001, Two-way ANOVA test followed by Turkey's multiple comparisons test; Figure 1C). Consistent with iNOs, the IODs of CD16/32 were increased both in the WT and KO groups after BCAS (Figure 1E) (***P < 0.001 versus the same time point in sham group, Two-way ANOVA test followed by Turkey's multiple comparisons test). However, the IODs of CD16/32 were increased more dramatically in the KO mice after BCAS compared to the alteration in the WT mice (***P < 0.001, Two-way ANOVA test followed by Turkey's multiple comparisons test; Figure 1D). Together, these findings suggested that the corpus callosum expression of iNOs and CD16/32 in the A2AR KO mice was enhanced after BCAS.
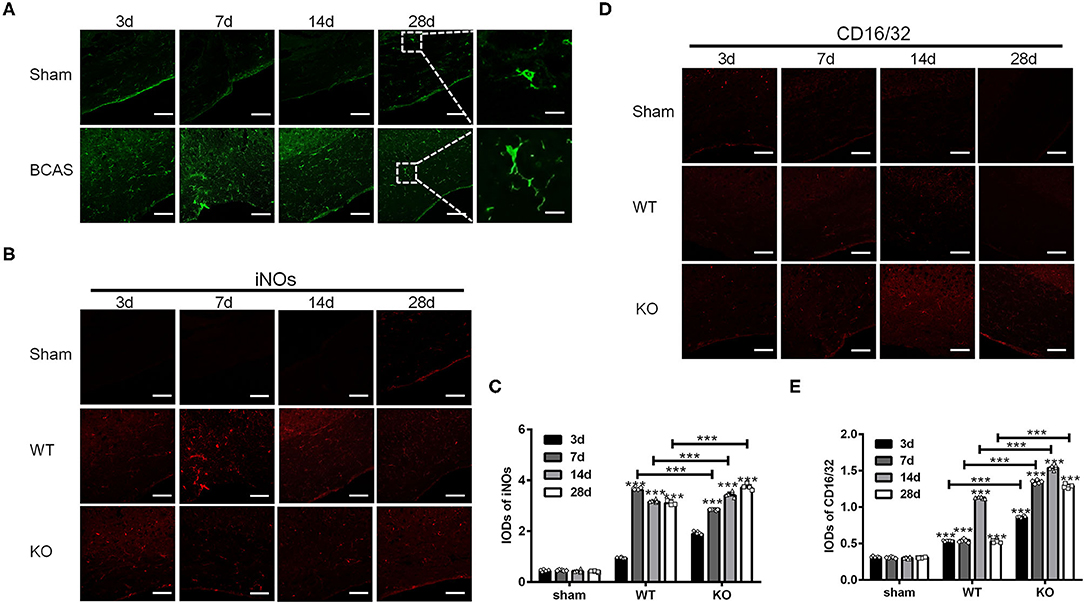
Figure 1. Knockout of A2AR enhanced the expression of iNOs and CD16/32 in corpus callosum of mice with chronic cerebral hypoperfusion. (A) Representative images showing the morphology of Iba1 positive glia in the corpus callosum of mice at 3, 7, 14, and 28 d after sham or BCAS operation. Scale bars: 50 and 5μm. (B) Representative images showing the staining of iNOs in the corpus callosum of sham operated WT mice (upper panel) and BCAS operated WT and A2AR KO mice at 3, 7, 14, and 28 d. Scale bars: 50 μm. (C) Statistically analysis showing the IODs for iNOs was increased after BCAS both in the WT and KO group Moreover, the IODs of iNOs were peaked at 7 d in the WT group and decreased at 14 and 28 d, while the IODs of iNOs in KO group were continuously increased from 3–28 d and reached a greater level than that in the WT group from 14 d (***P < 0.001, Two-way ANOVA test followed by Turkey's multiple comparisons test. n = 5 mice for each group). (D) Representative images showing the staining of CD16/32 in the corpus callosum of sham, BCAS operated WT and A2AR KO mice at 3, 7, 14, and 28 d. Scale bars: 50 μm. (E) Statistically analysis showing the IODs for CD16/32 was increased after BCAS both in the WT and KO group, and the increase in KO group were more dramatic compared to the alteration in the WT mice (***P < 0.001, Two-way ANOVA test followed by Turkey's multiple comparisons test. n = 5 mice for each group).
Next, we examined the expression of Arg-1 and CD206 in the sham, WT and KO groups in the similar way (Figures 2A,C). Statistical analysis showed that the IODs of Arg-1 and CD206 in the corpus callosum were not affected by the sham operation but increased both in the WT and KO groups after BCAS (***P < 0.001 versus the same time point in sham group, Two-way ANOVA test followed by Turkey's multiple comparisons test; Figures 2B,D). In addition, both the IODs of Arg-1 and CD206 were decreased significantly in the KO mice after reaching peak at 7 d after BCAS, while remained relatively constant in the WT mice at that time (***P < 0.001, Two-way ANOVA test followed by Turkey's multiple comparisons test; Figures 2B,D). These results suggested that the corpus callosum expression of the M2 markers Arg-1 and CD206 was impaired in the A2AR KO mice after BCAS.
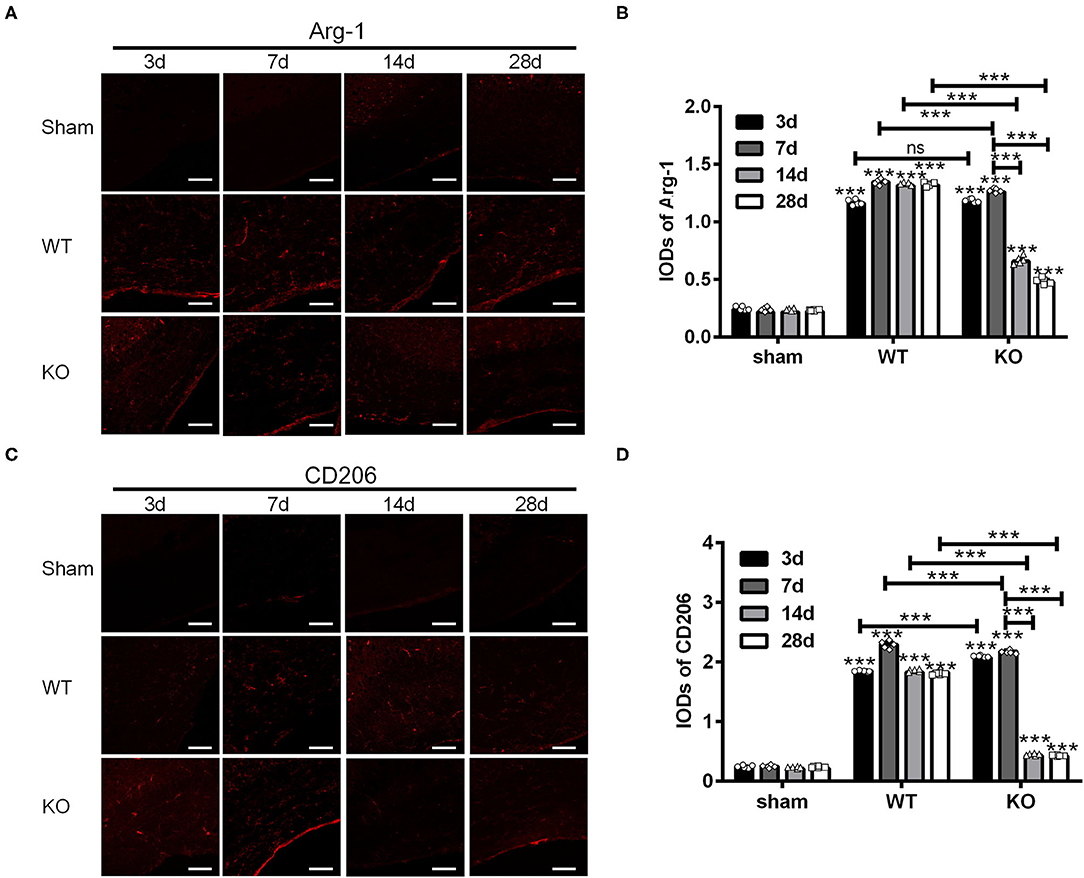
Figure 2. Knockout of A2AR reduced the expression of Arg-1 and CD206 in corpus callosum of mice underwent chronic cerebral hypoperfusion. (A,C) Representative images showing the expression of Arg-1 in sham, WT and KO group at 3, 7, 14, and 28 d after BCAS. Scale bars: 50 μm. (B,D) Statistically analysis showing the IOD for Arg-1 and CD206 was increased both in WT and KO groups after BCAS. In addition, the IODs of Arg-1 and CD206 were decreased significantly in the KO mice after reaching peak at 7 d after BCAS, while remained relatively constant in the WT mice at the same time (***P < 0.001, Two-way ANOVA test followed by Turkey's multiple comparisons test. n = 5 mice for each group). ns, non significant; p >0.05.
A2AR in BMDCs Regulated M1/M2 Polarization in Mice With White Matter Damage
To elucidate the effect of A2AR in BMDCs on microglia/macrophage polarization after chronic cerebral hypoperfusion, we performed BCAS in the chimeric mice where A2AR was selectively inactivated in BMDCs by bone marrow cell transplantation (Methods). Immunofluorescence staining for iNOs and Arg-1 in the corpus callosum of chimeric mice (KOWT) and control mice (WT → WT) was performed at 3, 7, 14, and 28 d after BCAS. As shown in the representative images and statistical analysis (Figures 3A,B), the IODs of iNOs in the corpus callosum were greater in the chimeric mice at 3 and 7 d after BCAS than the control mice, reduced at 14 d and back to the similar level within control mice at 28 d (***P < 0.001, Two-way ANOVA test followed by Turkey's multiple comparisons test). Similar analyses found that the IODs of Arg-1 in the corpus callosum were stronger in the chimeric mice at 3 and 14 d after BCAS and reduced significantly at 28 d compared to the control mice (***P < 0.001, Two-way ANOVA test followed by Turkey's multiple comparisons test; Figures 3C,D). Thus, as the IODs of both iNOs and Arg-1 were increased within 14 d after BCAS in the chimeric mice, and the IOD of Arg-1 was reduced while the IOD of iNOs was not affected at 28 d after BCAS, we reasoned that the selective inactivation of A2AR in BMDCs might polarize microglial/macrophage toward M1 phenotype in the corpus callosum at the later phase of white matter damage.
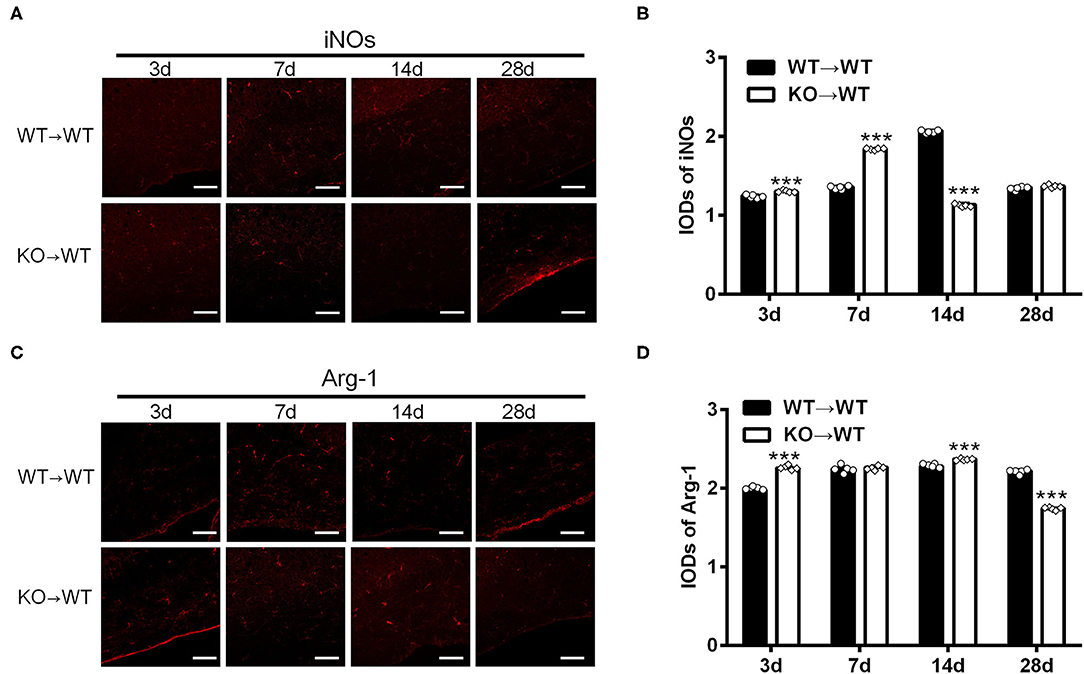
Figure 3. A2AR in BMDCs modulated the expression of iNOs and Arg-1 in corpus callosum in mice underwent chronic cerebral hypoperfusion. (A,C) Representative images showing the expression of iNOs and Arg-1 in control mice (WT → WT) and chimeric mice (KO → WT) established by bone marrow transplantation at 3, 7, 14, and 28 d after BCAS. Scale bars: 50 μm. (B,D) Statistical analysis showing the IOD for iNOs in chimeric mice was increased at 3 and 7 d but decreased after BCAS (***P < 0.001, Two-way ANOVA test followed by Turkey's multiple comparisons test. n = 5 mice for each group). The IOD for Arg-1 was stronger at 3 and 14 d in chimeric mice and decreased significantly at 28 d compared to the control mice (***P < 0.001, Two-way ANOVA test followed by Turkey's multiple comparisons test. n = 5 mice for each group).
A2AR Modulated the Polarization of Cultured Macrophages and Their Cytokine Expression
To test whether A2AR activation could switch macrophages from M1 phenotype to M2 phenotype, we treated RAW264.7 macrophage cells with the A2AR agonist CGS21680 or antagonist SCH58261 and cultured the cells under low-glucose and hypoxic conditions. For both drug treatments, we used the dose of 1.0 μM, which was shown to be sufficient to modulate the protein and mRNA expression of iNOS, CD16/23, Arg-1 and CD206 in such culture conditions (Supplementary Figure 1). The expression of iNOs and Arg-1 was measured at 2, 6, 12, and 24 h after cultured under low-glucose and hypoxic conditions (referred to as “post-culture” hereafter). Representative results for iNOs immunostaining in macrophages were shown in Figure 4A. Statistical analysis showed that the IOD/positive cell number ratios for iNOs were reduced by CGS21680 while increased by SCH58261 at post-culture 6, 12, and 24 h (***P < 0.001, Two-way ANOVA test followed by Turkey's multiple comparisons test; Figure 4C). Representative results for Arg-1 immunostaining were shown in Figure 4B. Statistical analysis showed the IOD/positive cell number ratios for Arg-1 in the CGS21680 group were reduced than the control group at post-culture 2 and 6 h, but significantly increased at post-culture 12 and 24 h (***P < 0.001, Two-way ANOVA test followed by Turkey's multiple comparisons test; Figure 4D). With SCH58261 treatment, the ratios for Arg-1 were increased at post-culture 2 and 6 h, and reduced significantly at post-culture 12 and 24 h (***P < 0.001 vs. 2 h in the same group, Two-way ANOVA test followed by Turkey's multiple comparisons test; Figure 4D). Together, these findings suggest that the expression of iNOs is down-regulated and the expression of Arg-1 is up-regulated by CGS21680 ultimately in the chronic phase of low-glucose and hypoxic conditions.
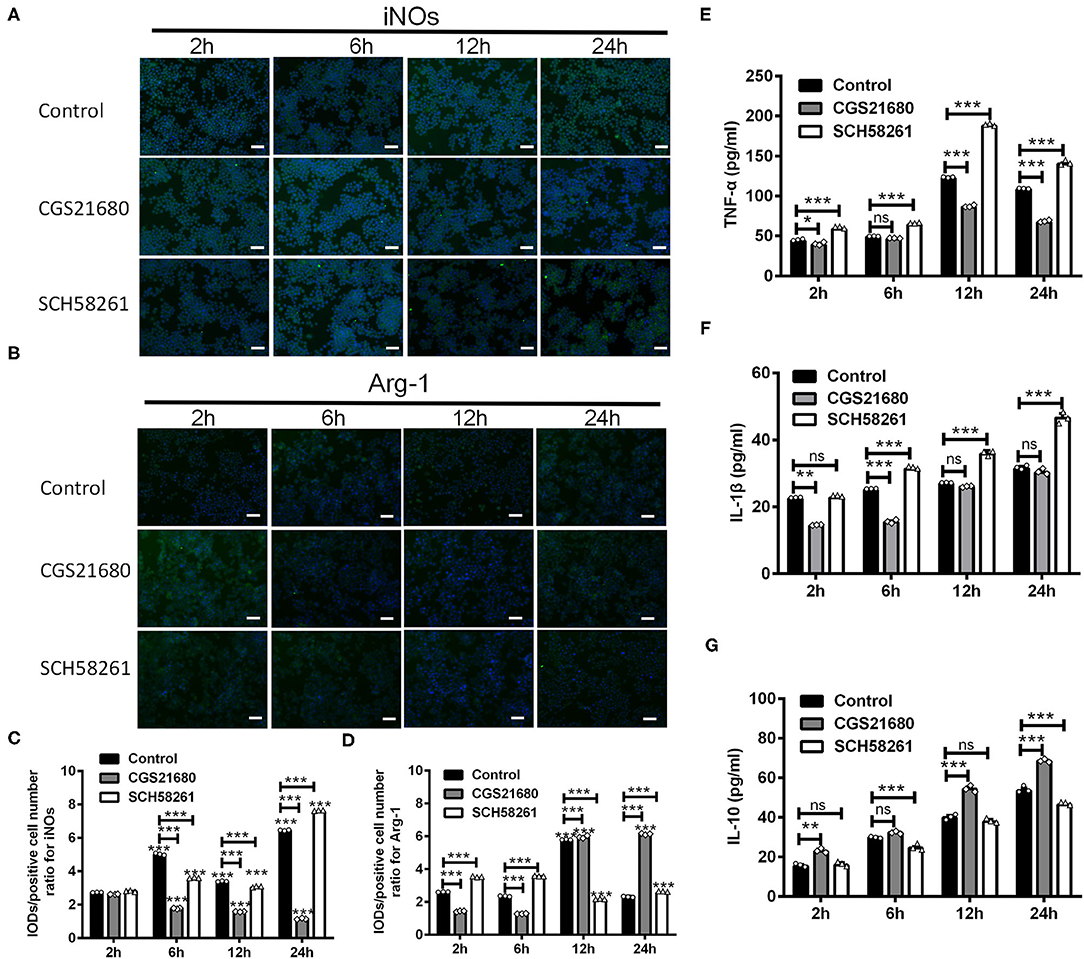
Figure 4. CGS21680 or SCH58261 regulated the expression of iNOs and Arg-1 in macrophages cultured in low-glucose and hypoxic conditions. (A,B) Representative immunofluorescent images for iNOs and Arg-1 in agonist GS21680 or SCH58261 treated macrophages at post-culture 2, 6, 12, and 24 h. Scale bars: 100 μm. (C,D) Statistically analysis showing the ratio of IOD/positive cells number for iNOs was significantly reduced by CGS21680 and increased by SCH5826 at post-culture 6, 12, and 24 h (***P < 0.001, Two-way ANOVA test followed by Turkey's multiple comparisons test. n = 3 independent experiments for each group). The IOD/positive cell number ratios for Arg-1 in the CGS21680 group were reduced at post-culture 2 and 6 h, but significantly increased at post-culture 12 and 24 h (***P < 0.001, Two-way ANOVA test followed by Turkey's multiple comparisons test. n = 3 independent experiments for each group). (E,F) Statistically analysis showing CGS21680 or SCH58261 inhibited or potentiated the increase of the protein of TNF-α, IL-1β at post-culture (ns: P > 0.05, *P < 0.05, **P < 0.01, ***P < 0.001, Two-way ANOVA test followed by Turkey's multiple comparisons test. n = 3 independent experiments for each group). (G) Statistically analysis showing the protein expression of IL-10 was increased after post-culture, while CGS21680 or SCH58261 exacerbated or inhibited the expressional level of IL-10 (ns: P > 0.05, **P < 0.01, ***P < 0.001, Two-way ANOVA test followed by Turkey's multiple comparisons test. n = 3 independent experiments for each group). ns, non significant; p >0.05.
In addition, we evaluated the protein expression of TNF-α, IL-1β, and IL-10 in macrophages upon the CGS21680 or SCH58261 treatment by ELISA. Statistical results showed that for the control group, the protein levels of inflammatory cytokines TNF-α and IL-1β were increased along with the culture time, and the treatment of CGS21680 or SCH58261 inhibited or potentiated the increasing tendency, respectively (ns: P > 0.05, *P < 0.05, **P < 0.01, ***P < 0.001, Two-way ANOVA test followed by Turkey's multiple comparisons test; Figures 4E,F). Conversely, for the anti-inflammatory cytokine IL-10, while the protein level was also increased along with the culture time, SCH58261 and CGS21680 displayed inductory and inhibitory effects, respectively (ns: P > 0.05, **P < 0.01, ***P < 0.001, Two-way ANOVA test followed by Turkey's multiple comparisons test; Figure 4G). Taken together, these results suggest that inflammatory and anti-inflammatory cytokines in macrophages cultured under low-glucose and hypoxic conditions was likely to be modulated by the A2AR in the opposite directions.
PPARγ-P65 Axis Was Involved in Macrophages Polarization in Low-Glucose and Hypoxic Conditions
Next, we examined whether A2AR-mediated macrophages polarization involves the PPARγ-P65 signaling pathway, which is known to mediate inflammatory responses in various diseases (Villapol, 2018). By western blotting, we found that the protein expression of PPARγ was increased at 6, 12, and 24 h post low-glucose and hypoxic culture for the control group (***P < 0.001 vs. 2 h, Two-way ANOVA test followed by Turkey's multiple comparisons test; Figures 5A,B). Upon CGS21680 treatment, the protein level of PPARγ was increased only at post-culture 12 h. In comparison, the treatment of SCH58261 led to the reduced expression of PPARγ at all the time points (***P < 0.001, Two-way ANOVA test followed by Turkey's multiple comparisons test; Figures 5A,B). Similarly, the expression of P65 was increased by CGS21680 at post-culture 12 and 24 h, and further increased by SCH58261 at post-culture 6 and 12 h (ns: P > 0.05, *P < 0.05, ***P < 0.001, Two-way ANOVA test followed by Turkey's multiple comparisons test) (Figure 5C). The expression of p-P65 was increased by CGS21680 significantly at post-culture 6 and 24 h, though a slight reduction was observed at post-culture 12 h (***P < 0.001, Two-way ANOVA test followed by Turkey's multiple comparisons test; Figure 5D). Conversely, the expression of p-P65 was increased in SCH58261 treated macrophages at post-culture 6, 12, and 24 h (*P < 0.05, **P < 0.01, ***P < 0.001, Two-way ANOVA test followed by Turkey's multiple comparisons test; Figure 5D).
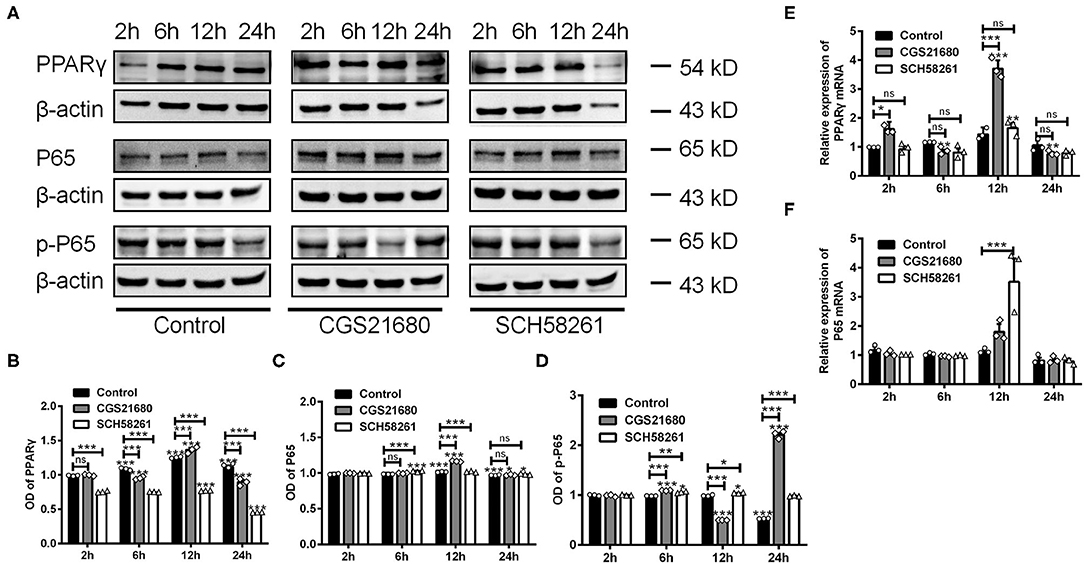
Figure 5. The expression of PPARγ, P65, and p-P65 was altered in macrophages cultured in low glucose and hypoxia. (A) Representative electrophoretic bands showing the expression of PPARγ, P65 and p-P65 in control, CGS21680 and SCH58261 treated macrophages at post-culture. β-actin was used as internal control. (B) Statistical analysis showing the expression of PPARγ in macrophages was increased gradually in low glucose and hypoxic conditions, and was increased further by CGS21680 at post-culture 12 h, but SCH58261 reduced the expression of PPARγ at post-culture (ns: P > 0.05, ***P < 0.001. Two-way ANOVA test followed by Turkey's multiple comparisons test. n = 3 independent experiments for each group). (C) Statistical analysis showing the expression of P65 was increased in macrophages at post-culture 12 and 24 h, and the expression was further increased by CGS21680 at 12 h and SCH58261 at 6 and 12 h (ns: P > 0.05, ***P < 0.001. Two-way ANOVA test followed by Turkey's multiple comparisons test. n = 3 independent experiments for each group). (D) Statistical analysis showing the expression of p-P65 was increased by CGS21680 at post-culture 6 and 24 h, and was increased in SCH58261 treated macrophages at post-culture 6, 12, and 24 h (*P < 0.05, ***P < 0.001. Two-way ANOVA test followed by Turkey's multiple comparisons test. n = 3 independent experiments for each group). (E,F) Statistical analysis showing the mRNA of PPARγ was increased in CGS21680 treated macrophages at 2 and 12 h, but not affected by SCH58261. The expression of P65 mRNA was increased in SCH58261 treated macrophages at post-culture 12 h (ns: P > 0.05, *P < 0.05, **P < 0.01, ***P < 0.001. Two-way ANOVA test followed by Turkey's multiple comparisons test. n = 3 independent experiments for each group). ns, non significant; p >0.05.
RT-PCR results showed that the mRNA expression of PPARγ was altered in consistent with protein in either CGS21680 or SCH58261 treated macrophages (ns: P > 0.05, *P < 0.05, **P < 0.01, ***P < 0.001, Two-way ANOVA test followed by Turkey's multiple comparisons test; Figure 5E). However, the mRNA expression of P65 was increased in SCH58261 treated macrophages at post-culture 12 h (***P < 0.001, Two-way ANOVA test followed by Turkey's multiple comparisons test; Figure 5F). Taken together, these results suggest that the PPARγ-P65 signaling pathway is involved in A2AR modulated polarizing process of macrophages in low-glucose and hypoxic conditions, while more detailed roles of P65 and p-P65 remain to be further clarified.
A2AR Facilitated the Switching of Macrophages From M1 Phenotype to M2 Phenotype and Increased IL-10 Expression via the PPARγ-P65 Pathway
Next, we used lentivirus-mediated shRNA knockdown to further assess the role of PPARγ in the macrophage polarization under low-glucose and hypoxic environment. The expression of PPARγ was effectively reduced by the shRNA knockdown, as shown in Supplementary Figure 2. The macrophages with the shRNA transfection were subsequently measured with cell phenotype and cytokine production in a time series manner (i.e., 2, 6, 12, and 24 h after the exposure to low-glucose and hypoxic culture).
First, the polarizing state of macrophages was evaluated by immunofluorescence staining of iNOs and Arg-1. As shown by the representative images (Figure 6A) and statistical results (Figure 6C), the IOD/positive cell number ratios for iNOs were increased in macrophages with PPARγ knockdown at post-culture 2, 6, and 12 h (ns: P > 0.05, ***P < 0.0001, Two-way ANOVA test followed by Turkey's multiple comparisons test). Moreover, while CGS21680 alone significantly reduced the ratios of iNOs in macrophages under low-glucose and hypoxic condition, PPARγ knockdown abolished such negative impact of CGS21680 on iNOs (ns: P > 0.05, ***P < 0.001, Two-way ANOVA test followed by Turkey's multiple comparisons test). The IOD/positive cell number ratio for Arg-1 was increased at post-culture 2 h, but was decreased at post-culture 6, 12, and 24 h in shRNA+Vehicle group (*P < 0.05, ***P < 0.001, Two-way ANOVA test followed by Turkey's multiple comparisons test). Moreover, the ratio for Arg-1 was further reduced in shRNA+CGS21680 treated macrophages at post-culture 6, 12, and 24 h (ns: P > 0.05, ***P < 0.001, Two-way ANOVA test followed by Turkey's multiple comparisons test; Figures 6B,D), suggesting that activation of A2AR-induced upregulation of Arg-1 is modulated by PPARγ.
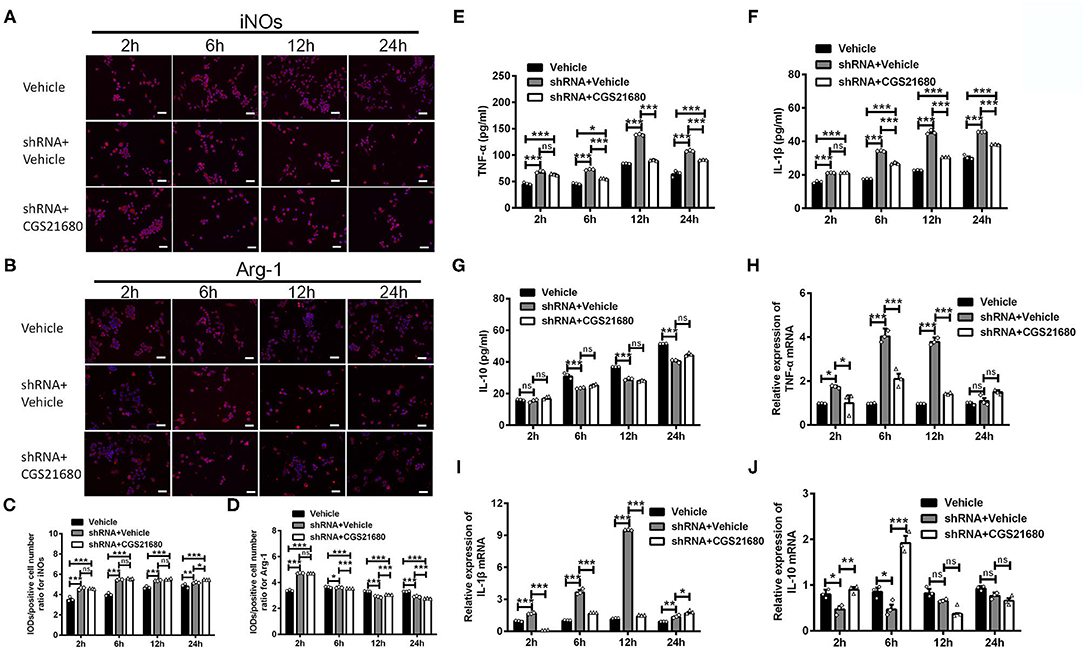
Figure 6. PPARγ knockdown affected the expression of cytokines in CGS21680 treated macrophages. (A,B) Representative images showing the expression of iNOs and Arg-1 in the macrophages pre-transfected with PPARγ shRNA and with or without CGS21680 treatment. Scale bars: 100 μm. (C) Statistical analysis showing the IOD/positive cells number for iNOs was increased in macrophages upon PPARγ knockdown at post-culture and was not reduced by CGS21680 (ns: P > 0.05, *P < 0.05, ***P < 0.001. Two-way ANOVA test followed by Turkey's multiple comparisons test. n = 3 independent experiments for each group). (D) Statistical analysis showing the IOD/positive cells number for Arg-1 was increased in shRNA+Vehicle group at post-culture 2 h, but was reduced at post-culture 6, 12, and 24 h, and was further reduced by CGS21680 at post-culture 6, 12, and 24 h (ns: P > 0.05, *P < 0.05, ***P < 0.001. Two-way ANOVA test followed by Turkey's multiple comparisons test. n = 3 independent experiments for each group). (E,F) ELISA results showing the expression of TNF-α and IL-1β was increased in macrophages upon PPARγ knockdown and was reduced by CGS21680 (ns: P > 0.05, *P < 0.05, ***P < 0.001. Two-way ANOVA test followed by Turkey's multiple comparisons test. n = 3 independent experiments for each group). (G) ELISA results showing the expression of IL-10 in macrophages was reduced after PPARγ knockdown and increased by CGS21680 (ns: P > 0.05, ***P < 0.001. Two-way ANOVA test followed by Turkey's multiple comparisons test. n = 3 independent experiments for each group). (H,I) RT-PCR results showing the mRNA expression of TNF-α and IL-1β was increased upon PPARγ knockdown and rescued by CGS21680 (ns: P > 0.05, *P < 0.05, ***P < 0.001. Two-way ANOVA test followed by Turkey's multiple comparisons test. n = 3 independent experiments for each group). (J) CGS21680 increased the mRNA expression of IL-10 in PPARγ shRNA pre-treated macrophages at post-culture 2 and 6 h (ns: P > 0.05, *P < 0.05, **P < 0.01, ***P < 0.001. Two-way ANOVA test followed by Turkey's multiple comparisons test. n = 3 independent experiments for each group). ns, non significant, p >0.05.
Second, the expression of inflammatory factors in macrophages was determined via ELISA and RT-PCR. Statistical results showed that the protein expression of both TNF-α and IL-1β were increased in macrophages with PPARγ knockdown after exposed in low-glucose and hypoxic conditions (***P < 0.001, Two-way ANOVA test followed by Turkey's multiple comparisons test; Figures 6E,F). Moreover, the expression of TNF-α and IL-1β in PPARγ shRNA and CGS21680 double treatment group was higher than that in vehicle group (***P < 0.001, Two-way ANOVA test followed by Turkey's multiple comparisons test; Figures 6E,F). Since CGS21680 treatment alone reduced the expression of TNF-α and IL-1β in macrophages, these results suggest that PPARγ knockdown antagonizes the negative impact of CGS21680 on the expression of these two cytokines. Meanwhile, the protein expression of IL-10 was reduced after PPARγ knockdown, and CGS21680 treatment did not rescue this reduction (ns: P > 0.05, ***P < 0.001, Two-way ANOVA test followed by Turkey's multiple comparisons test; Figure 6G). RT-PCR results further showed that the mRNA levels of TNF-α and IL-1β were altered in consistent to the protein (*P < 0.05, ***P < 0.001, Two-way ANOVA test followed by Turkey's multiple comparisons test; Figures 6H,I). The mRNA of IL-10 was reduced by PPARγ knockdown and increased by CGS21680 at post-culture 2 and 6 h, while the expression were not changed afterwards (ns: P > 0.05, *P < 0.05, **P < 0.01, ***P < 0.001, Two-way ANOVA test followed by Turkey's multiple comparisons test; Figure 6J).
Finally, we examined the expression of P65 and p-P65 in macrophages upon PPARγ knockdown and/or CGS21680 treatment. Western blotting showed that the protein expression of P65 was decreased upon PPARγ knockdown at post-culture 12 h, and further reduced by additional CGS21680 treatment at post-culture 12 and 24 h (*P < 0.05, ***P < 0.001, Two-way ANOVA test followed by Turkey's multiple comparisons test; Figures 7A,B). Moreover, the ratio of p-P65 to P65 was increased in shRNA+Vehicle group at post-culture 12 and 24 h, but CGS212680 reduced the ratio of p-P65/P65 in PPARγ knockdown macrophages at post-culture 2 and 12 h (**P < 0.01, ***P < 0.001, Two-way ANOVA test followed by Turkey's multiple comparisons test; Figure 7C). Consistently, the mRNA level of P65 was significantly decreased in the shRNA+Vehicle group at post-culture 12 h, and further reduced in shRNA+CGS21680 group at post-culture 6 and 12 h (*P < 0.05, ***P < 0.001, Two-way ANOVA test followed by Turkey's multiple comparisons test; Figure 7D). Taken together, these results suggest that PPARγ-P65 pathway is involved in A2AR-induced macrophage M2 polarization and inflammatory responses.
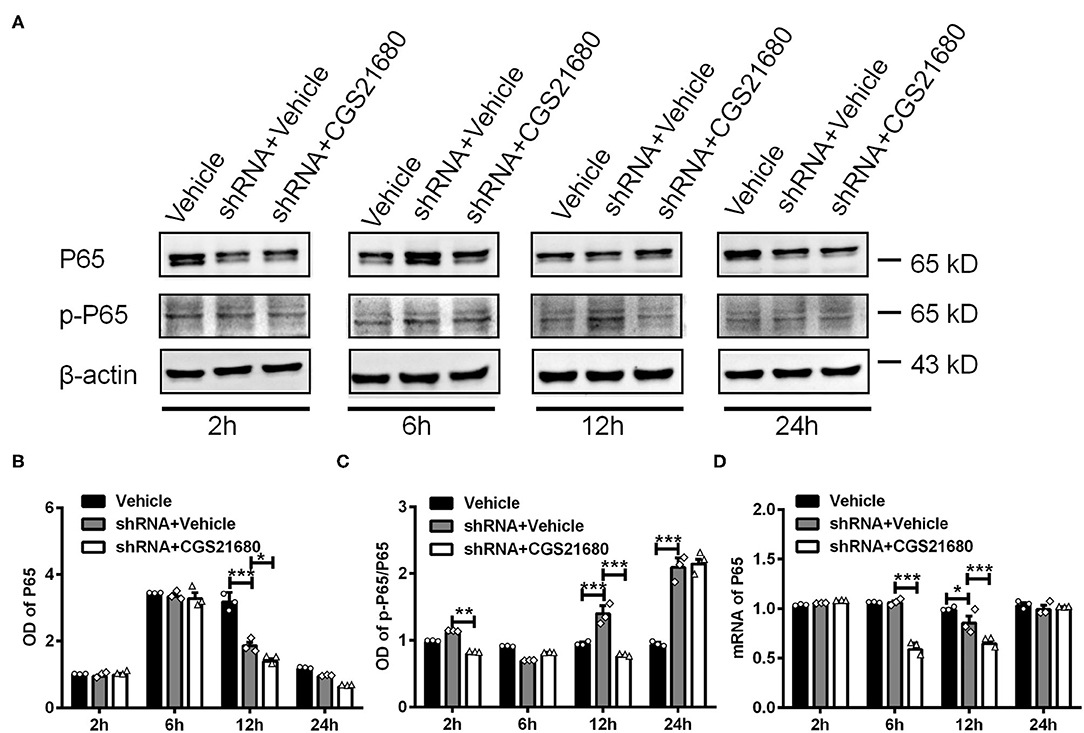
Figure 7. PPARγ regulated the expression of P65 and p-P65 in CGS21680 treated macrophages. (A) Representative electrophoretic bands showing the expression of P65 and p-P65 in PPARγ shRNA pre-transfected macrophages with or without CGS21680 treatment after cultured in low glucose and hypoxic conditions. (B,C) Densitometric analysis results showing the expression of P65 were reduced in shRNA targeted macrophages and further reduced by CGS21680 at post-culture 12 h (*P < 0.05, ***P < 0.001. Two-way ANOVA test followed by Turkey's multiple comparisons test. n = 3 independent experiments for each group). (C) The ratio of p-P65/P65 was increased in macrophages upon PPARγ knockdown at post-culture 12 and 24 h, but was reduced in by additional CGS21680 treatment at post-culture 2 and 12 h (***P < 0.001. Two-way ANOVA test followed by Turkey's multiple comparisons test. n = 3 independent experiments for each group). (D) RT-PCR results showing the mRNA expression of P65 was reduced in macrophages upon PPARγ knockdown at post-culture 12 h and was potentiated by additional CGS21680 treatment at post-culture 6 and 12 h (*P < 0.05, ***P < 0.001. Two-way ANOVA test followed by Turkey's multiple comparisons test. n = 3 independent experiments for each group). **P < 0.01.
Discussion
Here, our study combined mouse models and macrophage cell lines to provide evidence that A2AR in BMDCs is likely to modulate macrophages polarization in white matter lesions induced by chronic cerebral hypoperfusion. Moreover, our PPARγ knockdown experiments further suggest that PPARγ-P65 pathway might be significantly involved in A2AR-associated neuroprotective effect in white matter lesions.
Aberrant phenotypical activation of microglia/macrophages has been shown to disrupt normal tissue morphology, phagocytosis capacity, secretion of cytokines and lead to various CNS disorders, such as ischemic stroke (Qin et al., 2017, 2018, 2019; Jiang et al., 2020; Yang et al., 2021), intracerebral hemorrhage (Lan et al., 2017), multiple sclerosis (Zia et al., 2020), traumatic brain injury (Yang et al., 2019), traumatic spinal cord injury (Liu et al., 2020), demyelination diseases (Aryanpour et al., 2017; Chu et al., 2018), and Alzheimer's disease (Jin et al., 2020; Ren et al., 2020). Recently, it has been shown that the M1/M2-based phenotypical definition for this cell group might be vague. For instance, single-cell RNA-seq analysis has showed that the canonical “M1-like” and “M2-like” gene expression profiles were highly overlapped in the macrophages isolated from traumatic brain tissues (Kim et al., 2016). Therefore, one limitation of our study could be the concept of M1 and M2 phenotypes we sought to define based on several selected molecular markers. Nonetheless, we think that under the context of CNS inflammatory response, the switched expression between iNOs and CD16/32 (“M1-like” phenotype markers), and Arg-1 and CD206 (“M2-like” phenotype markers), together with the corresponding alteration of pro- and anti-inflammatory cytokine production, point to a specific microglial/macrophage polarization. To what degree does such a polarization reflects the molecular boundaries of the classical M1/M2 model, or it actually indicates a novel phenotypic dynamics would be an interesting research topic to pursue in our following studies.
A2AR signaling affects the pathology of a range of neurological disorders (Ahmad et al., 2017b, 2018a; Ansari et al., 2017b; Carvalho et al., 2019; Chen et al., 2020). Our previous studies showed that A2AR deletion aggravates white matter damage and A2AR in BMDCs is an important modulator of white matter lesions induced by chronic cerebral hypoperfusion (Duan et al., 2009; Ran et al., 2015). To further investigate the neuroprotective effect of A2AR activation in this pathological process, we generated chimeric mice with selective inactivation of A2AR in BMDCs through bone marrow cell transplantation and assessed the state of microglia, inflammatory cytokine expression. We found that activation of A2AR in BMDCs induced the polarization of microglia/macrophages towarding M2 phenotype in white matter lesions. In addition, we showed that A2AR agonist and antagonist effectively regulated inflammatory responses in macrophages after exposure to low-glucose and hypoxic conditions. These results suggest that A2AR in BMDCs is involved in switching macrophages from M1 phenotype to M2 phenotype under low-glucose and hypoxic conditions.
The mechanisms underlying macrophage M2 polarization have not been fully elucidated. Several studies have reported the expression of PPARγ was increased when macrophages was polarized to M2 phenotype by stimulation with IL-4 (Zhou et al., 2020), procyanidin B2 (Tian et al., 2019), or malibatol A (Pan et al., 2015). Consistent with previous studies (He et al., 2017; Huang et al., 2019), here we showed that CGS21680 induced macrophage M2 polarization could be reversed by knockdown of PPARγ with shRNA. In addition, we found that the expression of P65, the downstream molecule of PPARγ, was reduced in macrophages upon PPARγ knockdown. Together, these results suggest that the PPARγ-P65 pathway is involved in the A2AR-mediated M1 to M2 macrophage phenotypical switching in low-glucose and hypoxic conditions.
PPARγ exerts neuroprotective effect by regulating the expression of pro-inflammatory or anti-inflammatory factors in brain injuries or brain ischemia (Maréchal et al., 2018; Villapol, 2018). We showed that the expression of TNF-α and IL-1β was increased, whereas the expression of IL-10 was reduced in macrophages transfected with PPARγ shRNA. Further, knockdown of PPARγ efficiently antagonized the effect of CGS21680 on reducing inflammatory cytokines and increasing anti-inflammatory factors, suggesting that the PPARγ-P65 pathway might also participate in the modulatory effect of A2AR on macrophages polarization and cytokine production under low-glucose and hypoxic conditions.
Conclusion
In summary, our results characterized the potential role of A2AR in bone marrow-derived cells in modulating macrophage polarization via PPARγ-P65 signaling axis in the white matter damage induced by chronic hypoperfusion.
Data Availability Statement
The original contributions presented in the study are included in the article/Supplementary Material, further inquiries can be directed to the corresponding author/s.
Ethics Statement
The animal study was reviewed and approved by the Institutional Animal Care and Use Committee of the Army Medical University. Written informed consent was obtained from the owners for the participation of their animals in this study.
Author Contributions
K-JM, K-FS, and WD contributed to conception, study design, draft, and revise the manuscript and figures. K-JM, K-FS, Y-LL, Z-FW, and WD contributed to acquisition and analysis of data, verify the underlying data, interpretation of results, and preparation of figures. All authors edited and approved the paper.
Funding
This work was supported by grants from the National Natural Science Foundation of China (No. 81873757) and the Research Foundation of Army Military Medical University (2019XLC3030).
Conflict of Interest
The authors declare that the research was conducted in the absence of any commercial or financial relationships that could be construed as a potential conflict of interest.
Publisher's Note
All claims expressed in this article are solely those of the authors and do not necessarily represent those of their affiliated organizations, or those of the publisher, the editors and the reviewers. Any product that may be evaluated in this article, or claim that may be made by its manufacturer, is not guaranteed or endorsed by the publisher.
Acknowledgments
We thank Miss Huixian Guo for providing language help and proofreading the article.
Supplementary Material
The Supplementary Material for this article can be found online at: https://www.frontiersin.org/articles/10.3389/fnagi.2021.792733/full#supplementary-material
References
Ahmad, S. F., Ansari, M. A., Nadeem, A., Bakheet, S. A., Alanazi, A. Z., Alsanea, S., et al. (2019). The Stat3 inhibitor, S3I-201, downregulates lymphocyte activation markers, chemokine receptors, and inflammatory cytokines in the BTBR T(+) Itpr3(tf)/J mouse model of autism. Brain Res. Bull. 152, 27–34. doi: 10.1016/j.brainresbull.2019.07.006
Ahmad, S. F., Ansari, M. A., Nadeem, A., Bakheet, S. A., Al-Ayadhi, L. Y., and Attia, S. M. (2017a). Toll-like receptors, NF-κB, and IL-27 mediate adenosine A2A receptor signaling in BTBR T(+) Itpr3(tf)/J mice. Prog. Neuropsychopharmacol. Biol. Psychiatr. 79, 184–191. doi: 10.1016/j.pnpbp.2017.06.034
Ahmad, S. F., Ansari, M. A., Nadeem, A., Bakheet, S. A., Almutairi, M. M., and Attia, S. M. (2017b). Adenosine A2A receptor signaling affects IL-21/IL-22 cytokines and GATA3/T-bet transcription factor expression in CD4(+) T cells from a BTBR T(+) Itpr3tf/J mouse model of autism. J. Neuroimmunol. 311, 59–67. doi: 10.1016/j.jneuroim.2017.08.002
Ahmad, S. F., Ansari, M. A., Nadeem, A., Bakheet, S. A., Mohammad, R., and Attia, S. M. (2018a). Immune alterations in CD8(+) T cells are associated with neuronal C-C and C-X-C chemokine receptor regulation through adenosine A2A receptor signaling in a BTBR T(+) Itpr3(tf)/J autistic mouse model. Mol. Neurobiol. 55, 2603–2616. doi: 10.1007/s12035-017-0548-9
Ahmad, S. F., Nadeem, A., Ansari, M. A., Bakheet, S. A., Alshammari, M. A., and Attia, S. M. (2018b). The PPARδ agonist GW0742 restores neuroimmune function by regulating Tim-3 and Th17/Treg-related signaling in the BTBR autistic mouse model. Neurochem. Int. 120, 251–261. doi: 10.1016/j.neuint.2018.09.006
Ansari, M. A., Attia, S. M., Nadeem, A., Bakheet, S. A., Raish, M., Khan, T. H., et al. (2017a). Activation of adenosine A2A receptor signaling regulates the expression of cytokines associated with immunologic dysfunction in BTBR T(+) Itpr3(tf)/J mice. Mol. Cell Neurosci. 82, 76–87. doi: 10.1016/j.mcn.2017.04.012
Ansari, M. A., Nadeem, A., Attia, S. M., Bakheet, S. A., Raish, M., and Ahmad, S. F. (2017b). Adenosine A2A receptor modulates neuroimmune function through Th17/retinoid-related orphan receptor gamma t (RORγt) signaling in a BTBR T(+) Itpr3(tf)/J mouse model of autism. Cell Signal 36, 14–24. doi: 10.1016/j.cellsig.2017.04.014
Aryanpour, R., Pasbakhsh, P., Zibara, K., Namjoo, Z., Beigi Boroujeni, F., Shahbeigi, S., et al. (2017). Progesterone therapy induces an M1 to M2 switch in microglia phenotype and suppresses NLRP3 inflammasome in a cuprizone-induced demyelination mouse model. Int. Immunopharmacol. 51, 131–139. doi: 10.1016/j.intimp.2017.08.007
Carvalho, K., Faivre, E., Pietrowski, M. J., Marques, X., Gomez-Murcia, V., Deleau, A., et al. (2019). Exacerbation of C1q dysregulation, synaptic loss and memory deficits in tau pathology linked to neuronal adenosine A2A receptor. Brain 142, 3636–3654. doi: 10.1093/brain/awz288
Chen, J. F., Huang, Z., Ma, J., Zhu, J., Moratalla, R., Standaert, D., et al. (1999). A(2A) adenosine receptor deficiency attenuates brain injury induced by transient focal ischemia in mice. J. Neurosci. 19, 9192–9200. doi: 10.1523/JNEUROSCI.19-21-09192.1999
Chen, L., Li, L., Zhou, C., Chen, X., and Cao, Y. (2020). Adenosine A2A receptor activation reduces brain metastasis via SDF-1/CXCR4 axis and protecting blood-brain barrier. Mol. Carcinog. 59, 390–398. doi: 10.1002/mc.23161
Chu, F., Shi, M., Zheng, C., Shen, D., Zhu, J., Zheng, X., et al. (2018). The roles of macrophages and microglia in multiple sclerosis and experimental autoimmune encephalomyelitis. J. Neuroimmunol. 318, 1–7. doi: 10.1016/j.jneuroim.2018.02.015
Chu, T., Zhang, Y. P., Tian, Z., Ye, C., Zhu, M., Shields, L. B. E., et al. (2019). Dynamic response of microglia/macrophage polarization following demyelination in mice. J. Neuroinflammation 16:188. doi: 10.1186/s12974-019-1586-1
Duan, W., Gui, L., Zhou, Z., Liu, Y., Tian, H., Chen, J. F., et al. (2009). Adenosine A2A receptor deficiency exacerbates white matter lesions and cognitive deficits induced by chronic cerebral hypoperfusion in mice. J. Neurol. Sci. 285, 39–45. doi: 10.1016/j.jns.2009.05.010
He, Y., Ma, X., Li, D., and Hao, J. (2017). Thiamet G mediates neuroprotection in experimental stroke by modulating microglia/macrophage polarization and inhibiting NF-κB p65 signaling. J. Cereb. Blood Flow Metab. 37, 2938–2951. doi: 10.1177/0271678X16679671
Hu, X. (2020). Microglia/macrophage polarization: fantasy or evidence of functional diversity? J. Cereb. Blood Flow Metab, 40, S134–S136. doi: 10.1177/0271678X20963405
Hu, X., Li, P., Guo, Y., Wang, H., Leak, R. K., Chen, S., et al. (2012). Microglia/macrophage polarization dynamics reveal novel mechanism of injury expansion after focal cerebral ischemia. Stroke 43, 3063–3070. doi: 10.1161/STROKEAHA.112.659656
Huang, M., Li, Y., Wu, K., Yan, W., Tian, T., Wang, Y., et al. (2019). Paraquat modulates microglia M1/M2 polarization via activation of TLR4-mediated NF-κB signaling pathway. Chem. Biol. Interact. 310:108743. doi: 10.1016/j.cbi.2019.108743
Jiang, C. T., Wu, W. F., Deng, Y. H., and Ge, J. W. (2020). Modulators of microglia activation and polarization in ischemic stroke (Review). Mol. Med. Rep. 21, 2006–2018. doi: 10.3892/mmr.2020.11003
Jin, J., Guo, J., Cai, H., Zhao, C., Wang, H., Liu, Z., et al. (2020). M2-like microglia polarization attenuates neuropathic pain associated with Alzheimer's disease. J. Alzheimers Dis. 76, 1255–1265. doi: 10.3233/JAD-200099
Kim, C. C., Nakamura, M. C., and Hsieh, C. L. (2016). Brain trauma elicits non-canonical macrophage activation states. J. Neuroinflammation 13:117. doi: 10.1186/s12974-016-0581-z
Lan, X., Han, X., Li, Q., Yang, Q. W., and Wang, J. (2017). Modulators of microglial activation and polarization after intracerebral haemorrhage. Nat. Rev. Neurol. 13, 420–433. doi: 10.1038/nrneurol.2017.69
Lei, L. Y., Wang, R. C., Pan, Y. L., Yue, Z. G., Zhou, R., Xie, P., et al. (2021). Mangiferin inhibited neuroinflammation through regulating microglial polarization and suppressing NF-κB, NLRP3 pathway. Chin. J. Nat. Med. 19, 112–119. doi: 10.1016/S1875-5364(21)60012-2
Liu, W., Rong, Y., Wang, J., Zhou, Z., Ge, X., Ji, C., et al. (2020). Exosome-shuttled miR-216a-5p from hypoxic preconditioned mesenchymal stem cells repair traumatic spinal cord injury by shifting microglial M1/M2 polarization. J. Neuroinflammation 17:47. doi: 10.1186/s12974-020-1726-7
Maréchal, L., Laviolette, M., Rodrigue-Way, A., Sow, B., Brochu, M., Caron, V., et al. (2018). The CD36-PPARγ pathway in metabolic disorders. Int. J. Mol. Sci. 19:1529. doi: 10.3390/ijms19051529
Pan, J., Jin, J. L., Ge, H. M., Yin, K. L., Chen, X., Han, L. J., et al. (2015). Malibatol A regulates microglia M1/M2 polarization in experimental stroke in a PPARγ-dependent manner. J. Neuroinflammation 12:51. doi: 10.1186/s12974-015-0270-3
Patel, M., Narke, D., Kurade, M., Frey, K. M., Rajalingam, S., Siddiquee, A., et al. (2020). Limonene-induced activation of A(2A) adenosine receptors reduces airway inflammation and reactivity in a mouse model of asthma. Purinergic Signal 16, 415–426. doi: 10.1007/s11302-020-09697-z
Paterniti, I., Melani, A., Cipriani, S., Corti, F., Mello, T., Mazzon, E., et al. (2011). Selective adenosine A2A receptor agonists and antagonists protect against spinal cord injury through peripheral and central effects. J. Neuroinflammation 8:31. doi: 10.1186/1742-2094-8-31
Qin, C., Fan, W. H., Liu, Q., Shang, K., Murugan, M., Wu, L. J., et al. (2017). Fingolimod protects against ischemic white matter damage by modulating microglia toward M2 polarization via STAT3 pathway. Stroke 48, 3336–3346. doi: 10.1161/STROKEAHA.117.018505
Qin, C., Liu, Q., Hu, Z. W., Zhou, L. Q., Shang, K., Bosco, D. B., et al. (2018). Microglial TLR4-dependent autophagy induces ischemic white matter damage via STAT1/6 pathway. Theranostics 8, 5434–5451. doi: 10.7150/thno.27882
Qin, C., Zhou, L. Q., Ma, X. T., Hu, Z. W., Yang, S., Chen, M., et al. (2019). Dual functions of microglia in ischemic stroke. Neurosci. Bull. 35, 921–933. doi: 10.1007/s12264-019-00388-3
Ran, H., Duan, W., Gong, Z., Xu, S., Zhu, H., Hou, X., et al. (2015). Critical contribution of adenosine A2A receptors in bone marrow-derived cells to white matter lesions induced by chronic cerebral hypoperfusion. J. Neuropathol. Exp. Neurol. 74, 305–318. doi: 10.1097/NEN.0000000000000174
Ren, C., Li, D., Zhou, Q., and Hu, X. (2020). Mitochondria-targeted TPP-MoS(2) with dual enzyme activity provides efficient neuroprotection through M1/M2 microglial polarization in an Alzheimer's disease model. Biomaterials 232:119752. doi: 10.1016/j.biomaterials.2019.119752
Shibata, M., Ohtani, R., Ihara, M., and Tomimoto, H. (2004). White matter lesions and glial activation in a novel mouse model of chronic cerebral hypoperfusion. Stroke 35, 2598–2603. doi: 10.1161/01.STR.0000143725.19053.60
Tian, Y., Yang, C., Yao, Q., Qian, L., Liu, J., Xie, X., et al. (2019). Procyanidin B2 activates PPARγ to induce M2 polarization in mouse macrophages. Front. Immunol. 10:1895. doi: 10.3389/fimmu.2019.01895
Villapol, S. (2018). Roles of peroxisome proliferator-activated receptor gamma on brain and peripheral inflammation. Cell Mol. Neurobiol. 38, 121–132. doi: 10.1007/s10571-017-0554-5
Wang, P., Jia, J., and Zhang, D. (2020). Purinergic signalling in liver diseases: pathological functions and therapeutic opportunities. JHEP Rep. 2:100165. doi: 10.1016/j.jhepr.2020.100165
Yang, S., Qin, C., Hu, Z. W., Zhou, L. Q., Yu, H. H., Chen, M., et al. (2021). Microglia reprogram metabolic profiles for phenotype and function changes in central nervous system. Neurobiol. Dis. 152:105290. doi: 10.1016/j.nbd.2021.105290
Yang, Y., Ye, Y., Kong, C., Su, X., Zhang, X., Bai, W., et al. (2019). MiR-124 enriched exosomes promoted the M2 polarization of microglia and enhanced hippocampus neurogenesis after traumatic brain injury by inhibiting TLR4 pathway. Neurochem. Res. 44, 811–828. doi: 10.1007/s11064-018-02714-z
Yu, L., Huang, Z., Mariani, J., Wang, Y., Moskowitz, M., and Chen, J. F. (2004). Selective inactivation or reconstitution of adenosine A2A receptors in bone marrow cells reveals their significant contribution to the development of ischemic brain injury. Nat. Med. 10, 1081–1087. doi: 10.1038/nm1103
Zhou, D., Ji, L., and Chen, Y. (2020). TSPO modulates IL-4-induced microglia/macrophage M2 polarization via PPAR-γ pathway. J. Mol. Neurosci. 70, 542–549. doi: 10.1007/s12031-019-01454-1
Keywords: adenosine A2A receptor, microglia/macrophages polarization, PPARγ, P65, inflammatory factors
Citation: Mou K-J, Shen K-F, Li Y-L, Wu Z-F and Duan W (2022) Adenosine A2A Receptor in Bone Marrow-Derived Cells Mediated Macrophages M2 Polarization via PPARγ-P65 Pathway in Chronic Hypoperfusion Situation. Front. Aging Neurosci. 13:792733. doi: 10.3389/fnagi.2021.792733
Received: 11 October 2021; Accepted: 10 December 2021;
Published: 03 January 2022.
Edited by:
Fengquan Zhou, Johns Hopkins University, United StatesReviewed by:
Chuan Qin, Huazhong University of Science and Technology, ChinaSheikh Fayaz Ahmad, King Saud University, Saudi Arabia
Copyright © 2022 Mou, Shen, Li, Wu and Duan. This is an open-access article distributed under the terms of the Creative Commons Attribution License (CC BY). The use, distribution or reproduction in other forums is permitted, provided the original author(s) and the copyright owner(s) are credited and that the original publication in this journal is cited, in accordance with accepted academic practice. No use, distribution or reproduction is permitted which does not comply with these terms.
*Correspondence: Wei Duan, weiduan@tmmu.edu.cn
†These authors have contributed equally to this work