Integrated analysis and identification of hub genes as novel biomarkers for Alzheimer’s disease
 Kun Zhao
 Hui Zhang
 Yinyan Wu1
 - 1Department of Neurology, Affiliated People’s Hospital of Jiangsu University, Zhenjiang, China
- 2Fujian Center for Safety Evaluation of New Drug, Fujian Medical University, Fuzhou, China
- 3Department of General Surgery, Affiliated People’s Hospital of Jiangsu University, Zhenjiang, China
Alzheimer’s disease (AD) is an intractable and progressive neurodegenerative disorder that can lead to severe cognitive decline, impaired speech, short-term memory loss, and finally an inability to function in daily life. For patients, their families, and even all of society, AD can impart great emotional pressure and economic costs. Therefore, this study aimed to investigate potential diagnostic biomarkers of AD. Using the Gene Expression Omnibus (GEO) database, the expression profiles of genes were extracted from the GSE5281, GSE28146, and GSE48350 microarray datasets. Then, immune-related genes were identified by the intersections of differentially expressed genes (DEGs). Functional enrichment analyses, including Gene Ontology, Kyoto Encyclopedia of Genes and Genomes, Disease Ontology (DO), and Gene Set Enrichment Analysis (GSEA), were performed. Subsequently, random forest models and least absolute shrinkage and selection operator regression were used to further screen hub genes, which were then validated using receiver operating characteristic (ROC) curve analysis. Finally, 153 total immune-related DEGs were identified in relation to AD. DO analysis of these immune-related DEGs showed that they were enriched in “lung disease,” “reproductive system disease,” and “atherosclerosis.” Single GSEA of hub genes showed that they were particularly enriched in “oxidative phosphorylation.” ROC analysis of AGAP3 yielded an area under the ROC curve of 0.878 for GSE5281, 0.727 for GSE28146, and 0.635 for GSE48350. Moreover, immune infiltration analysis demonstrated that AGAP3 was related to follicular helper T cells, naïve CD4 T cells, naïve B cells, memory B cells, macrophages M0, macrophages M1, macrophages M2, resting natural killer (NK) cells, activated NK cells, monocytes, neutrophils, eosinophils, and activated mast cells. These results indicate that identifying immune-related DEGs might enhance the current understanding of the development and prognosis of AD. Furthermore, AGAP3 not only plays a vital role in AD progression and diagnosis but could also serve as a valuable target for further research on AD.
Introduction
Alzheimer’s disease (AD) is the leading cause of neurodegeneration and dementia; clinically, it manifests as behavioral dysfunction, memory loss, and cognitive impairment (Joe and Ringman, 2019; Li et al., 2021). More than 47 million people are estimated to have dementia, and among them, AD cases account for 60–80% (Anand et al., 2017). The pathological features of AD are synaptic dysfunction, tau-containing neurofibrillary tangles, amyloid plaques [mainly amyloid-β (Aβ)], and neuronal loss (Knopman et al., 2021). However, to date no effective biomarkers or mechanisms have been identified for the prediction, diagnosis, or treatment of AD.
Many strategies, such as stimulating cognition, exercise, and lifestyle changes, can prevent AD and help improve or maintain cognitive functions in elderly people, who are at a high risk of AD (Ngandu et al., 2015). Unfortunately, to date, no effective treatment for AD has been developed. Currently, patients with AD are treated through pharmacotherapy, such as N-methyl-D-aspartate (NMDA) receptor antagonists, memantine, and cholinesterase inhibitors. Patients with AD often suffer from comorbidities. (Patients with complications can undergo pharmacological interventions, including lower doses or more suitable instruments), but there is currently no comprehensive therapeutic intervention for AD. Immune cells at different stages of AD can lead to serious dynamic damage and might have many heterogeneous functions (Jevtic et al., 2017). Innate immune cells in peripheral blood, including neutrophils, monocytes, or natural killer (NK) cells, can be recruited into the central nervous system (CNS) to participate in the development of AD (Prinz and Priller, 2017; Castellani and Schwartz, 2020; Wu et al., 2021). Therefore, to improve the diagnosis and treatment of AD while enhancing the patients’ immune system, there is an urgent need to explore and identify novel biomarkers and therapeutic targets related to immune cells. This can be achieved by screening genes and gene-networks for changes related to AD onset and development.
The metabolism of immune cells also changes in patients with AD; this change could be related to disease pathology (Butterfield and Halliwell, 2019). Furthermore, autoimmunity has been shown to have an effect on these patients (Lim et al., 2021). In this study, therefore, AD datasets collected from the Gene Expression Omnibus (GEO) database were used to conduct systemic analyses (Barrett et al., 2013). First, transcript-level differential analysis was conducted to obtain differentially expressed genes (DEGs). Second, hub genes were identified using the least absolute shrinkage and selection operator (LASSO) and random forest analysis to more rigorously screen biomarkers in a standardized manner. Correlations between identified theoretical biomarker(s) and immune infiltrating cells were then analyzed with CIBERSORT to reveal their diagnostic value regarding AD.
Materials and methods
Datasets
The primary data of three gene expression profile datasets, GSE5281 (Liang et al., 2008a,b; Readhead et al., 2018), GSE28146 (Blalock et al., 2011), and GSE48350 (Berchtold et al., 2008; Blair et al., 2013), were downloaded from the National Center for Biotechnology Information (NCBI) GEO database1 (Barrett et al., 2013). GSE5281 contains data from 87 AD tissues and 74 normal tissues, GSE28146 contains data from 22 AD tissues and eight normal tissues, and GSE48350 contains data from 80 AD tissues and 173 normal tissues. The clinical data and the tissue collection methods of the three datasets are showed in Supplementary Tables 1, 2. In addition, the tissues of two datasets (GSE5281, GSE28146), used for sequencing, are all in terms of laser capture microdissection from Frozen and fixed samples; the tissues of GSE48350, used for sequencing, are in terms of extracting RNA from Frozen unfixed samples. All the gene expression profile datasets were derived from the GPL570 platform (HG-U-133_Plus_2) Affymetrix Human Genome U133 Plus 2.0 Array. Moreover, hallmark gene sets were downloaded from the MsigDB database2 (Subramanian et al., 2005; Liberzon et al., 2015), whereas the immune-related genes of humans were downloaded from the Immport database3 (Bhattacharya et al., 2018).
Differentially expressed genes
To analyze the DEGs between the AD and normal groups, the DealGPL570 package was used to process the primary data of the three datasets (GSE5281, GSE28146, and GSE48350). DEGs were screened by setting the fold-change (FC) threshold to | log FC| > 0.5 and adjusting the significance to P < 0.05 using the R package “limma” (Ritchie et al., 2015; Phipson et al., 2016). Each gene (e.g., g) was assigned vector of gene expression values (yg) and a design matrix X that related these values to some coefficients of interest (βg). The limma package includes statistical methods that facilitate information borrowing using empirical Bayes methods to obtain posterior variance estimators (sg2*), incorporate observation weights (wgj, where j refers to the sample) to allow for variations in data quality, and facilitate variance modeling to accommodate technical or biological heterogeneity that could be present, as well as pre-processing methods such as variance stabilization to reduce noise (Ritchie et al., 2015). We used Benjamin and Hochberg’s method (BH) to control the false discovery rate (Hochberg, 1995). The statistical methods we used were moderate t-statistics, ordinary t-statistics, empirical Bayesian, the BH method, and B- and F-statistics (Hochberg, 1995; Smyth, 2004; Phipson et al., 2016). The DEGs were then visualized using a heatmap. Next, immune-related genes were intersected with the DEGs of each of the three datasets separately, thereby obtaining immune-related DEGs; these are shown using a volcano plot.
Construction of protein–protein interaction networks of immune differentially expressed genes
The immune DEGs of each of the three datasets were utilized to build three co-expression networks using the STRING database4 (Szklarczyk et al., 2019). Cytoscape v3.8.2 (Shannon et al., 2003) was then used to construct all three protein–protein interaction (PPI) networks, and the NetworkAnalyst plug-in was used to calculate the node degrees and to demonstrate the PPI networks. The immune DEGs of the three databases were then intersected to identify the hub genes. Furthermore, a competing endogenous ribonucleic acid (ceRNA) network [messenger RNA (mRNA)–micro RNA (miRNA)–long non-coding RNA (lncRNA)] was constructed for every hub gene using starBase5 (Li et al., 2014), miRDB6 (Chen and Wang, 2020), and miRWalk7 (Sticht et al., 2018).
Enrichment analysis
As few hub genes were identified, all immune DEGs of the three datasets were combined to conduct Gene Ontology [GO, including molecular function (MF), biological process (BP), and cellular component (CC)], Kyoto Encyclopedia of Genes and Genomes (KEGG) and Disease Ontology (DO) enrichment analyses. Furthermore, single-gene Gene set enrichment analysis (GSEA) was conducted for each hub gene. The normalized enrichment score and the nominal P-value were used to calculate and sort the enriched pathways for each hub gene. C2.all.v6.2.symbols.gmt was used as the reference gene set, and 1,000 permutations of the gene set were created. The clusterProfilter package was used to perform all enrichment analyses.
Immune infiltration
CIBERSORT, which quantifies cell fractions based on tissue gene expression profiles, is a universal computational method. CIBERSORT is an analytical tool from the Alizadeh Lab developed by Newman et al. (2015, 2019) to provide an estimation of the abundances of member cell types in a mixed cell population, using gene expression data. Through the use of the linear support vector regression, CIBERSORT could estimate the abundance of immune cells through deconvolution of the expression matrix of immune cell sub types. In addition, CIBERSORT provides 22 frequent immune infiltrating cells, including immune cells of different cell types and cell functions (Chen et al., 2018). Immune infiltration was assessed based on the three datasets using the CIBERSORT algorithm to identify differences in immune cell infiltration between the AD and normal groups. The R package “ggplot2” was used to visualize the data through bar charts, correlation heat maps, heat maps, and violin plots.
Identification and validation of diagnostic biomarkers
To identify diagnostic biomarkers related to AD, random forest models and LASSO regression analysis were used to filter the GSE5281 dataset. The R package “glmnet” (Friedman et al., 2010) was used to implement the LASSO regression analysis, and the R package “Random Forest” (Wiener, 2002) was used to implement the random forest models. Glmnet is a package that fits generalized linear and similar models via penalized maximum likelihood. The stability of the LASSO models was assessed by creating 1,000 models using the same training set but different seeds during the 10-fold cross-validation for the optimum lambda. In addition, random forest models were constructed based on the full data set. The number of trees was selected to minimize the out-of-bag error rate, and the number of random variables used in each tree was optimized using the tuning function (tuneRF, randomForest; Liaw and Wiener, 2001). Then, the intersections of the two algorithms were taken as the final result. Receiver operating characteristic (ROC) curve analysis of the GSE5281 dataset was conducted to verify the result of the LASSO and random forest models. Then, ROC curve analysis was conducted to verify their accuracy in the GSE28146 and GSE48350 datasets. Finally, those genes for which the area under the curve (AUC) was > 0.6 were selected to analyze their correlations with immune infiltrating cells. The expression of diagnostic biomarkers was divided into two groups (high and low) according to median values. Finally, the differences in immune infiltrating cells between high expressed and low expressed diagnostic biomarkers were plotted as boxplots to allow for comparisons.
Statistical analysis
All experiments were conducted using the R software (version: 4.1.1).8 We used the BH method to perform multiple test correction, which was performed to reduce false positive rates in multiple tests. The Student’s t-test was applied to assess the statistical significance of normally distributed variables, and the Mann-Whitney U-test (i.e., Wilcoxon rank-sum test) was applied to estimate the independence of and differences among non-normally distributed variables. Spearman coefficients were used for the correlation between genes and immune cells. All statistical tests were two-tailed, and a P-value < 0.05 was considered statistically significant.
Results
Immune-related differentially expressed genes
The number of DEGs identified in GSE5281 was 800 (Figure 1A), of which 80 were immune-related DEGs (Figure 1B). The number of DEGs identified in GSE28146 was 200 (Figure 1C), of which nine were immune-related DEGs (Figure 1D). The number of DEGs identified in GSE48350 was 640 (Figure 1E), including 64 immune-related DEGs (Figure 1F).
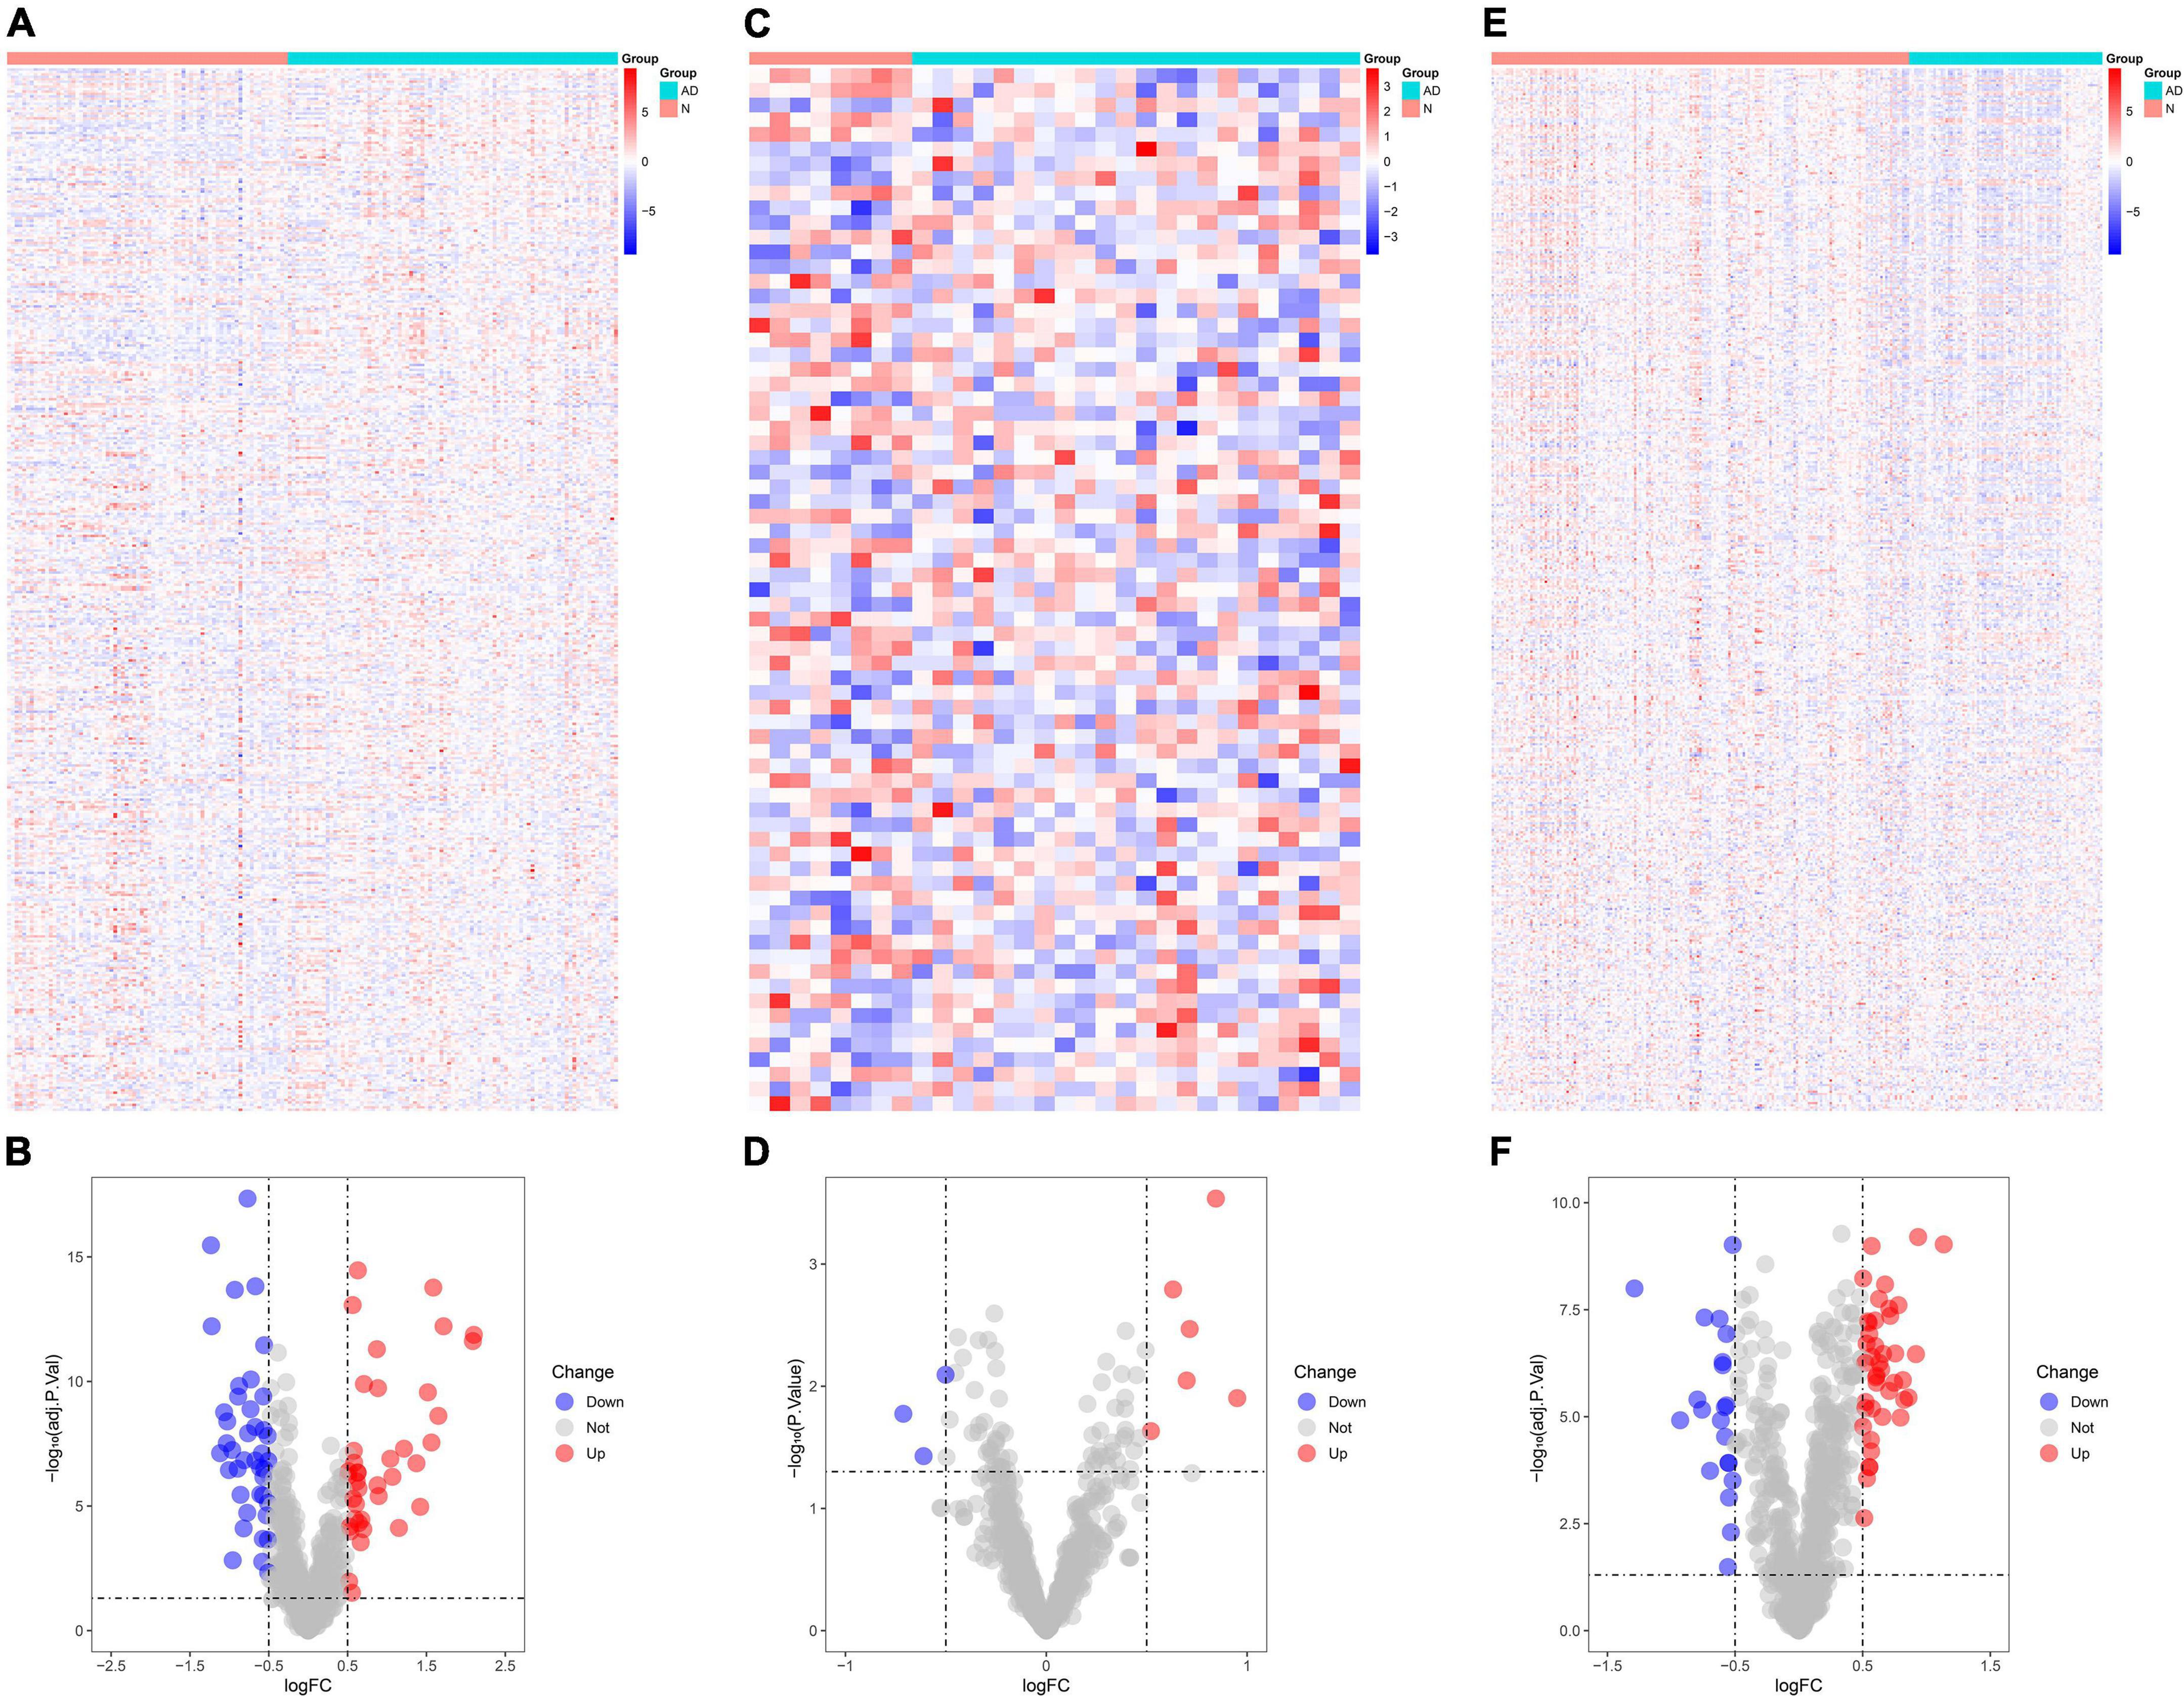
Figure 1. Identification of differentially expressed genes (DEGs) in Alzheimer’s disease tissues and normal tissues. (A) Heat map demonstrates the DEGs in GSE5281. (B) Volcano plot demonstrates the immune DEGs in GSE5281. (C) Heat map demonstrates the DEGs in GSE28146. (D) Volcano plot demonstrates the immune DEGs in GSE28146. (E) Heat map demonstrates the DEGs in GSE48350. (F) Volcano plot demonstrates the immune DEGs in GSE48350. *P < 0.05. * The difference is significant.
Construction of protein-protein interaction and competing endogenous ribonucleic acid networks
The PPI networks for the three datasets are shown in Figures 2A–C; the darker the color of the nodes, the higher the confidence and the stronger the co-expression. The intersections of the immune-related DEGs of the three databases resulted in the identification of the following hub genes: APLNR, CHGB, FGF13, PAK1, and SERPINA3. CeRNA networks for each hub gene are shown in Figures 2D–H, in which yellow nodes are hub genes, green nodes are miRNA, and red nodes are lncRNA.
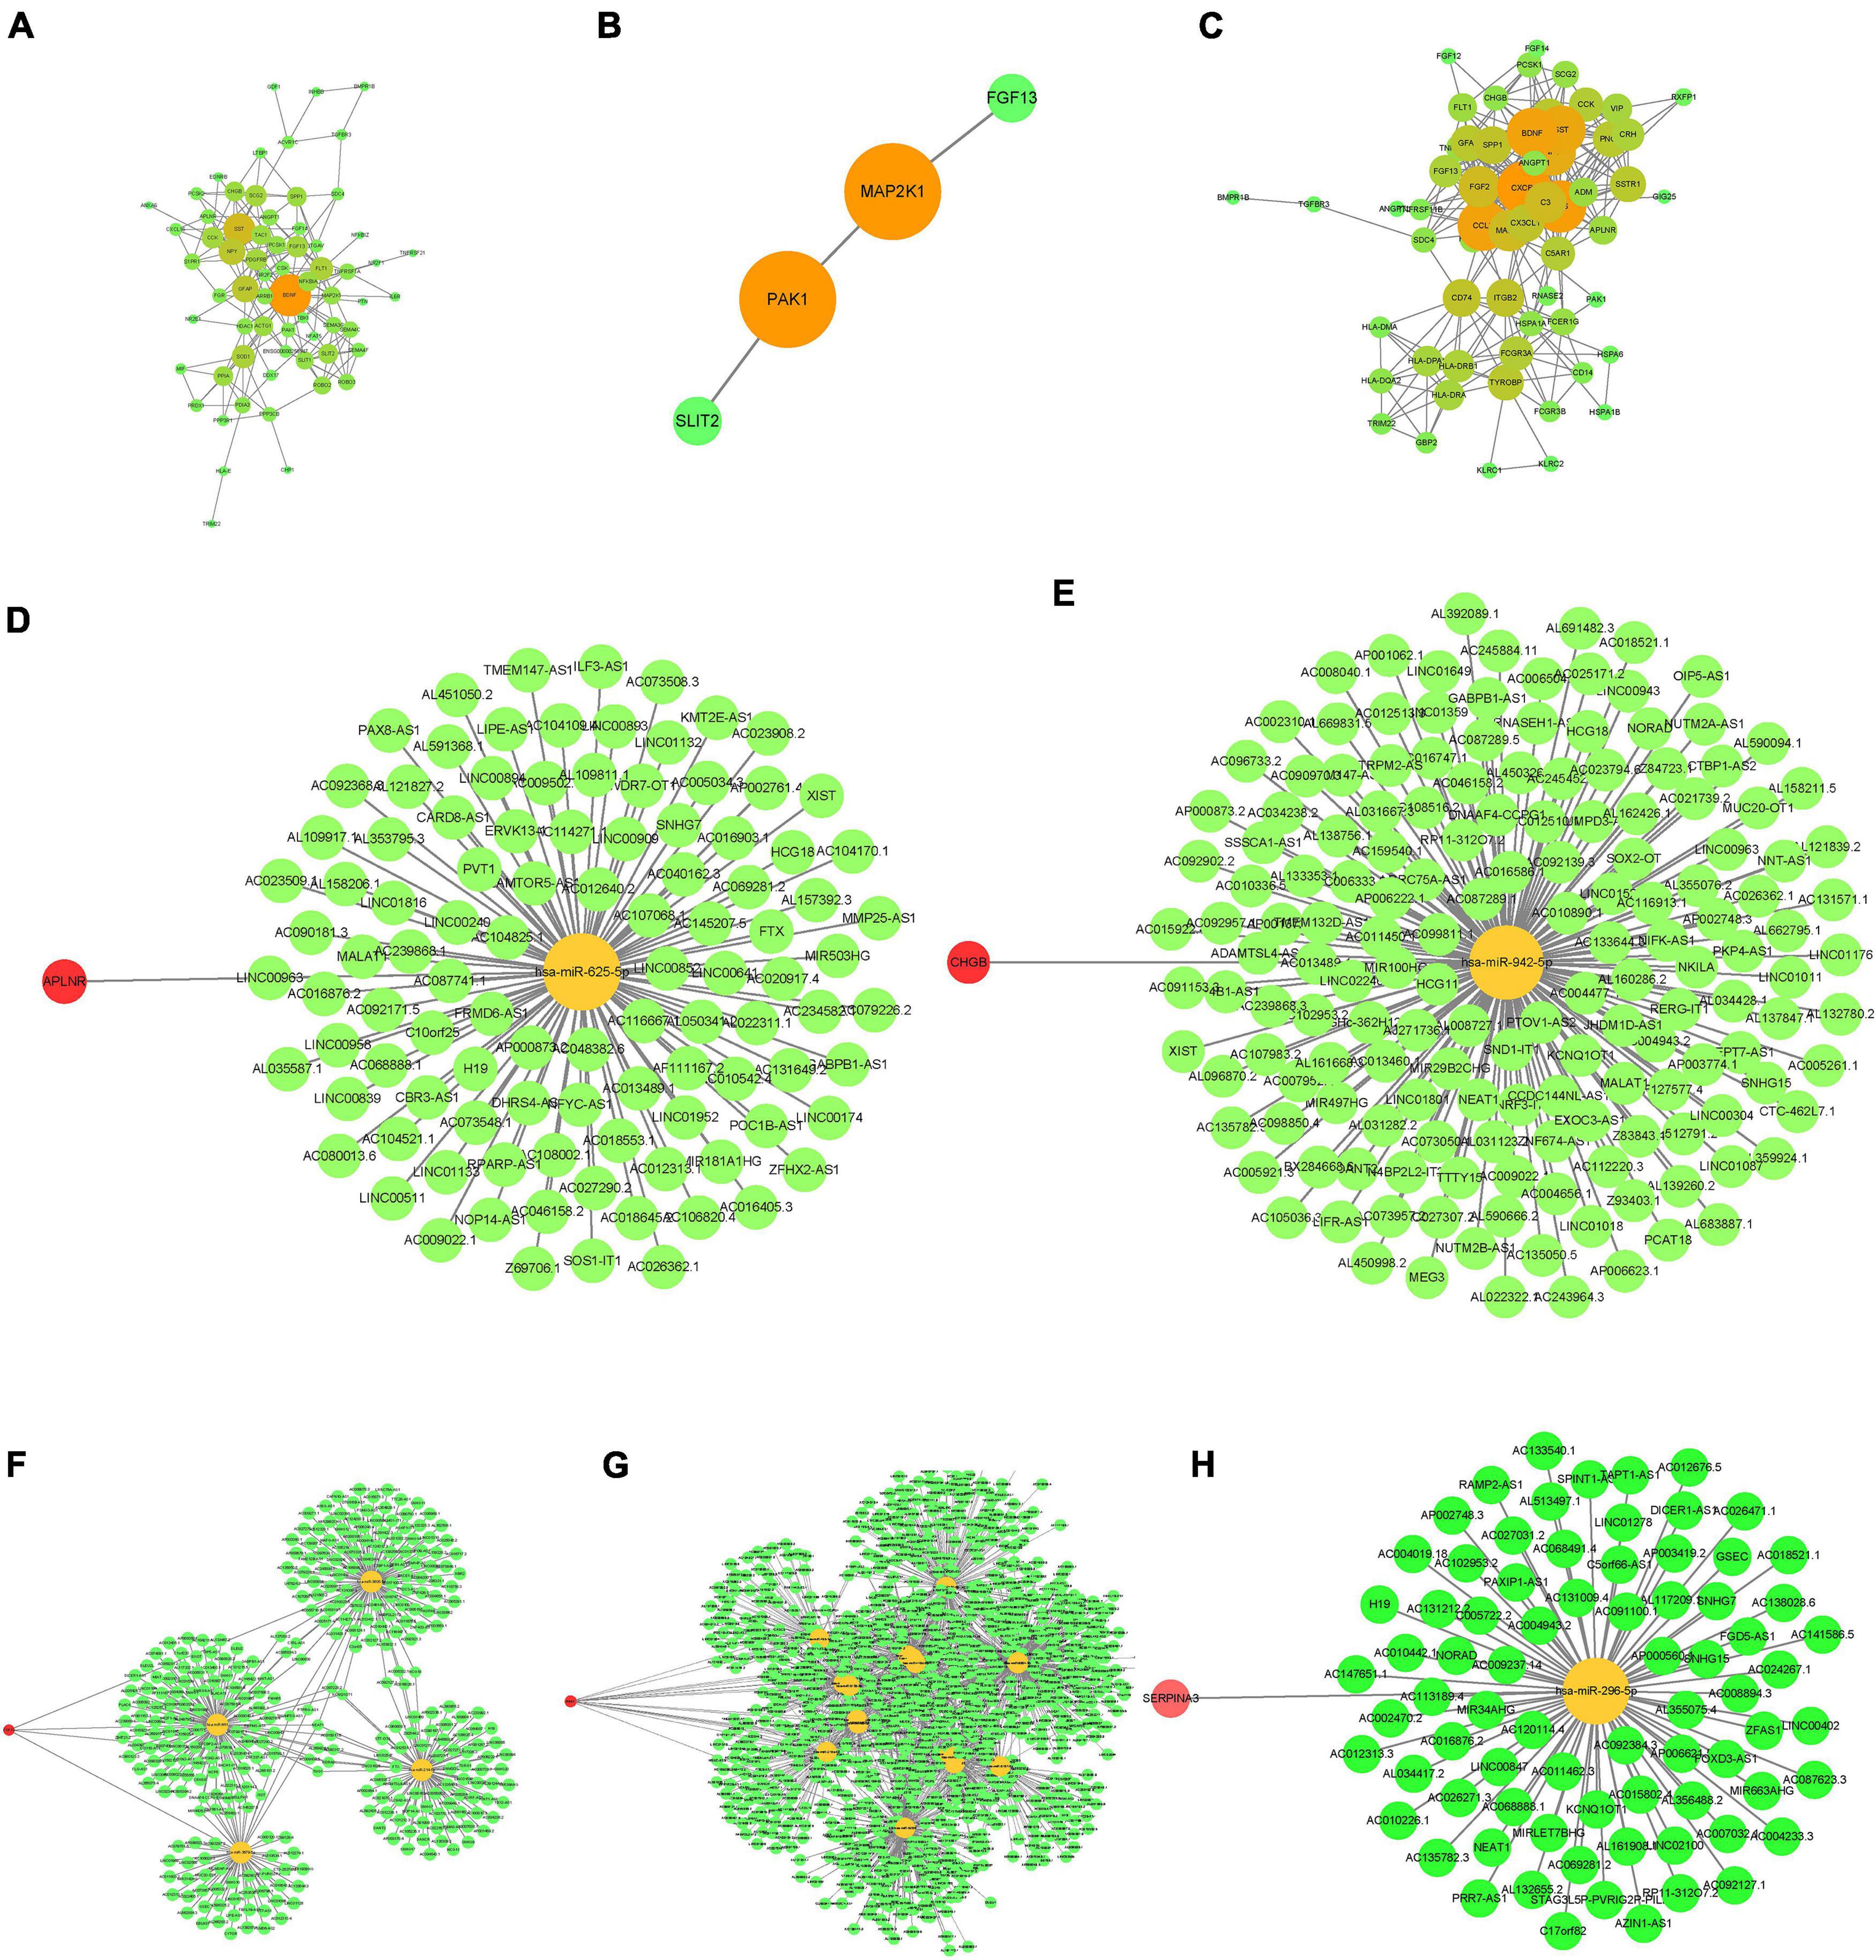
Figure 2. Construction of PPI (protein-protein interaction) and ceRNA (mRNA-miRNA-lncRNA) networks of the immune DEGs. (A–C) PPI network. (A) GSE5281. (B) GSE28146. (C) GSE48350. (D–H) ceRNA network. (D) APLNR. (E) CHGB. (F) FGF13. (G) PAK1. (H) SERPINA3.
Enrichment analysis
GO enrichment analysis of the immune DEGs of the three datasets combined showed that they were significantly enriched in “active regulation of response to external stimuli,” “regulation of chemotaxis,” and “cell chemotaxis” (Figures 3A–C). KEGG enrichment analysis, meanwhile, demonstrated that these genes were significantly enriched in “tuberculosis,” “phagosome,” and other pathways (Figure 3D). DO enrichment analysis indicated that these genes were significantly enriched in “reproductive system disease,” “pulmonary disease,” “arteriosclerosis,” and other disease pathways (Figure 3E).
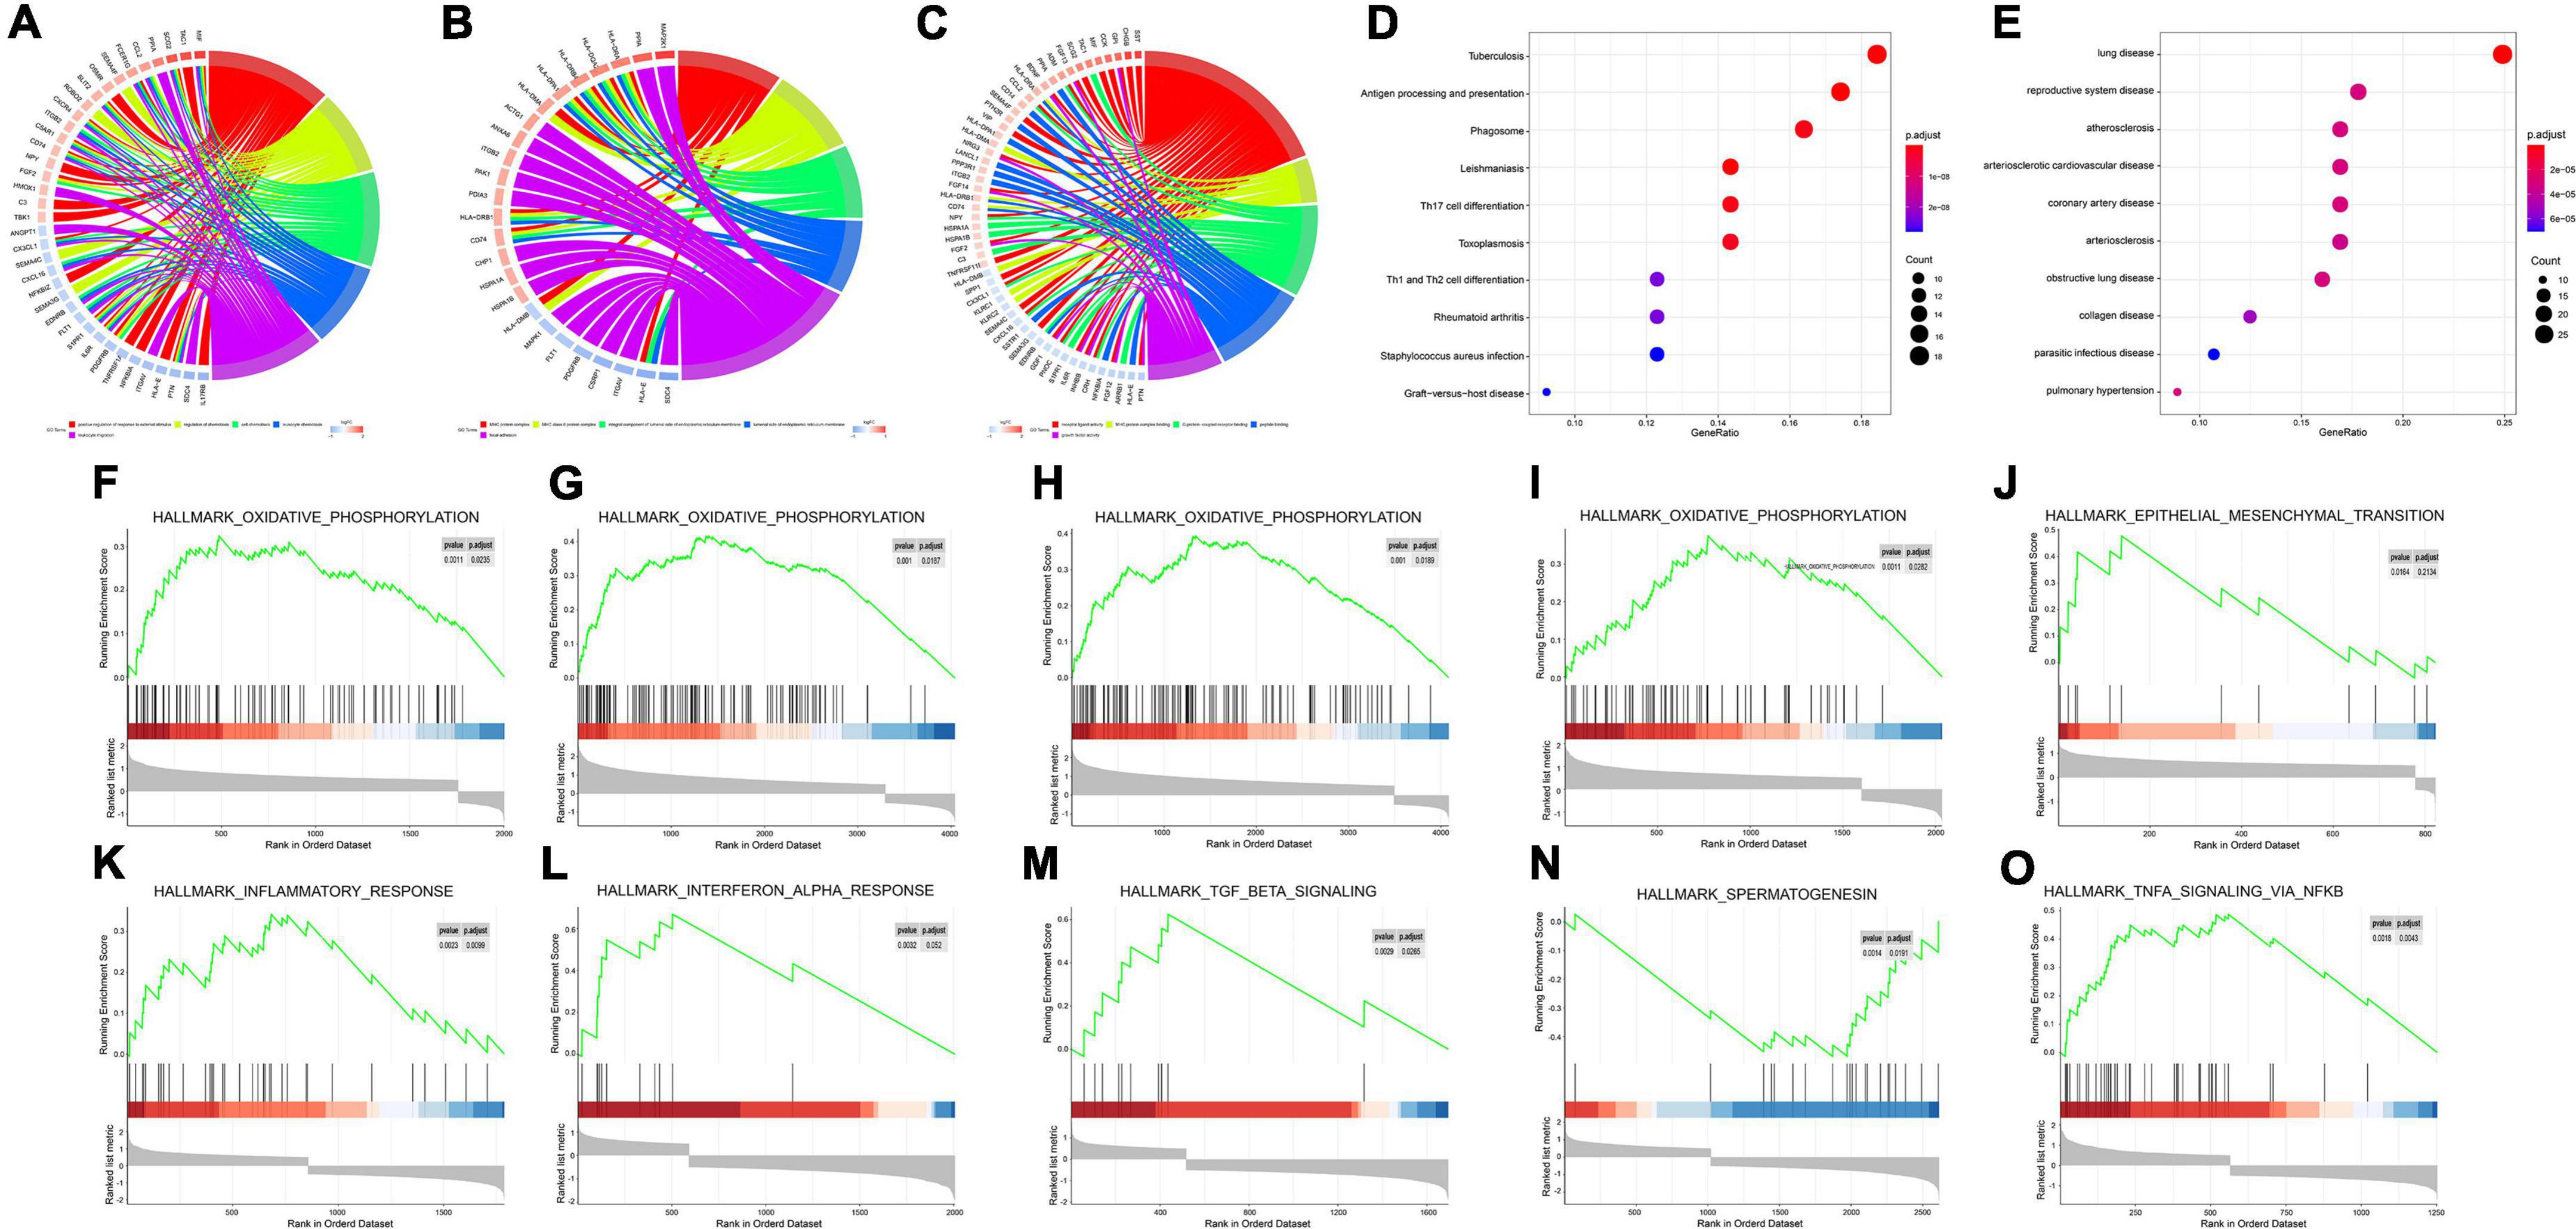
Figure 3. Enrichment analyses (GO, KEGG, DO, GSEA) of immune DEGs. (A) Circos diagram depicting GO-BP Enrichment analysis. (B) Circos diagram depicting GO-CC Enrichment analysis. (C) Circos diagram depicting GO-MF Enrichment analysis. (D) Dot plot depicting KEGG Enrichment analysis. (E) Dot plot depicting DO Enrichment analysis. (F–O) Signal-gene gene set enrichment analysis (GSEA) indicating statistically significant enrichment from AD and normal tissues, and representative hallmarks. (F) APLNR in GSE5281. (G) CHGB in GSE5281. (H) FGF13 in GSE5281. (I) PAK1 in GSE5281. (J) CHGB in GSE28146. (K) APLNR in GSE48350. (L) CHGB in GSE48350. (M) FGF13 in GSE48350. (N) PAK1 in GSE48350. (O) SERPINA3 in GSE48350.
Meanwhile, for every immune-related DEG (n = 5), divided into high or low groups based on expression, single-gene GSEA was performed separately on each dataset. Single-gene GSEA demonstrated that these genes were significantly enriched in the “HALLMARK_OXIDATIVE_PHOSPHORYLATION,” “HALL- MARK_OXIDATIVE_PHOSPHORYLATION,” “HALL- MARK_OXIDATIVE_PHOSPHORYLATION,” “HALLMARK_OXIDATIVE_PHOSPHORYLATION,” “HALLMARK_EPITHELIAL_MESENCHYMAL_ TRANSITION,” “HALLMARK_INFLAMMATORY_ RESPONSE,” “HALLMARK_INTERFERON_ALPHA_ RESPONSE,” “HALLMARK_TGF_BETA_SIGNALING,” “HALLMARK_ SPERMATOGENESI,” “HALLMARK_TNFA_ SIGNALING_VIA_NFKB,” and other pathways (Figures 3F–O). Table 1 shows the detailed results.
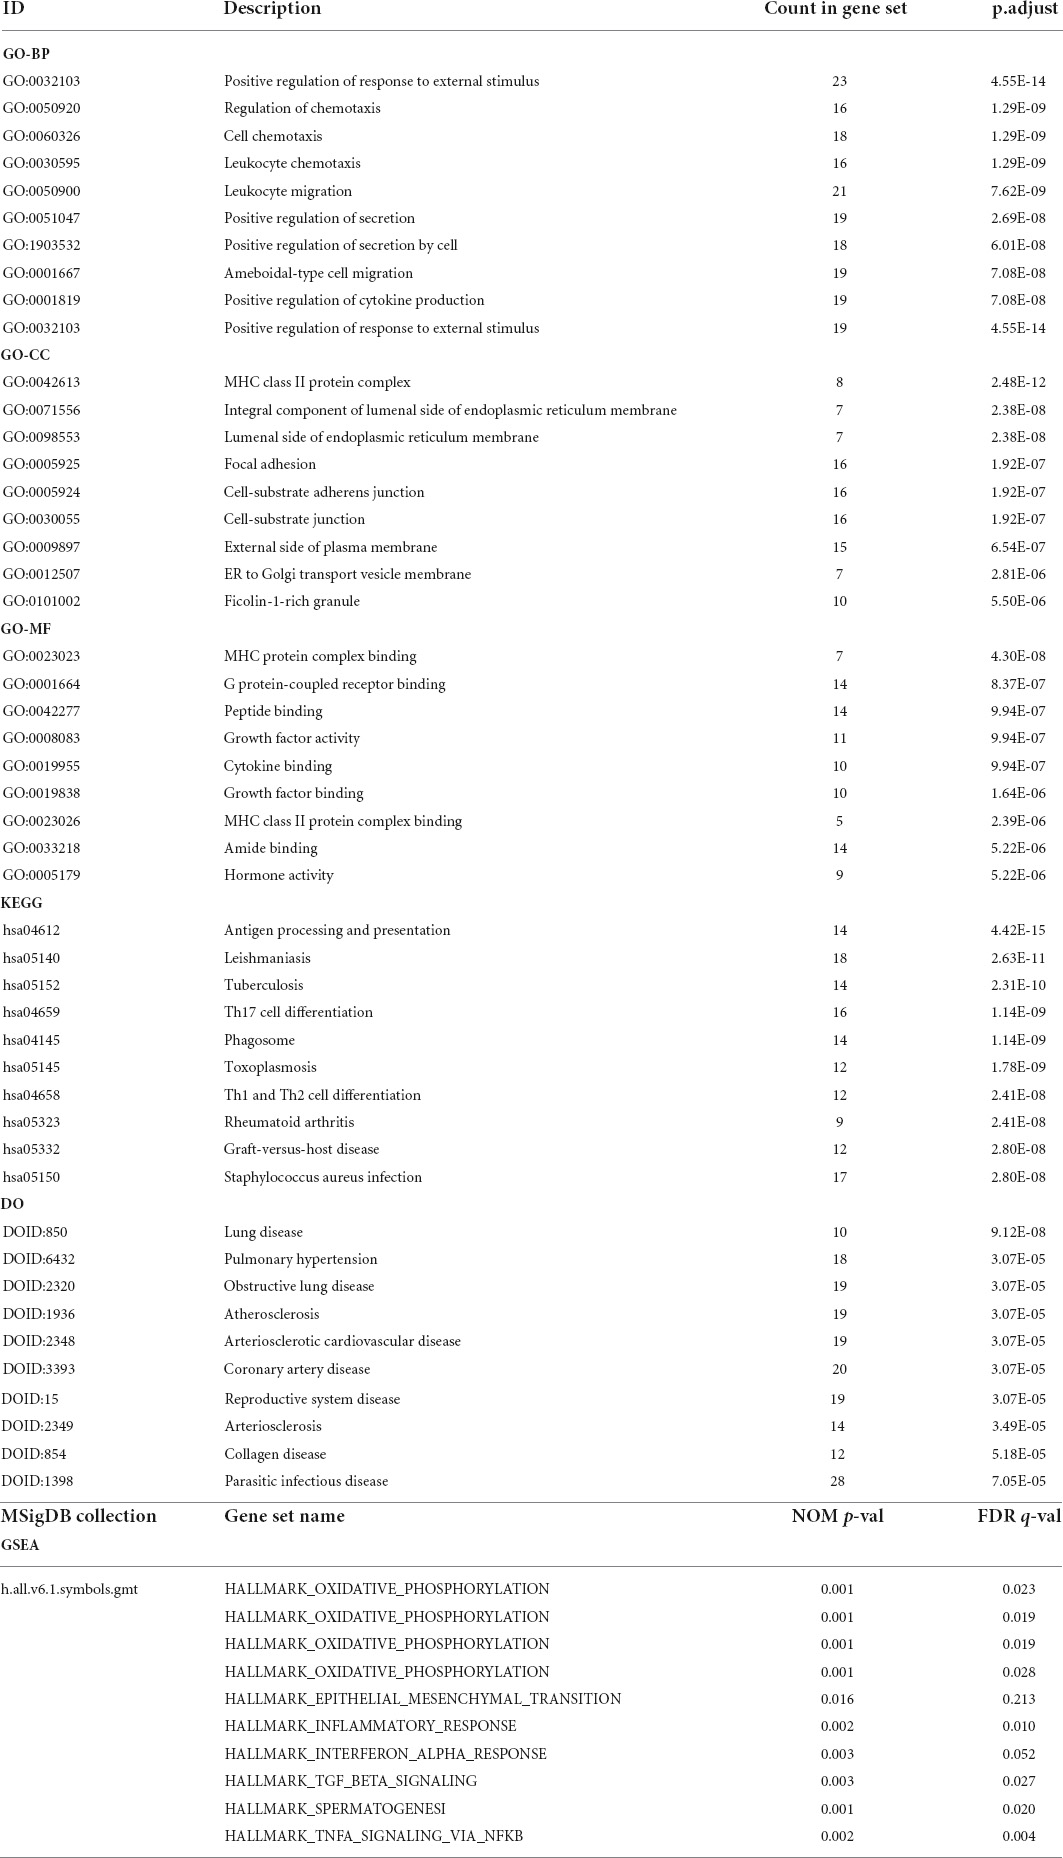
Table 1. GO, KEGG, DO, and GSEA enrichment analysis.
Screening of diagnostic markers
During the screening of diagnostic markers, 63 were filtered by LASSO regression analysis (Figures 4A,B), whereas 29 were filtered through random forest models (Figure 4C). An intersection of the two methods identified 10 genes. ROC analysis of these genes were showed in Table 2 and Supplementary Figure 1, and revealed that only the AUC of AGAP3 > 0.6. Respectively, AGAP3 exhibited an AUC of 0.878 in GSE5281 (Figure 4D), 0.727 in GSE28146 (Figure 4E), and 0.635 in GSE48350 (Figure 4F). Thus, AGAP3 was selected as the final diagnostic marker.
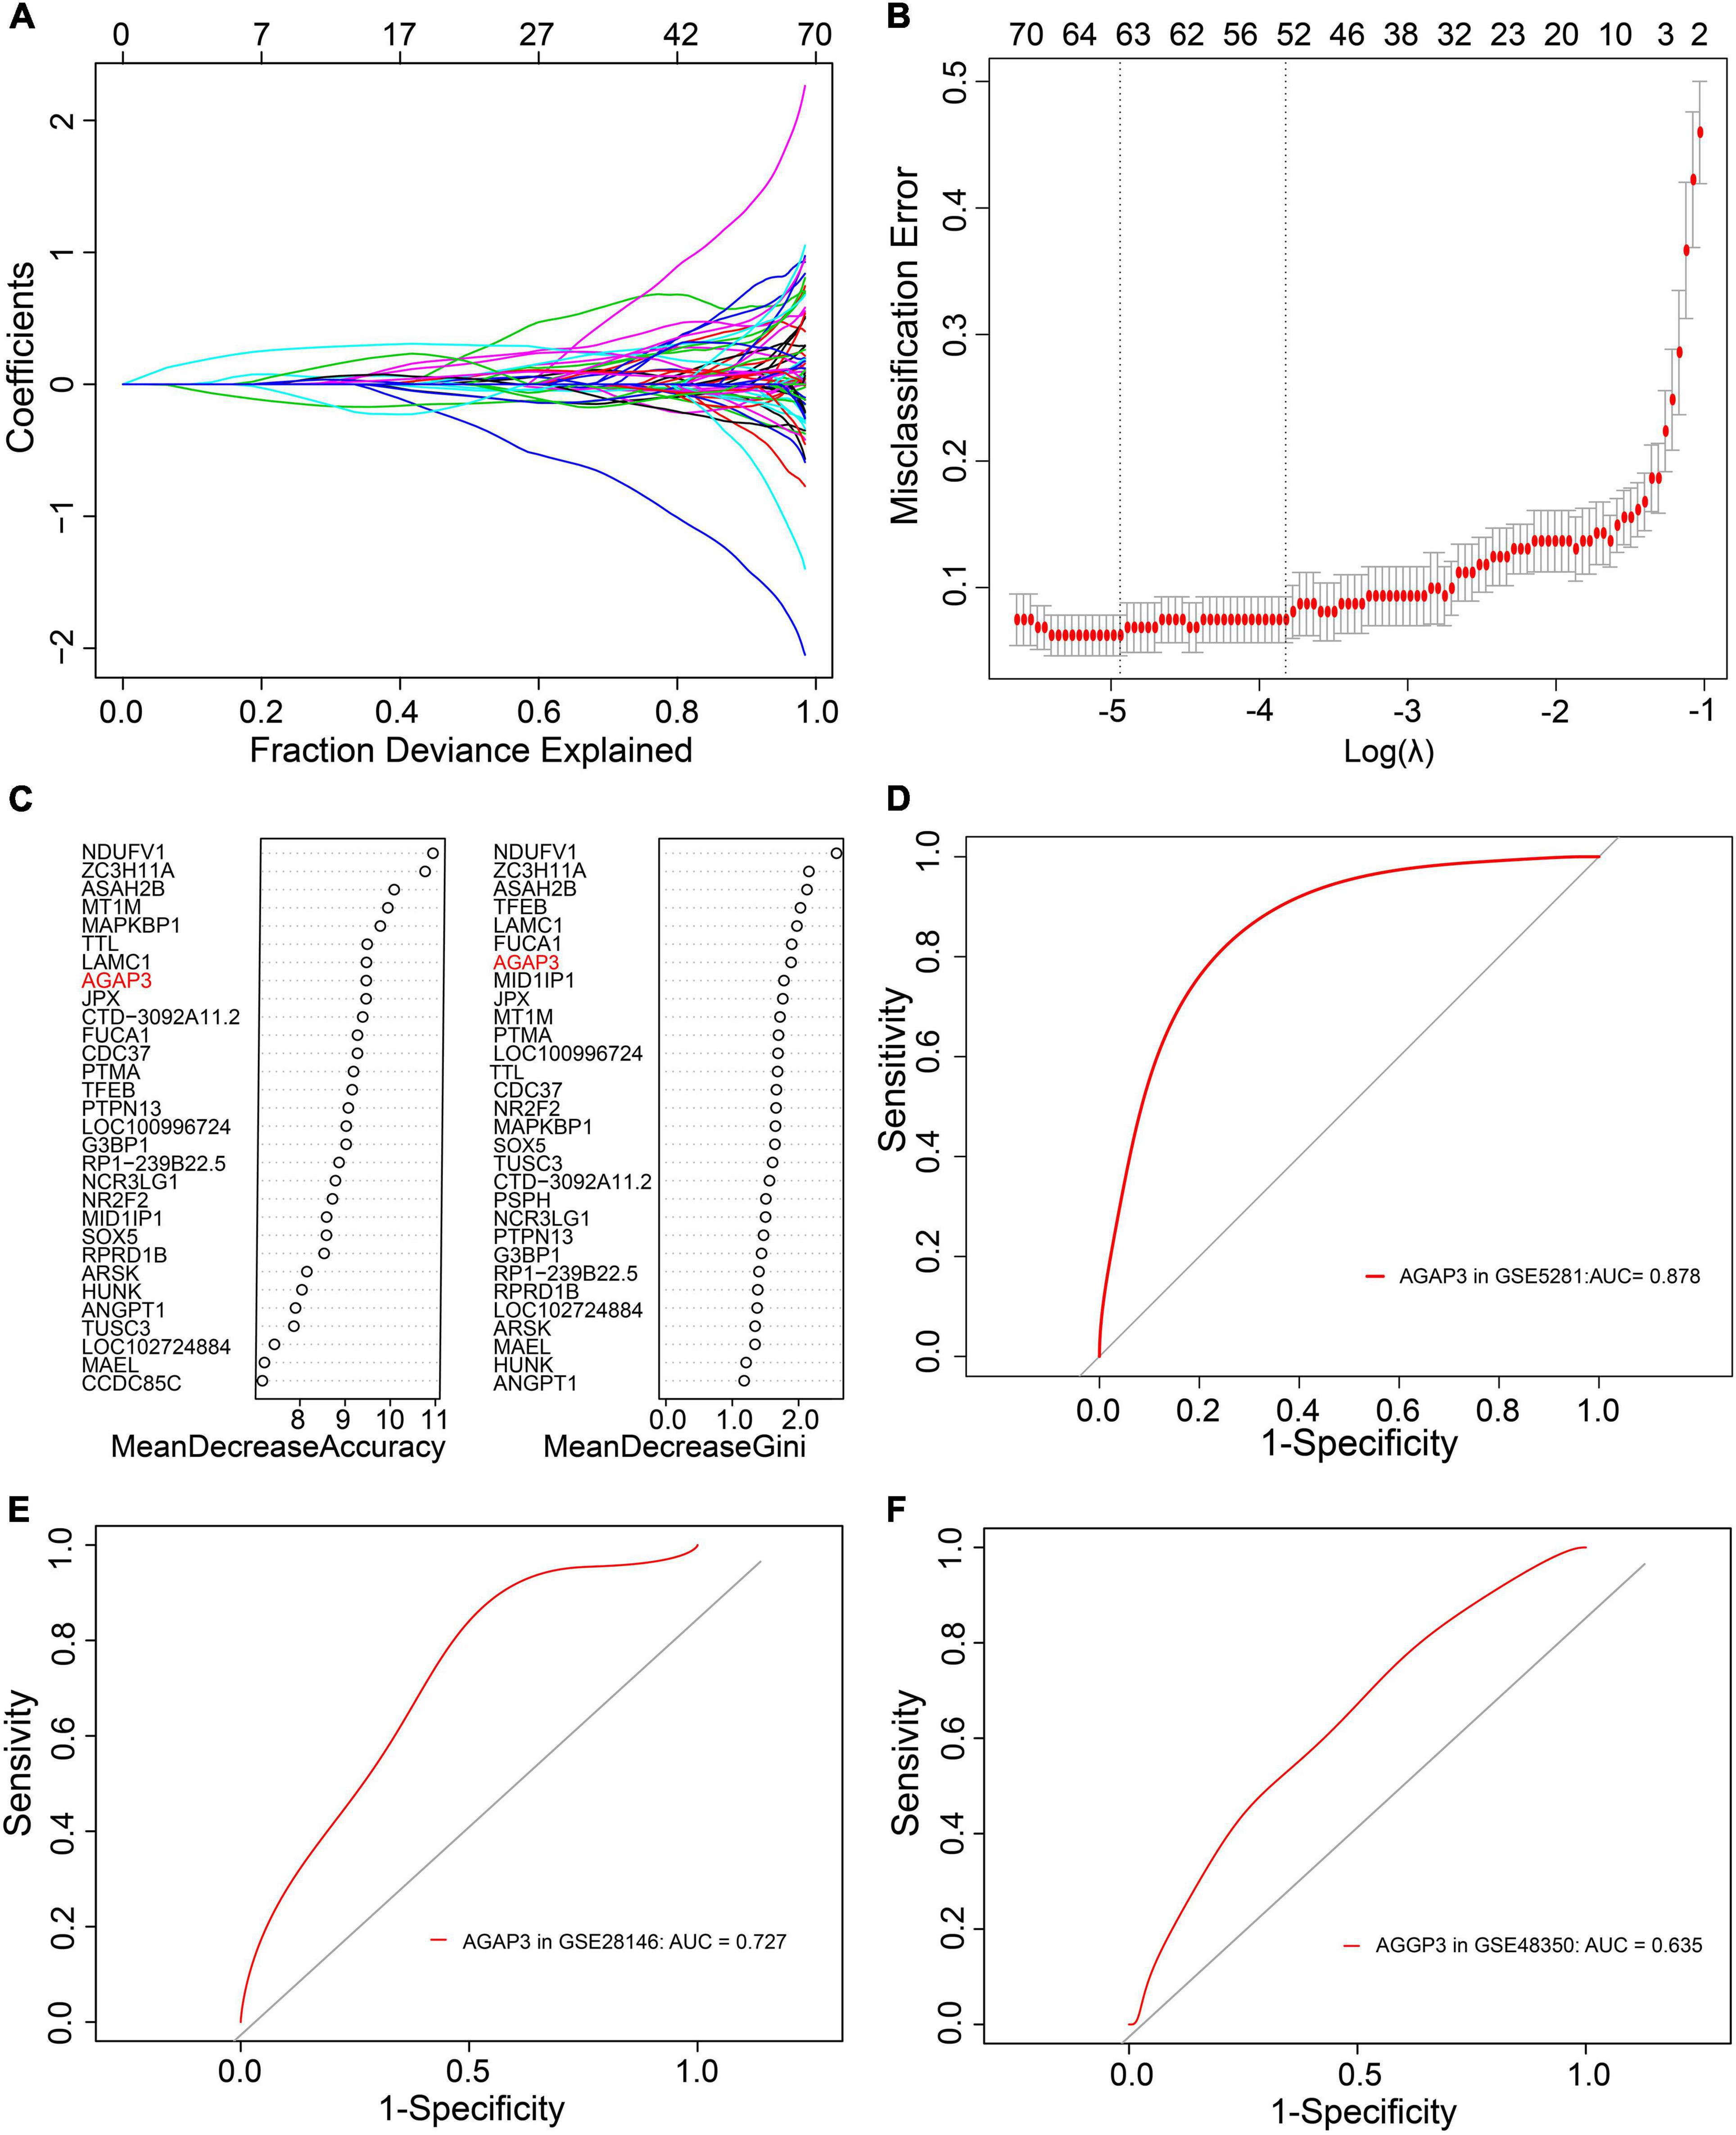
Figure 4. AGAP3 is the diagnostic marker of AD patients. (A,B) LASSO regression analysis model. (C) Random Forest models; MeanDecreaseAccuracy and MeanDecreaseGini. (D) The ROC curve of AGAP3 in GSE5281. (E) The ROC curve of AGAP3 in GSE28146. (F) The ROC curve of AGAP3 in GSE48350.

Table 2. The results of ROC analysis.
Immune infiltration
Based on each dataset, the proportions of the 22 types of immune infiltrating cells that were analyzed are shown in bar plots (Figures 5A,E,I). The correlations between immune infiltrating cells are visualized by a correlation heatmap (Figures 5B,F,J). The differences in immune infiltrating cells between AD and normal samples are shown as heat maps and violin plots for GSE5281 (Figures 5C,D), GSE28146 (Figures 5G,H), and GSE48350 (Figures 5K,L). Consistent with the immune infiltration results of the three datasets, resting CD4 memory T cells, CD4 naïve T cells, naïve B cells, memory B cells, plasma cells, resting NK cells, activated NK cells, monocytes, macrophages M0, macrophages M1, macrophages M2, activated mast cells, eosinophils, and neutrophils were significantly different between AD and normal samples.
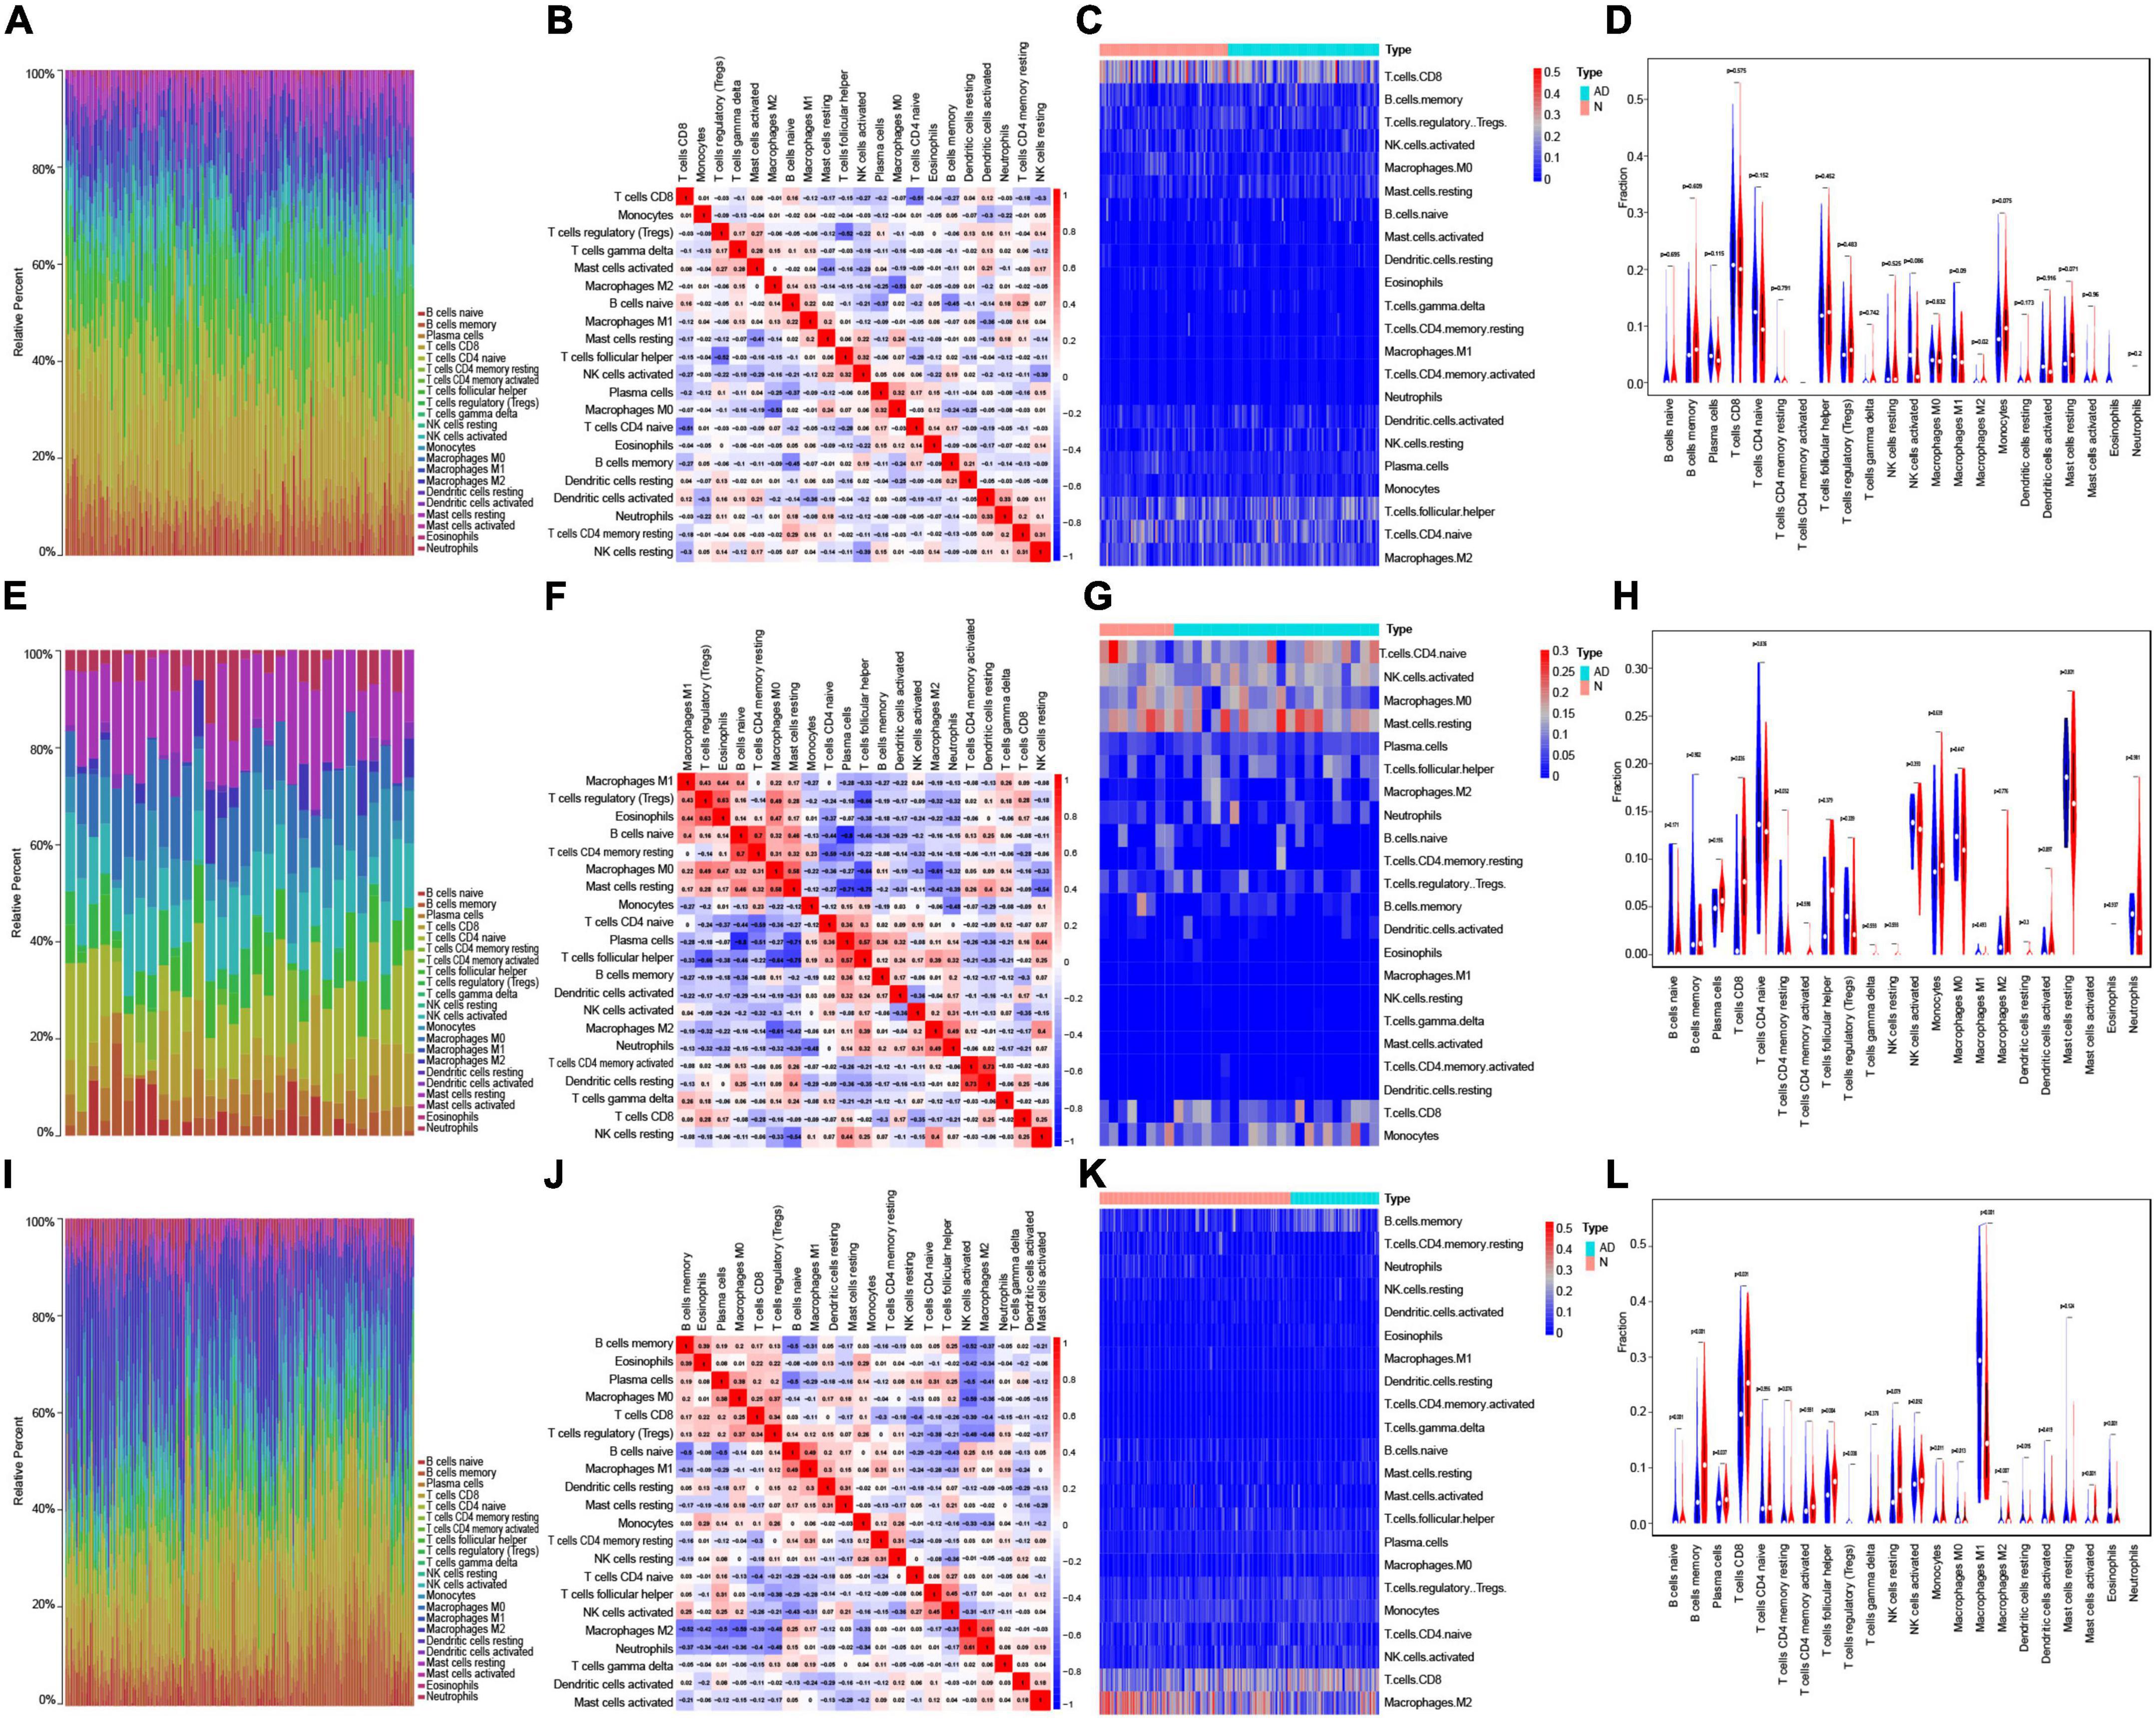
Figure 5. Immune infiltration analysis in AD. (A) Bar plot showing the proportion of 22 types immune infiltrating cells in GSE5281. (B) Correlation heatmap showing the correlation between immune infiltrating cells in GSE5281. (C,D) Heatmap (C) and violin plot (D) showing the expression difference of immune infiltrating cells between AD and normal samples in GSE5281. (E) Bar plot showing the components of 22 types immune infiltrating cells in GSE28146. (F) Correlation heatmap showing the correlation between immune infiltrating cells in GSE28146. (G,H) Heatmap (G) and violin plot (H) showing the expression difference of immune infiltrating cells between AD and normal samples in GSE28146. (I) Bar plot showing the components of 22 types immune infiltrating cells in GSE48350. (J) Correlation heatmap showing the correlation between immune infiltrating cells in GSE48350. (K,L) Heatmap (K) and violin plot (L) showing the expression difference of immune infiltrating cells between AD and normal samples in GSE48350.
Correlations between diagnostic gene expression and infiltrating levels of immune cells in Alzheimer’s disease
AGAP3, exhibited correlations with immune infiltrating cells in each dataset. Figure 6 demonstrates that differences in 22 types of immune cells were identified between the high and low AGAP3 groups. Follicular helper T cells, macrophages M0, naïve B cells, memory B cells, naïve CD4 T cells, resting NK cells, activated NK cells, monocytes, macrophages M0, macrophages M1, macrophages M2, activated mast cells, eosinophils, and neutrophils all exhibited significant differences.
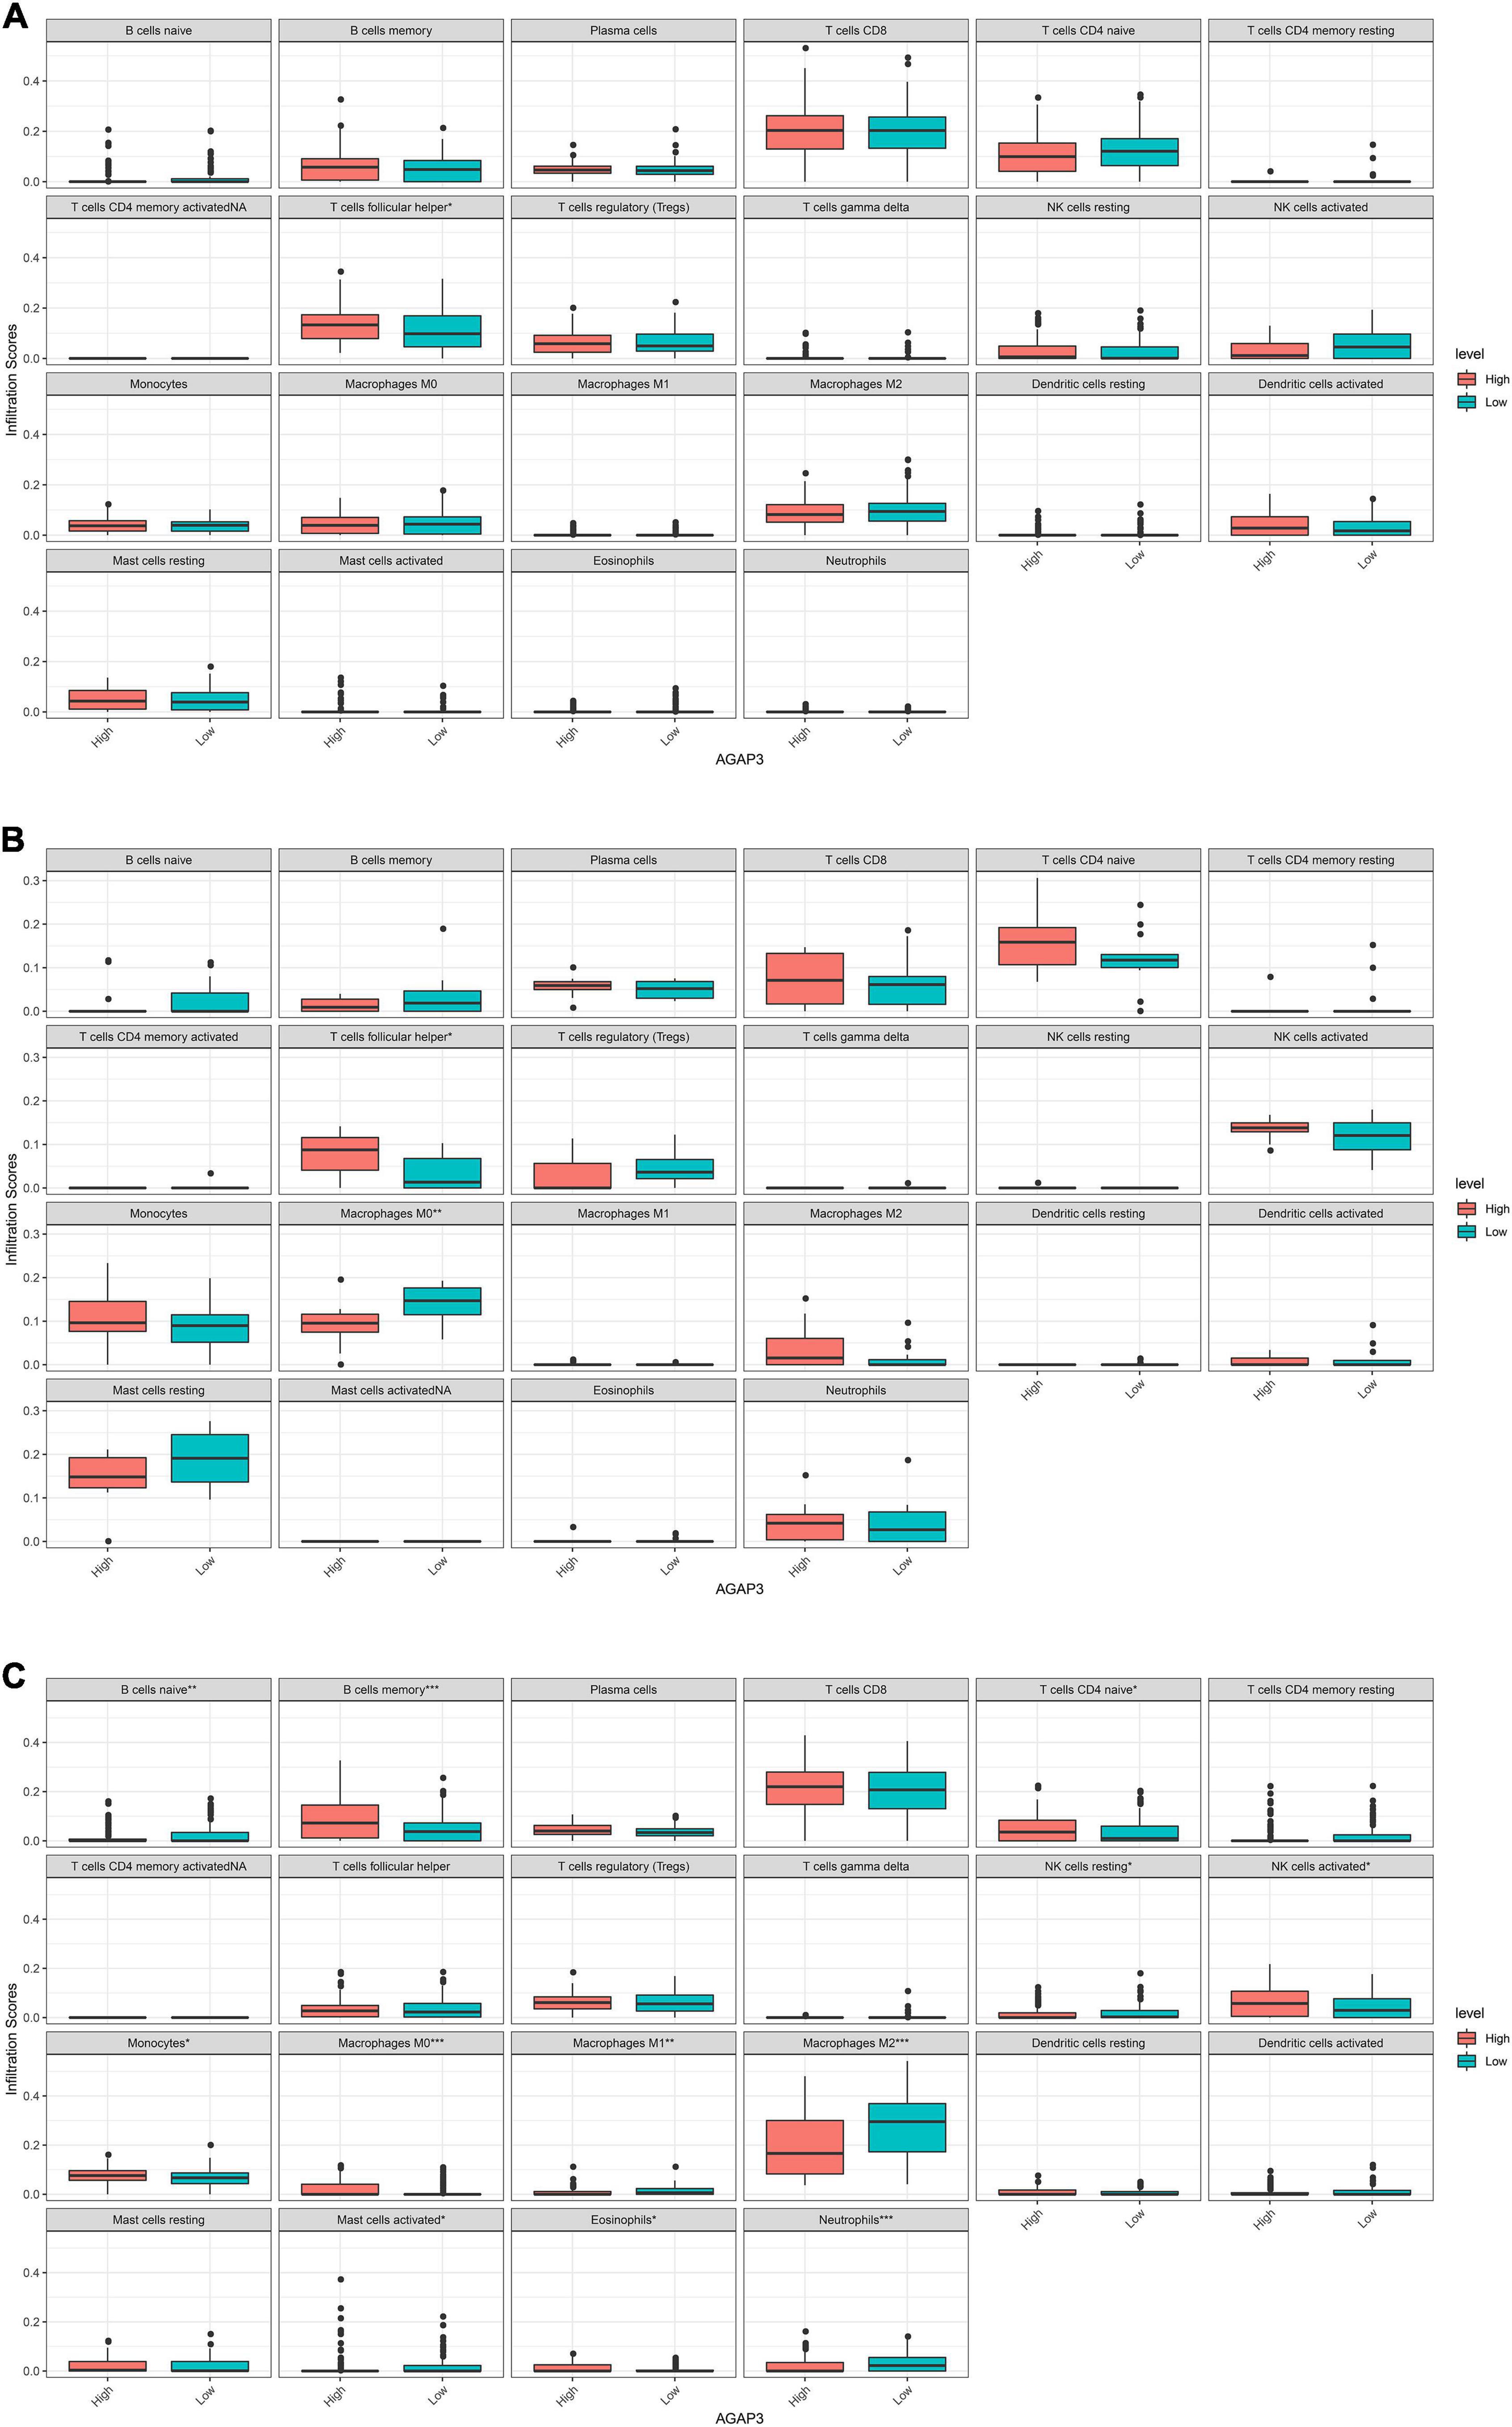
Figure 6. Correlation between diagnostic gene expression and infiltration levels of immune cells in AD. (A) The correlation of between AGAP3 and immune infiltrating cells in GSE5281. (B) The correlation of between AGAP3 and immune infiltrating cells in GSE28146. (C) The correlation of between AGAP3 and immune infiltrating cells in GSE48350. *P < 0.05, **P < 0.01, ***P < 0.001.
Discussion
AD and relevant dementias are challenging conditions that seriously affect patients and their families (Ren et al., 2022). Furthermore, there are currently no good methods or drugs to help patients with AD to recover or gain an improved quality of life, and the exact mechanism of AD remains elusive. From a data perspective, recent studies have focused on exploring effective targets for AD (Chong et al., 2021); some genes, including oncogenes and suppressor genes, have been found, such as β-secretase 1 (BACE1) (Dai et al., 2021) and receptor-interacting protein kinase 1 (RIPK1) (Li et al., 2021). Nevertheless, novel biomarkers with high sensitivity, specificity, and efficiency are necessary to improve AD diagnosis, understand immune infiltration, and treat this disease. Thus, it is important to develop predictive models that can assess prospective biomarkers. In the present study, based on bioinformatics analysis, the development gene expression in AD were investigated through the systematic analyses of three expression profiles from the GEO database. Immune-related DEGs and the prognostic values of hub genes were then investigated.
In these three expression profiles, which included data from a total of 189 AD tissues and 255 normal tissues, 153 immune-related DEGs were screened for further analyses. A PPI network was constructed for these immune-related DEGs, and five hub genes (CHGB, APLNR, FGF13, PAK1, and SERPINA3) were identified as promising prognostic and diagnostic targets for AD. CeRNA networks were therefore built (mRNA-miRNA-lncRNA) for every hub gene. Functional and pathway enrichment analyses revealed that the immune-related DEGs were enriched in biological processes including the positive regulation of responses to external stimuli; regulation of chemotaxis; cell chemotaxis cellular component major histocompatibility complex (MHC) protein complex; MHC class II protein complex, an integral component of the luminal side of endoplasmic reticulum membrane molecular function receptor ligand activity; MHC protein complex binding; and G protein-coupled receptor binding. Thus, immune cell infiltration appears to be closely related to AD. Moreover, the identified immune-related DEGs could be closely related to lung disease, reproductive system disease, and atherosclerosis. In addition, in accordance with the results of single-gene GSEA, oxidative phosphorylation was found to be enriched based on four hub genes (CHGB, APLNR, FGF13, and PAK1). LASSO regression analysis and random forest models were used to identify biomarkers related to AD. ROC curve verification revealed that only AGAP3 demonstrated high predictive performance in terms of specificity and sensitivity.
ArfGAP with a GTPase domain, ankyrin repeat, and PH domain 3 (AGAP3), which encodes an essential component of the NMDA receptor signaling complex, mediates long-term potentiation in synapses by linking the activation of NMDA receptors to alpha-amino-3-hydroxy-5-methyl-4-isoxazolepropionic acid (AMPA) receptor trafficking (Oku and Huganir, 2013). AGAP3 is a guanosine triphosphate containing a nuclear localization signal sequence, first identified in 2006 (Qin et al., 2006). Qin revealed that AGAP3 is closely related to the generation of reactive oxygen species and to the ubiquitin–proteasome pathway (Qin et al., 2006). AGAP3 can protect cells and mediate the functions of the antioxidant pathway by restraining the accumulation of unfolded proteins (Nagashima et al., 2011). Furthermore, as it contains multiple domains (a pleckstrin homology domain, GTPase-like domain, and ArfGAP domain), AGAP3 could be a component of the NMDA receptor complex, which links NMDA receptor activation to the regulation of alpha-amino-3-hydroxy-5-methyl-4-isoxazolepropionic acid (AMPA) trafficking and the plasticity of synapses (Oku and Huganir, 2013). In addition, AGAP3 has been shown to be most highly expressed in the brain in the Human Protein Atlas (HPA) database, through analyses of human tissue-specific expression (Fagerberg et al., 2014). Moreover, AGAP3 mainly participates in the endocytosis pathway (Kanehisa and Goto, 2000). Given their importance with respect to many receptors associated with human diseases (such as AMPA and NMDA), ArfGAPs could represent a novel therapeutic target, in addition to providing mechanistic insights into receptor sorting (Shiba and Randazzo, 2014). To date, however, there has been no related research on the development or underlying mechanism of AD pathogenesis. In this study, the potential prognostic and diagnostic involvement of different markers in AD was comprehensively analyzed, demonstrating that AGAP3 had AUCs of 0.727 and 0.635 in the GSE28146 and GSE48350 datasets, respectively for AD. Thus, AGAP3 is a good diagnostic and prognostic biomarker with favorable sensitivity and specificity. It represents a promising diagnostic target for AD development; this may aid in the early detection of AD and improved treatment options for patients with AD.
Owing to the blood brain barrier, the brain is traditionally considered immune-privileged; peripheral immune cells are rarely detected in the brain parenchyma (Jevtic et al., 2017). However, in AD, clinical and experimental studies have demonstrated that peripheral immune cells (macrophages, monocytes, and neutrophils) participate in inflammatory responses and Aβ metabolism (Ennerfelt and Lukens, 2020). CD4+ cells, numbers of which are positively correlated with AD, have been revealed to be a hub factor of cognitive dysfunction in AD (Pérez-González et al., 2021), as have CD8+ cells (Unger et al., 2020). Immunoglobulin accumulation around Aβ plaques, caused by the infiltration of B cells into the brain parenchyma, could be reduced by the therapeutic depletion of B cells; this could retard disease progression in mice (Kim et al., 2021). Macrophages (microglia), which are the resident innate immune cells of the CNS, are pivotal in maintaining immune defense and homeostasis (Madore et al., 2020). In AD, it is clued that CD8 cells was the key immune cells (Li et al., 2022). Eosinophils, M0 macrophages, M1 macrophages and CD8 cells were relevant to AD, especially M1 macrophages (Liu et al., 2022). What’s more, it was confirmed that CD8+ T-cells could infiltrate the aged and AD brain, in order that brain CD8+ T-cells maybe directly lead to neuronal dysfunction in modulating synaptic plasticity (Unger et al., 2020). In addition, contributing to neuroinflammation associated to AD, the infiltrated peripheral Th1 immune cells are relevant to the M1 microglia activation in brain (Wang et al., 2019). Overall, the immune infiltration of AD was related to CD4 cells, CD8 cells, and macrophages. Herein, the correlation between AGAP3 and immune infiltrating cells was assessed, revealing significant changes in immune infiltrating cells, such as follicular helper T cells, naïve CD4 T cells, naïve B cells, memory B cells, macrophages M0, macrophages M1, macrophages M2, resting NK cells, activated NK cells, monocytes, neutrophils, eosinophils, and activated mast cells. The results indicated that AGAP3 may exert a significant effect on AD by influencing immune infiltrating cells, especially CD4 cells, CD8 cells, and macrophages.
The present study does have some limitations that need to be considered. First, the GEO database lacks complete clinical data, and has shortcomings in terms of the analysis of clinical characteristics; thus, the data have low statistical power. Second, the interactions between factors could not be identified. Hence, further attempts should be made to identify these and verify the relationships between AGAP3 and immune infiltrating cells. More clinical evidence on AD patients must be obtained about this study for further subgroup analysis. However, further experimental techniques, such as real-time PCR and western blot, need to be applied to elucidate the role of hub genes and the underlying mechanisms of AD. Future studies should not only focus on studying the molecular, organismal, and cellular levels of AGAP3 and also explore the effects of AGAP3 on immune infiltrating cells in relation to AD.
Conclusion
Overall, this study provides a better understanding of immune-related genes related to AD through comprehensive analyses of gene datasets from the GEO database. These immune-related genes could provide new insights for the early diagnosis of AD. This study also highlights the role of AGAP3 and offers directions for further biological studies on AD development and immunity.
Data availability statement
The original contributions presented in this study are included in the article/Supplementary material, further inquiries can be directed to the corresponding author.
Ethics statement
Ethical review and approval was not required for the study on human participants in accordance with the local legislation and institutional requirements. Written informed consent from the patients/participants or patients/participants’ legal guardian/next of kin was not required to participate in this study in accordance with the national legislation and the institutional requirements.
Author contributions
KZ and HZ: study design, data acquisition, analysis, completed drawing, and writing and editing of the manuscript. YYW, JZL, and XZL: data acquisition and analysis. JYL: data acquisition, analysis, interpretation, and critical revision of the manuscript. All authors have read and approved the final manuscript.
Funding
This work was supported by the research foundation of Affiliated People’s Hospital of Jiangsu University (Y2020003-S and Y2019014) to KZ and JYL.
Acknowledgments
We are grateful to the reviewers for their input in improving this manuscript. We would like to thank Editage (www.editage.cn) for English language editing.
Conflict of Interest
The authors declare that the research was conducted in the absence of any commercial or financial relationships that could be construed as a potential conflict of interest.
The reviewer XD-P declared a shared parent affiliation with the author HZ to the handling editor at the time of review.
Publisher’s note
All claims expressed in this article are solely those of the authors and do not necessarily represent those of their affiliated organizations, or those of the publisher, the editors and the reviewers. Any product that may be evaluated in this article, or claim that may be made by its manufacturer, is not guaranteed or endorsed by the publisher.
Supplementary material
The Supplementary Material for this article can be found online at: https://www.frontiersin.org/articles/10.3389/fnagi.2022.901972/full#supplementary-material
Footnotes
- ^ https://www.ncbi.nlm.nih.gov/geo/
- ^ https://www.gsea-msigdb.org/gsea/index.jsp
- ^ https://www.immport.org/shared/home
- ^ https://cn.string-db.org/
- ^ http://starbase.sysu.edu.cn/
- ^ http://mirdb.org/
- ^ http://mirwalk.umm.uni-heidelberg.de/
- ^ https://www.r-project.org/
References
Anand, A., Patience, A. A., Sharma, N., and Khurana, N. (2017). The present and future of pharmacotherapy of Alzheimer’s disease: A comprehensive review. Eur. J. Pharmacol. 815, 364–375. doi: 10.1016/j.ejphar.2017.09.043
Barrett, T., Wilhite, S. E., Ledoux, P., Evangelista, C., Kim, I. F., Tomashevsky, M., et al. (2013). NCBI GEO: Archive for functional genomics data sets–update. Nucleic Acids Res. 41:D991–D995. doi: 10.1093/nar/gks1193
Berchtold, N. C., Cribbs, D. H., Coleman, P. D., Rogers, J., Head, E., Kim, R., et al. (2008). Gene expression changes in the course of normal brain aging are sexually dimorphic. Proc. Natl. Acad. Sci. U.S.A. 105, 15605–15610. doi: 10.1073/pnas.0806883105
Bhattacharya, S., Dunn, P., Thomas, C. G., Smith, B., Schaefer, H., Chen, J., et al. (2018). ImmPort, toward repurposing of open access immunological assay data for translational and clinical research. Sci. Data 5:180015. doi: 10.1038/sdata.2018.15
Blair, L. J., Nordhues, B. A., Hill, S. E., Scaglione, K. M., O’Leary, J. C. III, Fontaine, S. N., et al. (2013). Accelerated neurodegeneration through chaperone-mediated oligomerization of tau. J. Clin. Invest. 123, 4158–4169. doi: 10.1172/jci69003
Blalock, E. M., Buechel, H. M., Popovic, J., Geddes, J. W., and Landfield, P. W. (2011). Microarray analyses of laser-captured hippocampus reveal distinct gray and white matter signatures associated with incipient Alzheimer’s disease. J. Chem. Neuroanat. 42, 118–126. doi: 10.1016/j.jchemneu.2011.06.007
Butterfield, D. A., and Halliwell, B. (2019). Oxidative stress, dysfunctional glucose metabolism and Alzheimer disease. Nat. Rev. Neurosci. 20, 148–160. doi: 10.1038/s41583-019-0132-6
Castellani, G., and Schwartz, M. (2020). Immunological Features of Non-neuronal Brain Cells: Implications for Alzheimer’s Disease Immunotherapy. Trends Immunol. 41, 794–804. doi: 10.1016/j.it.2020.07.005
Chen, B., Khodadoust, M. S., Liu, C. L., Newman, A. M., and Alizadeh, A. A. (2018). Profiling Tumor Infiltrating Immune Cells with CIBERSORT. Methods Mol. Biol. 1711, 243–259. doi: 10.1007/978-1-4939-7493-1_12
Chen, Y., and Wang, X. (2020). miRDB: An online database for prediction of functional microRNA targets. Nucleic Acids Res. 48:D127–D131. doi: 10.1093/nar/gkz757
Chong, J. R., Ashton, N. J., Karikari, T. K., Tanaka, T., Schöll, M., Zetterberg, H., et al. (2021). Blood-based high sensitivity measurements of beta-amyloid and phosphorylated tau as biomarkers of Alzheimer’s disease: A focused review on recent advances. J. Neurol. Neurosurg. Psychiatry 92, 1231–1241. doi: 10.1136/jnnp-2021-327370
Dai, L., Wang, Q., Lv, X., Gao, F., Chen, Z., and Shen, Y. (2021). Elevated β-secretase 1 expression mediates CD4(+) T cell dysfunction via PGE2 signalling in Alzheimer’s disease. Brain Behav. Immun. 98, 337–348. doi: 10.1016/j.bbi.2021.08.234
Ennerfelt, H. E., and Lukens, J. R. (2020). The role of innate immunity in Alzheimer’s disease. Immunol. Rev. 297, 225–246. doi: 10.1111/imr.12896
Fagerberg, L., Hallström, B. M., Oksvold, P., Kampf, C., Djureinovic, D., Odeberg, J., et al. (2014). Analysis of the human tissue-specific expression by genome-wide integration of transcriptomics and antibody-based proteomics. Mol. Cell Proteomics 13, 397–406. doi: 10.1074/mcp.M113.035600
Friedman, J., Hastie, T., and Tibshirani, R. (2010). Regularization Paths for Generalized Linear Models via Coordinate Descent. J. Stat. Softw. 33, 1–22.
Hochberg, Y. B. Y. (1995). Controlling the False Discovery Rate: A Practical and Powerful Approach to Multiple Testing. J. R. Statist. Soc. Series B 57, 289–300. doi: 10.1111/j.2517-6161.1995.tb02031.x
Jevtic, S., Sengar, A. S., Salter, M. W., and McLaurin, J. (2017). The role of the immune system in Alzheimer disease: Etiology and treatment. Ageing Res. Rev. 40, 84–94. doi: 10.1016/j.arr.2017.08.005
Joe, E., and Ringman, J. M. (2019). Cognitive symptoms of Alzheimer’s disease: Clinical management and prevention. BMJ 367:l6217. doi: 10.1136/bmj.l6217
Kanehisa, M., and Goto, S. (2000). KEGG: Kyoto encyclopedia of genes and genomes. Nucleic Acids Res. 28, 27–30. doi: 10.1093/nar/28.1.27
Kim, K., Wang, X., Ragonnaud, E., Bodogai, M., Illouz, T., DeLuca, M., et al. (2021). Therapeutic B-cell depletion reverses progression of Alzheimer’s disease. Nat. Commun. 12:2185. doi: 10.1038/s41467-021-22479-4
Knopman, D. S., Amieva, H., Petersen, R. C., Chetelat, G., Holtzman, D. M., Hyman, B. T., et al. (2021). Alzheimer disease. Nat. Rev. Dis. Primers 7:33. doi: 10.1038/s41572-021-00269-y
Li, J. H., Liu, S., Zhou, H., Qu, L. H., and Yang, J. H. (2014). starBase v2.0: Decoding miRNA-ceRNA, miRNA-ncRNA and protein-RNA interaction networks from large-scale CLIP-Seq data. Nucleic Acids Res. 42:D92–D97. doi: 10.1093/nar/gkt1248
Li, S., Qu, L., Wang, X., and Kong, L. (2021). Novel insights into RIPK1 as a promising target for future Alzheimer’s disease treatment. Pharmacol. Ther. 231:107979. doi: 10.1016/j.pharmthera.2021.107979
Li, Y., Shi, H., Chen, T., Xue, J., Wang, C., Peng, M., et al. (2022). Establishing a competing endogenous RNA (ceRNA)-immunoregulatory network associated with the progression of Alzheimer’s disease. Ann. Transl. Med. 10:65. doi: 10.21037/atm-21-6762
Liang, W. S., Dunckley, T., Beach, T. G., Grover, A., Mastroeni, D., Ramsey, K., et al. (2008a). Altered neuronal gene expression in brain regions differentially affected by Alzheimer’s disease: A reference data set. Physiol. Genomics 33, 240–256. doi: 10.1152/physiolgenomics.00242.2007
Liang, W. S., Reiman, E. M., Valla, J., Dunckley, T., Beach, T. G., Grover, A., et al. (2008b). Alzheimer’s disease is associated with reduced expression of energy metabolism genes in posterior cingulate neurons. Proc. Natl. Acad. Sci. U.S.A. 105, 4441–4446. doi: 10.1073/pnas.0709259105
Liberzon, A., Birger, C., Thorvaldsdottir, H., Ghandi, M., Mesirov, J. P., and Tamayo, P. (2015). The Molecular Signatures Database (MSigDB) hallmark gene set collection. Cell Syst. 1, 417–425. doi: 10.1016/j.cels.2015.12.004
Lim, B., Prassas, I., and Diamandis, E. P. (2021). Alzheimer Disease Pathogenesis: The Role of Autoimmunity. J. Appl. Lab. Med. 6, 756–764. doi: 10.1093/jalm/jfaa171
Liu, C., Zhang, X., Chai, H., Xu, S., Liu, Q., Luo, Y., et al. (2022). Identification of Immune Cells and Key Genes associated with Alzheimer’s Disease. Int. J. Med. Sci. 19, 112–125. doi: 10.7150/ijms.66422
Madore, C., Yin, Z., Leibowitz, J., and Butovsky, O. (2020). Microglia. Lifestyle Stress, and Neurodegeneration. Immunity 52, 222–240. doi: 10.1016/j.immuni.2019.12.003
Nagashima, S., Fukuda, T., Kubota, Y., Sugiura, A., Nakao, M., Inatome, R., et al. (2011). CRMP5-associated GTPase (CRAG) protein protects neuronal cells against cytotoxicity of expanded polyglutamine protein partially via c-Fos-dependent activator protein-1 activation. J. Biol. Chem. 286, 33879–33889. doi: 10.1074/jbc.M111.234997
Newman, A. M., Liu, C. L., Green, M. R., Gentles, A. J., Feng, W., Xu, Y., et al. (2015). Robust enumeration of cell subsets from tissue expression profiles. Nat. Methods 12, 453–457. doi: 10.1038/nmeth.3337
Newman, A. M., Steen, C. B., Liu, C. L., Gentles, A. J., Chaudhuri, A. A., Scherer, F., et al. (2019). Determining cell type abundance and expression from bulk tissues with digital cytometry. Nat. Biotechnol. 37, 773–782. doi: 10.1038/s41587-019-0114-2
Ngandu, T., Lehtisalo, J., Solomon, A., Levälahti, E., Ahtiluoto, S., Antikainen, R., et al. (2015). A 2 year multidomain intervention of diet, exercise, cognitive training, and vascular risk monitoring versus control to prevent cognitive decline in at-risk elderly people (FINGER): A randomised controlled trial. Lancet 385, 2255–2263. doi: 10.1016/s0140-6736(15)60461-5
Oku, Y., and Huganir, R. L. (2013). AGAP3 and Arf6 regulate trafficking of AMPA receptors and synaptic plasticity. J. Neurosci. 33, 12586–12598. doi: 10.1523/jneurosci.0341-13.2013
Pérez-González, M., Badesso, S., Lorenzo, E., Guruceaga, E., Pérez-Mediavilla, A., García-Osta, A., et al. (2021). Identifying the Main Functional Pathways Associated with Cognitive Resilience to Alzheimer’s Disease. Int. J. Mol. Sci. 22:9120. doi: 10.3390/ijms22179120
Phipson, B., Lee, S., Majewski, I. J., Alexander, W. S., and Smyth, G. K. (2016). Robust Hyperparameter Estimation Protects against Hypervariable Genes and Improves Power to Detect Differential Expression. Ann. Appl. Stat. 10, 946–963. doi: 10.1214/16-AOAS920
Prinz, M., and Priller, J. (2017). The role of peripheral immune cells in the CNS in steady state and disease. Nat. Neurosci. 20, 136–144. doi: 10.1038/nn.4475
Qin, Q., Inatome, R., Hotta, A., Kojima, M., Yamamura, H., Hirai, H., et al. (2006). A novel GTPase, CRAG, mediates promyelocytic leukemia protein-associated nuclear body formation and degradation of expanded polyglutamine protein. J. Cell Biol. 172, 497–504. doi: 10.1083/jcb.200505079
Readhead, B., Haure-Mirande, J. V., Funk, C. C., Richards, M. A., Shannon, P., Haroutunian, V., et al. (2018). Multiscale Analysis of Independent Alzheimer’s Cohorts Finds Disruption of Molecular, Genetic, and Clinical Networks by Human Herpesvirus. Neuron 99, 64–82.e7. doi: 10.1016/j.neuron.2018.05.023
Ren, R., Qi, J., Lin, S., Liu, X., Yin, P., Wang, Z., et al. (2022). The China Alzheimer Report 2022. Gen Psychiatr. 35:e100751. doi: 10.1136/gpsych-2022-100751
Ritchie, M. E., Phipson, B., Wu, D., Hu, Y., Law, C. W., Shi, W., et al. (2015). limma powers differential expression analyses for RNA-sequencing and microarray studies. Nucleic Acids Res. 43:e47. doi: 10.1093/nar/gkv007
Shannon, P., Markiel, A., Ozier, O., Baliga, N. S., Wang, J. T., Ramage, D., et al. (2003). Cytoscape: A software environment for integrated models of biomolecular interaction networks. Genome Res. 13, 2498–2504. doi: 10.1101/gr.1239303
Shiba, Y., and Randazzo, P. A. (2014). ArfGAPs: Key regulators for receptor sorting. Receptors Clin. Investig. 1:e158. doi: 10.14800/rci.158
Smyth, K. G. (2004). Linear models and empirical bayes methods for assessing differential expression in microarray experiments. Statist. Appl. Genetics Mol. Biol. 3:Article3. doi: 10.2202/1544-6115.1027
Sticht, C., De La Torre, C., Parveen, A., and Gretz, N. (2018). miRWalk: An online resource for prediction of microRNA binding sites. PLoS One 13:e0206239. doi: 10.1371/journal.pone.0206239
Subramanian, A., Tamayo, P., Mootha, V. K., Mukherjee, S., Ebert, B. L., Gillette, M. A., et al. (2005). Gene set enrichment analysis: A knowledge-based approach for interpreting genome-wide expression profiles. Proc. Natl. Acad. Sci. U.S.A. 102, 15545–15550. doi: 10.1073/pnas.0506580102
Szklarczyk, D., Gable, A. L., Lyon, D., Junge, A., Wyder, S., Huerta-Cepas, J., et al. (2019). STRING v11: Protein-protein association networks with increased coverage, supporting functional discovery in genome-wide experimental datasets. Nucleic Acids Res. 47:D607–D613. doi: 10.1093/nar/gky1131
Unger, M. S., Li, E., Scharnagl, L., Poupardin, R., Altendorfer, B., Mrowetz, H., et al. (2020). CD8(+) T-cells infiltrate Alzheimer’s disease brains and regulate neuronal- and synapse-related gene expression in APP-PS1 transgenic mice. Brain Behav. Immun. 89, 67–86. doi: 10.1016/j.bbi.2020.05.070
Wang, X., Sun, G., Feng, T., Zhang, J., Huang, X., Wang, T., et al. (2019). Sodium oligomannate therapeutically remodels gut microbiota and suppresses gut bacterial amino acids-shaped neuroinflammation to inhibit Alzheimer’s disease progression. Cell Res. 29, 787–803. doi: 10.1038/s41422-019-0216-x
Keywords: Alzheimer’s disease (AD), novel biomarker, integrated analysis, immune, hub gene, AGAP3
Citation: Zhao K, Zhang H, Wu Y, Liu J, Li X and Lin J (2022) Integrated analysis and identification of hub genes as novel biomarkers for Alzheimer’s disease. Front. Aging Neurosci. 14:901972. doi: 10.3389/fnagi.2022.901972
Received: 10 May 2022; Accepted: 01 August 2022;
Published: 30 August 2022.
Edited by:
Gang Wang, Shanghai Jiao Tong University, ChinaReviewed by:
Xiao-Dong Pan, Fujian Medical University Union Hospital, ChinaBin Jiao, Xiangya Hospital, Central South University, China
Copyright © 2022 Zhao, Zhang, Wu, Liu, Li and Lin. This is an open-access article distributed under the terms of the Creative Commons Attribution License (CC BY). The use, distribution or reproduction in other forums is permitted, provided the original author(s) and the copyright owner(s) are credited and that the original publication in this journal is cited, in accordance with accepted academic practice. No use, distribution or reproduction is permitted which does not comply with these terms.
*Correspondence: Jianyang Lin, ljyang2004@hotmail.com
†These authors have contributed equally to this work and share first authorship