Altered pattern analysis and identification of subjective cognitive decline based on morphological brain network
 Xiaowen Xu
 Peiying Chen
 Yongsheng Xiang
 Zhongfeng Xie
 Qiang Yu
 Xiang Zhou
 Peijun Wang
- Department of Medical Imaging, Tongji Hospital, Tongji University School of Medicine, Tongji University, Shanghai, China
Subjective cognitive decline (SCD) is considered the first stage of Alzheimer’s disease (AD). Accurate diagnosis and the exploration of the pathological mechanism of SCD are extremely valuable for targeted AD prevention. However, there is little knowledge of the specific altered morphological network patterns in SCD individuals. In this present study, 36 SCD cases and 34 paired-matched normal controls (NCs) were recruited. The Jensen-Shannon distance-based similarity (JSS) method was implemented to construct and derive the attributes of multiple brain connectomes (i.e., morphological brain connections and global and nodal graph metrics) of individual morphological brain networks. A t-test was used to discriminate between the selected nodal graph metrics, while the leave-one-out cross-validation (LOOCV) was used to obtain consensus connections. Comparisons were performed to explore the altered patterns of connectome features. Further, the multiple kernel support vector machine (MK-SVM) was used for combining brain connectomes and differentiating SCD from NCs. We showed that the consensus connections and nodal graph metrics with the most discriminative ability were mostly found in the frontal, limbic, and parietal lobes, corresponding to the default mode network (DMN) and frontoparietal task control (FTC) network. Altered pattern analysis demonstrated that SCD cases had a tendency for modularity and local efficiency enhancement. Additionally, using the MK-SVM to combine the features of multiple brain connectomes was associated with optimal classification performance [area under the curve (AUC): 0.9510, sensitivity: 97.22%, specificity: 85.29%, and accuracy: 91.43%]. Therefore, our study highlighted the combination of multiple connectome attributes based on morphological brain networks and offered a valuable method for distinguishing SCD individuals from NCs. Moreover, the altered patterns of multidimensional connectome attributes provided a promising insight into the neuroimaging mechanism and early intervention in SCD subjects.
Introduction
Alzheimer’s disease (AD) is a neurodegenerative disease accompanied by cognitive decline, changes in personality, and impaired ability to perform daily activities. A total of 131.5 million people are estimated to have dementia by 2050 worldwide (Quinn et al., 2018). Early AD prevention and treatment are critical. Subjective cognitive decline (SCD), a self-experienced and reported worsening of confusion and memory loss, is one of the initial manifestations of preclinical AD (Jessen et al., 2014). Therefore, finding objective evidence to diagnose SCD early is extremely valuable for targeted AD prevention.
Researchers have used noninvasive magnetic resonance imaging (MRI) to assess alterations in brain structure and function in the initial asymptomatic stages of AD (Xu et al., 2021). Several studies have found that SCD patients had lower hippocampal volume and thinner cortical thickness in their temporoparietal lobe, which was linked to faster subsequent memory loss and higher risk of disease aggravation (Verfaillie et al., 2016, Verfaillie et al., 2018a; Yue et al., 2018). In addition, various MRI techniques, such as resting-state functional MRI (rs-fMRI), diffusion tensor imaging (DTI), and three-dimensional (3D) T1-weighted images (WI) structural MRI (3D-T1WI sMRI), have been used to assess changes in the morphology, structure, and function of brain network and provided new insights into the topological organization of graph theory attributes in SCD individuals. Furthermore, rs-fMRI has found that SCD cases had increased functional connectivity in their retrosplenial cortex and precuneus but decreased functional connectivity in their frontoparietal cortex and posterior memory system (Dillen et al., 2016; Dong et al., 2018; Viviano et al., 2019). In a study by Shu et al. (2018), the investigators used DTI to investigate the brain structural connectome in SCD patients and found significant disruptions in the topological efficiency in structural connectomes associated with memory impairment. Recently, the individual morphological brain network construction methods based on 3D-T1 sMRI have been used to explore the characteristics of brain networks (Kong et al., 2014). Some researchers (Tijms et al., 2018; Verfaillie et al., 2018b) have used the individual morphological brain network approach in SCD patients and found that they exhibited abnormal topological attributes, such as lower path length values in the precuneus, frontal, occipital, and temporal lobes, which were associated with disease progression and obvious deterioration in clinical cognitive performance. Nevertheless, the specific alterations in various topological properties of SCD patients and their value for early identification of SCD remain to be further investigated.
For the diverse connectome indicators derived from morphological brain networks, such as morphological brain connections and global and nodal graph metrics, a combination of multidimensional data was conducted to distinguishing the SCD individuals from normal controls (NCs). In our previous study, this proposed method, multiple kernel support vector machine (MK-SVM), was used to fuse the functional brain connectome information and has demonstrated a good classification performance in differentiating between patients with mild cognitive impairment (MCI) and NCs (Xu et al., 2020a). However, the combination of topological features of structural brain networks to accurately identify SCD patients remains to be further validated.
By combining graph-theoretic analysis and MK-SVM based on individual-level morphological brain network, this study primarily aimed to: (i) identify the discriminative topology properties and specific brain areas of SCD subjects; (ii) determine the distinctive alteration patterns in connectome features that are significantly different between SCD and NC groups; and (iii) explore an accurate classifier for distinguishing SCD patients from NCs.
Materials and Methods
Participants
For this study, 36 SCD patients and 34 NCs were selected. Each participant underwent neuropsychological and neuroimaging tests. The neuropsychological scales used in this study were the Verbal Fluency Test (VFT), Activity of Daily Living Scale (ADL), Auditory Verbal Learning Test (AVLT; Vakil and Blachstein, 1993), Geriatric Depression Scale (GDS; Sawada et al., 2019), and Montreal Cognitive Assessment (MoCA; Nasreddine et al., 2005). SCD cases were selected based on the following criteria (Jessen et al., 2014): (a) the age of onset of >60 years; (b) gradual decrease in self-perceived memory during the past 5 years (compared to initial non-disease state) or that could be validated by a close caregiver; (c) normal general cognitive function, as confirmed by the objective scale. NCs comprised participants with no cognitive impairment and normal neuropsychological scale scores.
The study protocol was approved by the Ethics Committee of Tongji Hospital of Tongji University (Shanghai, China). Before sample enrollment, each participant or their legal representative(s) provided signed consent for participation.
Data acquisition
The 3.0T MagnetomVerio MRI scanner (Siemens, Munich, Germany), equipped with 32-channel head coils, was used to perform T1WI-MRI on each participant. During the MRI, each participant was advised and guided to: (1) close their eyes (not sleeping); (2) keep calm and avoid any thoughts as much as possible; and (3) avoid any movements. High-resolution T1WI 3D scans were obtained by using the 3D magnetization-prepared rapid gradient echo (MP-RAGE) at the following parameters: slice number = 192; flip angle = 7°; matrix size = 256 × 256; echo time (TE) = 2.98 ms; inversion time (TI) = 1,100 ms; repetition time (TR) = 2,530 ms; slice thickness = 1.0 mm; field of view (FOV) = 256 × 256 mm2, voxel size = 1.0 × 1.0 × 1.0 mm3. The scan was performed in 6.03 min.
Preprocessing of MRI
Statistical Parametric Mapping (SPM12; Pataky, 2010) was used to preprocess the scan images. Voxel-based morphometric (VBM) was used to segment individual structural MRI images into the cerebrospinal fluid (CSF), gray matter (GM), and white matter (Ashburner and Friston, 2000). DARTEL was used to normalize the GM images according to the Montreal Neurologic Institute (MNI) criteria (Ashburner, 2007). Jacobian determinants were used to compensate and modify the effects of spatial normalization. Lastly, smoothing of all normalized T1WI structural images was performed using a 6.0-mm full width at half-maximum Gaussian kernel to enhance the signal-to-noise ratio and allow even data distribution (Shen and Sterr, 2013).
Construction of individual morphological brain network
The brain was divided into 90 regions of interest (ROIs) based on the Automatic Anatomical Labeling (AAL) atlas, which were defined as nodes of the morphological brain network (Tzourio-Mazoyer et al., 2002). Jensen-Shannon distance-based similarity (JSS) was used to evaluate the morphological brain network connections between two brain ROIs (Endres and Schindelin, 2003; Peng et al., 2022). First, the GM volume values were extracted from all voxels of each brain region. Second, the kernel density estimation (KDE) was used for calculating the GM volume values probability density function. Third, the probability distribution function (PDF) was calculated for the derived GM volume value probability density function. Lastly, based on the probability distribution function, we calculated the JSS value between any pair of ROIs. The value range of JSS was (0, 1), where 1 represented the same distribution. Therefore, a closer GM density distribution between two ROIs was represented by a higher JSS value. The set of sparsity thresholds (range, 0.1–0.4; steps, 0.01) was also used for constructing an undirected binary network.
Statistical analyses
The Statistical Package for Social Science (SPSS v26; IBM, Armonk, NY, USA) was used to compare baseline data between SCD patients and NCs with a two-sample t-test, rank-sum test, or chi-squared (χ2) test. A P value of <0.01 was used as the threshold for statistical difference. Comparisons between discriminative brain network connectome features were performed with the two-sample t-test (P < 0.01). Their false discovery rate for multiple comparisons was also determined for corrections as needed.
Feature selection and classification
The t-test was applied to identify discriminative brain regions and nodal graph metrics of the brain network. For the high-dimensional connectome information, MK-SVM was used to combine different types of connectome features. The MATLAB LIBSVM toolbox3 was used to perform the MK-SVM classification (Xu et al., 2020a). The specific calculation process was listed as follows.
Here, n indicates the size of the sample, x1i, x2i, and x3i represent the value of brain connection, global metrics, and nodal graph metrics, respectively, of the ith sample where is the kernel matrix for mth modality. The following equation can be used to represent the dual form of MK-SVM.
Here, represent the kernel matrix on the mth modality. was used to define the kernel matrix between a new test sample and the ith training sample for the mth modality. MK-SVM was used to assess the classification performance using the following equation.
βm was used on the grid-searching space based on a cross-validation scheme using the constraint ranged between 2−5 and 25.
Considering the small sample size used in the present study, we utilized the Leave-one-out cross-validation (LOOCV) strategy to optimize the parameters and discern classification performance. The classification performance was compared for a single feature and the combination of different connectome features, including morphological brain connection (C), global graph metrics (G), nodal graph metrics (N), C+G+N, C+N, G+N, and C+G, respectively.
Consensus connections
When using the nested cross-validation strategy to assess the classification performance based on the proposed MK-SVM method, all selected connection features during the training process were recorded. In the present study, as the selected features by t-tests in each validation might be different, we recorded all the selected features during the training process. The consensus connections refer to the features that are consistently selected in all validations (Dosenbach et al., 2010; Zeng et al., 2012). Therefore, in our study, the consensus connections of brain networks were considered the most discriminative features to explore the pathological mechanisms and potential biomarkers associated with SCD. The data processing and classification methodologies are illustrated in Figure 1.
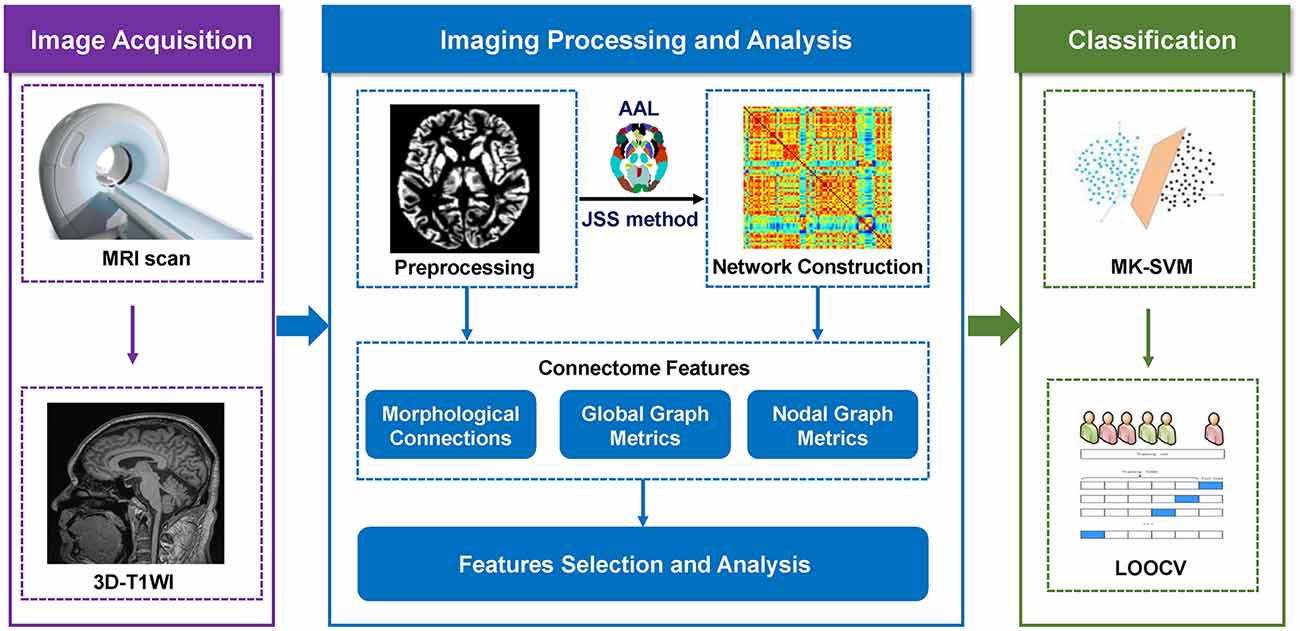
Figure 1. The procedure of data processing and classification.
Results
Demographic and neurocognitive characteristics
Table 1 shows the characteristics of the study participants. Our findings showed that the SCD group had significantly higher VFT-vegetable scores than the NC group (p < 0.01). The other variables between the two groups were not significantly different.
Table 1. Demographic and neurocognitive characteristics of the NC and SCD groups.
Graph metrics of the morphological brain connectome
Our results showed that an increase in the connection density was associated with an increase in the value of Cp, Eglobal, and Elocal and a decrease in Lp, λ, γ, σ, and Q between the two groups (Table 2; Figure 2). Moreover, SCD patients and NCs both fitted γ = Cpreal/Cprand>1, and λ = Lpreal/Lprand≈1, indicating that the morphological networks of the brain were associated with greater real Cp values and similar real Lp values compared with the matched random networks. Thus, both groups met the “small-world” topological attributes. Further, we observed that SCD patients had lower λ values than NCs for almost the entire range of connection density (P < 0.01).
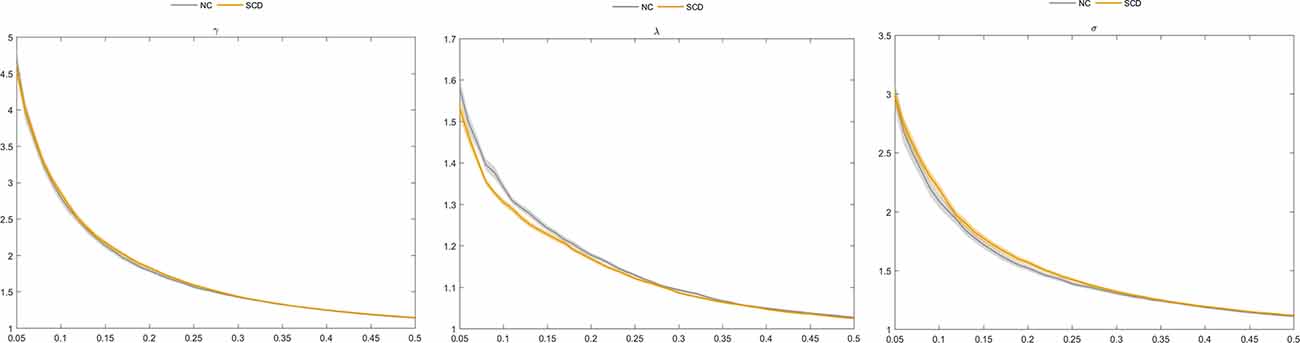
Figure 2. Comparison of normalized clustering coefficient (γ), normalized characteristic path length (λ), and “small world” (σ) between the subjective cognitive decline (SCD) and normal control (NC) groups.
Table 2. Statistical result of graph metrics between the two groups.
We analyzed the most discriminative nodal graph topological features. Table 3 shows that the betweenness centrality, degree centrality, and nodal efficiency were the most discriminative abilities between the two groups and were mostly found in the limbic and frontal lobes, corresponding to DMN, frontoparietal task control (FTC), and sensory/somatomotor hand (SH) brain networks. Further comparisons of nodal graph metrics revealed that SCD patients had significantly higher values of betweenness centrality, nodal clustering coefficient, degree centrality, nodal efficiency, and local nodal efficiency in the frontal lobe (e.g., the bilateral inferior frontal and right superior frontal gyri), limbic lobe (e.g., left parahippocampal gyri), and central region (e.g., left postcentral gyri). In contrast, the nodal shortest path length and degree centrality values were significantly lower in the left supplementary motor area, left superior frontal gyri, and medial orbital gyri (P < 0.01 for all).
Table 3. Top 15 most discriminative nodal graph metrics.
Consensus connections of morphological brain connectome
We investigated the significantly different consensus connections between the two groups. As shown in Table 4 and Figure 3; most of the consensus connections were found in the frontal, temporal, parietal, and occipital lobes. Furthermore, corresponding subnetworks to these brain regions were the DMN, visual network, and auditory network. Additionally, our results suggested that the mean values of consensus connections distributed in the occipital and temporal lobes were lower in the SCD group than in the NC group. However, the mean values of consensus connections distributed in the frontal lobe or between the frontal lobe and other brain regions (e.g., the temporal and parietal lobes) of SCD patients were higher than those in NCs.
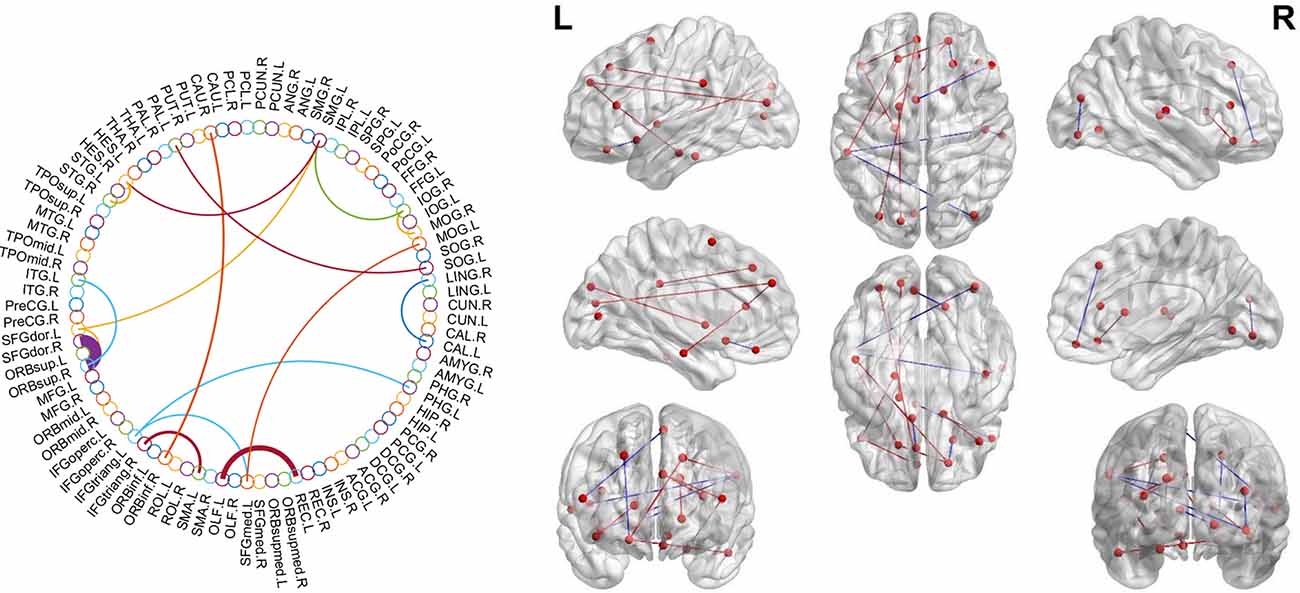
Figure 3. Theconsensus connections of the morphological brain network. Left: theconsensus connections of the morphological brain network selected byleave-one-out cross-validation (LOOCV) in the subjective cognitivedecline (SCD) and normal control (NC) groups based on AAL90. Thethickness of an arc in the circle indicates the discriminative powerof an edge, which is inversely proportional to the estimatedP-values. The colors were randomly generated to differentiate regionsof interest (ROIs). Right: the consensus connections selected by LOOCV. The connections were mapped on the ICBM 152 template with the BrainNetViewer package (http://nitrc.org/projects/bnv/). Blue and red represent the decrease and increase of morphological connection weight of SCD groups, respectively.
Table 4. Consensus connections in the NC and SCD groups.
Classification
The MK-SVM method was used to differentiate SCD patients from NCs based on brain connectome information (Table 5; Figure 4). Our results showed that the classification accuracy of the brain networks C, G, and N was 82.86%, 55.71%, and 61.43%, respectively. Furthermore, we performed combinations of the brain network graph metrics, and our results showed that the classification accuracy for C+G, C+N, and G+N was 84.29%, 90.00%, and 62.85%, respectively. The optimal classification performance was with the combination of C, N, and G, which demonstrated an accuracy, sensitivity, specificity, and area under the curve (AUC) of 91.43%, 97.22%, 85.29%, and 0.9510, respectively, indicating that combining the multimodal features could effectively boost the performance of the classification.
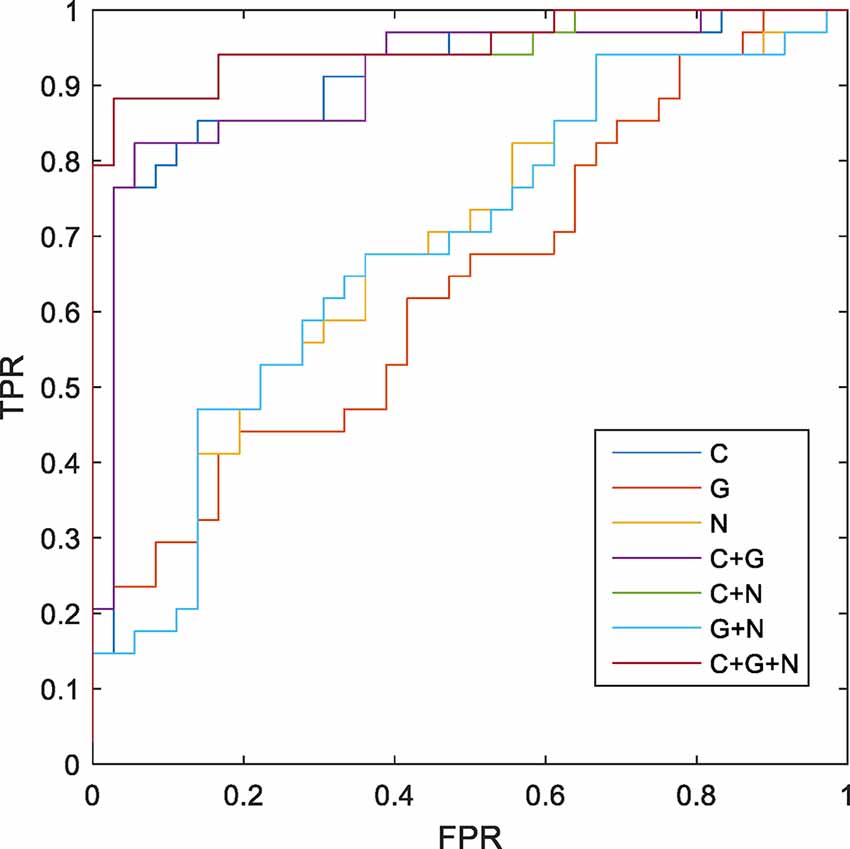
Figure 4. Receiver operating characteristic (ROC) of classification based on different morphological connectome features. C, connection; G, global metrics; N, nodal metrics; FPR, false-positive rate; TPR, true-positive rate.
Table 5. Classification performance of different structural graph metrics.
Discussion
Compared with previous morphological brain network construction methods, the JSS method provides a more accurate evaluation of the similarity between brain regions (Endres and Schindelin, 2003; Li et al., 2021). The quantitative and symmetric JSS divergence evaluation method enables a more objective and accurate description of connections between brain regions in morphological brain networks. Based on the individual morphological brain network, we could identify the most significantly affected brain regions and specific graph metrics that could differentiate between SCD patients and NCs. The altered patterns of topological properties of the morphological brain connectome indicated the enhancement of local brain network function associated with SCD. We trained a classifier for differentiating SCD patients from NCs and acquired a surprising result based on the MK-SVM method. Finally, we applied the MK-SVM method for the combination of multidimensional brain network connectome features and distinguishing SCD patients from NCs.
Most discriminative brain network features and the altered patterns
For the discriminative brain network features identified in this study, our results indicated that the nodal graph metrics and consensus connections with the most discriminative abilities were primarily located in the frontal, limbic, and parietal lobes. Furthermore, an analysis showed that when these brain regions were projected to subnetworks, most of them were located in the DMN and FTC networks, among which DMN demonstrated the greatest ability to distinguish SCD patients from NCs. Previous literature has reported an association between DMN and episodic memory loss, which was then referred to as the most significant cognitive domain impairment in early-stage AD (Wang et al., 2013; Joshi et al., 2019). Previous studies comparing the functional brain networks between SCD and MCI patients have also confirmed these early alterations and the important role of DMN-related brain regions (Xu et al., 2020a, b). Nevertheless, our study validated the significant changes in DMN in SCD patients from the individual morphological brain network perspective. Thus, our results not only validated the discriminative ability of the DMN for discriminating NCs from SCD patients but also showed the repeatability and verifiability of the proposed methods.
For the altered pattern analysis of brain network connectome features, our results showed that both SCD patients and NCs met the “small-world” topological attributes, which was consistent with our previous findings on functional brain networks. This suggests the high efficiency of brain networking in integrating information rapidly in real time across brain regions to actively optimize information processing between brain regions at the lowest cost possible (Watts and Strogatz, 1998; Liao et al., 2017). In addition, some previous studies based on the white matter structural network or functional network have found that functional integration among brain regions was decreased in SCD (Xu et al., 2020b; Tao et al., 2021). In our study, we found that a decreased value of λ was associated with an increase in the function of brain network integration in SCD, suggesting that SCD patients had an enhanced ability to communicate and transmit global information compared to NCs, which might be related to compensatory alterations in the morphological brain networks during SCD progression.
At the level of local brain regions, we observed that the discriminative ability for nodal efficiency, degree centrality, and betweenness centrality was the most significant among the selected nodal graph measurements. A previous study has found that SCD patients had less global efficiency and local efficiency mainly distributed in the bilateral prefrontal regions and left thalamus and demonstrated the disruption of structural network topology in SCD (Shu et al., 2018). In our study, an increase in nodal clustering coefficient and local efficiency and reduced values in nodal shortest path length in the frontal and limbic lobes were associated with increased modularity and local efficiency in the morphological brain network in SCD patients. The result reflected the enhanced function of brain network segregation in SCD, which were also found in functional brain network (Xu et al., 2020b). Similarly, the increased mean value of consensus connections distributed between the frontal lobe or frontal lobes and other brain regions (e.g., the temporal and parietal lobes) in the SCD group indicated the compensatory changes in the morphological brain network with enhanced connectivity of some brain regions. As mentioned in a previous study, these compensatory changes may be attributed to the indistinctive decline in cognitive function during SCD (Chen et al., 2020).
Classification performance of different connectome features
This study used MK-SVM to combine brain connectomes and differentiate SCD patients from NCs. MK-SVM is a sparse machine-learning method that can solve imbalanced dimension issues to achieve the best classification performance. As shown in Table 5, brain connections exhibited the most excellent performance for the single modality of morphological brain network connectome, with an AUC of 0.9027. We found that regardless of global or nodal graph metrics, combining with brain connections could effectively improve their classification performance, the reason for which may be that brain connections carry abundant information. Notably, despite the worst classification performance of the global graph metrics among these features, it does not mean that it is insignificant, and the result may be related to the low dimension of the data it contains. The global graph metrics were very meaningful for exploring the global properties of brain network connectomes and disease mechanisms. Although the AUC of global and nodal graph metrics were lower than brain connections, the combination of C+G, C+N, and G+N significantly improved classification performance. Particularly, combining three brain connectome features (C+G+N) with MK-SVM demonstrated optimal classification performance, with an AUC of 0.9510, which was superior to the SCD classification based on the functional brain network in our previous study (Xu et al., 2020b). Recent studies, such as that by Huang et al. (2021) have employed MK-SVM to integrate information from three types of white matter networks and obtained an accuracy of 83.3% for distinguishing MCI subjects from NCs. Previous researchers, using the linear kernel SVM, achieved the accuracy of 79.49% and 83.13% in two different cohorts for the diagnosis of SCD individuals (Lin et al., 2022). For our results, these results can only be used for reference and compared to some extent. Due to the differences in data sets and model parameters, further verification is needed to understand whether different classification models can be compared or not. In sum, our results demonstrated that a combination of brain connectome features provided complementary information to each other and further enhanced SCD classification performance.
Limitations and perspectives
There were some limitations to the present study that need to be addressed in the future. First, it was a single-center study with a relatively small number of participants. Hence, the robustness and generalizability of the proposed model still require further validation and improvement in multicenter and larger cohort studies. Second, only neuroimaging information was used in this study, but we intend to combine SCD with additional diagnostic tests (i.e., PET, electroencephalography, biomarkers, and clinical cognitive function examinations) to deepen our understanding of SCD pathogenesis. Third, a stringent and longer follow-up of different AD stages via imaging techniques would be useful to identify early and specific markers that could improve the diagnosis of AD and predict its progression.
Conclusions
This study showed that compared with NC, the most discriminative traits of SCD patients were located in the frontal, limbic, and parietal lobes, corresponding to DMN and FTC networks. The altered pattern analysis demonstrated that SCD was more inclined to modularity along with local efficiency enhancement. Furthermore, MK-SVM combined with multiple brain connectome features to overcome the problems of the high-dimensional curves and small samples and effectively improved the classification performance for SCD diagnosis. Our research findings provided insights for improving the SCD diagnosis. Multidimensional connectome attributes analysis based on the morphological changes in brain networks provides a promising approach for insight into the neuroimaging mechanism and early intervention in SCD subjects.
Data Availability Statement
The original contributions presented in the study are included in the article, further inquiries can be directed to the corresponding author.
Ethics Statement
The studies involving human participants were reviewed and approved and the study protocol was approved by the Ethics Committee of Tongji Hospital of Tongji University (Shanghai, China). The patients/participants provided their written informed consent to participate in this study.
Author Contributions
Study design and writing: XX and PC. MRI scanning: YX. Diagnosis and data collection: ZX, QY, and XZ. Data analysis: XX and PC. Critical revision: PW. All authors contributed to the article and approved the submitted version.
Funding
This work was partially supported by the National Natural Science Foundation of China (Grant Nos. 82102023, 81830059); the Clinical Research Plan of SHDC (No. SHDC2020CR1038B); Science and Technology Commission of Shanghai Municipality (No. 19411951400).
Conflict of Interest
The authors declare that the research was conducted in the absence of any commercial or financial relationships that could be construed as a potential conflict of interest.
Publisher’s Note
All claims expressed in this article are solely those of the authors and do not necessarily represent those of their affiliated organizations, or those of the publisher, the editors and the reviewers. Any product that may be evaluated in this article, or claim that may be made by its manufacturer, is not guaranteed or endorsed by the publisher.
References
Ashburner, J. (2007). A fast diffeomorphic image registration algorithm. Neuroimage 38, 95–113. doi: 10.1016/j.neuroimage.2007.07.007
Ashburner, J., and Friston, K. J. (2000). Voxel-based morphometry–the methods. Neuroimage 11, 805–821. doi: 10.1006/nimg.2000.0582
Chen, H., Sheng, X., Luo, C., Qin, R., Ye, Q., Zhao, H., et al. (2020). The compensatory phenomenon of the functional connectome related to pathological biomarkers in individuals with subjective cognitive decline. Transl. Neurodegener. 9:21. doi: 10.1186/s40035-020-00201-6
Dillen, K. N. H., Jacobs, H. I. L., Kukolja, J., von Reutern, B., Richter, N., Onur, Ö. A., et al. (2016). Aberrant functional connectivity differentiates retrosplenial cortex from posterior cingulate cortex in prodromal Alzheimer’s disease. Neurobiol. Aging 44, 114–126. doi: 10.1016/j.neurobiolaging.2016.04.010
Dong, C., Liu, T., Wen, W., Kochan, N. A., Jiang, J., Li, Q., et al. (2018). Altered functional connectivity strength in informant-reported subjective cognitive decline: a resting-state functional magnetic resonance imaging study. Alzheimers Dement. (Amst) 10, 688–697. doi: 10.1016/j.dadm.2018.08.011
Dosenbach, N. U., Nardos, B., Cohen, A. L., Fair, D. A., Power, J. D., Church, J. A., et al. (2010). Prediction of individual brain maturity using fMRI. Science 329, 1358–1361. doi: 10.1126/science.1194144
Endres, D. M., and Schindelin, J. E. (2003). A new metric for probability distributions. IEEE Trans. Inform. Theory 49, 1858–1860. doi: 10.1109/TIT.2003.813506
Huang, W., Li, X., Li, X., Kang, G., Han, Y., and Shu, N. (2021). Combined support vector machine classifier and brain structural network features for the individual classification of amnestic mild cognitive impairment and subjective cognitive decline patients. Front. Aging Neurosci. 13:687927. doi: 10.3389/fnagi.2021.687927
Jessen, F., Amariglio, R. E., van Boxtel, M., Breteler, M., Ceccaldi, M., Chételat, G., et al. (2014). A conceptual framework for research on subjective cognitive decline in preclinical Alzheimer’s disease. Alzheimers Dement. 10, 844–852. doi: 10.1016/j.jalz.2014.01.001
Joshi, H., Bharath, S., Balachandar, R., Sadanand, S., Vishwakarma, H. V., Aiyappan, S., et al. (2019). Differentiation of early Alzheimer’s disease, mild cognitive impairment and cognitively healthy elderly samples using multimodal neuroimaging indices. Brain Connect. 9, 730–741. doi: 10.1089/brain.2019.0676
Kong, X. Z., Wang, X., Huang, L., Pu, Y., Yang, Z., Dang, X., et al. (2014). Measuring individual morphological relationship of cortical regions. J. Neurosci. Methods 237, 103–107. doi: 10.1016/j.jneumeth.2014.09.003
Li, W., Tang, Y., Wang, Z., Hu, S., and Gao, X. (2021). The reconfiguration pattern of individual brain metabolic connectome for Parkinson’s disease identification. arXiv [Preprint]. doi: 10.48550/arXiv.2105.02811
Liao, X., Vasilakos, A. V., and He, Y. (2017). Small-world human brain networks: perspectives and challenges. Neurosci. Biobehav. Rev. 77, 286–300. doi: 10.1016/j.neubiorev.2017.03.018
Lin, H., Jiang, J., Li, Z., Sheng, C., Du, W., Li, X., et al. (2022). Identification of subjective cognitive decline due to Alzheimer’s disease using multimodal MRI combining with machine learning. Cereb. Cortex . [Online ahead of print]. doi: 10.1093/cercor/bhac084
Nasreddine, Z. S., Phillips, N. A., Bédirian, V., Charbonneau, S., Whitehead, V., Collin, I., et al. (2005). The Montreal Cognitive Assessment, MoCA: a brief screening tool for mild cognitive impairment. J. Am. Geriatr. Soc. 53, 695–699. doi: 10.1111/j.1532-5415.2005.53221.x
Pataky, T. C. (2010). Generalized n-dimensional biomechanical field analysis using statistical parametric mapping. J. Biomech. 43, 1976–1982. doi: 10.1016/j.jbiomech.2010.03.008
Peng, L., Feng, J., Ma, D., Xu, X., and Gao, X. (2022). Rich-club organization disturbances of the individual morphological network in subjective cognitive decline. Front. Aging Neurosci. 14:834145. doi: 10.3389/fnagi.2022.834145
Quinn, J. P., Corbett, N. J., Kellett, K. A. B., and Hooper, N. M. (2018). Tau proteolysis in the pathogenesis of tauopathies: neurotoxic fragments and novel biomarkers. J. Alzheimers Dis. 63, 13–33. doi: 10.3233/JAD-170959
Sawada, K., Yoshida, K., Ozawa, C., Mizuno, Y., Rubinstein, E. B., Suzuki, T., et al. (2019). Impact of subjective vs. objective remission status on subjective cognitive impairments in depression. J. Affect. Disord. 246, 99–104. doi: 10.1016/j.jad.2018.12.049
Shen, S., and Sterr, A. (2013). Is DARTEL-based voxel-based morphometry affected by width of smoothing kernel and group size? A study using simulated atrophy. J. Magn. Reson. Imaging 37, 1468–1475. doi: 10.1002/jmri.23927
Shu, N., Wang, X., Bi, Q., Zhao, T., and Han, Y. (2018). Disrupted topologic efficiency of white matter structural connectome in individuals with subjective cognitive decline. Radiology 286, 229–238. doi: 10.1148/radiol.2017162696
Tao, W., Li, H., Li, X., Huang, R., Shao, W., Guan, Q., et al. (2021). Progressive brain degeneration from subjective cognitive decline to amnestic mild cognitive impairment: evidence from large-scale anatomical connection classification analysis. Front. Aging Neurosci. 13:687530. doi: 10.3389/fnagi.2021.687530
Tijms, B. M., Ten Kate, M., Gouw, A. A., Borta, A., Verfaillie, S., Teunissen, C. E., et al. (2018). Gray matter networks and clinical progression in subjects with predementia Alzheimer’s disease. Neurobiol. Aging 61, 75–81. doi: 10.1016/j.neurobiolaging.2017.09.011
Tzourio-Mazoyer, N., Landeau, B., Papathanassiou, D., Crivello, F., Etard, O., Delcroix, N., et al. (2002). Automated anatomical labeling of activations in SPM using a macroscopic anatomical parcellation of the MNI MRI single-subject brain. Neuroimage 15, 273–289. doi: 10.1006/nimg.2001.0978
Vakil, E., and Blachstein, H. (1993). Rey auditory-verbal learning test: structure analysis. J. Clin. Psychol. 49, 883–890. doi: 10.1002/1097-4679(199311)49:6<883::aid-jclp2270490616>3.0.co;2-6
Verfaillie, S. C., Tijms, B., Versteeg, A., Benedictus, M. R., Bouwman, F. H., Scheltens, P., et al. (2016). Thinner temporal and parietal cortex is related to incident clinical progression to dementia in patients with subjective cognitive decline. Alzheimers Dement. (Amst) 5, 43–52. doi: 10.1016/j.dadm.2016.10.007
Verfaillie, S. C. J., Slot, R. E., Tijms, B. M., Bouwman, F., Benedictus, M. R., Overbeek, J. M., et al. (2018a). Thinner cortex in patients with subjective cognitive decline is associated with steeper decline of memory. Neurobiol. Aging 61, 238–244. doi: 10.1016/j.neurobiolaging.2017.09.009
Verfaillie, S. C. J., Slot, R. E. R., Dicks, E., Prins, N. D., Overbeek, J. M., Teunissen, C. E., et al. (2018b). A more randomly organized grey matter network is associated with deteriorating language and global cognition in individuals with subjective cognitive decline. Hum. Brain Mapp. 39, 3143–3151. doi: 10.1002/hbm.24065
Viviano, R. P., Hayes, J. M., Pruitt, P. J., Fernandez, Z. J., van Rooden, S., van der Grond, J., et al. (2019). Aberrant memory system connectivity and working memory performance in subjective cognitive decline. Neuroimage 185, 556–564. doi: 10.1016/j.neuroimage.2018.10.015
Wang, L., Li, H., Liang, Y., Zhang, J., Li, X., Shu, N., et al. (2013). Amnestic mild cognitive impairment: topological reorganization of the default-mode network. Radiology 268, 501–514. doi: 10.1148/radiol.13121573
Watts, D. J., and Strogatz, S. H. (1998). Collective dynamics of ‘small-world’ networks. Nature 393, 440–442. doi: 10.1038/30918
Xu, X., Li, W., Mei, J., Tao, M., Wang, X., Zhao, Q., et al. (2020a). Feature selection and combination of information in the functional brain connectome for discrimination of mild cognitive impairment and analyses of altered brain patterns. Front. Aging Neurosci. 12:28. doi: 10.3389/fnagi.2020.00028
Xu, X., Li, W., Tao, M., Xie, Z., Gao, X., Yue, L., et al. (2020b). Effective and accurate diagnosis of subjective cognitive decline based on functional connection and graph theory view. Front. Neurosci. 14:577887. doi: 10.3389/fnins.2020.577887
Xu, X., Wang, T., Li, W., Li, H., Xu, B., Zhang, M., et al. (2021). Morphological, structural and functional networks highlight the role of the cortical-subcortical circuit in individuals with subjective cognitive decline. Front. Aging Neurosci. 13:688113. doi: 10.3389/fnagi.2021.688113
Yue, L., Wang, T., Wang, J., Li, G., Wang, J., Li, X., et al. (2018). Asymmetry of hippocampus and amygdala defect in subjective cognitive decline among the community dwelling Chinese. Front. Psychiatry 9:226. doi: 10.3389/fpsyt.2018.00226
Keywords: subjective cognitive decline, structural magnetic resonance imaging, morphological brain network, graph theory, multiple kernel learning
Citation: Xu X, Chen P, Xiang Y, Xie Z, Yu Q, Zhou X and Wang P (2022) Altered pattern analysis and identification of subjective cognitive decline based on morphological brain network. Front. Aging Neurosci. 14:965923. doi: 10.3389/fnagi.2022.965923
Received: 10 June 2022; Accepted: 12 July 2022;
Published: 11 August 2022
Edited by:
Zhengxia Wang, Hainan University, ChinaReviewed by:
Kai Ma, Nanjing University of Aeronautics and Astronautics, ChinaHaifeng Chen, Nanjing Drum Tower Hospital, China
Copyright © 2022 Xu, Chen, Xiang, Xie, Yu, Zhou and Wang. This is an open-access article distributed under the terms of the Creative Commons Attribution License (CC BY). The use, distribution or reproduction in other forums is permitted, provided the original author(s) and the copyright owner(s) are credited and that the original publication in this journal is cited, in accordance with accepted academic practice. No use, distribution or reproduction is permitted which does not comply with these terms.
*Correspondence: Peijun Wang, tongjipjwang@vip.sina.com
† These authors have contributed equally to this work