The Shark Basal Hypothalamus: Molecular Prosomeric Subdivisions and Evolutionary Trends
 Gabriel N. Santos-Durán1
  Susana Ferreiro-Galve1
  Arnaud Menuet2
  Sylvie Mazan3
  Isabel Rodríguez-Moldes1
  Eva Candal1*
- 1Grupo BRAINSHARK, Departamento de Bioloxía Funcional, Universidade de Santiago de Compostela, Santiago de Compostela, Spain
- 2UMR7355, CNRS, University of Orleans, Orleans, France
- 3CNRS, Sorbonne Université, Biologie Intégrative des Organismes Marins, UMR7232, Banyuls-sur-Mer, France
The hypothalamus is a key integrative center of the vertebrate brain. To better understand its ancestral morphological organization and evolution, we previously analyzed the segmental organization of alar subdivisions in the catshark Scyliorhinus canicula, a cartilaginous fish and thus a basal representative of gnathostomes (jawed vertebrates). With the same aim, we deepen here in the segmental organization of the catshark basal hypothalamus by revisiting previous data on ScOtp, ScDlx2/5, ScNkx2.1, ScShh expression and Shh immunoreactivity jointly with new data on ScLhx5, ScEmx2, ScLmx1b, ScPitx2, ScPitx3a, ScFoxa1, ScFoxa2 and ScNeurog2 expression and proliferating cell nuclear antigen (PCNA) immunoreactivity. Our study reveals a complex genoarchitecture for chondrichthyan basal hypothalamus on which a total of 21 microdomains were identified. Six belong to the basal acroterminal region, the rostral-most point of the basal neural tube; seven are described in the tuberal region (Tu/RTu); four in the perimamillar region (PM/PRM) and four in the mamillar one (MM/RM). Interestingly, the same set of genes does not necessarily describe the same microdomains in mice, which in part contributes to explain how forebrain diversity is achieved. This study stresses the importance of analyzing data from basal vertebrates to better understand forebrain diversity and hypothalamic evolution.
Introduction
The hypothalamus is an important physiologic center of the brain. It integrates information from limbic, endocrine and autonomic sources to elaborate different kinds of homeostatic and behavioral responses such as feeding or reproduction. Its organization has been elusive for neuroanatomists as result of complex patterning processes converging at this point (Shimamura et al., 1995; Puelles and Rubenstein, 2003; Puelles et al., 2004; Medina, 2008; Szabó et al., 2009; Shimogori et al., 2010; Alvarez-Bolado et al., 2012; Beccari et al., 2013; Croizier et al., 2015).
The prosomeric model, a modern paradigm of vertebrate brain development and organization (Puelles and Rubenstein, 2003, 2015; Puelles et al., 2012; Puelles, 2017), understands the hypothalamus to be located ventral to the telencephalon, being both located rostral to the diencephalon (or primary prosencephalon). Moreover, telencephalon and hypothalamus (known together as secondary prosencephalon) are subdivided into two true segments: hp2, rostral or terminal; hp1, caudal or peduncular (see Puelles et al., 2012). The intrahypothalamic border (IHB) separates hp2 from hp1 while the hypothalamo-diencephalic border (HDB) separates hp1 from p3, the rostral-most unit of the tripartite segmental diencephalon (Puelles et al., 2012).
The updated prosomeric view of the hypothalamus understands it to be organized into five longitudinal histogenetic domains dorso-ventrally arranged into two alar and three basal domains (Puelles et al., 2012; Puelles and Rubenstein, 2015) separated by the alar-basal boundary (ABB). Moreover, these dorso-ventral domains can be further subdivided into two rostro-caudal subdomains (terminal or peduncular; the last also indicated by the particle “retro”): terminal and peduncular paraventricular area (TPa/PPa); terminal and peduncular subparaventricular area (TSPa/PSPa); tuberal and retrotuberal area (Tu/RTu); perimamillary and periretromamillary area (PM/PRM); mamillary and retromamillary area (MM/RM; Morales-Delgado et al., 2011, 2014; Puelles et al., 2012; Díaz et al., 2015; Ferrán et al., 2015; Rodríguez-Moldes et al., 2017). Furthermore, at the rostral-most hp2, where the alar and basal plates meet, a region referred as acroterminal is recognized. It has special patterning properties that are at the basis of the development of structures like the optic chiasm or the neurohypophysis (Puelles et al., 2012; Ferrán et al., 2015; Puelles and Rubenstein, 2015). Noteworthy, the underlying logic of segments, boundaries, histogenetic domains, subdomains and microdomains proposed by the prosomeric framework rely on conserved molecular mechanisms (Puelles and Rubenstein, 1993, 2003, 2015; Puelles and Medina, 2002; Puelles et al., 2012; Puelles, 2017). As a result, the prosomeric framework became key for homologies establishment and is largely accepted as a comparative tool (Puelles and Rubenstein, 2003; Martínez-de-la-Torre et al., 2011; Medina et al., 2011; Moreno et al., 2012, 2017; Domínguez et al., 2013, 2014, 2015; González et al., 2017; Pombal and Megías, 2017; Rodríguez-Moldes et al., 2017).
Cartilaginous fishes, also known as Chondrichthyans, are a key group for evo-devo studies. They are among the most basal extant groups of gnathostomes (jawed vertebrates) being the closest out-group to osteichthyans (the other major phylum of gnathostomes, which includes bony fishes and tetrapods). Therefore, they are essential to address the ancestral condition of the vertebrate brain (Coolen et al., 2009). In previous work, we sketched prosomeric organization in the catshark Scyliorhinus canicula to better understand the ancestral condition of the vertebrate hypothalamus (Santos-Durán et al., 2015). In this study, the expression of ScNkx2.1, ScDlx2/5, ScShh and ScOtp led to the identification of alar and basal domains, apparently homologous to the murine ones. However, this work also suggested that alar organization seems to be more conserved than basal one, what correlates with the development of conserved and divergent adult structures, respectively (Santos-Durán et al., 2015; Rodríguez-Moldes et al., 2017). In subsequent work we deeply tested prosomeric assumptions in the alar hypothalamus on the light of additional makers. Our findings suggested conserved traits that can be traced back to the agnathan-gnathostome transition (Santos-Durán et al., 2016). Now, we revisit the organization of the basal hypothalamus with similar aims: (i) to look for further prosomeric molecular subdivisions; (ii) to test if new data on gene expression patterns support previous prosomeric interpretations; and (iii) to obtain some insights on the evolution of this region by comparative analysis. Noteworthy, conserved adult structures (i.e., tracts of the hypothalamic-hypophyseal system, a median eminence or the neurohypophysis) and divergent ones (i.e., inferior hypothalamic lobes and the saccus vasculosus) emerge from this territory offering an attractive scenario for evolutionary insights. To address these questions, previous data on ScNkx2.1, ScDlx2/5, ScOtp, ScShh expression and Shh immunoreactivity were revised jointly with new data on ScLhx5, ScEmx2, ScLmx1b, ScPitx2, ScPitx3a, ScFoxa1, ScFoxa2 and ScNeurog2 expression and proliferating cell nuclear antigen (PCNA) immunoreactivity patterns. Here we were able to identify a plethora of subdomains (microzones) in the catshark hypothalamus. A comparative analysis of microzone identity in catshark is made with mammals but not with other vertebrates due to the lack of detailed data. However gross comparisons among vertebrates prompt the idea that the caudal border of the hypothalamus, as it is currently defined, could be a derived character rather than a conserved one, a feature that deserves further investigation.
Materials and Methods
Experimental Animals
Some embryos of the catshark (lesser spotted dogfish; S. canicula) were supplied by the Marine Biological Model Supply Service of the CNRS UPMC Roscoff Biological Station (France). Additional embryos were kindly provided by the Aquaria of Gijón (Asturias, Spain), O Grove (Pontevedra, Spain) and Finisterrae (A Coruña, Spain). Embryos were staged by their external features according to Ballard et al. (1993). For more information about the relationship of embryonic stages with body size, gestation and birth, see Table 1 in Ferreiro-Galve et al. (2010). Sixty-nine embryos from stages 28 to 32 were used in this study. Eggs from different broods were raised in seawater tanks in standard conditions of temperature (15–16°C), pH (7.5–8.5) and salinity (35 g/L). Adequate measures were taken to minimize animal pain or discomfort. All procedures conformed to the guidelines established by the European Communities Council Directive of 22 September 2010 (2010/63/UE) and by the Spanish Royal Decree 53/2013 for animal experimentation and were approved by the Ethics Committee of the University of Santiago de Compostela.
Tissue Processing
Embryos were deeply anesthetized with 0.5% tricaine methane sulfonate (MS-222; Sigma, St. Louis, MO, USA) in seawater and separated from the yolk before fixation in 4% paraformaldehyde (PFA) in elasmobranch’s phosphate buffer [EPB: 0.1 M phosphate buffer (PB) containing 1.75% urea, pH 7.4] for 48–72 h depending on the stage of development. Subsequently, they were rinsed in phosphate buffer saline (PBS), cryoprotected with 30% sucrose in PB, embedded in OCT compound (Tissue Tek, Torrance, CA, USA), and frozen with liquid nitrogen-cooled isopentane. Parallel series of sections (12–20 μm thick) were obtained in transverse planes on a cryostat and mounted on Superfrost Plus (Menzel-Glasser, Madison, WI, USA) slides.
Single and Double Immunohistochemistry on Sections and Whole Mounts
For heat-induced epitope retrieval, sections were pre-treated with 0.01 M citrate buffer (pH 6.0) for 30 min at 95°C and allowed to cool for 20–30 min at room temperature (RT). Sections were then rinsed twice in 0.05 M Tris-buffered saline (TBS; pH 7.4) for 5 min each and incubated overnight with the primary antibody (polyclonal rabbit anti-Sonic Hedgehog [anti-Shh], Santa Cruz Biotechnology, Santa Cruz, CA, USA, diluted 1:300; monoclonal mouse anti-proliferating cell nuclear antigen [anti-PCNA] Sigma, St. Louis, MO, USA, diluted 1:500). Appropriate secondary antibodies (horseradish peroxidase [HRP]-conjugated goat anti-rabbit and anti-mouse, BIORAD, diluted 1:200) were incubated for 2 h at RT. The immunoreaction was developed with 0.005% diaminobenzidine (DAB; Sigma) and 0.003% H2O2 for 20–40 min. Sections were rinsed in distilled water (twice for 30 min), allowed to dry for 2 h at 37°C and mounted in MOWIOL 4-88 Reagent (Calbiochem, MerkKGaA, Darmstadt, Germany). All dilutions were made with TBS containing 15% donkey normal serum (DNS; Millipore, Billerica, MA, USA), 0.2% Triton X-100 (Sigma) and 2% bovine serum albumin (BSA, Sigma).
Whole mounts embryos were prepared for IHC as previously described in Santos-Durán et al. (2015). After fixation with 4% PFA in 0.01 M PBS at 4°C for 2 days, embryos were washed in 0.9% NaCl in distilled water, dehydrated in graded series of methanol solutions (50%, 80%, 100%) and stored at −20°C. Samples to be stained were placed on ice in 2 ml of dimethyl sulfoxide (DMSO)/methanol (1/1) until they sank. Then, 0.5 ml of 10% Triton X-100/distilled water was added, and the embryos were incubated for 30 min at RT. After washing in 0.05 M TBS with 0.1% Triton X-100 (TST, pH 7.4), samples were sequentially blocked using spin-clarified aqueous 1% periodic acid and 5% non-fat dried milk in TST (TSTM). Primary antibody (polyclonal rabbit anti-Sonic Hedgehog [anti-Shh], Santa Cruz Biotechnology, Santa Cruz, CA, USA, diluted 1:300) was diluted in TSTM containing 0.1% sodium azide for 2–4 days at RT with gently agitation on a shaking platform. The secondary antibody (horseradish peroxidase [HRP]-conjugated goat anti-rabbit, BIORAD, diluted 1:200 in TSTM) was incubated overnight. After a final washing in TST, the embryos were pre-incubated with 0.25 mg/mL diaminobenzidinetetrahydrochloride (DAB, Sigma) in TST with 2.5 mg/mL nickel ammonium sulfate for 1 h, and then allowed to react with DAB in TST containing 2.5 mg/mL nickel ammonium sulfate and 0.00075% H2O2 for 20–40 min at RT. The reaction was stopped using Tris-HCl buffered saline and specimens were post-fixed with 4% PFA overnight at 4°C. Epidermis and mesodermic derivatives were carefully removed and specimens were rinsed in graded series of glycerol (25%, 50%, 75% and 100%) and observed under the stereomicroscope.
Controls and Specificity of the Antibodies
No immunostaining was detected when primary or secondary antibodies were omitted during incubations. The monoclonal anti-PCNA antibody specifically labels proliferating cells in the brain, retina and olfactory epithelium of this species (Rodríguez-Moldes et al., 2008; Ferrando et al., 2010; Ferreiro-Galve et al., 2010; Quintana-Urzainqui et al., 2014). The polyclonal anti-Shh antibody (Santa Cruz Biotechnology Inc., Santa Cruz, CA, USA) was raised in rabbit against the amino acids 41–200 of the human Shh protein. We previously reported that the in situ hybridization (ISH) results were similar to those obtained by IHC, and therefore validate the specificity of the anti-Shh antibody used here (Santos-Durán et al., 2015).
In Situ Hybridization on Sections and Whole Mounts
We applied in situ hybridization for ScOtp (Quintana-Urzainqui, 2013; Santos-Durán et al., 2015, 2016), ScDlx2 (Quintana-Urzainqui et al., 2012, 2015; Compagnucci et al., 2013; Debiais-Thibaud et al., 2013; Quintana-Urzainqui, 2013; Santos-Durán et al., 2015, 2016), ScDlx5 (Compagnucci et al., 2013; Debiais-Thibaud et al., 2013; Santos-Durán et al., 2015, 2016), ScNkx2.1 (Quintana-Urzainqui et al., 2012; Quintana-Urzainqui, 2013; Santos-Durán et al., 2015, 2016), ScLhx5 (Santos-Durán et al., 2016), ScEmx2 (Derobert et al., 2002), ScLmx1b (Pose-Méndez et al., 2016), ScPitx2 (Lagadec et al., 2015), ScPitx3a, ScFoxa1, ScFoxa2 and ScNeurog2 (Santos-Durán et al., 2016) genes. These probes were selected from a collection of S. canicula embryonic cDNA library (mixed stages S9–S22), constructed in pSPORT1, and submitted to high throughput EST sequencing. Selected cDNA fragments were cloned in pSPORT vectors. Sense and antisense digoxigenin-UTP-labeled and fluorescein-UTP-labeled probes were synthesized directly by in vitro transcription using as templates linearized recombinant plasmid DNA or cDNA fragments prepared by PCR amplification of the recombinant plasmids. In situ hybridization in whole mount and on cryostat sections was carried out following standard protocols (Coolen et al., 2009). Briefly, sections were permeabilized with proteinase K, hybridized with sense or antisense probes overnight at 65°C and incubated with the alkaline phosphatase-coupled anti-digoxigenin and anti-fluorescein antibody (1:2000, Roche Applied Science, Manheim, Germany) overnight at 4°C. The color reaction was performed in the presence of BM-Purple (Roche). Control sense probes did not produce any detectable signal.
Image Acquisition and Analysis
Light field images were obtained with an Olympus BX51 microscope equipped with an Olympus DP71 color digital camera. Photographs were adjusted for brightness and contrast and plates were prepared using Adobe Photoshop CS4 (Adobe, San Jose, CA, USA).
Results
ScNkx2.1 and ScDlx2/ScDlx5 Expression. Comparison With ScShh-Expression/Shh Immunoreactivity
An overview of the expression of ScShh, ScNkx2.1, ScOtp and ScDlx2/ScDlx5 in the basal hypothalamus of S. canicula, mainly in early stages of development, has been previously described in Santos-Durán et al. (2015). The location of the ABB was re-examined in Santos-Durán et al. (2016).
Here we revisited these data to deepen in the genoarchitectonic profile of the basal hypothalamus and further characterize possible dorso-ventral and rostro-caudal subdomains of this territory. A detailed comparative analysis of the expression of such genes in sagittal and transverse sections is presented from stages 29 to 32, when the basic mature cytoarchitecture and organization of the adult hypothalamus are clearly recognized.
ScShh-Expression/Shh Immunoreactivity
Since ScShh detection by means of ISH at early developmental stages yields similar results to those obtained by IHC against anti-Shh (Santos-Durán et al., 2015), here we have used the antibody to analyze additional developmental stages and to ease pattern comparisons by means of double ISH-IHC staining. As described in Santos-Durán et al. (2015); from stage 29 onwards, Shh immunoreactivity is observed in part of the rostral and dorsal Tu domain and broadly detected within the RM domain, extending from here along the diencephalic basal plate (see Figures 1A–F; see also Santos-Durán et al., 2015). Shh immunoreactivity is not observed in the SPa domain (Figures 1B,E; see also Santos-Durán et al., 2016) or in the midline (acroterminal territory) just dorsal to the developing adenohypophysis (black arrowhead in Figure 1E). Caudally, Shh immunoreactivity is only observed in a portion of the RM domain but not at its dorsal-most and ventral-most portions (Figure 1B and arrowhead in Figure 1F). At stage 30, Shh immunoreactivity is still detected in the hypothalamus and primary prosencephalon (arrowheads in Figure 1G; see also Santos-Durán et al., 2015) but it becomes reduced in the RM and basal plate of p3 (p3Tg) compared to previous stages.
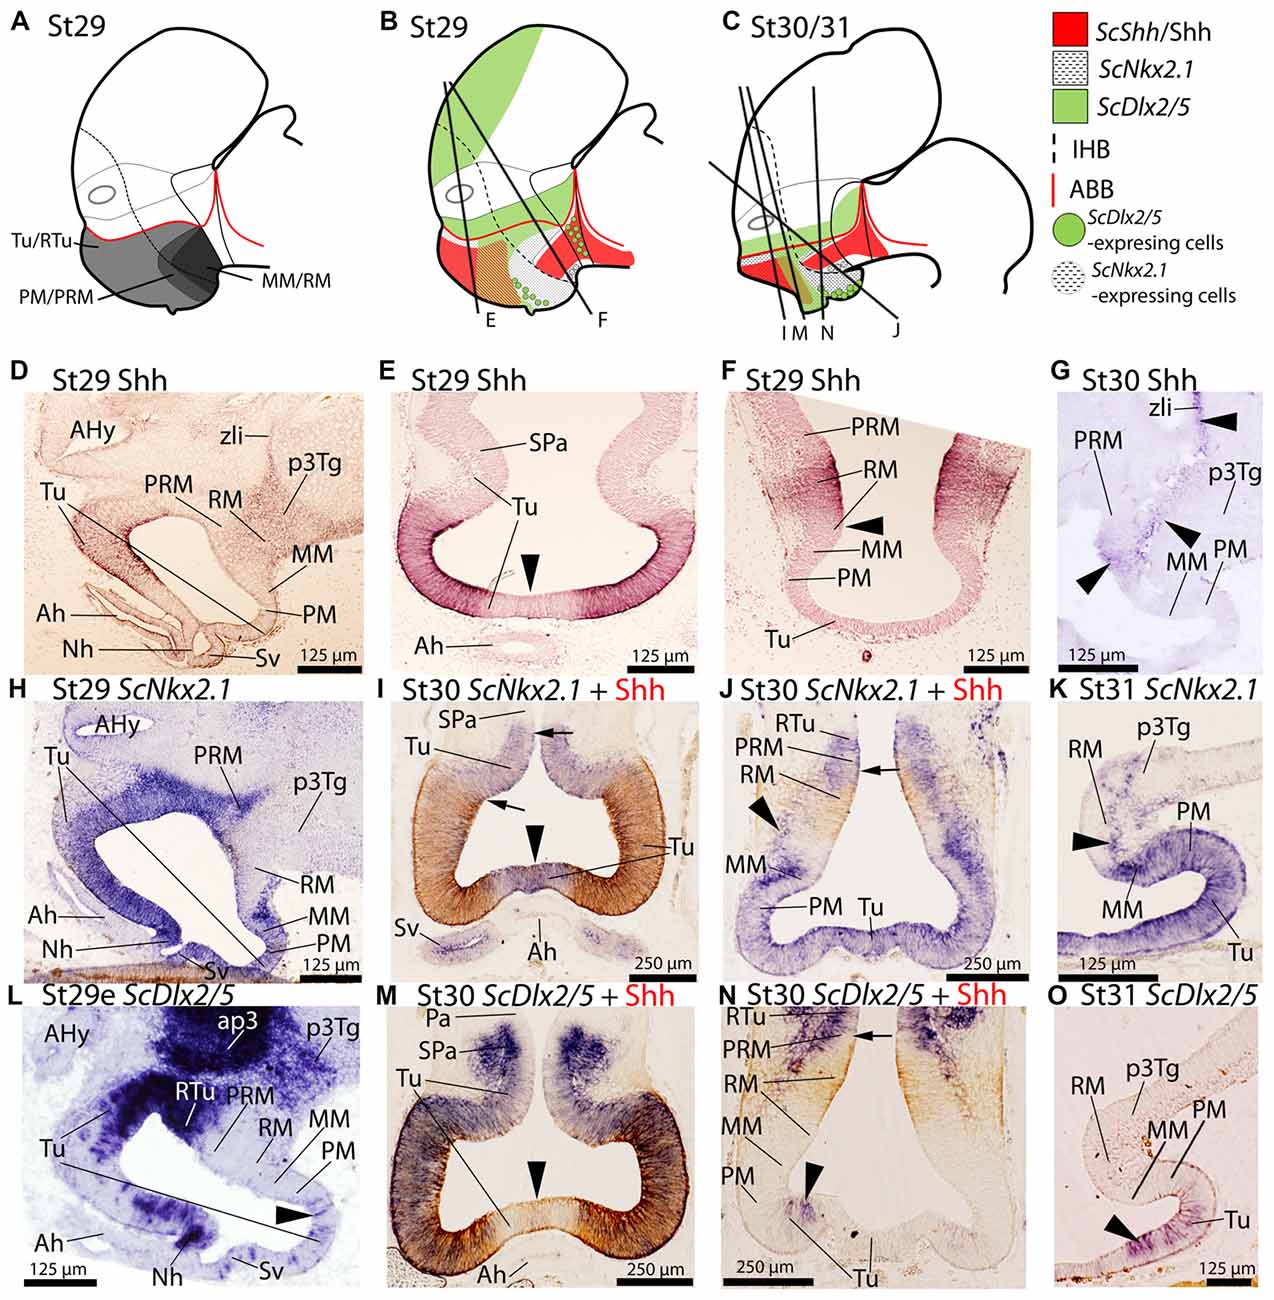
Figure 1. Regionalization of the basal hypothalamus and neighbor territories in embryos of S. canicula at stages 29–31. Sagittal schemes (A–C) and sections showing immunoreactivity to Shh (D–G), and expression of ScNkx2.1 (H–K), and ScDlx2/5 (L–O) by means of immunohistochemistry (IHC) (D–G), and in situ hybridization (H–O) on sagittal (D,G,H,K,L,O) or transverse (E,F,I,J,M,N) sections. Some in situ sections were double labeled for IHC against Shh (I,J,M,N). (A–C) Schemes of basal hypothalamus compartments at parasagittal levels at stage 29 and stage 30/31. For simplicity, the schemes do not represent medial (acroterminal) expression patterns. (A) Shark basal hypothalamic compartments at stage 29 as defined in Santos-Durán et al. (2015). (B,C) Expression patterns of ScShh/Shh, ScNkx2.1 and ScDlx2/5 at stage 29 and 30/31. (D–G) Shh immunoreactivity in the Tu and RM. Note also the continuity of labeling along the p3Tg and the zona limitans intrathalamica (zli). Black arrowhead in (E) points the lack of labeling in the acroterminal region. Arrowhead in (F) marks the absence of Shh immunoreactivity in the ventral-most portion of RM. Arrowheads in (G) show weak Shh immunoreactivity in RM, p3Tg and zli at stage 30. (H–K) ScNkx2.1 expression is observed in the different territories of the basal hypothalamus excepting the RM. Black arrowhead in (I) points the acroterminal region showing ScNkx2.1 expression and absence of Shh immunoreactivity. Arrows in (I) point differences between the pattern of distribution of Shh immunoreactivity and ScNkx2.1 expression. Arrowheads in (J,K) point ScNkx2.1-expressing cells in the RM mantle. Arrow in (J) points dorsal-most distribution of Shh immunoreactivity. (L–O) ScDlx2/5 expression in restricted regions of the Tu/RTu. Note also intense labeling in ap3. Arrowheads in (L,N,O) indicate dispersed ScDlx2/5-expressing cells in the caudo-ventral part of Tu. Arrowhead in (M) marks the acroterminal region lacking ScDlx2/5 expression and Shh immunoreactivity. For abbreviations, see list.
ScNkx2.1 Expression
From stage 29 onwards, ScNkx2.1 is expressed ventral to the optic stalk through the whole basal hypothalamus except in the RM compartment (see Figures 1A–C,H–K). While ScNkx2.1 expression and Shh immunoreactivity co-distribute in part of the Tu domain (Figures 1C,I), Shh immunoreactivity does not match the dorsal border of ScNkx2.1 expression (black arrows in Figure 1I). In contrast to Shh, ScNkx2.1 is additionally expressed in the acroterminal territory dorsal to the adenohypophysis (arrowhead in Figure 1I). ScNkx2.1 expression in the MM abuts the RM, but it does not meet Shh immunoreactivity since Shh is absent from the ventral-most portion of RM, which creates a gap between both (Figures 1C,J; see also Santos-Durán et al., 2015). Of note, ScNkx2.1 expression in the ventricular zone forms a clear-cut border between the positive MM and the negative RM domain that is more evident on sagittal sections (Figure 1K), though ScNkx2.1-expressing cells can be detected in the mantle of the RM domain (black arrowhead in Figures 1J,K).
ScDlx2/ScDlx5 Expression
In the basal plate ScDlx2/5 is intensely expressed in a restricted subdomain of the Tu/RTu and the p3Tg domains (Figure 1L). In the hypothalamus, it is expressed in a subdomain spreading from the RTu to the neurohypophysis (Figures 1L–N). Rostrally, ScDlx2/5 expression in the basal hypothalamus co-distributes with Shh immunoreactivity in a subdomain of the Tu (Figures 1C,M). Note that neither ScDlx2/5 expression nor Shh immunoreactivity can be observed in the acroterminal territory co-extensive with the adenohypophysis (arrowhead in Figure 1M) but it is expressed in the neurohypophysis (Figure 1L). ScDlx2/5 expression in the caudal-most RTu almost abuts Shh immunoreactivity in the RM although a gap exists (Figure 1C; arrow in Figure 1N). In the most caudo-ventral part of Tu, individual and dispersed ScDlx2/5-expressing cells can be recognized almost reaching the rostral and ventral-most part of the PM (arrowheads in Figures 1L,N) including the primordium of the saccus vasculosus. These cells are less intensely labeled but still observable at stage 31 (arrowhead in Figure 1O). At stage 32 the basic pattern described for ScDlx2/5 is maintained although its expression becomes reduced in intensity (see below).
ScLhx5 and ScOtp Expression
ScLhx5 Expression
From stage 29 onwards, in the basal plate, ScLhx5 is observed in a subdomain of the dorsal-most and rostral-most Tu domain (Figures 2A,B,I,J). Dispersed ScLhx5-expressing cells are also observed in the most caudo-ventral part of Tu where individual and dispersed ScDlx2/5-expressing cells were observed (compare Figure 2D with Figure 1O). ScLhx5 expression can also be observed in the PM/PRM and MM domains (Figures 2A–D,I,J). Note that ScLhx5 expression in the MM domain describes a clear-cut border with the RM domain (Figure 2D), though ScLhx5-expressing cells can be recognized in the mantle of the RM domain (arrowheads in Figures 2C,D).
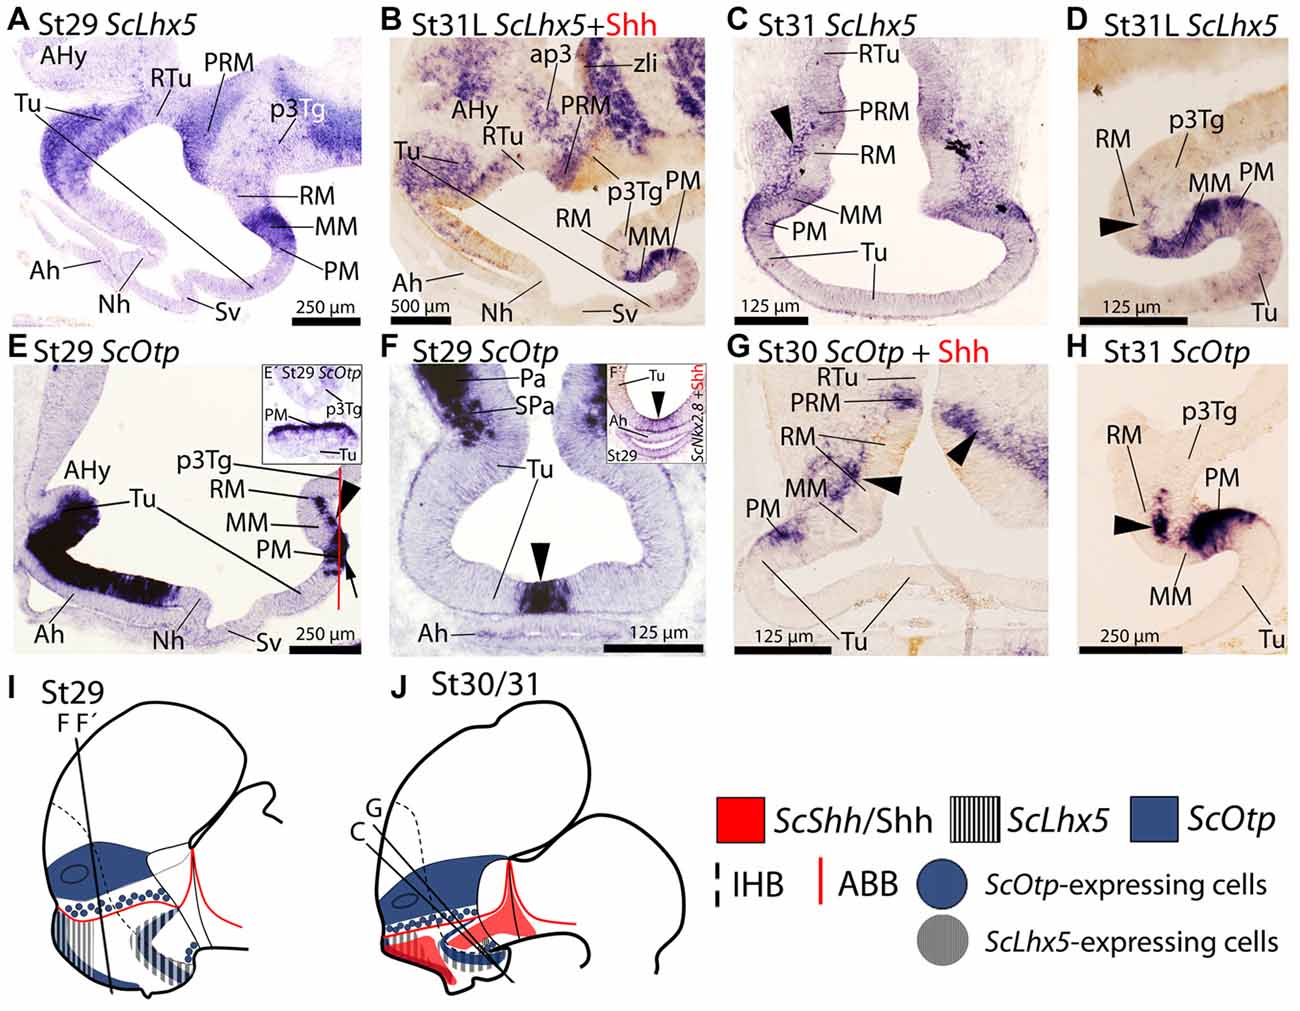
Figure 2. Regionalization of the basal hypothalamus and neighbor territories in embryos of S. canicula at stages 29–31. Sections showing expression of ScLhx5 (A–D) ScOtp (E–H) by means of in situ hybridization (A–H) on sagittal (A,B,D,E,H) or transverse (C,F,G) sections. (I,J) Sagittal schemes to show expression patterns of ScShh/Shh, ScLhx5 and ScOtp at stage 29 (I) and stage 30/31 (J). For simplicity, the schemes do not represent medial (acroterminal) expression patterns. Some in situ sections were double labeled for IHC against Shh (B,G). (A–D) ScLhx5 expression in the Tu, PM/PRM and MM domains. Arrowhead in (C) points ScLhx5-expressing cells in the mantle of the RM domain. Arrowhead in (D) shows a sharp limit abutting RM. Note that dispersed ScLhx5 expressing cells in the caudal and ventral-most part of Tu are not represented in (I,J). (E–H) ScOtp expression in regions of the Tu and PM/PRM domains. Inset (E′) shows a transverse section at the level indicated by the red line in (E). Arrowhead in (F) points the restricted ScOtp expression in the midline of the acroterminal region. Arrowhead in (F′) points ScNkx2.8 expression. Arrowheads in (E,G,H) indicate ScOtp-expressing cells in the mantle of the RM region lacking Shh immunoreactivity. For abbreviations, see list.
ScOtp Expression
In the basal plate, ScOtp has been identified in Tu and PM/PRM domains (Santos-Durán et al., 2015). From stage 29 onwards ScOtp is expressed in the rostral-most part of the Tu domain, from the optic stalk to the primordial neurohypophysis (Figure 2E). Specifically, it is restricted to the acroterminal territory of the Tu domain just dorsal to the adenohypophysis (Figures 2E,I; arrowhead in Figure 2F) codistributing with ScNkx2.8 (arrowhead in Figure 2F′). In the PRM domain, ScOtp expression abuts the RM but not the Shh immunoreactivity of this domain (Figures 2G,J). In the PM, ScOtp is also expressed in the acroterminal territory (Figure 2E′). Note that the expression of ScOtp in the PM faces the MM (Figure 2H). Marginal ScOtp-expressing cells can be recognized in the RM (black arrowheads in Figures 2G,H) and p3Tg (not shown). This pattern is maintained until stage 32.
ScEmx2 Expression
The expression of ScEmx2 has been analyzed by Derobert et al. (2002) in the brain and related tissues from early stages of development (stage 19) until mid-gestation stages (stages 28–30). Here we analyze in detail the expression of ScEmx2 in the basal hypothalamus from stage 29 until stage 31. From stage 29 onwards, ScEmx2 is expressed in the basal hypothalamus in a well-defined domain spreading into part of rostral and ventral-most Tu domain, the PM/PRM and the MM domains (Figures 3A–D). Of note, its expression lacks in midline domains of the Tu (acroterminal territory) such as the neurohypophysis (Figure 3A) and saccus vasculosus (Figure 3B) but is present immediately caudal to the last (Figures 3C,D).
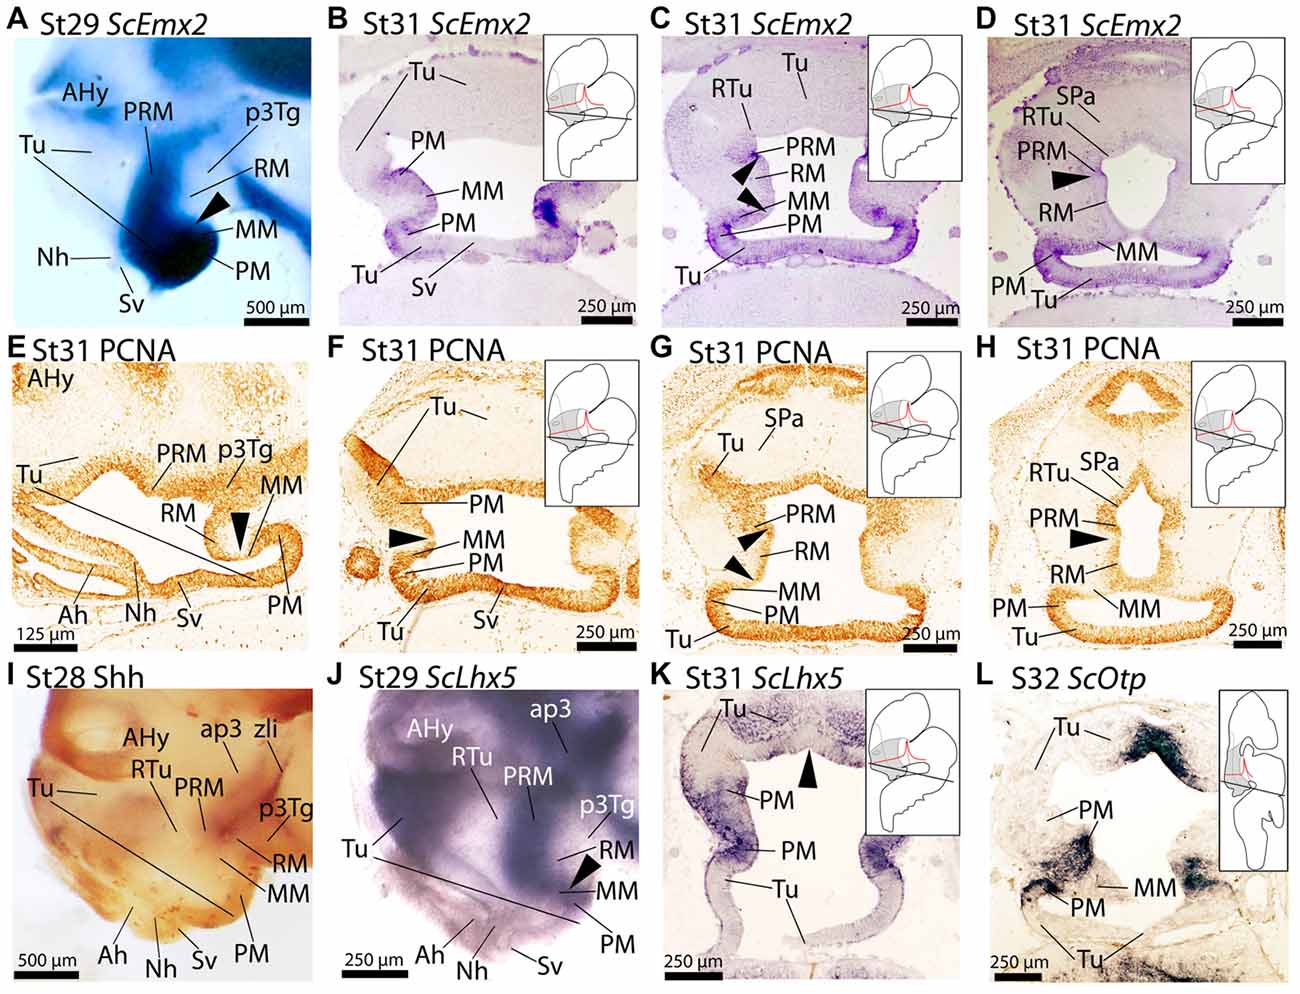
Figure 3. Regionalization of the basal hypothalamus and neighbor territories in embryos of S. canicula at stages 29–32 based on the expression of ScEmx2 (A–D), ScLhx5 (J,K), ScOtp (L) and immunoreactivity to proliferating cell nuclear antigen (PCNA) (E–H) and Shh (I) on whole mounts (A,I,J) and in sagittal (E) and transverse (B–D,F–H,K,L) sections. (A–D) ScEmx2 expression through the caudo-ventral Tu, PM/PRM and MM domains. Note the absence of expression in the RM domain and in the rostral part of the acroterminal territory. (A) Lateral view of a whole mount. Arrowhead marks the caudal border of the ScEmx2 expression in the MM. Note the sharp limit with the negative RM domain. (B–D) Sequence of sections from ventral (B) to dorsal (D) levels of the basal hypothalamus. Arrowheads in (C) mark how the ScEmx2 expression in the MM and PRM borders the negative territory of the RM. Arrowhead in (D) points the caudal border of ScEmx2 expression in the PRM. (E–H) PCNA immunoreactivity in sections at equivalent levels to those showed in (A–D). Arrowheads indicate discontinuities in PCNA immunoreactivity. Discontinuities match ScEmx2 expression borders. (I) Lateral view of a whole mount embryo stained for Shh immunoreactivity to show the complementary pattern to that of ScEmx2. (J,K) Lateral view of a whole mount embryo (J) and transverse section (K) showing that the caudal domain of ScLhx5 (corresponding to PM/PRM and MM) codistributes with ScEmx2 (compare J with A and K with C). (L) ScOtp expression in restricted territories of PM/PRM and MM domains. Compare with expressions of ScLhx5 in (K) and ScEmx2 in (C) to notice that different subdomains can be identified in PM/PRM and MM comparing the expression of these three genes. For abbreviations, see list.
A comparison of ScEmx2 expression with other genes reveals several correlations. We compared ScEmx2 expression patterns with the presence of PCNA-immunoreactive (-ir) cells (Figures 3E–H). PCNA-ir cells define proliferative zones that are separated by non-proliferative (PCNA-immunonegative) ventricular regions, which are believed to define important segmental boundaries (reviewed in Candal et al., 2005). Of note, the caudal border of ScEmx2 expression in the MM domain (arrowheads in Figures 3A,E) correlates with a domain of reduced PCNA immunoreactivity in the ventricular zone (arrowheads in Figures 3E–G). The caudal border of ScEmx2 expression in the PRM domain also correspond with a domain of restricted PCNA immunoreactivity (compare arrowheads in Figures 3D,H). Thus, a band of reduced or negative proliferation seems to spread from the rostral and dorsal border of the RM (Figures 3F–H), p3Tg and zona limitans intrathalamica (zli; not shown).
Finally, we compared ScEmx2 expression with that of other genes usually expressed in the basal hypothalamus to better understand its organization. A comparison with Shh immunoreactivity (Figure 3I) revealed that the ScEmx2-expressing domain in the PRM is fairly complementary to Shh in the RM domain (compare Figures 3A,I). Besides, this ScEmx2-expressing domain includes the caudal domain expressing ScLhx5 in the PM/PRM and MM (compare Figures 3A,J) and ScOtp in the PM/PRM (compare Figures 3B,L). Of note, ScEmx2, ScLhx5 and ScOtp define consecutively more restricted domains (compare Figures 3B,K,L). Moreover, the expression of ScEmx2 abuts that of ScDlx2/5 in dorsal and caudal positions (RTu domain) while they co-distribute in more rostral and ventral positions (not shown).
ScLmx1b, ScPitx2, ScPitx3a, ScFoxa1, ScFoxa2 and ScNeurog2 as Markers of the RM
ScFoxa1 and ScFoxa2 are expressed in fairly the same spatial and temporal patters in the regions and stages considered in this study and thus are conjointly referred as ScFoxa1/2.
At stage 29 ScLmx1b, ScPitx2, ScPitx3a, ScFoxa1/2 and ScNeurog2 are expressed in a similar pattern spreading caudally from RM into the diencephalon including the zli in the case of ScPitx2, ScPitx3a, ScFoxa1/2 and ScNeurog2 (Figures 4A–D,B′,C′,O). On transverse sections the expression of these genes dorsally abuts the PRM (Figures 4E–H,F′). Rostrally these genes also abut the MM (arrowheads in Figures 4E–H). From stage 29 onwards this general pattern persists although some differences emerge. At stage 31, ScLmx1b becomes downregulated being restricted to the floor plate (Figure 4I) while Shh immunoreactivity is still found in the basal plate (arrowheads in Figure 4I). At stage 31 ScPitx2 (Figure 4J) is still expressed in the pattern observed at stage 29, while ScPitx3a is restrictedly expressed in the caudal-most diencephalon (not shown). In the case of ScFoxa1/2, there is slight dorsal and ventral downregulation but the main pattern persists through RM and diencephalon (Figure 4K). From stage 30 onwards, ScNeurog2 becomes downregulated in the mentioned territories although it can be recognized in the zli and habenulae (data not shown). Finally, ScLmx1b, ScPitx2 and ScFoxa1/2 still present a sharp border of expression that abuts the MM domain at this developmental stage (arrowheads in Figures 4L–N).
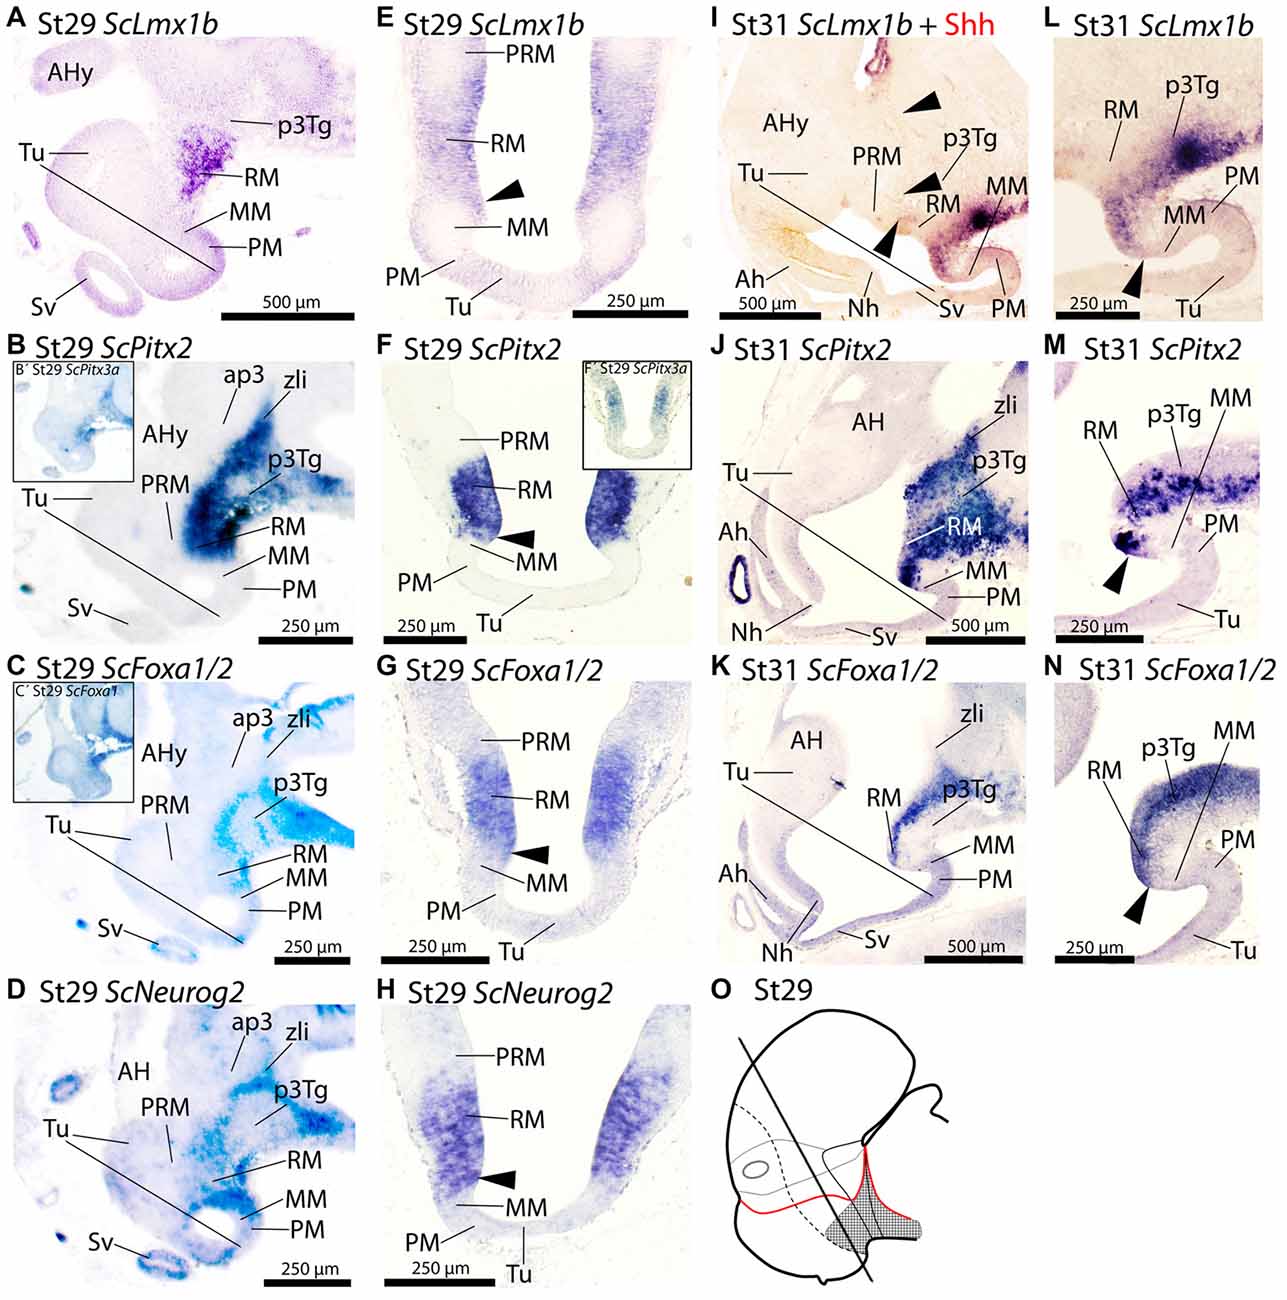
Figure 4. Regionalization of the basal hypothalamus and neighbor territories in embryos of S. canicula at stages 29–31 based on the expression of ScLmx1b (A,E,I,L), ScPitx2 (B,F,J,M), ScPitx3a (B′,F′), ScFoxa1/2 (C,C′,G,K,N) and ScNeurog2 (D,H) in sagittal (A–D,I–N) and transverse (E–H) sections. The level of transverse sections is indicated in the scheme (O). For simplicity, the schemes do not represent medial (acroterminal) expression patterns. Some in situ sections were double labeled for IHC against Shh (I). (A–D) Equivalent sagittal sections of embryos at stage 29 showing the similar pattern of expression of ScLmx1b, ScPitx2, ScFoxa1/2 and ScNeurog2. Insets (B′) and (C′) show similar results when using ScPitx3a and ScFoxa1 probes. (E–H) Transverse equivalent sections showing that, in any case, the expression of ScLmx1b, ScPitx2a, ScFoxa1/2 and ScNeurog2 is restricted to the RM. Arrowheads points the sharp limit where the expression of these genes is abutting the negative MM. Inset (F′) show that ScPitx3a expression is similar to that of ScPitx2 shown in (F). (I–N) Panoramic views (I–K) and details (L–N) of sagittal sections to show similar patterns of expression of ScLmx1b, ScPitx2a and ScFoxa1/2 in the RM. Arrowheads in (I) point immunoreactivity to Shh in the RM and zli. Arrowheads in (L–N) point the region where the expression of such genes abuts the negative MM. For abbreviations, see list.
Discussion
In a previous work, we identified the shark basal hypothalamus harboring three domains (Tu/RTu, PRM/PM and MM/RM) based on the basal expression of ScNkx2.1, ScShh, ScOtp and ScDlx2/5 (Santos-Durán et al., 2015). In the present work we revisit such analysis on the light of ScLhx5, ScEmx2, ScLmx1b, ScPitx2, ScPitx3a, ScFoxa1, ScFoxa2 and ScNeurog2 expression, besides Shh and PCNA immunoreactivity. Different subdomains were identified within the aforementioned domains and within the basal acroterminal region, the basal rostral-most neural tube (Figures 5, 6; Table 1). These genes present a robust and conserved expression across vertebrates. However, their roles and functions are still poorly understood and their expressions do not necessarily define domains per se. Therefore, caution has to be borne in mind during the following analysis.
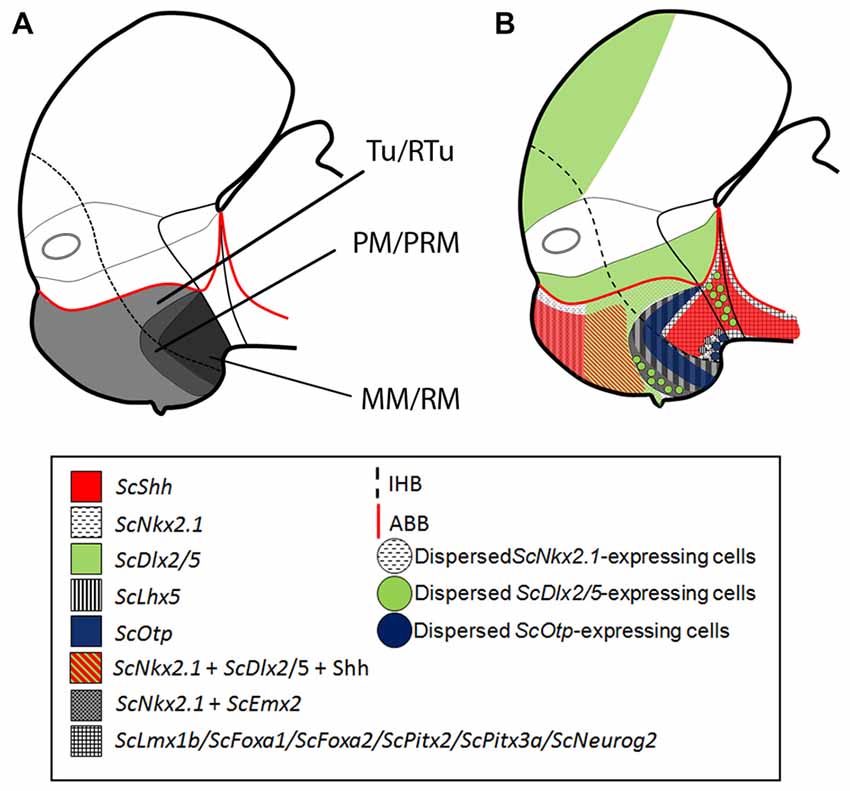
Figure 5. Schematic representation of the catshark basal hypothalamus at mid development. For simplicity, the schemes do not represent medial (acroterminal) expression patterns. (A) Representation of prosomeric histogenetic domains Tu/RTu, PM/PRM, MM/RM based on Santos-Durán et al. (2015). (B) Genoarchitectonic organization based on current data. Different microzones are recognized into main histogenetic domains. For abbreviations, see list.
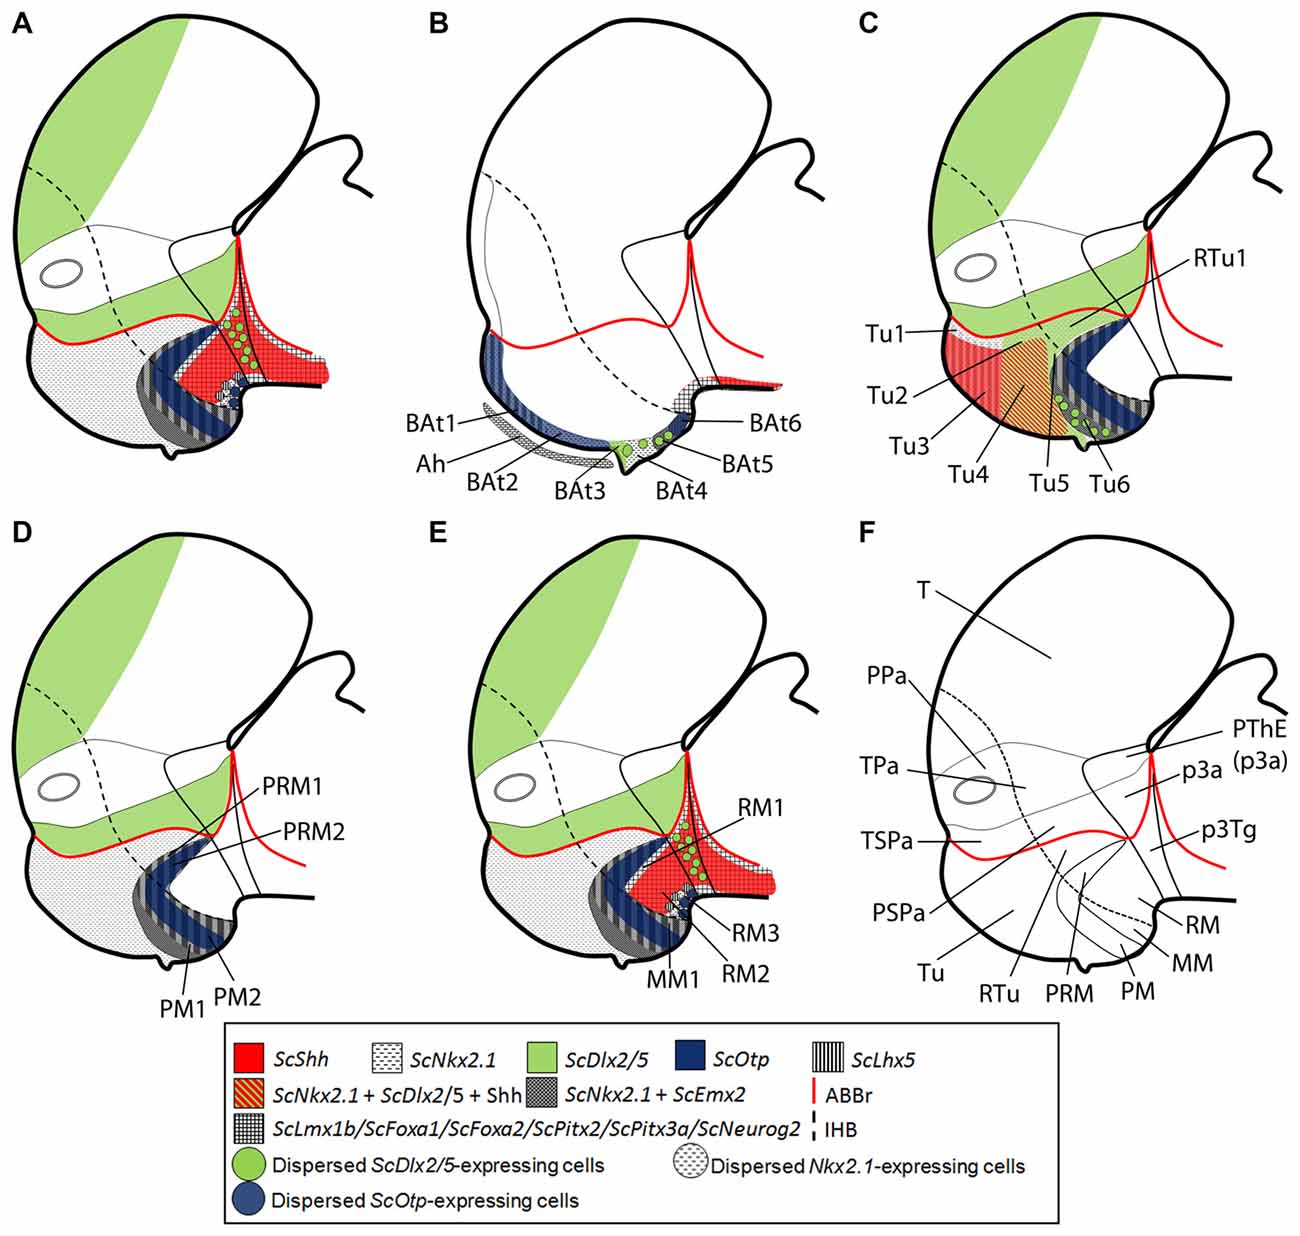
Figure 6. Schematic representation of the catshark basal hypothalamus genoarchitecture. All schemes represent parasagittal sections except (B) that represents a medial sagittal section. (A) Global organization of catshark hypothalamus. (B) Basal acroterminal (BAt) territory and corresponding microzones. The expression of ScNkx2.1, ScOtp, ScLhx5, ScDlx2/5 and ScEmx2 defines six microzones (BAt1–6). BAt1–2 are coextensive with adenohypophysis suggesting a signaling influence. BAt3 corresponds to neurohypophysis. BAt4 give rise to saccus vasculosus. BAt5–6 are involved in posterior recess organ development. (C) Tu/RTu subdomains and microzones. In this territory ScNkx2.1 is expressed alone or in combination with ScLhx5, ScDlx2/5, ScEmx2 and Shh immunoreactivity. Seven microzones are identified (Tu1–6 and RTu1). Dispersed ScLhx5-expressing cells in Tu6 are not represented. (D) PM/PRM subdomains and neighbor territories where ScNkx2.1 co-distributes with ScEmx2. The expression of ScNkx2.1, ScEmx2, ScLhx5 and ScOtp define four subdomains (PM1–2, PRM1–2). (E) MM/RM subdomains and microzones. The mamillar subdomain where ScNkx2.1, ScLhx5 and ScEmx2 are expressed is represented by MM1. These markers and those expressed in PRM2 define a clear-cut border with ScLmx1b, ScPtix2, ScPtix3a, ScFoxa1/2 and ScNeurog2 expression and Shh immunoreactivity in the RM. Their expression is dynamic but three microdomains can be sketched within the RM (RM1–3). Note that almost all genes expressed in the RM are continuously detected into the basal plate of the diencephalon and also in the zli forming a clear-cut border with those rostrally expressed. (F) Representation of main territories in the hypothalamus and rostral diencephalon. For abbreviations, see list.
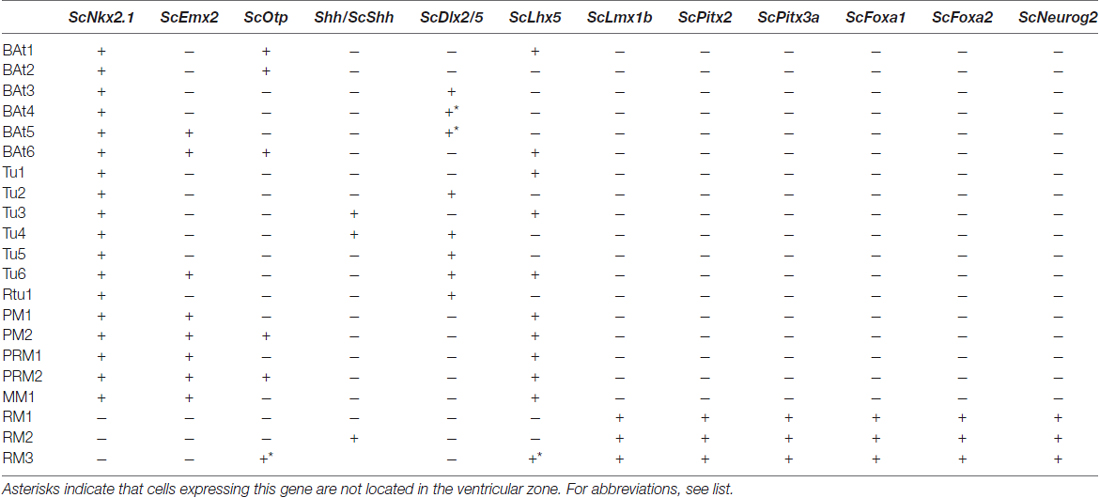
Table 1. Microzone histogenetic codes of the shark basal hypothalamus corresponding to schemes in Figure 6.
Basal Acroterminal Domains
The acroterminal domain involves the alar and basal plate spreading from the rostral-most roof plate to the rostral-most floor plate. It has been suggested that specialized structures like the lamina terminalis, the optic chiasm and the neurohypophysis emerge here under particular signaling events (Puelles et al., 2012; Puelles and Rubenstein, 2015). We have identified at least 6 subdomains inside the basal acroterminal region named 1–6 from dorsal to ventral (BAt1–6; Figure 6B). Noteworthy the acroterminal territory (medial) is easily distinguishable from the remaining hypothalamus (lateral) due to genes differentially expressed at these locations (compare Figures 6A,B).
The two dorsal-most domains (BAt1–2) are positive for ScNkx2.1 (Figure 1I) and ScOtp (Figure 2F) but only BAt1 shows expression of ScLhx5 (Figure 3J). Furthermore, ScOtp co-distributes with ScNkx2.8 (Figures 2F,F′). BAt1–2 subdomains are negative for other genes broadly expressed in the Tu such as ScDlx2/5 and Shh (compare Figure 1M with Figure 2F). Of note, at later stages ScLhx5 is absent from the midline (arrowhead in Figure 3K). Noteworthy, BAt1–2 are almost co-extensive with the developing adenohypophysis (Figures 1I, 6B), which in part is co-extensive with negative subdomains for ScDlx2/5-expression and Shh immunoreactivity (Figure 1M). Of note, these gaps are as wide as the adenohypophysis, which has been noted in other vertebrates even for different adenohypophysis sizes (see Figure 2N in Manning et al., 2006), suggesting a role for the adenohypophysis in the local patterning of the hypothalamus. In shark, both the gaps of ScDlx2/5-expression and Shh immunoreactivity and the expression of ScNkx2.8 are wider than the medio-lateral extension of ScOtp-expression (Figures 2F,F′), which suggests the existence of additional medio-lateral subdomains.
BAt3 (the acroterminal region at the level of the neurohypophysis) is also Shh immunonegative and also expresses ScNkx2.1 (Figures 1H,I), but differently from BAt1–2, it expresses ScDlx2/5 (Figures 1L, 6B).
Ventrally to BAt3, we identified BAt4 as a subdomain that corresponds to the primourdium of the saccus vasculosus (Figure 6B; see also Van de Kamer and Shuurmans, 1953; Sueiro et al., 2007). The initial tiny domain expands becoming morphologically distinguishable (stage 29, Figures 1H, 2E; stage 30, Figure 1I). This domain is characterized by the expression of ScNkx2.1 and dispersed ScDlx2/5-expressing cells (Figure 1L). Since ScDlx2/5 is involved in the development of a GABAergic phenotype (Anderson et al., 1999), its expression in the saccus vasculosus could explain the existence of GABAergic cells at this point (Sueiro et al., 2007). Besides, GFAP-immunoreactivity has been described to be restricted to BAt4 (the developing saccus vasculosus), and it is not observable in more caudal subdomains (Sueiro et al., 2007). Finally, BAt4 is also characterized by lack of ScEmx2 (Figure 3B) which, however, is present in more caudal acroterminal subdomains (Figures 3C,D; see also BAt5 in Figure 6B) and in lateral (non-acroterminal) domains (Figures 6A,D). Noteworthy, in S. canicula, the tip of the notochord has been described to reach the primordium of the saccus vasculosus (BAt4; Figure 1 in Van de Kamer and Shuurmans, 1953) suggesting a causal relationship to saccus vasculosus development.
BAt4 shares ScNkx2.1 expression and dispersed ScDlx2/5-expressing cells with the domain ventral to it (BAt5; Figure 6B). However, as commented above, BAt5 differentially presents a lack GFAP-immunoreactivity and the presence of ScEmx2 expression (Figures 3C,D; see also Figure 6B) at late stages of development.
The ventral-most acroterminal domain is BAt6 which express ScNkx2.1, ScEmx2, ScOtp and ScLhx5, but not ScDlx2/5 (see Figure 6B). However, we cannot discard that this territory could be interpreted as the floor plate of the MM (Figure 6D) that in mouse (but not in shark; compare Figures 7E,F) differentially expresses Shh (see Figure 8.9B in Puelles et al., 2012).
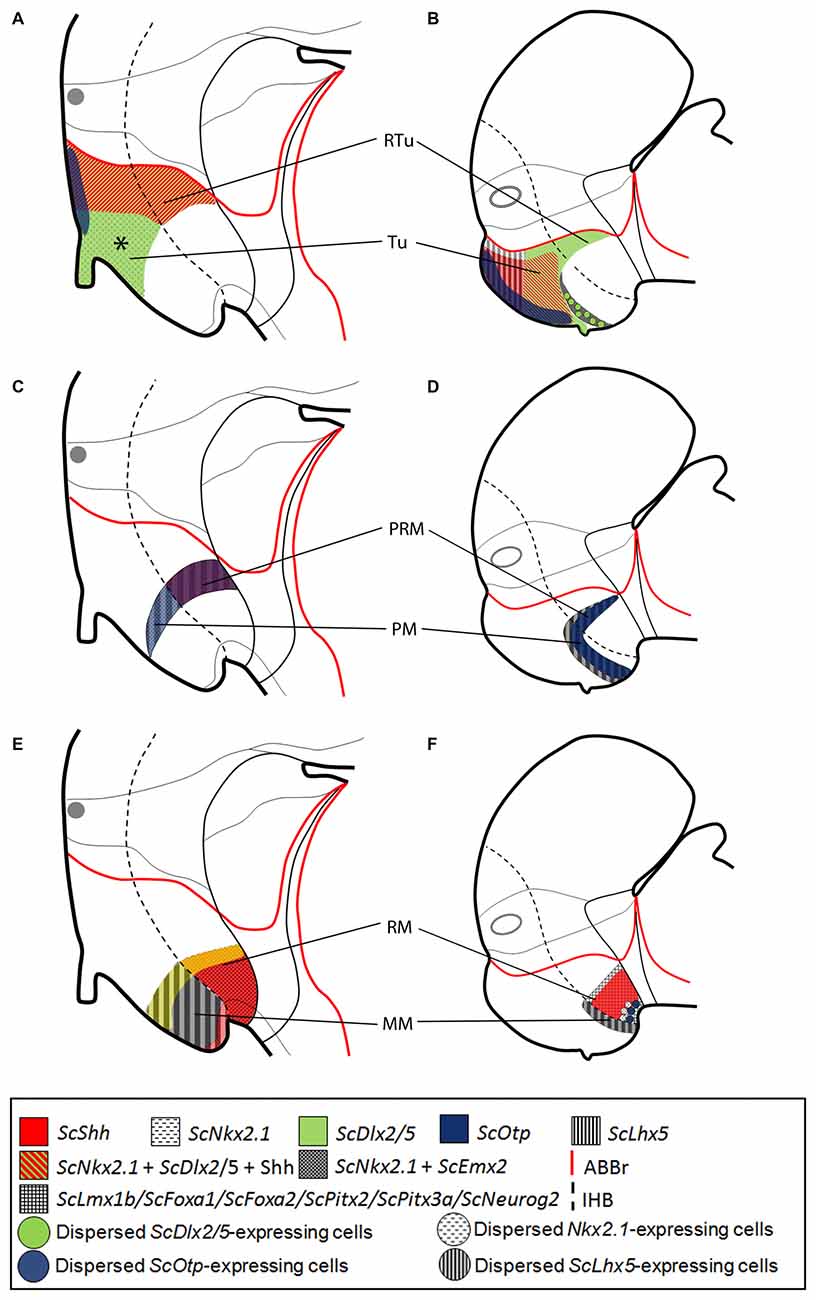
Figure 7. Comparative representations of microzones defined in mammals at E13.5 (A,C,E) and chondrichthyans at stage 29 (B,D,F) by sets of ortholog genes. Comparisons consider genes expressed in prosomeric histogenetic domains (A,B, Tu/RTu; C,D, PM/PRM; E,F, MM/RM). For simplicity schemes represent markers as in parasagittal sections but not in medial sagittal sections. (A,B) Nkx2.1, Dlx2/5, Otp, ScShh/Shh and Lhx5 expression in the Tu/RTu. Though similar genes are expressed they define different microzones. In mammals Lhx5 becomes dowregulated in the Tu/RTu. In the shark Emx2 is also expressed in part of the Tu. (C,D) Nkx2.1, Otp and Lhx5 are commonly expressed in the PM/PRM. Again, they define different subdomains. Shh is expressed in the PRM of mammals. Emx2 is expressed in the whole PM/PRM. (E,F) Nkx2.1, Emx2, Shh, Lmx1b, Foxa1, Foxa2, Pitx2, Pitx3 and Neurog2 are expressed in MM/RM. They define different territories though a border between MM and RM seems to exist being more evident in chondrichthyans than in mammals. Data was obtained from the Allen Developing Mouse Brain Atlas (http://www.developingmouse.brain-map.com/) and the literature: Shh, Nkx2.1, Dlx5, Otp (Morales-Delgado et al., 2011, 2014; Puelles et al., 2012), Lhx5 (Szabó et al., 2009; Abellán et al., 2010; Puelles et al., 2012), Emx2 (Shimamura et al., 1995; Suda et al., 2001; Szabó et al., 2009), Lmx1b (Asbreuk et al., 2002; Martínez-Ferre and Martínez, 2012; Puelles et al., 2012), Pitx2 (Martin et al., 2004; Puelles et al., 2012), Foxa1 (Diez-Roux et al., 2011; Martínez-Ferre and Martínez, 2012; Puelles et al., 2012), Foxa2 and Neurog2 (Osório et al., 2010; Puelles et al., 2012). For abbreviations, see list.
Tuberal (Tu/RTu) Subdomains
The dorsal and rostral-most domain is Tu1 and expresses genes like ScNkx2.1 and ScLhx5 (Figures 1H, 2A, 6C). Caudally to it, we have distinguished a similar domain lacking ScLhx5 but expressing ScDlx2/5, named as Tu2 (compare 1L and Figure 2A; see Figure 6C). These two subdomains belong to the subliminal part of the basal hypothalamus and so, they lack ScShh (compare Figures 2I,J; see Figure 6C) and they express ScNkx2.8 and ScLhx9 (see Figure 5B in Santos-Durán et al., 2016). More ventrally, two subdomains, Tu3 and Tu4, appear as the ventral extension of Tu1 and Tu2 respectively, since they share with them either ScLhx5 or ScDlx2/5 expression. However, they additionally express ScShh (Figure 6C) but lack ScNkx2.8 and ScLhx9 expression (see Figure 5B in Santos-Durán et al., 2016). The expression of ScLhx5 in the Tu1/Tu3 appears complementary to that of ScDlx2/5 in Tu2/Tu4 (compare Figure 1L with Figure 2A; see Figure 6C). Complementary patterns between Dlx and Lhx5 have been previously described in the mouse forebrain (Sheng et al., 1997), which suggests a conserved inhibitory relationship between both genes. Moreover, a small domain ventral (and caudal) to Tu4, which expressed ScNkx2.1 and ScDlx2/5 but was negative to Shh immunoreactivity, was referred as Tu5 (Figure 6C). A more ventral subdomain, referred as Tu6 is characterized by the expression of ScEmx2 and a dispersed distribution of ScDlx2/5- and ScLhx5-expressing cells (compare Figure 1L with Figures 2D and Figure 3A; see also 6C).The dorsal and caudal-most subdomain identified is RTu1 (Figure 6C), which expresses the same genes as Tu2 and Tu5 (ScNkx2.1, ScDlx2/5; see Figure 6C).
Perimamillar (PM/PRM) Subdomains
Ventral to Tu6, we identified PM1 a domain where ScNkx2.1/ScEmx2/ScLhx5 are co-expressed (compare Figures 1K, 3C,K; see Figure 6D). We term PM2 (PM-like in Santos-Durán et al., 2015) the subdomain expressing ScNkx2.1/ScEmx2/ScLhx5/ScOtp (compare Figures 1K, 3C,K,L; see Figure 6D). The caudal continuation of PM1 and PM2 are referred as PRM1 and PRM2 (PRM-like in Santos-Durán et al., 2015) and express the same genes (Figure 6D).
Mamillar (MM/RM) Subdomains
MM1 (MM-like in Santos-Durán et al., 2015) expresses ScNkx2.1/ScEmx2/ScLhx5 (Figures 1K, 2D, 3A) but not ScOtp (Figures 2H, 6D). Of note, the genes expressed in the MM1 show a clear-cut border with those expressed in the RM domain (RM-like in Santos-Durán et al., 2015; see Figures 6D,E).
We have identified three dorso-ventral subdomains in the ventral and caudal-most point of the basal hypothalamus here referred as RM1, RM2 and RM3 (Figure 6E), which together fairly correspond to the previously defined RM-like territory (Santos-Durán et al., 2015; see also Figure 5). The dorsal-most domain, RM1, may be defined based on lack of Shh immunoreactivity at stage 29 (as does not reaches the ABB; see Santos-Durán et al., 2016) and the expression of ScLmx1b/ScPitx2/ScPitx3a/ScFoxa1/ScFoxa2/ScNeurog2 (compare Figure 1A with Figures 3A–D; see Figure 6E). In the RM2, these genes co-distribute with Shh immunoreactivity while the ventral-most domain, RM3, is again characterized by the lack of Shh immunoreactivity (compare Figure 1F with Figures 1E–H; see Figure 6E). Of note, from stage 30 onwards, ScPitx2 is expressed in the whole RM (Figures 4J,M) but the downregulation of other genes suggest the existence of even more dorso-ventral subdomains. Finally, RM3 also presents ScLhx5- and ScOtp-expressing cells likely born in neighbor domains (Figures 2D,H, 6E; Table 1).
Evo-Devo Considerations Concerning the Basal Hypothalamus
The prosomeric model offers a key tool to study homologies and brain evolution (Puelles and Rubenstein, 2003, 2015). Counterparts of the genes here considered have been also studied in other vertebrates. Nevertheless, the lack of detailed data in prosomeric terms makes difficult to perform comparisons with most groups, except for mammals, at the level of microdomains. Below, detailed comparisons are made with mammals and we assume they are mostly transferable to other amniotes (Figure 7) due to the similarity of several patterns observed between mice and birds (Manning et al., 2006; Bardet et al., 2008, 2010; García-Calero et al., 2008; Abellán et al., 2010; also reviewed in Domínguez et al., 2014). Gross comparisons are also made with anamniotes that are, however, still informative (Figure 8).
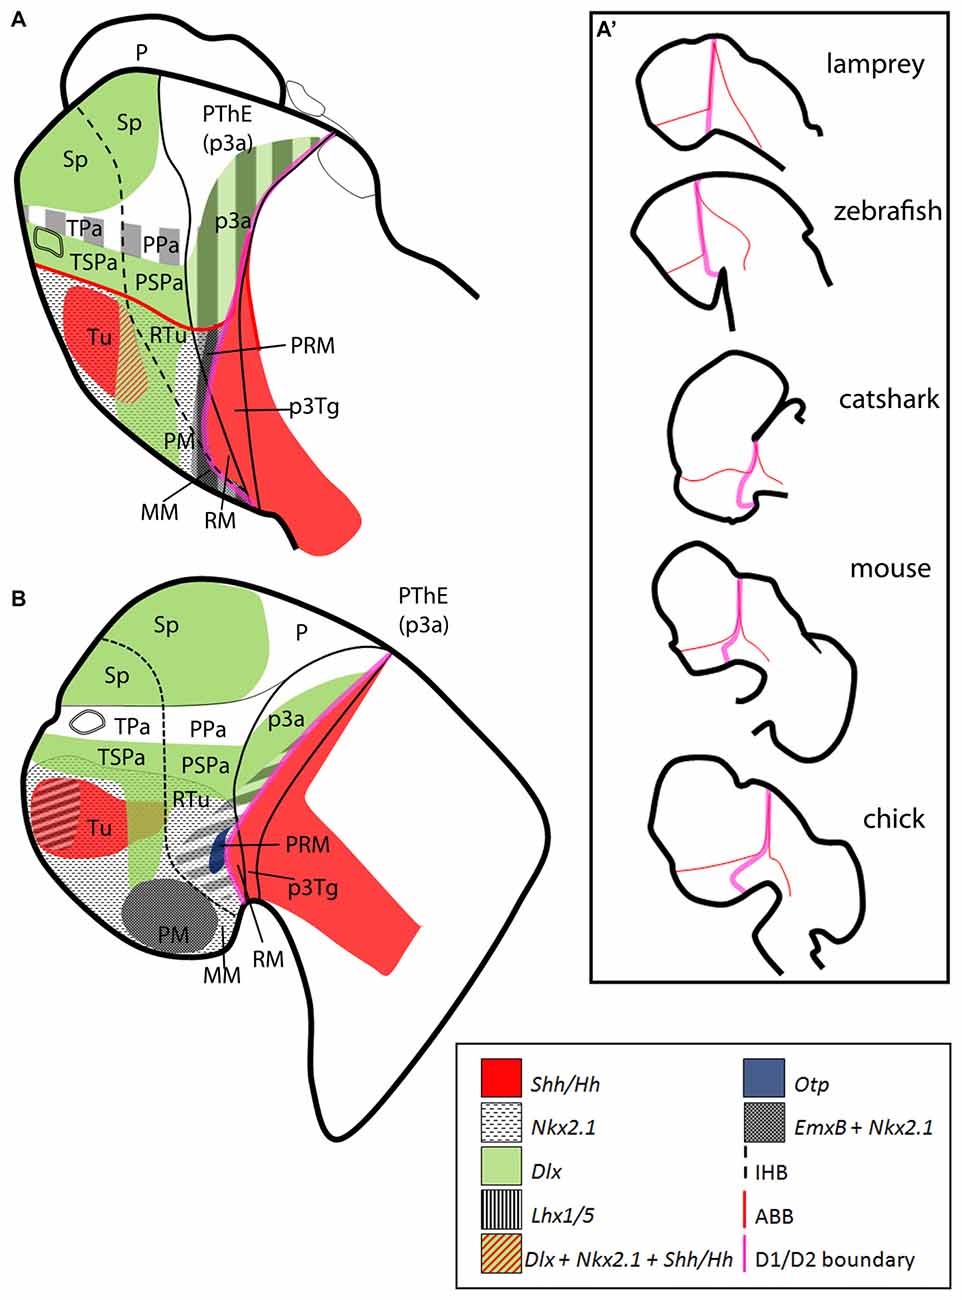
Figure 8. Sagittal schematic representations of the expression patterns of some orthologs here considered in (A) lamprey (adapted from Martínez-de-la-Torre et al., 2011) and (B) zebrafish (adapted from Hauptmann and Gerster, 2000). Schemes represent parasagittal sections at mid development. (A′) Conserved expression patterns suggest an alternative segmental border (pink line), which become deformed through evolution (adapted from Moreno and González, 2011). Data based on the following literature: (A) Murakami et al. (2001); Myojin et al. (2001); Ogasawara et al. (2001); Uchida et al. (2003); Osorio et al. (2005); Osório et al. (2006); Guérin et al. (2009); Tank et al. (2009); Kano et al. (2010); Martínez-de-la-Torre et al. (2011); Sugahara et al. (2011); (B) Barth and Wilson (1995); Hauptmann and Gerster (2000); Mathieu et al. (2002); Kapsimali et al. (2004); Jeong et al. (2006); Filippi et al. (2007, 2012); Ryu et al. (2007); Del Giacco et al. (2008); Osório et al. (2010); Yang et al. (2012); Lauter et al. (2013); Wolf and Ryu (2013); Manoli and Driever (2014). For abbreviations, see list.
Comparisons With Amniotes
In mouse, different works have addressed the expression of the orthologs here considered [Shh, Nkx2.1, Dlx5, Otp (Morales-Delgado et al., 2011, 2014; Puelles et al., 2012), Lhx5 (Szabó et al., 2009; Abellán et al., 2010; Puelles et al., 2012), Emx2 (Shimamura et al., 1995; Suda et al., 2001; Szabó et al., 2009), Lmx1b (Asbreuk et al., 2002; Martínez-Ferre and Martínez, 2012; Puelles et al., 2012), Pitx2 (Martin et al., 2004; Puelles et al., 2012); Foxa1 (Diez-Roux et al., 2011; Martínez-Ferre and Martínez, 2012; Puelles et al., 2012); Foxa2; and Neurog2 (Osório et al., 2010; Puelles et al., 2012)] that are also available in the Developing Mouse Brain Atlas1. We compared these patterns between mouse stage 13.5 and shark stage 29.
In both, mouse and shark, the Tu/RTu is characterized by the expression of Nkx2.1, Dlx2/5 and Otp (Figures 7A,B; see also Santos-Durán et al., 2015). However, differences in sub-compartmentation emerge while considering additional genes. In mouse, Lhx5 is broadly expressed in the basal hypothalamus before stage 13.5 (Szabó et al., 2009; Abellán et al., 2010; Developing Mouse Brain Atlas). Nevertheless, after this stage, it becomes downregulated and restrictedly expressed in non-Tu/RTu domains (Figure 7A). In shark, ScLhx5 is expressed in the dorsal-most Tu from stage 29 to 31 (Figure 7B). Besides, in the mouse, the expression of Shh is restricted to the dorsal and caudal-most Tu and RTu (Figure 7A) while in S. canicula it is fairly expressed in two subdomains of Tu but absent in the RTu (Figure 7B). Noteworthy, the differential spatial distribution of Shh between both models leads to the emergence of a subdomain in the mouse Tu (asterisk in Figure 7A) containing Dlx2/5 alone, apparently not present in shark (Figure 7B). However, a careful view suggests that this domain could correspond to the reduced Tu5 domain found in shark (see Figure 6C), so that in mouse this Dlx2/5-expressing domain could have been expanded at expenses of Shh-expressing domains due to changes in ventro-caudal signaling. Finally, in mouse, Emx2 is absent from the Tu/RTu while in shark it is expressed in Tu6 (Figures 6C, 7A,B).
The PM/PRM is characterized in both models by Otp and Lhx5 expression (Figures 7C,D). Of note, in shark, this compartment can be subdivided in a rostral PM1/PRM1 that lacks ScOtp and a caudal PM2/PRM2 that does express this gene. In shark, both compartments also express ScEmx2 (Figures 7C,D). Noteworthy, the PRM of shark lacks Shh expression in contrast to mouse (Figures 7C,D).
In the MM/RM, in both species genes expressed in the RM, like Lmx1b or Foxa1, appear to form a clear-cut border of expression with respect to those expressed in the MM (and even in the PRM) as Nkx2.1, Emx2 and Lhx5 (see Figures 7E,F). This seems to be a conserved feature across vertebrates (see below). However, in mouse, genes like Pitx2 and Neurog2 are expressed in both domains (Figures 7E,F) though Neurog2 is restricted to RM at earlier stages (termed as p3Tg in Figures 2B,B′ in Osório et al., 2010).
Together, this analysis reveals at least two things. First, one to one comparisons are useful to understand how interspecific variability emerges. Interestingly, the same set of homologous genes defines new or different microdomains among different species. Second, the number of microdomains identified increase with the number of genes analyzed, though their significance in terms of homology (common ancestry) becomes elusive. This raises non-trivial questions concerning homology establishment (Abouheif, 1997; Puelles and Medina, 2002) and compel us to consider other possible interpretations in the context of the prosomeric model.
Comparisons With Anamniotes
Many of the genes here considered have been already studied in agnathans and teleosts (Figure 8). Though it is difficult to establish one to one comparisons at the level of subdomains, common traits do exist between these groups (including chondrichthyans). Therefore, such characters are assumed to be transferable to other anamniotes.
In amniotes, genes expressed in the Nkx2.1-expressing hypothalamus (Emx2, Otp, Lhx5) abut those expressed more ventro-caudally (Shh, ScPitx2, ScPitx3, ScNeurog2 and ScLmx1b). Furthermore, the last group of genes describes a continuous line from the floor plate of the terminal hypothalamus and extends into the zli (Figures 6A,C and Figure 8). Such abutted expression is typical of segmental boundaries (for definition of segmental boundaries see Dahmann et al., 2011; Cavodeassi and Houart, 2012; Kiecker and Lumsden, 2012; see also Larsen et al., 2001; Puelles et al., 2012) and has not been observed at other points of the caudal secondary prosencephalon. Having this in mind we decided to look for other evidences for segmental boundaries at this point as reduced cell proliferation and the presence of signaling centers. Noteworthy, at least in sharks, reduced cell proliferation (PCNA-negative cells at the ventricular zone in Figures 3E–H) can be also detected bordering the domain where Shh and other markers are expressed in the caudal hypothalamus. Moreover, transverse Wnt signals seem to describe such border from the zli to the MM/RM boundary in different vertebrates (Figure 8A′; see also Guérin et al., 2009; Quinlan et al., 2009) while the situation in mice remain unclear. Finally, such border also seems to be the same as that delineated by Figdor and Stern (1993) between segment D1 and D2. Noteworthy, in the lamprey (Figure 8A), the expression of Wnt signals resemble that of other Wnt genes between rhombomers (Riley et al., 2004) an idea already suggested in Santos-Durán (2015). Though our results suggest that such border could get deformed on the course of evolution as shown in Figure 8A′, these evidences are not necessarily supported in mice where the expression of genes like Neurog2 and Pitx2 is continuous through the MM/RM rather than restricted to the RM (Figure 7). Of note, a recent review on vertebrate forebrain development also suggests the existence of a novel secondary organizer at this point (Puelles, 2017) as previously suggested in Santos-Durán (2015).
However, the idea that the currently identified as MM/RM border could indeed represent the hypothalamic-diencephalic border implies a new model of the hypothalamus that would require re-examination of other postulated limits and thus deserves further investigation.
Conclusion
This work belongs to a series of articles (Santos-Durán et al., 2015, 2016) addressing the development and evolution of the chondrichthyan hypothalamus and also the new proposals of the prosomeric model (Puelles et al., 2012; Puelles and Rubenstein, 2015) on the mentioned region.
Here, our combinatorial analysis revealed the existence of many different microdomains within the main subdomains of the prosomeric basal hypothalamus of the shark (Tu/RTu; PM/PRM; MM/RM). The genes considered in this study (ScOtp, ScDlx2/5, ScNkx2.1, ScShh, ScLhx5, ScEmx2, ScLmx1b, ScPitx2, ScPitx3a, ScFoxa1, ScFoxa2 and ScNeurog2) are well conserved in vertebrates. However, detailed comparisons at the level of microdomains under the prosomeric framework can be only performed with mammals, on which abundant data are available. Such analysis reveals a number of microzones that do not exactly fit those described in mice (Ferrán et al., 2015). Understanding the homology and evolution of such microdomains results daunting and can be misleading. However, these results illustrate, at least in part, how organisms became different in spite of expressing similar set of homologous genes.
Author Contributions
GNS-D, IR-M and EC designed the study and analyzed the data. SM contributed to data acquisition. GNS-D, AM and SF-G performed the experiments. GNS-D wrote the manuscript with inputs from all authors.
Funding
This work was supported by grants from the Spanish Dirección General de Investigación-FEDER (BFU2010-15816, BFU2014-58631-P), the Xunta de Galicia (10PXIB200051PR, IN 845B-2010/159, CN 2012/237), and the Région Centre, Région Bretagne (EVOVERT grant number 049755).
Conflict of Interest Statement
The authors declare that the research was conducted in the absence of any commercial or financial relationships that could be construed as a potential conflict of interest.
The reviewer NM and handling Editor declared their shared affiliation, and the handling Editor states that the process nevertheless met the standards of a fair and objective review.
Abbreviations
ABB, alar-basal boundary; Ah, adenohypophysis; AHy, alar hypothalamus; ap3, prosomere 3, alar part; BAt, basal acroterminal subdomain; HDB, hypothalamic-diencephalic border; hp1, prosomere hp1 or peduncular; hp2, prosomere hp2 or terminal; IHB, intrahypothalamic border; MM, mamillary area; Nh, neurohypophysis; P, pallium; p3Tg, prosomere 3, tegmental part; Pa, paraventricular area; PM, perimamillary area; PPa, paraventricular area, peduncular part; PRM, periretromamillary area; PSPa, subparaventricular area, peduncular part; PThE, prethalamic eminence (ap3); RM, retromamillary area; RTu, retrotuberal area; Sp, subpallium; SPa, subparaventricular area; Sv, saccus vasculosus; T, telencephalon; TPa, paraventricular area, terminal part; TSPa, subparaventricular area, terminal part; Tu, tuberal area; zli, zona limitans intrathalamica.
Footnotes
References
Abellán, A., Vernier, B., Rétaux, S., and Medina, L. (2010). Similarities and differences in the forebrain expression of Lhx1 and Lhx5 between chicken and mouse: insights for understanding telencephalic development and evolution. J. Comp. Neurol. 518, 3512–3528. doi: 10.1002/cne.22410
Abouheif, E. (1997). Developmental genetics and homology: a hierarchical approach. Trends Ecol. Evol. 12, 405–408. doi: 10.1016/s0169-5347(97)01125-7
Alvarez-Bolado, G., Paul, F. A., and Blaess, S. (2012). Sonic hedgehog lineage in the mouse hypothalamus: from progenitor domains to hypothalamic regions. Neural Dev. 7:4. doi: 10.1186/1749-8104-7-4
Anderson, S., Mione, M., Yun, K., and Rubenstein, J. L. (1999). Differential origins of neocortical projection and local circuit neurons: role of Dlx genes in neocortical interneuronogenesis. Cereb. Cortex 9, 646–654. doi: 10.1093/cercor/9.6.646
Asbreuk, C. H. J., Vogelaar, C. F., Hellemons, A., Smidt, M. P., and Burbach, J. P. H. (2002). CNS expression pattern of Lmx1b and coexpression with ptx genes suggest functional cooperativity in the development of forebrain motor control systems. Mol. Cell. Neurosci. 21, 410–420. doi: 10.1006/mcne.2002.1182
Ballard, W. W., Mellinger, J., and Lechenault, H. (1993). A series of normal stages for development of Scyliorhinus canicula, the lesser spotted dogfish (Chondrichthyes: Scyliorhinidae). J. Exp. Zool. 267, 318–336. doi: 10.1002/jez.1402670309
Bardet, S. M., Ferran, J. L. E., Sanchez-Arrones, L., and Puelles, L. (2010). Ontogenetic expression of sonic hedgehog in the chicken subpallium. Front. Neuroanat. 4:28. doi: 10.3389/fnana.2010.00028
Bardet, S. M., Martinez-de-la-Torre, M., Northcutt, R. G., Rubenstein, J. L. R., and Puelles, L. (2008). Conserved pattern of OTP-positive cells in the paraventricular nucleus and other hypothalamic sites of tetrapods. Brain Res. Bull. 75, 231–235. doi: 10.1016/j.brainresbull.2007.10.037
Barth, K. A., and Wilson, S. W. (1995). Expression of zebrafish nk2.2 is influenced by sonic hedgehog/vertebrate hedgehog-1 and demarcates a zone of neuronal differentiation in the embryonic forebrain. Development 121, 1755–1768.
Beccari, L., Marco-Ferreres, R., and Bovolenta, P. (2013). The logic of gene regulatory networks in early vertebrate forebrain patterning. Mech. Dev. 130, 95–111. doi: 10.1016/j.mod.2012.10.004
Candal, E., Anadón, R., Bourrat, F., and Rodríguez-Moldes, I. (2005). Cell proliferation in the developing and adult hindbrain and midbrain of trout and medaka (teleosts): a segmental approach. Dev. Brain Res. 160, 157–175. doi: 10.1016/j.devbrainres.2005.08.009
Cavodeassi, F., and Houart, C. (2012). Brain regionalization: of signaling centers and boundaries. Dev. Neurobiol. 72, 218–233. doi: 10.1002/dneu.20938
Compagnucci, C., Debiais-Thibaud, M., Coolen, M., Fish, J., Griffin, J. N., Bertocchini, D., et al. (2013). Pattern and polarity in the development and evolution of the gnathostome jaw: both conservation and heterotopy in the branchial arches of the shark, Scyliorhinus canicula. Dev. Biol. 377, 428–448. doi: 10.1016/j.ydbio.2013.02.022
Coolen, M., Menuet, A., Chassoux, D., Compagnucci, C., Henry, S., Lévèque, L., et al. (2009). “The dogfish Scyliorhinus canicula, a reference in jawed vertebrates,” in Emerging Model Organisms. A Laboratory Manual, eds R. R. Behringer, A. D. Johnson and R. E. Rrumlauf (Cold Spring Harbor, NY: Cold Spring Harbor Laboratory Press), 431–446.
Croizier, S., Chometton, S., Fellmann, D., and Risold, P. (2015). Characterization of a mammalian prosencephalic functional plan. Front. Neuroanat. 8:161. doi: 10.3389/fnana.2014.00161
Dahmann, C., Oates, A. C., and Brand, M. (2011). Boundary formation and maintenance in tissue development. Nat. Rev. Genet. 12, 43–55. doi: 10.1038/nrg2902
Debiais-Thibaud, M., Metcalfe, C. J., Pollack, J., Germon, I., Ekker, M., Depew, M., et al. (2013). Heterogeneous conservation of Dlx paralog co-expression in jawed vertebrates. PLoS One 8:e68182. doi: 10.1371/journal.pone.0068182
Del Giacco, L., Pistocchi, A., Cotelli, F., Fortunato, A. E., and Sordino, P. (2008). A peek inside the neurosecretory brain through Orthopedia lenses. Dev. Dyn. 237, 2295–2303. doi: 10.1002/dvdy.21668
Derobert, Y., Plouhinec, J. L., Sauka-Spengler, T., Le Mentec, C., Baratte, B., Jaillard, D., et al. (2002). Structure and expression of three Emx genes in the dogfish Scyliorhinus canicula: functional and evolutionary implications. Dev. Biol. 247, 390–404. doi: 10.1006/dbio.2002.0700
Díaz, C., Morales-Delgado, N., and Puelles, L. (2015). Ontogenesis of peptidergic neurons within the genoarchitectonic map of the mouse hypothalamus. Front. Neuroanat. 8:162. doi: 10.3389/fnana.2014.00162
Diez-Roux, G., Banfi, S., Sultan, M., Geffers, L., Anand, S., Rozado, D., et al. (2011). A high-resolution anatomical atlas of the transcriptome in the mouse embryo. PLoS Biol. 9:e1000582. doi: 10.1371/journal.pbio.1000582
Domínguez, L., González, A., and Moreno, N. (2014). Characterization of the hypothalamus of Xenopus laevis during development. II. The basal regions. J. Comp. Neurol. 522, 1102–1131. doi: 10.1002/cne.23471
Domínguez, L., González, A., and Moreno, N. (2015). Patterns of hypothalamic regionalization in amphibians and reptiles: common traits revealed by a genoarchitectonic approach. Front. Neuroanat. 9:3. doi: 10.3389/fnana.2015.00003
Domínguez, L., Morona, R., González, A., and Moreno, N. (2013). Characterization of the hypothalamus of Xenopus laevis during development. I. The alar regions. J. Comp. Neurol. 521, 725–759. doi: 10.1002/cne.23222
Ferrán, J. L., Puelles, L., and Rubenstein, J. L. R. (2015). Molecular codes defining rostrocaudal domains in the embryonic mouse hypothalamus. Front. Neuroanat. 9:46. doi: 10.3389/fnana.2015.00046
Ferrando, S., Gallus, L., Gambardella, C., Ghigliotti, L., Ravera, S., Vallarino, M., et al. (2010). Cell proliferation and apoptosis in the olfactory epithelium of the shark Scyliorhinus canicula. J. Chem. Neuroanat. 40, 293–300. doi: 10.1016/j.jchemneu.2010.08.004
Ferreiro-Galve, S., Rodríguez-Moldes, I., Anadón, R., and Candal, E. (2010). Patterns of cell proliferation and rod photoreceptor differentiation in shark retinas. J. Chem. Neuroanat. 39, 1–14. doi: 10.1016/j.jchemneu.2009.10.001
Figdor, M. C., and Stern, C. D. (1993). Segmental organization of embryonic diencephalon. Nature 363, 630–634. doi: 10.1038/363630a0
Filippi, A., Dürr, K., Ryu, S., Willaredt, M., Holzschuh, J., and Driever, W. (2007). Expression and function of nr4a2, lmx1b and pitx3 in zebrafish dopaminergic and noradrenergic neuronal development. BMC Dev. Biol. 7:135. doi: 10.1186/1471-213x-7-135
Filippi, A., Jainok, C., and Driever, W. (2012). Analysis of transcriptional codes for zebrafish dopaminergic neurons reveals essential functions of Arx and Isl1 in prethalamic dopaminergic neuron development. Dev. Biol. 369, 133–149. doi: 10.1016/j.ydbio.2012.06.010
García-Calero, E., Fernández-Garre, P., Martínez, S., and Puelles, L. (2008). Early mammillary pouch specification in the course of prechordal ventralization of the forebrain tegmentum. Dev. Biol. 320, 366–377. doi: 10.1016/j.ydbio.2008.05.545
González, A., López, J. M., Morona, R., and Moreno, N. (2017). “The organization of the central nervous system of amphibians,” in Evolution of Nervous Systems (Vol. 1), ed. J. Kaas (Oxford: Elsevier), 141–170.
Guérin, A., d’Aubenton-Carafa, Y., Marrakchi, E., Da Silva, C., Wincker, P., Mazan, S., et al. (2009). Neurodevelopment genes in lampreys reveal trends for forebrain evolution in craniates. PLoS One 4:e5374. doi: 10.1371/journal.pone.0005374
Hauptmann, G., and Gerster, T. (2000). Regulatory gene expression patterns reveal transverse and longitudinal subdivisions of the embryonic zebrafish forebrain. Mech. Dev. 91, 105–118. doi: 10.1016/s0925-4773(99)00277-4
Jeong, J.-Y., Einhorn, Z., Mercurio, S., Lee, S., Lau, B., Mione, M., et al. (2006). Neurogenin1 is a determinant of zebrafish basal forebrain dopaminergic neurons and is regulated by the conserved zinc finger protein Tof/Fezl. Proc. Natl. Acad. Sci. U S A 103, 5143–5148. doi: 10.1073/pnas.0600337103
Kano, S., Xiao, J.-H., Osório, J., Ekker, M., Hadzhiev, Y., Müller, F., et al. (2010). Two lamprey Hedgehog genes share non-coding regulatory sequences and expression patterns with gnathostome Hedgehogs. PLoS One 5:e13332. doi: 10.1371/journal.pone.0013332
Kapsimali, M., Caneparo, L., Houart, C., and Wilson, S. W. (2004). Inhibition of Wnt/Axin/β-catenin pathway activity promotes ventral CNS midline tissue to adopt hypothalamic rather than floorplate identity. Development 131, 5923–5933. doi: 10.1242/dev.01453
Kiecker, C., and Lumsden, A. (2012). The role of organizers in patterning the nervous system. Annu. Rev. Neurosci. 35, 347–367. doi: 10.1146/annurev-neuro-062111-150543
Lagadec, R., Laguerre, L., Menuet, A., Amara, A., Rocancourt, C., Péricard, P., et al. (2015). The ancestral role of nodal signalling in breaking L/R symmetry in the vertebrate forebrain. Nat. Commun. 6, 6686–6696. doi: 10.1038/ncomms7686
Larsen, C. W., Zeltser, L. M., and Lumsden, A. (2001). Boundary formation and compartition in the avian diencephalon. J. Neurosci. 21, 4699–4711.
Lauter, G., Söll, I., and Hauptmann, G. (2013). Molecular characterization of prosomeric and intraprosomeric subdivisions of the embryonic zebrafish diencephalon. J. Comp. Neurol. 521, 1093–1118. doi: 10.1002/cne.23221
Manning, L., Ohyama, K., Saeger, B., Hatano, O., Wilson, S. A., Logan, M., et al. (2006). Regional morphogenesis in the hypothalamus: a BMP-Tbx2 pathway coordinates fate and proliferation through Shh downregulation. Dev. Cell 11, 873–885. doi: 10.1016/j.devcel.2006.09.021
Manoli, M., and Driever, W. (2014). Nkx2.1 and Nkx2.4 genes function partially redundant during development of the zebrafish hypothalamus, preoptic region, and pallidum. Front. Neuroanat. 8:145. doi: 10.3389/fnana.2014.00145
Martin, D. M., Skidmore, J. M., Philips, S. T., Vieira, C., Gage, P. J., Condie, B. G., et al. (2004). PITX2 is required for normal development of neurons in the mouse subthalamic nucleus and midbrain. Dev. Biol. 267, 93–108. doi: 10.1016/j.ydbio.2003.10.035
Martínez-de-la-Torre, M., Pombal, M. A., and Puelles, L. (2011). Distal-less-like protein distribution in the larval lamprey forebrain. Neuroscience 178, 270–284. doi: 10.1016/j.neuroscience.2010.12.030
Martínez-Ferre, A., and Martínez, S. (2012). Molecular regionalization of the diencephalon. Front. Neurosci. 6:73. doi: 10.3389/fnins.2012.00073
Mathieu, J., Barth, A., Rosa, F. M., Wilson, S. W., and Peyriéras, N. (2002). Distinct and cooperative roles for Nodal and Hedgehog signals during hypothalamic development. Development 129, 3055–3065.
Medina, L. (2008). “Evolution and embryological development of the forebrain,” in Encyclopedia of Neuroscience, eds M. D. Binder, N. Hirokawa and U. Windhorst (Berlin: Springer-Verlag), 1172–1192.
Medina, L., Bupesh, M., and Abellán, A. (2011). Contribution of genoarchitecture to understanding forebrain evolution and development, with particular emphasis on the amygdala. Brain. Behav. Evol. 78, 216–236. doi: 10.1159/000330056
Morales-Delgado, N., Castro-Robles, B., Ferrán, J. L., Martínez-de-la-Torre, M., Puelles, L., and Díaz, C. (2014). Regionalized differentiation of CRH, TRH, and GHRH peptidergic neurons in the mouse hypothalamus. Brain Struct. Funct. 219, 1083–1111. doi: 10.1007/s00429-013-0554-2
Morales-Delgado, N., Merchán, P., Bardet, S. M., Ferrán, J. L., Puelles, L., and Díaz, C. (2011). Topography of somatostatin gene expression relative to molecular progenitor domains during ontogeny of the mouse hypothalamus. Front. Neuroanat. 5:10. doi: 10.3389/fnana.2011.00010
Moreno, N., Domínguez, L., Morona, R., and González, A. (2012). Subdivisions of the turtle Pseudemys scripta hypothalamus based on the expression of regulatory genes and neuronal markers. J. Comp. Neurol. 520, 453–478. doi: 10.1002/cne.22762
Moreno, N., and González, A. (2011). The non-evaginated secondary prosencephalon of vertebrates. Front. Neuroanat. 5:12. doi: 10.3389/fnana.2011.00012
Moreno, N., Morona, R., López, J. M., and González, A. (2017). “The diencephalon and hypothalamus of nonmammalian vertebrates: evolutionary and developmental traits,” in Evolution of Nervous Systems, 2nd Edn. (Vol. 1), ed. J. Kaas (Oxford: Elsevier), 409–426.
Murakami, Y., Ogasawara, M., Sugahara, F., Hirano, S., Satoh, N., and Kuratani, S. (2001). Identification and expression of the lamprey Pax6 gene: evolutionary origin of the segmented brain of vertebrates. Development 128, 3521–3531.
Myojin, M., Ueki, T., Sugahara, F., Murakami, Y., Shigetani, Y., Aizawa, S., et al. (2001). Isolation of Dlx and Emx gene cognates in an agnathan species, Lampetra japonica, and their expression patterns during embryonic and larval development: conserved and diversified regulatory patterns of homeobox genes in vertebrate head evolution. J. Exp. Zool. 291, 68–84. doi: 10.1002/jez.6
Ogasawara, M., Shigetani, Y., Suzuki, S., Kuratani, S., and Satoh, N. (2001). Expression of thyroid transcription factor-1 (TTF-1) gene in the ventral forebrain and endostyle of the agnathan vertebrate, Lampetra japonica. Genesis 30, 51–58. doi: 10.1002/gene.1032
Osorio, J., Mazan, S., and Rétaux, S. (2005). Organisation of the lamprey (Lampetra fluviatilis) embryonic brain: insights from LIM-homeodomain, Pax and hedgehog genes. Dev. Biol. 288, 100–112. doi: 10.1016/j.ydbio.2005.08.042
Osório, J., Megías, M., Pombal, M. A., and Rétaux, S. (2006). Dynamic expression of the LIM-homeodomain gene Lhx15 through larval brain development of the sea lamprey (Petromyzon marinus). Gene Expr. Patterns 6, 873–878. doi: 10.1016/j.modgep.2006.02.007
Osório, J., Mueller, T., Rétaux, S., Vernier, P., and Wullimann, M. F. (2010). Phylotypic expression of the bHLH genes Neurogenin2, NeuroD, and Mash1 in the mouse embryonic forebrain. J. Comp. Neurol. 518, 851–871. doi: 10.1002/cne.22247
Pombal, M., and Megías, M. (2017). “The nervous systems of jawless vertebrates,” in Evolution of Nervous Systems (Vol. 1), ed. J. Kaas (Oxford: Elsevier), 37–57.
Pose-Méndez, S., Candal, E., Mazan, S., and Rodríguez-Moldes, I. (2016). Genoarchitecture of the rostral hindbrain of a shark: basis for understanding the emergence of the cerebellum at the agnathan-gnathostome transition. Brain Struct. Funct. 221, 1321–1335. doi: 10.1007/s00429-014-0973-8
Puelles, L. (2017). “Forebrain development in vertebrates,” in The Wiley Handbook of Evolutionary Neuroscience, ed. S. V. Shepherd (Chichester, West Sussex, UK: John Wiley and Sons), 351–387.
Puelles, L., and Medina, L. (2002). Field homology as a way to reconcile genetic and developmental variability with adult homology. Brain Res. Bull. 57, 243–255. doi: 10.1016/s0361-9230(01)00693-1
Puelles, L., Martínez, S., Martínez-de-la-Torre, M. S., and Rubenstein, J. (2012). “Hypothalamus,” in The Mouse Nervous System, eds C. Watson, G. Paxinos and L. Puelles (San Diego, CA: Academic Press), 221–312.
Puelles, L., Martínez, S., Martínez-de-la-Torre, M., and Rubenstein, J. (2004). “Gene maps and related histogenetic domains in the forebrain and midbrain,” in The Rat Nervous System, ed. G. Paxinos (San Diego, CA: Academic Press), 3–25.
Puelles, L., and Rubenstein, J. L. R. (1993). Expression patterns of homeobox and other putative regulatory genes in the embryonic mouse forebrain suggest a neuromeric organization. Trends Neurosci. 16, 472–479. doi: 10.1016/0166-2236(93)90080-6
Puelles, L., and Rubenstein, J. L. R. (2003). Forebrain gene expression domains and the evolving prosomeric model. Trends Neurosci. 26, 469–476. doi: 10.1016/s0166-2236(03)00234-0
Puelles, L., and Rubenstein, J. L. R. (2015). A new scenario of hypothalamic organization: rationale of new hypotheses introduced in the updated prosomeric model. Front. Neuroanat. 9:27. doi: 10.3389/fnana.2015.00027
Quinlan, R., Graf, M., Mason, I., Lumsden, A., and Kiecker, C. (2009). Complex and dynamic patterns of Wnt pathway gene expression in the developing chick forebrain. Neural Dev. 4:35. doi: 10.1186/1749-8104-4-35
Quintana-Urzainqui, I. (2013). Development and Regionalization of the Telencephalon and Peripheral Associated Systems in the Shark Scyliorhinus Canicula. Santiago de Compostela: Universidad de Santiago de Compostela.
Quintana-Urzainqui, I., Rodríguez-Moldes, I., and Candal, E. (2014). Developmental, tract-tracing and immunohistochemical study of the peripheral olfactory system in a basal vertebrate: insights on Pax6 neurons migrating along the olfactory nerve. Brain Struct. Funct. 219, 85–104. doi: 10.1007/s00429-012-0486-2
Quintana-Urzainqui, I., Rodríguez-Moldes, I., Mazan, S., and Candal, E. (2015). Tangential migratory pathways of subpallial origin in the embryonic telencephalon of sharks: evolutionary implications. Brain Struct. Funct. 220, 2905–2926. doi: 10.1007/s00429-014-0834-5
Quintana-Urzainqui, I., Sueiro, C., Carrera, I., Ferreiro-Galve, S., Santos-Durán, G., Pose-Méndez, S., et al. (2012). Contributions of developmental studies in the dogfish Scyliorhinus canicula to the brain anatomy of elasmobranchs: insights on the basal ganglia. Brain. Behav. Evol. 80, 127–141. doi: 10.1159/000339871
Riley, B. B., Chiang, M.-Y., Storch, E. M., Heck, R., Buckles, G. R., and Lekven, A. C. (2004). Rhombomere boundaries are Wnt signaling centers that regulate metameric patterning in the zebrafish hindbrain. Dev. Dyn. 231, 278–291. doi: 10.1002/dvdy.20133
Rodríguez-Moldes, I., Ferreiro-Galve, S., Carrera, I., Sueiro, C., Candal, E., Mazan, S., et al. (2008). Development of the cerebellar body in sharks: spatiotemporal relations of Pax6 expression, cell proliferation and differentiation. Neurosci. Lett. 432, 105–110. doi: 10.1016/j.neulet.2007.11.059
Rodríguez-Moldes, I., Santos-Durán, G. N., Pose-Méndez, S., Quintana-Urzainqui, I., and Candal, E. (2017). “The brains of cartilaginous fishes,” in Evolution of Nervous Systems (Vol. 1), ed. J. Kaas (Oxford: Elsevier), 77–97.
Ryu, S., Mahler, J., Acampora, D., Holzschuh, J., Erhardt, S., Omodei, D., et al. (2007). Orthopedia homeodomain protein is essential for diencephalic dopaminergic neuron development. Curr. Biol. 17, 873–880. doi: 10.1016/j.cub.2007.04.003
Santos-Durán, G. (2015). Development and Evolution of the Vertebrate Hypothalamus: Evidences in Chondrichthyans. Santiago de Compostela: Universidade de Santiago de Compostela.
Santos-Durán, G. N., Ferreiro-Galve, S., Menuet, A., Quintana-Urzainqui, I., Mazan, S., Rodríguez-Moldes, I., et al. (2016). The shark alar hypothalamus: molecular prosomeric subdivisions and evolutionary trends. Front. Neuroanat. 10:113. doi: 10.3389/fnana.2016.00113
Santos-Durán, G. N., Menuet, A., Lagadec, R., Mayeur, H., Ferreiro-Galve, S., Mazan, S., et al. (2015). Prosomeric organization of the hypothalamus in an elasmobranch, the catshark Scyliorhinus canicula. Front. Neuroanat. 9:37. doi: 10.3389/fnana.2015.00037
Sheng, H. Z., Bertuzzi, S., Chiang, C., Shawlot, W., Taira, M., Dawid, I., et al. (1997). Expression of murine Lhx5 suggests a role in specifying the forebrain. Dev. Dyn. 208, 266–277. doi: 10.1002/(sici)1097-0177(199702)208:2<266::aid-aja13>3.0.co;2-1
Shimamura, K., Hartigan, D. J., Martínez, S., Puelles, L., and Rubenstein, J. L. (1995). Longitudinal organization of the anterior neural plate and neural tube. Development 121, 3923–3933.
Shimogori, T., Lee, D. A., Miranda-Angulo, A., Yang, Y., Wang, H., Jiang, L., et al. (2010). A genomic atlas of mouse hypothalamic development. Nat. Neurosci. 13, 767–775. doi: 10.1038/nn.2545
Suda, Y., Hossain, Z. M., Kobayashi, C., Hatano, O., Yoshida, M., Matsuo, I., et al. (2001). Emx2 directs the development of diencephalon in cooperation with Otx2. Development 128, 2433–2450.
Sueiro, C., Carrera, I., Ferreiro, S., Molist, P., Adrio, F., Anadón, R., et al. (2007). New insights on Saccus vasculosus evolution: a developmental and immunohistochemical study in elasmobranchs. Brain Behav. Evol. 70, 187–204. doi: 10.1159/000104309
Sugahara, F., Aota, S., Kuraku, S., Murakami, Y., Takio-Ogawa, Y., Hirano, S., et al. (2011). Involvement of Hedgehog and FGF signalling in the lamprey telencephalon: evolution of regionalization and dorsoventral patterning of the vertebrate forebrain. Development 138, 1217–1226. doi: 10.1242/dev.059360
Szabó, N.-E., Zhao, T., Cankaya, M., Theil, T., Zhou, X., and Álvarez-Bolado, G. (2009). Role of neuroepithelial Sonic hedgehog in hypothalamic patterning. J. Neurosci. 29, 6989–7002. doi: 10.1523/JNEUROSCI.1089-09.2009
Tank, E. M., Dekker, R. G., Beauchamp, K., Wilson, K. A., Boehmke, A. E., and Langeland, J. A. (2009). Patterns and consequences of vertebrate Emx gene duplications. Evol. Dev. 11, 343–353. doi: 10.1111/j.1525-142X.2009.00341.x
Uchida, K., Murakami, Y., Kuraku, S., Hirano, S., and Kuratani, S. (2003). Development of the adenohypophysis in the lamprey: evolution of epigenetic patterning programs in organogenesis. J. Exp. Zool. B Mol. Dev. Evol. 300, 32–47. doi: 10.1002/jez.b.44
Van de Kamer, J. C., and Shuurmans, A. J. (1953). Development and structure of the saccus vasculosus of Scylliorhinus caniculus (L.). J. Embryol. Exp. Morphol. 1, 85–96.
Wolf, A., and Ryu, S. (2013). Specification of posterior hypothalamic neurons requires coordinated activities of Fezf2, Otp, Sim1a and Foxb1.2. Development 140, 1762–1773. doi: 10.1242/dev.085357
Keywords: chondrichthyan, basal hypothalamus, evo-devo, prosomeric model, segments, Shh, PCNA
Citation: Santos-Durán GN, Ferreiro-Galve S, Menuet A, Mazan S, Rodríguez-Moldes I and Candal E (2018) The Shark Basal Hypothalamus: Molecular Prosomeric Subdivisions and Evolutionary Trends. Front. Neuroanat. 12:17. doi: 10.3389/fnana.2018.00017
Received: 04 June 2017; Accepted: 21 February 2018;
Published: 14 March 2018.
Edited by:
Agustín González, Complutense University of Madrid, SpainReviewed by:
Luis Puelles, Universidad de Murcia, SpainNerea Moreno, Complutense University of Madrid, Spain
Copyright © 2018 Santos-Durán, Ferreiro-Galve, Menuet, Mazan, Rodríguez-Moldes and Candal. This is an open-access article distributed under the terms of the Creative Commons Attribution License (CC BY). The use, distribution or reproduction in other forums is permitted, provided the original author(s) and the copyright owner are credited and that the original publication in this journal is cited, in accordance with accepted academic practice. No use, distribution or reproduction is permitted which does not comply with these terms.
*Correspondence: Eva Candal, eva.candal@usc.es