Subregional Density of Neurons, Neurofibrillary Tangles and Amyloid Plaques in the Hippocampus of Patients With Alzheimer’s Disease
 Diana Furcila
 Marta Domínguez-Álvaro
 Javier DeFelipe
 Lidia Alonso-Nanclares
- 1Cajal Laboratory of Cortical Circuits, Centre for Biomedical Technology (CTB), Universidad Politécnica de Madrid, Madrid, Spain
- 2Network Biomedical Research Center on Neurodegenerative Diseases (CIBERNED), Madrid, Spain
- 3Cajal Institute (CSIC), Madrid, Spain
A variety of anatomical alterations have been reported in the hippocampal formation of patients with Alzheimer’s Disease (AD) and these alterations have been correlated with cognitive symptoms in the early stages of the disease. Major hallmarks in AD are the presence of paired helical filaments of tau protein (PHFTau) within neurons, also known as neurofibrillary tangles (NFTs), and aggregates of amyloid-β protein (Aβ) which form plaques in the extracellular space. Nevertheless, how the density of plaques and NFTs relate to the severity of cell loss and cognitive decline is not yet clear. The aim of the present study was to further examine the possible relationship of both Aβ plaques and NFTs with neuronal loss in several hippocampal fields (DG, CA3, CA1, and subiculum) of 11 demented AD patients. For this purpose, using stereological techniques, we compared neuronal densities (Nissl-stained, and immunoreactive neurons for NeuN) with: (i) numbers of neurons immunostained for two isoforms of PHFTau (PHFTau-AT8 and PHFTau-pS396); and (ii) number of Aβ plaques. We found that CA1 showed the highest number of NFTs and Aβ plaques, whereas DG and CA3 displayed the lowest number of these markers. Furthermore, AD patients showed a variable neuronal loss in CA1 due to tangle-related cell death, which seems to correlate with the presence of extracellular tangles.
Introduction
Major hallmarks in Alzheimer’s disease (AD) are the presence of paired helical filaments of tau protein (PHFTau) within neurons, also known as neurofibrillary tangles (NFTs), and aggregates of amyloid-β protein (Aβ) which form plaques in the extracellular space (Grundke-Iqbal et al., 1986; Goedert et al., 1988; Avila, 2004; Hyman et al., 2012; Takahashi et al., 2017). As previously discussed in Garcia-Marin et al. (2009), plaques and NFTs are mostly found in the cerebral cortex (entorhinal cortex, hippocampal formation and neocortex), where both their number and the proportion of the cortex affected increases progressively as the disease advances (Braak and Braak, 1991; Dickson, 1997; Thal et al., 2002). These pathological changes have also been found in subcortical structures such as the amygdala, nucleus basalis, thalamus, locus coeruleus, and raphe nuclei, particularly during the late stages of AD (e.g., Esiri et al., 1997). Accordingly, multiple neuronal circuits and neurotransmitter systems may be altered in the brain of AD patients.
It has been described that these two proteins (Aβ and PHFTau) act together and even enhance each other (DeVos et al., 2017; Polanco et al., 2017; Furcila et al., 2018), but it is still unknown which protein triggers degeneration. Their accumulation in the cerebral cortex starts at different regions; in initial stages of AD, PHFTau is seen in the medial temporal lobe (MTL; Braak and Braak, 1991), and Aβ protein starts to form aggregates in neocortical regions, particularly in temporal and frontal lobe (Thal et al., 2002; Sepulcre et al., 2013). The main controversy is still whether it is Aβ, PHFTau or their interaction that correlates with the disease progression in AD (Nelson et al., 2012; Bloom, 2014). In initial stages of the disease, a number of alterations, such as neuronal loss and changes in the pyramidal cell morphology, among others, have been reported in hippocampal regions from AD patients (Hyman et al., 1990; West et al., 2004; Merino-Serrais et al., 2011; Andrade-Moraes et al., 2013; Llorens-Martín et al., 2014). AD cognitive symptoms in early stages are loss of context, disorientation and autobiographical memory impairment (Dubois et al., 2007; Petersen et al., 2009). The MTL and, in particular, the hippocampal formation and adjacent cortex support these functions (Hyman et al., 1986; Amaral and Lavenex, 2007). It is well known that a variety of changes occur in the hippocampal regions of AD patients, such as a decrease in the number of neurons, as well as neuronal alterations (for example; changes in the morphology of the dendritic arbor and spines); the presence of neuropil threads and Aβ plaques; and microvascular changes (e.g., Hyman et al., 1990; West et al., 2004; von Gunten et al., 2006; Bouras et al., 2006; Giannakopoulos et al., 2003; Andrade-Moraes et al., 2013; Llorens-Martín et al., 2014). It has been proposed that the presence of PHFTau aggregates and Aβ-ir plaques related to AD may represent a toxic environment for hippocampal neurons (Ittner and Götz, 2011). However, it has been demonstrated that CA1 neurons show a heterogeneous expression pattern of PHFTau proteins. For example, in a previous study performed in our laboratory in CA1 regarding the co-expression of PHFTau-pS396 and PHFTau-AT8, we found that most (64%) of the labeled neurons expressed only PHFTau-pS396, whereas 28% displayed both markers and 8% showed only PHFTau-AT8-ir (Furcila et al., 2018).
The aim of the present study was to further examine the relationship of both proteins in AD and possible neuronal loss in different hippocampal regions. For this purpose, we determined possible differences between regions, markers and cases, by comparing neuronal densities (Nissl-stained, NeuN-ir, PHFTau-AT8-ir and PHFTau-pS396-ir neurons) and Aβ-ir plaques.
To label PHFTau-ir neurons, we chose the antibody PHFTau-AT8 because it is commonly used to classify the neurofibrillary degeneration into stages known as the Braak stages (Braak et al., 2006), and the antibody PHFTau-pS396 because phosphorylation at site S396 is commonly related to late stages of AD (Regalado-Reyes et al., 2019) and it is mostly found in NFTs (Kimura et al., 1996). For this purpose, we used stereological techniques for neurons, PHFTau and Aβ plaques stainings (Nissl; NeuN; Aβ; PHFTau-AT8; PHFTau-pS396) to study the DG, CA3, CA1 and subiculum from the hippocampus of 11 demented AD patients.
Materials and Methods
Tissue Preparation
Samples of human brain tissue from AD patients were obtained from 11 cases (post-mortem delay between 2:00 and 5:30 h; aged between 69 and 89 years upon death; Table 1) diagnosed with AD according to neuropathological examination as stated by Braak and Braak (1991) and CERAD (Mirra et al., 1991; Fillenbaum et al., 2008). These samples were obtained from two sources: Banc de Teixits Neurologics from Hospital Universitari Clinic de Barcelona (Spain) and Banco de Tejidos Fundación CIEN (Madrid, Spain), following the guidelines of the Helsinki Declaration and with the approval of the local Ethical Committees. Permission to publish the data about age and other demographic information was obtained from the patients or their next of kin along with the informed consent for use of the donor’s biological samples for research, according to national regulation on biobanks. We used coronal sections of the human hippocampus at the level of the hippocampal body (Mai et al., 2016). These tissue samples have been previously used in our laboratory (Furcila et al., 2018; Regalado-Reyes et al., 2019; case codes Az1–10 correspond to BCN1–10, and Az11 to VK26). Tissue blocks containing the hippocampal formation were fixed in a solution of 4% paraformaldehyde (for 24 h at 4°C), cryoprotected (30% sucrose solution for at least 24 h) and deep-frozen (−80°C). Blocks containing the hippocampus were cut with a sliding microtome at −40°C (Thermo Fischer Scientific, Waltham, MA, USA, MICROM, HM450; freeze unit, KS34, Massachusetts, USA), in serial coronal sections (50 μm thick) and collected in 0.1 M PB for further processing.
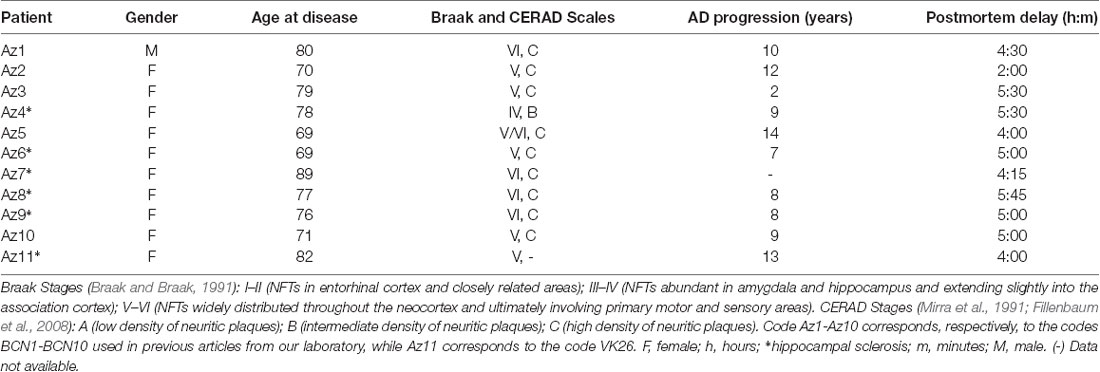
Table 1. Summary of clinical and pathological data.
Immunohistochemistry
The sections selected from the hippocampal formation were processed for standard immunocytochemical techniques (Figure 1). Briefly, the sections were first treated to eliminate endogenous peroxidase (1% H2O2). Those sections selected for the staining for anti-Aβ were first treated with 88% formic acid (Sigma–Aldrich, No. 251364, St. Louis, MO, USA). The sections were then treated with 0.25% Triton-X in PB 0.1 M, 3% horse serum (NHS, Vector Laboratories Inc., Burlingame, CA, USA) and incubated overnight at 4°C with a specific primary antibody. On the following day, the sections were rinsed and processed with a biotinylated secondary antibody (horse anti-mouse or goat anti-rabbit IgG, 1:200, Vector Laboratories, Burlingame, CA, USA), and then with Avidin-Biotin Complex (Vectastain ABC Kit, Vector Laboratories Inc., Burlingame, CA, USA). Staining was visualized with the chromogen 3, 3′-diaminobenzidine (DAB: Sigma Aldrich, St. Louis, MO, USA). All sections were incubated until they turned light brown, with the same duration of incubation for all slides; the immunostaining was checked via light microscope before stopping the reaction in all slides. Then, the sections were incubated in 0.02% OsO4 in PB for 15 s at room temperature. Finally, the sections were mounted, dehydrated, cleared with Xilol and covered-slipped (DePeX; Merck KGaA 100579, 64271, Germany). The following primary antibodies were used: mouse anti-NeuN monoclonal antibody (1:2,000; Chemicon; MAB377, Temecula, CA, USA); mouse anti-PHFTau-AT8 monoclonal antibody (1:2,000, MN1020, Thermo Scientific, Waltham, MA, USA); rabbit anti-PHFTau-pS396 polyclonal antibody (1:2,000, Invitrogen, 44752G, CA, EEUU); and mouse anti-Aβ monoclonal antibody (clone 6F/3D, 1:50, Dako M0872, Glostrup, Denmark). Adjacent sections were Nissl-stained with toluidine blue (Figure 1).
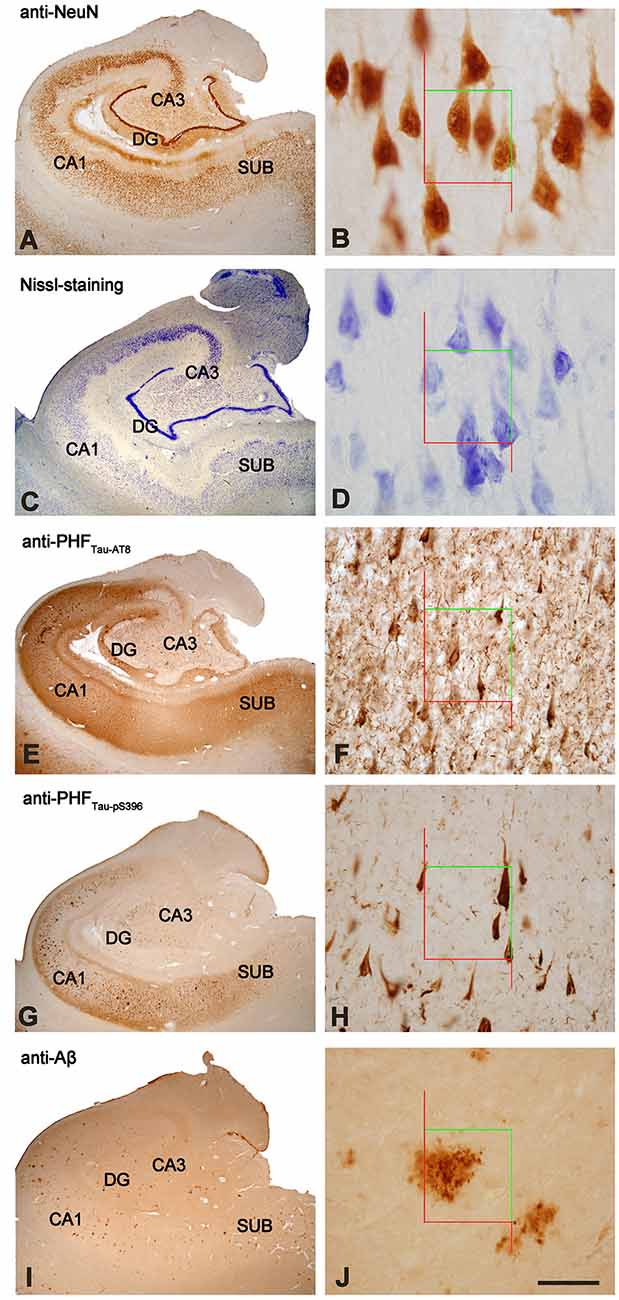
Figure 1. Stained hippocampal formation sections from an AD patient. Left column, low-power microphotographs of the hippocampal formation showing NeuN-ir (A), Nissl-staining (C), PHFTau-AT8-ir (E), PHFTau-pS396-ir (G) and Aβ-ir (I) sections. Right column (B,D,F,H,J), higher magnification of CA1 region to illustrate the applied counting frame (green lines correspond to the inclusion border and red lines to the exclusion border) used in the stereological procedure. Scale bar, shown in (J), indicates 1,000 μm in (A,C,E,G,I); 37 μm in (B,D); 90 μm in (F,H,J). DG: dentate gyrus; CA1-CA3: cornu ammonis fields; SUB: subiculum.
To generate the figures, images were captured with a digital camera (Olympus DP70) attached to an Olympus BX51 light microscope (Olympus, Ballerup, Denmark) and Adobe Photoshop CS4 Extended 11.0.2 software (Adobe Systems, San Jose, CA, USA) was used to produce the figure plates.
Estimation of Neuronal Densities
Densities of labeled neurons were estimated using a stereological method known as optical dissectors (Figure 1; West and Gundersen, 1990) with the aid of Stereo Investigator software (Stereo Investigator 11.0, MicroBright Field Inc., Williston, VT, USA), using its Optical Fractionator tool. Neuronal densities, expressed as the number of labeled neurons per volume, were estimated in CA3, CA1, and subiculum, using Nissl-stained sections and NeuN-, PHFTau-AT8- and PHFTau-pS396-immunostained sections. Nissl-stained and NeuN-immunostained sections were used to identify the boundaries within the hippocampus.
After randomly selecting a starting point, six sections were chosen at equally spaced intervals. Optical dissectors were made with an oil immersion ×100 objective for both the NeuN-immunostained and Nissl-stained sections, on an average surface of 2,050 μm2. The depth of the optical dissectors was 10 μm, rendering a study volume of 20,500 μm3 per optical dissector. An ×40 objective was used for the PHFTau-immunostained sections, on a surface of 14,450 μm2. The depth of the optical dissectors in this case was also 10 μm, rendering a study volume of 144,500 μm3. Stereological parameters for each sample and neuronal marker were chosen. Since most neurons are located in the pyramidal cell layer, neuronal densities were estimated in this layer in the CA subfields and subiculum. In Nissl-stained sections, a neuron was only counted if the nucleolus was clearly identified in the optical plane along the vertical z-axis (Figure 1).
Estimations of Amyloid Plaque Density and Volume
The number of Aβ-ir plaques per volume was also estimated by the Optical Fractionator tool (Stereo Investigator) in DG, CA3, CA1 and subiculum (Figure 1). A minimum of six sections were selected for each patient, with equal intervals with an ×40 objective on a surface of 22,500 μm2 and with a dissector depth of 10 μm, rendering a study volume of 225,000 μm3 per optical dissector.
To estimate the Aβ-ir plaque volume, the edges of the plaque were delineated with the Nucleator tool with the aid of Stereo Investigator software (Gundersen, 1988). This tool provides the volume of each Aβ-ir plaque analyzed, as well as the relative volume occupied by them in each examined hippocampal subfield (Figure 1) to provide the percentage of tissue (%) occupied by Aβ-ir plaques.
Tissue Shrinkage Estimation
Tissue shrinkage due to staining protocols was estimated measuring the section area and thickness before and after processing to correct the final values using Stereo Investigator software. The area of the section after processing was divided by the area value measured before processing, to obtain a shrinkage factor for any area measurement. The thickness was measured at 10 random points to estimate shrinkage along the z-axis (i.e., section compression). As a result, the brain tissue was estimated to have shrunk 30% in volume when processed for DAB and Nissl-staining: for the DAB-immunostaining, the average thickness of the unstained sections was 50.2 μm, and after immunostaining processing, it was 16.49 μm in NeuN-, PHFTau- and Aβ-immunostained sections; in Nissl-stained sections, the average thickness after processing was 17.4 μm. Thus, the final values of all stereological estimations were corrected to obtain an estimation of the pre-processing values.
Statistical Analysis
To determine possible differences between regions, markers, and cases, statistical comparisons of neuronal densities (Nissl-stained, NeuN-ir, PHFTau-AT8-ir, and PHFTau-pS396-ir neurons) and Aβ-ir plaque data were carried out. When the data were parametric (normality and homoscedasticity criteria were met), we performed a t-student test and ANOVA test, followed by Bonferroni test for pair-wise comparisons. Normality and homoscedasticity were analyzed with the Shapiro–Wilk and Levene tests, respectively. When normality and homoscedasticity were not met, we used unpaired Mann–Whitney (MW) nonparametric U-test and Kruskal–Wallis test (KW), followed by the Mann–Whitney test (MW) for pair-wise comparisons. Correlation analysis was used to find possible relations between variables. Statistical procedures and graphs were carried out with GraphPad Prism 7 statistical package (Prism, San Diego, CA, USA) and SPSS program (IBM SPSS Statistics v25, IBM Corporation, Foster City, CA, USA).
Results
In this study, divisions of the hippocampal fields were delineated on the basis of previous descriptions (Insausti and Amaral, 2012) and nomenclature for each region was previously used in Alonso-Nanclares et al. (2011). For the purposes of the present work, we will use the terms: DG, the hippocampus proper (subdivided into CA1, CA2 and CA3 fields) and the subiculum (Figure 1).
Neuronal Density Estimations
The overall neuronal density was estimated in both Nissl-stained and NeuN-immunostained sections in the pyramidal layer of CA3, CA1 and subiculum (Supplementary Table S1; Figure 2A). Other hippocampal regions were not used for neuronal counting due to technical difficulties, such as the dense packing of the granular cells in the DG and the reduced volume of CA2, which produce high error coefficients that are not acceptable when obtaining accurate estimations. No differences were observed in the number of neurons per volume when comparing both markers across regions (T-test: p = 0.13 in CA3; p = 0.73 in CA1 and p = 0.41 in Subiculum). Neuronal densities in AD patients showed a wide range of values in all analyzed regions (Figure 2A). Moreover, estimations performed in NeuN-ir sections displayed a higher variability than those densities obtained in Nissl-stained sections (Supplementary Table S1). Unless otherwise specified, we will refer to the data obtained in Nissl estimations for the neuronal density.
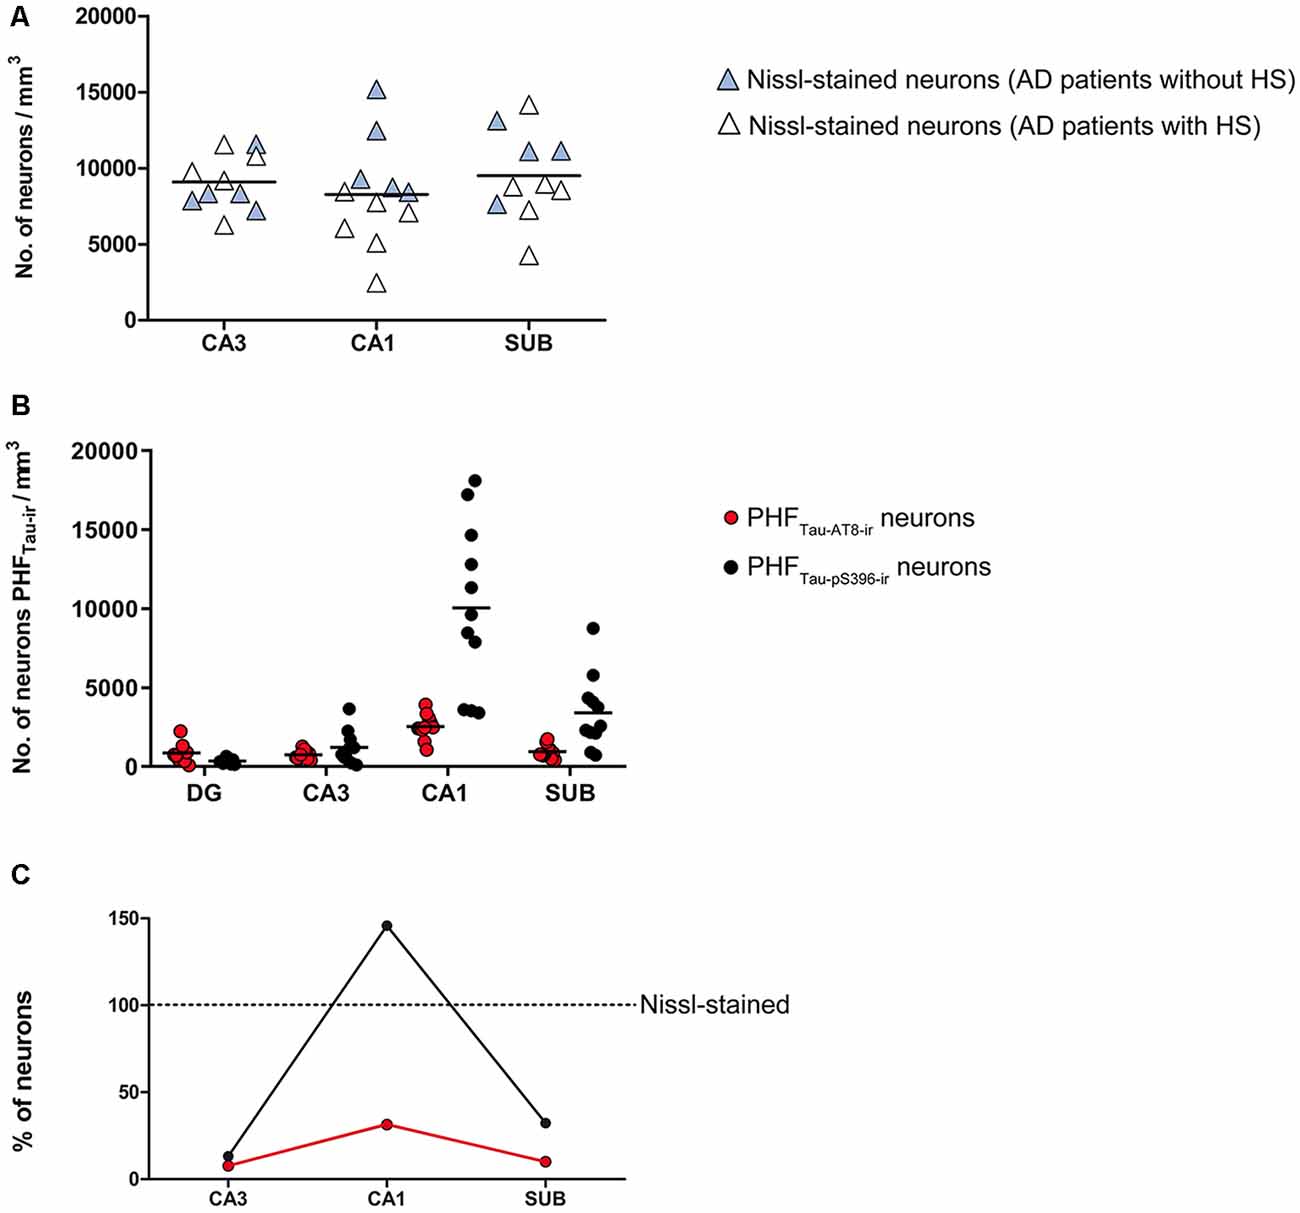
Figure 2. (A) Plot showing neuronal densities in examined hippocampal areas, estimated in Nissl-stained sections. The densities represented correspond to the number of labeled neurons per volume (mm3) for each analyzed case. White symbols correspond to the AD patients with HS. (B) Graph showing neuronal densities per volume of PHFTau-AT8-ir and PHFTau-pS396-ir neurons in the hippocampal fields analyzed, in AD patients. The densities represented correspond to the number of labeled neurons per volume (mm3) for each analyzed case. (C) Graphical representation of the percentages of PHFTau-AT8-ir and PHFTau-pS396-ir neurons, considering Nissl-stained neurons as the total neuronal population. Data correspond to the average percentages per region. Note that the percentage of PHFTau-pS396-ir elements surpasses the total neuronal population, which may be a consequence of extracellular labeled NFTs or “ghost tangles” (see text for further details). HS, Hippocampal sclerosis; DG, dentate gyrus; CA1–CA3, cornu ammonis fields; SUB, subiculum.
The estimated CA1 neuronal density was 8,852 ± 4,368 (mean ± SD; Supplementary Table S1). In six of the AD patients, we found a very low number of neurons in CA1, which was compatible with hippocampal sclerosis (HS), a pathological finding (Figure 3) which is often associated with AD (Dickson et al., 1994; Velez-Pardo et al., 2004; Attems and Jellinger, 2006; Amador-Ortiz et al., 2007). The neuronal densities found in CA1 from those AD patients with HS were 5,492 ± 2,029 neurons/mm3 (mean ± SD), whereas in AD patients without HS they were 12,884 ± 2,304 (Figure 2A). The latter values were similar to values found in CA1 from control cases (12,040 ± 1,746; see “Discussion” section). No statistical differences were observed in the number of neurons per volume (mm3) across fields (CA1, CA3, and subiculum) compared to each other (one way ANOVA; p = 0.6041; F = 0.5132).
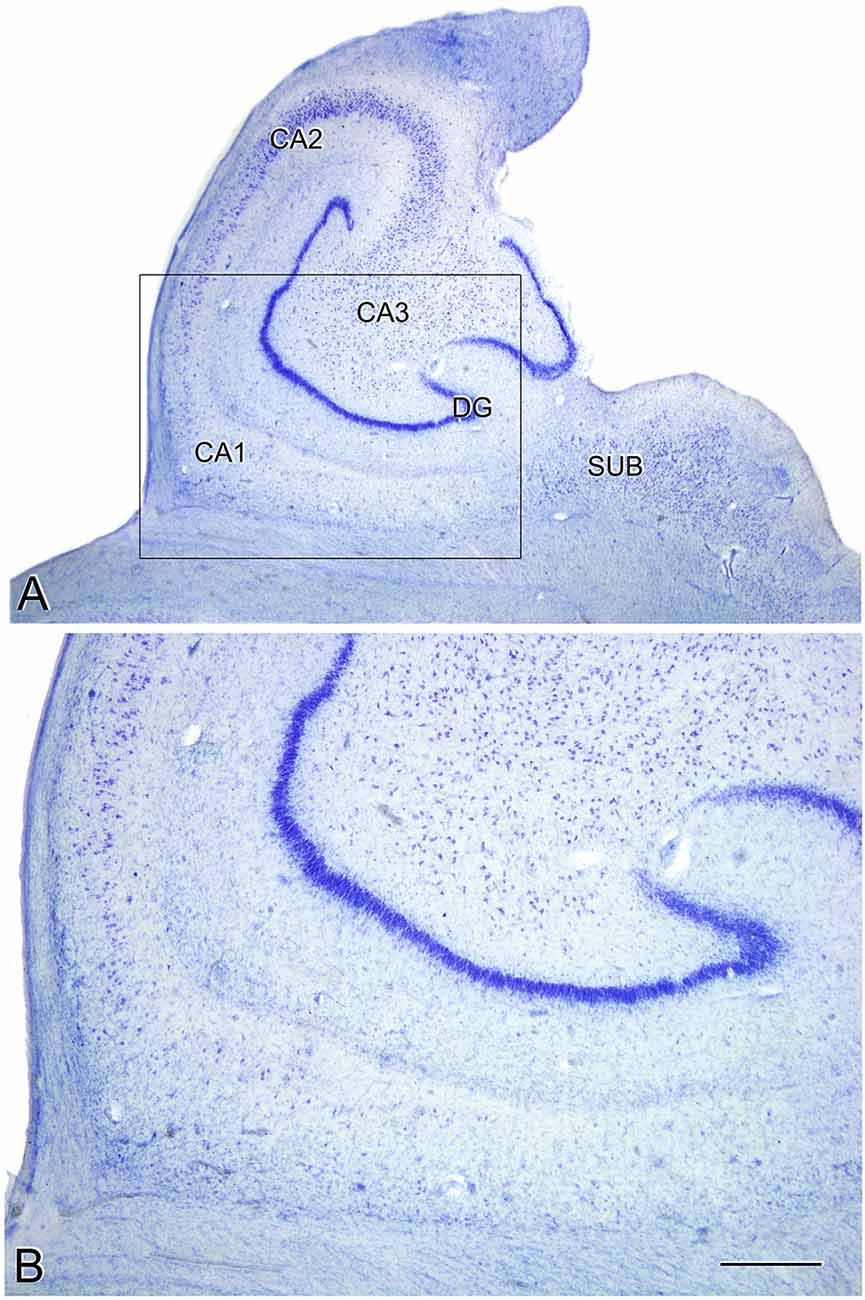
Figure 3. Microphotographs of the hippocampal formation from a Nissl-stained section of an AD patient (Az9) affected by hippocampal sclerosis (A). Higher magnification of the boxed region in A shows the severe neuronal loss and gliosis in CA1 (B). DG: dentate gyrus; CA1-CA3: cornu ammonis fields; SUB: subiculum. Scale bar (in B) indicates 2.25 mm in (A), and 1,000 mm in (B).
PHFTau-ir Studies
To examine the presence of hyperphosphorylated tau protein in the hippocampal formation from AD patients, and to explore the possible correlation between PHFTau and AD stages (Augustinack et al., 2002), two isoforms of PHFTau were quantified: PHFTau-AT8 and PHFTau-pS396.
In all hippocampal regions analyzed, we observed a higher density of PHFTau-pS396-ir (neurons per volume) than PHFTau-AT8-ir, as previously observed in the CA1 region from AD patients particularly at the advanced stages of the disease (Su et al., 1994, 1996; Kimura et al., 1996; Blazquez-Llorca et al., 2010; Furcila et al., 2018); Supplementary Table S1; Figure 2B). The highest neuronal densities of PHFTau-pS396-ir and PHFTau-AT8-ir were observed in CA1, followed by the subiculum, whereas CA3 and DG presented lower values (Supplementary Table S1; Figure 2B). In addition, PHFTau-pS396-ir neuronal density was more variable between patients than PHFTau-AT8-ir neuronal density, particularly in the CA1 region. Moreover, the density of PHFTau-pS396-ir in CA1 was very close to the estimated overall neuronal densities (estimated in Nissl-stained and NeuN-ir sections), suggesting that the majority of neurons in CA1 from AD patients contain PHFTau-pS396. A ratio between the number of PHFTau-ir neurons and the total neurons estimated by Nissl-staining was calculated in CA3, CA1, and subiculum. These ratios showed that in CA3, PHFTau-AT8-ir neurons represent about 8% of the total neurons, and 10% in the subiculum, whereas PHFTau-pS396, was present in 13% of the CA3 neurons, and in 32% of the subicular neurons. In CA1, PHFTau-AT8-ir neurons represent about 31% of the neurons, while this figure reached 146% in the case of PHFTau-pS396, that is, in CA1 the number of PHFTau-pS396-ir neurons exceeded the total number of total Nissl-stained neurons by 46% (Figure 2C; Supplementary Table S2), which could be explained by the labeling of extracellular NFTs or “ghost tangles” (see “Discussion” section).
Correlation analysis of the relative percentage of PHFTau-pS396 neurons and the total neuronal population (estimated by Nissl-staining) showed a significantly negative correlation (P = 0.0037; r = −0.791; Spearman).
Analyses of Aβ-ir Plaques
Estimation of the number of Aβ-ir plaques per volume showed that CA1 presented the highest values, followed by the subiculum, DG and CA3 (Supplementary Table S1; Figure 4A). In addition, CA1 and subiculum not only presented the highest densities of plaques per volume (p < 0.0001; KW: 22.33), but they also displayed a higher proportion of tissue volume occupied by plaques (p = 0.0002; KW: 19.21; Supplementary Table S1; Figure 4B). By contrast, we found that the average volume of Aβ-ir plaques (Supplementary Table S1; Figure 4C) was significantly higher (p = 0.0198; KW: 9.86) in the DG (52,350 μm3).
Figure 4. Plots to illustrate the estimated features of the Aβ-ir plaques in the examined hippocampal fields. Number of Aβ-ir plaques per volume (A), the volume occupied by Aβ-ir plaques (B), and the estimation of Aβ-ir plaque average volume (C). DG, dentate gyrus; CA1–CA3, cornu ammonis fields; SUB, subiculum.
In summary, DG and CA3 displayed the lowest number of plaques per volume, and although plaques in these regions were bigger, the relative volume they occupied in these regions was lower. By contrast, CA1 and subiculum presented a higher number of Aβ-ir plaques per volume and also showed higher proportions of tissue occupied by plaques, although the plaque size was relatively small.
Discussion
In the current study, we used coronal sections of the human hippocampus at the level of the hippocampal body from patients with AD to estimate the density of neurons, NFTs and amyloid plaques per mm3 in different hippocampal fields. The present study is based on the analysis of relatively few sections of the hippocampus from these patients; therefore, the estimation should not be extrapolated to the whole hippocampus. We found that hippocampal CA1 field was the region most affected by the presence of numerous PHFTau-ir elements and Aβ-ir plaques, compared to other hippocampal fields of the same patients. The subiculum showed moderate levels of PHFTau-ir neurons and Aβ-ir plaques, while DG and CA3 were less affected by the presence of these pathological elements.
Neuronal Densities
No significant differences in neuronal densities were found between the CA1, CA3 and subiculum within a given patient or between these hippocampal fields from different patients, except in AD patients with HS. A very low neuronal density was found in CA1 in the HS patients, with the density being significantly lower compared to CA3 and subiculum of the same patients as well as compared to CA1, CA3 and subiculum of the patients without HS. We examined 11 AD cases (age range: 69–89 years old) and the neuronal density in CA1 ranged from 2,475 to 8,458 neurons/mm3 in those cases with HS, and from 8,430 to 15,187 neurons/mm3 in the rest of the AD patients. Although age-matched controls for comparison with the AD cases would clearly be ideal, it should be noted that the neuronal density range of the AD patients without HS was similar to the control group described in a previous study performed in our laboratory using the same methods of quantification, despite the age differences (Andrioli et al., 2007). In this Andrioli et al.’s (2007) study, three autopsy control cases were examined and the neuronal densities ranged from 10,744 to 14,024 neurons/mm3 (age range: 49–69 years old). Moreover, the CA3 and subiculum from AD patients displayed neuronal densities (8,936 in CA3; 9,503 in subiculum) that were similar to those found in these control cases (9,852 ± 978 in CA3; 10,186 ± 2,672 in subiculum). Furthermore, in the same study by Andrioli et al. (2007), the neuronal densities in the control CA1 region obtained from biopsies taken from epileptic patients (age range: 21–65 years old) were estimated to range from 11,057 to 13,194 neurons/mm3. Therefore, although our previous studies were based on a relatively small number of cases, they did suggest that the density of neurons in the control CA1 is similar in individuals with ages ranging between 21 and 69 years old. Indeed, a rather small change (10%) in the number of neocortical neurons was found as a function of age by Pakkenberg and Gundersen (1997) in a study which covered ages ranging from 20 to 90 years old. However, since the AD patients show brain atrophy (e.g., van de Pol et al., 2006; although we did not measure the total volume of the hippocampus), it is obvious that there is a decrease in the absolute number of neurons in AD patients despite the fact that that the number of neurons per mm3 was similar to that found in previously published results in healthy individuals.
The vulnerability of CA1 to neurodegeneration has been widely investigated (reviewed in Duvernoy, 2005) and it has been reported that this particular region is very susceptible to metabolic changes (reviewed in Bartsch and Wulff, 2015). The greatest reduction in neuronal density was observed in those AD cases which also showed HS (Table 1, Supplementary Table S1; Figure 2A), while non-sclerotic AD patients displayed higher neuronal densities in the CA1 region, with values similar to control cases (see “Results” section). Since the majority of neurons in CA1 are pyramidal cells and severe neuronal loss was found in CA1 from AD patients with HS, it follows that their projection sites lack their normal inputs from CA1. However, how and when neuronal loss—related to AD progression—impacts on the hippocampal connectivity and function remains to be elucidated.
Remarkably, in CA1, we found that the density of PHFTau-pS396-ir neurons reaches the total population of NeuN-ir neurons, and even surpasses the neuronal densities estimated in Nissl-stained sections. That is, virtually all CA1 neurons from AD patients were labeled by the anti-PHFTau-pS396 antibody. Thus, some of the PHFTau-pS396-ir elements that surpass the total neuronal population may correspond to extracellular labeled NFTs. In the estimations performed in Nissl-stained sections, a neuron was quantified only if its nucleus was visible; neurons that had lost their nucleus or cellular integrity were not counted. It has been reported that in AD patients there is a pathological degeneration of PHFTau-ir neurons, which leads to a loss of the neuronal integrity, resulting in an extracellular NFT—the so-called “ghost tangle” (Braak et al., 1994). These ghost tangles have been seen in late stages of AD and they are phosphorylated, mainly at Ser396 (Kimura et al., 1996). In the present study, we found that cases with low neuronal density displayed more PHFTau-pS396 extracellular tangles, suggesting that neuronal loss has occurred to a great extent due to AD-related tangle pathology. This finding may provide a morphological correlate of severe cell loss in AD, which has been referred to as hippocampal sclerosis in the literature (Dickson et al., 1994; Velez-Pardo et al., 2004; Attems and Jellinger, 2006; Amador-Ortiz et al., 2007).
Thus, in CA1 from AD patients, some of the neurons might have lost their integrity, functionality and normal connectivity. Indeed, a loss of dendritic spines and dendritic atrophy in pyramidal neurons containing well-developed NFTs has been described in AD patients (Merino-Serrais et al., 2013). So, progressive changes in the PHFTau-pS396-ir neurons may develop into morphological and functional alterations, and, finally, lead to a total degeneration of the neuron resulting in extracellular NFT. Moreover, it has been demonstrated that CA1 neurons show a heterogeneous expression pattern of PHFTau proteins. For example, in a previous study performed in our laboratory in CA1 regarding the co-expression of PHFTau-pS396 and PHFTau-AT8 in the same patients as in the present work, we found that 64% of the labeled neurons expressed only PHFTau-pS396, 28% showed both markers and 8% displayed only PHFTauAT8-ir (Furcila et al., 2018). Some studies have proposed that PHFTau-AT8 is a specific marker of early stages, while PHFTau-pS396 appears in late stages (Su et al., 1994, 1996; Regalado-Reyes et al., 2019). Nevertheless, other authors have suggested that PHFTau-pS396 occurs in the early stages and has a dynamic pattern of expression throughout the course of the disease, while PHFTau-AT8 appears in advanced stages (Mondragón-Rodríguez et al., 2014). Our results are in line with the latter study, since we found higher densities of PHFTau-pS396-ir neurons than PHFTau-AT8-ir neurons in all examined AD patients (which corresponded to the IV-V stages on the Braak scale). The role of intracellular PHFTau is an open debate; it has been suggested that its presence does not necessarily indicate severe and irreversible damage (Gong and Iqbal, 2008; Avila et al., 2012; Merino-Serrais et al., 2013; Polanco et al., 2017) and intracellular PHFTau has been reported in CA1 neurons in non-demented elderly patients (Ferrer, 2012). However, since PHFTau may impair the expression of another protein or proteins, and may affect the course of the disease, it is difficult to establish a hyperphosphorylation stage-dependent pattern.
Aβ Plaques Density
CA1 also displayed the highest values for the density of Aβ-ir plaques. Previous studies in our laboratory in the CA1 of AD patients have shown that the presence of Aβ-ir plaques leads to local alterations, including changes in pyramidal cell morphology and innervation (e.g., Garcia-Marin et al., 2009; Blazquez-Llorca et al., 2010; Merino-Serrais et al., 2013; Antón-Fernández et al., 2017). Moreover, our previous study—on Aβ-ir plaque distribution in CA1—revealed that most plaques were mainly located in the stratum pyramidale followed by the stratum radiatum, suggesting that the basal and apical dendritic arborization located in these CA1 layers might be severely affected in AD (Furcila et al., 2018).
Aβ-ir plaques have been proposed to trigger glial activation (D’Andrea et al., 2001; Jung et al., 2015; for a review see Chun and Lee, 2018), which—in turn—has been proposed to be part of the inflammatory process associated with the presence of both PHFTau and Aβ in AD (Parbo et al., 2017). Microglial clustering has been reported in the vicinity of Aβ-ir plaques in neocortical tissue from AD patients (Serrano-Pozo et al., 2013). In particular, activated microglia may internalize Aβ, contributing to the stabilization of plaque size (Rajendran et al., 2006; Serrano-Pozo et al., 2013; Asai et al., 2015), but the toxicity of pathological protein forms in late stages of AD may cause altered microglial functionalities. If microglial cells fail to clear soluble Aβ, they may dump it into the extracellular space again, making the formation of more Aβ-ir plaques possible. In the present study, we found that regions with a larger number of Aβ-ir plaques per volume (CA1 and subiculum) presented smaller plaques than those regions with less Aβ plaques (DG and CA3).
Individual Variability
Our data were derived from relatively few AD demented patients (n = 11), precluding the extrapolation of the results to the whole population of patients with AD. Although examined patients were clinically rather homogeneous (Table 1), several characteristics should be considered regarding our current results. Our present data showed a remarkable variability in the neuronal density in the AD samples. Estimation of neuronal densities performed in Nissl-stained and NeuN-immunostained sections did not show differences in any of the analyzed regions. However, data derived from NeuN-immunostained sections showed greater variability, both between regions and patients. It has been reported that a delay in fixation of postmortem human brain tissue usually causes artifacts, such as disruptions in membrane continuity and an increase in the volume of the extracellular space, among other geometrical distortions (e.g., Tang et al., 2001). These features represent an important limitation when performing stereological counts, because the preservation of tissue volume is critical to obtain reliable estimates. Indeed, a recent study revealed that rat brain tissue undergoes significant metabolic changes that are accentuated with longer postmortem times and showed that this affects the visualization of certain antibodies, including anti-NeuN (Gonzalez-Riano et al., 2017). Quantitative studies on neuronal densities performed in human brain tissue with a large postmortem delay (up to 24 h) may provide data that differ from our results (Simic et al., 1997; Andrade-Moraes et al., 2013). While the preservation of human brain tissue with large postmortem delay might be acceptable for certain qualitative observations (e.g., Simic et al., 1997; Wittner et al., 2006; Andrade-Moraes et al., 2013), it might not be suitable for comparative studies performed in different laboratories. In addition, brain tissue fixing techniques may also alter stereological estimates, as studies have revealed a reduction in immunoreactivity using formalin (Lyck et al., 2009).
The source of variability may also be attributable to the individual cognitive reserve. Cognitive reserve has been proposed as a compensatory mechanism, which serves as protection against neuronal degeneration, allowing variable numbers of PHFTau-ir neurons and Aβ-ir plaques to be presented (Tucker and Stern, 2011; Lazarczyk et al., 2012; Steffener and Stern, 2012; Stern, 2012; Avila et al., 2015; Hoenig et al., 2017).
Finally, Aβ-ir plaques are observed in brain samples from non-demented cases, and clinical trials of AD therapies centered on the amyloid protein have failed to treat AD-associated cognitive impairment; thus, the amyloid pathology may not be solely responsible for the cognitive decline observed in AD (reviewed in Anderson et al., 2017; Morris et al., 2018). Moreover, in AD, the alterations are not only initiated by PHFTau and Aβ proteins, but probably also by the presence of other proteinopathies (Spires-Jones et al., 2017; Robinson et al., 2018). The interaction of altered proteins, and not their separate action, may modify the progression of AD. Thus, our study is in line with the idea that AD is not a unique entity but varies from one patient to another as a result of factors including—but not limited to—age, gender, co-pathologies and medical treatments.
In summary, we found that in AD patients CA1 showed the highest number of NFTs and Aβ plaques, whereas DG and CA3 displayed the lowest number of NFTs and Aβ plaques. Furthermore, AD patients have a variable neuronal loss in CA1 due to tangle-related cell death, which seems to correlate with the presence of extracellular tangles.
Data Availability Statement
The datasets generated for this study are available on request to the corresponding author.
Ethics Statement
The studies involving human participants were reviewed and approved by Banc de Teixits Neurologics from Hospital Universitari Clinic de Barcelona (Spain) and Banco de Tejidos Fundación CIEN (Madrid, Spain). The patients/participants provided their written informed consent to participate in this study.
Author Contributions
JD and LA-N oversaw and designed the project. DF processed the tissue. DF and MD-Á performed data acquisition and initial analysis; they prepared the figures. LA-N supervised data analysis. DF and LA-N drafted the initial manuscript. All authors revised and contributed to the final version of the manuscript.
Funding
This work was supported by grants from the following entities: the Spanish “Ministerio de Ciencia, Innovación y Universidades” (grant PGC2018-094307-B-I00); Centro de Investigación en Red Sobre Enfermedades Neurodegenerativas (CIBERNED, CB06/05/0066, Spain); Fundación por un Mañana Sin Alzheimer (León, Spain) and; the Alzheimer’s Association (ZEN-15-321663).
Conflict of Interest
The authors declare that the research was conducted in the absence of any commercial or financial relationships that could be construed as a potential conflict of interest.
Acknowledgments
We would like to thank Lorena Valdes, Carmen Alvarez and Miriam Marin for technical assistance, and G. Leon-Espinosa and P. Merino-Serrais for their help processing the tissue. The authors would also like to thank Banc de Teixits Neurologics from Hospital Universitari Clinic de Barcelona (Dr. I. Ferrer, Servicio de Anatomía Patológica, IBIDELL-Hospital Universitario de Bellvitge, Barcelona, Spain) and Banco de Tejidos Fundación CIEN (Dr. A. Rábano, Área de Neuropatología, Centro Alzheimer, Fundación Reina Sofía, Madrid, Spain) for providing human brain tissue. We would also like to thank Nick Guthrie for his helpful comments and excellent editorial assistance.
Abbreviations
ABC, avidin-biotin complex; Aβ, amyloid-β; AD, Alzheimer’s disease; CA, cornu ammonis fields; DG, dentate gyrus; HS, hippocampal sclerosis; -ir, immunoreactive; MTL, medial temporal lobe; NFTs, neurofibrillary tangles; PHFTau, paired helical filaments of tau protein; SD, standard deviation.
Supplementary Material
The Supplementary Material for this article can be found online at: https://www.frontiersin.org/articles/10.3389/fnana.2019.00099/full#supplementary-material.
References
Alonso-Nanclares, L., Kastanauskaite, A., Rodriguez, J. R., Gonzalez-Soriano, J., and DeFelipe, J. (2011). A stereological study of synapse number in the epileptic human hippocampus. Front. Neuroanat. 5:8. doi: 10.3389/fnana.2011.00008
Amador-Ortiz, C., Lin, W.-L., Ahmed, Z., Personett, D., Davies, P., Duara, R., et al. (2007). TDP-43 immunoreactivity in hippocampal sclerosis and Alzheimer’s disease. Ann. Neurol. 61, 435–445. doi: 10.1002/ana.21154
Amaral, D., and Lavenex, P. (2007). “Hippocampal Neuroanatomy,” in The Hippocampus Book, eds D. G. Amaral, P. Andersen, T. Bliss, R. G. M. Morris and J. O’Keefe (New York: Oxford University Press), 37–114. doi: 10.1093/acprof:oso/9780195100273.003.0003
Anderson, R. M., Hadjichrysanthou, C., Evans, S., and Wong, M. M. (2017). Why do so many clinical trials of therapies for Alzheimer’s disease fail? Lancet 390, 2327–2329. doi: 10.1016/s0140-6736(17)32399-1
Andrade-Moraes, C. H., Oliveira-Pinto, A. V., Castro-Fonseca, E., da Silva, C. G., Guimarães, D. M., Szczupak, D., et al. (2013). Cell number changes in Alzheimer’s disease relate to dementia, not to plaques and tangles. Brain 136, 3738–3752. doi: 10.1093/brain/awt273
Andrioli, A., Alonso-Nanclares, L., Arellano, J. I., and DeFelipe, J. (2007). Quantitative analysis of parvalbumin-immunoreactive cells in the human epileptic hippocampus. Neuroscience 149, 131–143. doi: 10.1016/j.neuroscience.2007.07.029
Antón-Fernández, A., Merchán-Rubira, J., Avila, J., Hernández, F., DeFelipe, J., and Muñoz, A. (2017). Phospho-tau accumulation and structural alterations of the golgi apparatus of cortical pyramidal neurons in the P301S tauopathy mouse model. J. Alzheimers Dis. 60, 651–661. doi: 10.3233/jad-170332
Asai, H., Ikezu, S., Tsunoda, S., Medalla, M., Luebke, J., Wolozin, B., et al. (2015). Depletion of microglia and inhibition of exosome synthesis halt tau propagation. Nat. Neurosci. 18, 1584–1593. doi: 10.1038/nn.4132
Attems, J., and Jellinger, K. A. (2006). Hippocampal sclerosis in Alzheimer disease and other dementias. Neurology 66:775. doi: 10.1212/01.wnl.0000200959.50898.26
Augustinack, J. C., Schneider, A., Mandelkow, E. M., and Hyman, B. T. (2002). Specific tau phosphorylation sites correlate with severity of neuronal cytopathology in Alzheimer’s disease. Acta Neuropathol. 103, 26–35. doi: 10.1007/s004010100423
Avila, J. (2004). The influence of aging in one tauopathy: Alzheimer’s disease. Arch. Immunol. Ther. Exp. 52, 410–413.
Avila, J., León-Espinosa, G., García, E., García-Escudero, V., Hernández, F., and DeFelipe, J. (2012). Tau phosphorylation by GSK3 in different conditions. Int. J. Alzheimers Dis. 2012:578373. doi: 10.1155/2012/578373
Avila, J., Perry, G., Strange, B. A., and Hernandez, F. (2015). Alternative neural circuitry that might be impaired in the development of Alzheimer disease. Front. Neurosci. 9:145. doi: 10.3389/fnins.2015.00145
Bartsch, T., and Wulff, P. (2015). The hippocampus in aging and disease: from plasticity to vulnerability. Neuroscience 309, 1–16. doi: 10.1016/j.neuroscience.2015.07.084
Blazquez-Llorca, L., Garcia-Marin, V., and DeFelipe, J. (2010). Pericellular innervation of neurons expressing abnormally hyperphosphorylated tau in the hippocampal formation of Alzheimer’s disease patients. Front. Neuroanat. 4:20. doi: 10.3389/fnana.2010.00020
Bloom, G. S. (2014). Amyloid-β and tau: the trigger and bullet in Alzheimer disease pathogenesis. JAMA Neurol. 71, 505–508. doi: 10.1001/jamaneurol.2013.5847
Bouras, C., Kövari, E., Herrmann, F. R., Rivara, C. B., Bailey, T. L., von Gunten, A., et al. (2006). Stereologic analysis of microvascular morphology in the elderly: Alzheimer disease pathology and cognitive status. J. Neuropathol. Exp. Neurol. 65, 235–244. doi: 10.1097/01.jnen.0000203077.53080.2c
Braak, H., Alafuzoff, I., Arzberger, T., Kretzschmar, H., and Del Tredici, K. (2006). Staging of Alzheimer disease-associated neurofibrillary pathology using paraffin sections and immunocytochemistry. Acta Neuropathol. 112, 389–404. doi: 10.1007/s00401-006-0127-z
Braak, H., and Braak, E. (1991). Neuropathological stageing of Alzheimer-related changes. Acta Neuropathol. 82, 239–259. doi: 10.1007/bf00308809
Braak, F., Braak, H., and Mandelkow, E.-M. (1994). A sequence of cytoskeleton changes related to the formation of neurofibrillary tangles and neuropil threads. Acta Neuropathol. 87, 554–567. doi: 10.1007/bf00293315
Chun, H., and Lee, C. J. (2018). Reactive astrocytes in Alzheimer’s disease: a double-edged sword. Neurosci. Res. 126, 44–52. doi: 10.1016/j.neures.2017.11.012
D’Andrea, M. R., Reiser, P. A., Gumula, N. A., Hertzog, B. M., and Andrade-Gordon, P. (2001). Application of triple immunohistochemistry to characterize amyloid plaque-associated inflammation in brains with Alzheimer’s disease. Biotech. Histochem. 76, 97–106. doi: 10.1080/714028132
DeVos, S. L., Miller, R. L., Schoch, K. M., Holmes, B. B., Kebodeaux, C. S., Wegener, A. J., et al. (2017). Tau reduction prevents neuronal loss and reverses pathological tau deposition and seeding in mice with tauopathy. Sci. Transl. Med. 9:eaag0481. doi: 10.1126/scitranslmed.aag0481
Dickson, D. W. (1997). The pathogenesis of senile plaques. J. Neuropathol. Exp. Neurol. 56, 321–339. doi: 10.1097/00005072-199704000-00001
Dickson, D. W., Davies, P., Bevona, C., Van Hoeven, K. H., Factor, S. M., Grober, E., et al. (1994). Hippocampal sclerosis: a common pathological feature of dementia in very old ( > or = 80 years of age) humans. Acta Neuropathol. 88, 212–221. doi: 10.1007/bf00293396
Dubois, B., Feldman, H. H., Jacova, C., DeKosky, S. T., Barberger-Gateau, P., Cummings, J., et al. (2007). Research criteria for the diagnosis of Alzheimer’s disease: revising the NINCDS-ADRDA criteria. Lancet Neurol. 6, 734–746. doi: 10.1016/S1474-4422(07)70178-3
Duvernoy, H. M. (2005). The Human Hippocampus: Functional Anatomy, Vascularization and Serial Sections with MRI. 3rd Edn. Berlin, Heidelberg: Springer
Esiri, M. M., Hyman, B. T., Beyreuther, K., and Masters, C. L. (1997). “Aging and dementia,” in Greenfield’s Neuropathology, eds D. I. Graham and P. I. Lantos (London: Arnold), 153–233.
Ferrer, I. (2012). Defining Alzheimer as a common age-related neurodegenerative process not inevitably leading to dementia. Prog. Neurobiol. 97, 38–51. doi: 10.1016/j.pneurobio.2012.03.005
Fillenbaum, G. G., van Belle, G., Morris, J. C., Richard, C., Mirra, S. S., Davis, P. C., et al. (2008). Consortium to establish a registry for Alzheimer’s disease CERAD: the first twenty years. Alzheimers Dement. 4, 96–109. doi: 10.1016/j.jalz.2007.08.005
Furcila, D., DeFelipe, J., and Alonso-Nanclares, L. (2018). A study of amyloid-b and phosphotau in plaques and neurons in the hippocampus of Alzheimer’s disease patients. J. Alzheimers Dis. 64, 417–435. doi: 10.3233/jad-180173
Garcia-Marin, V., Blazquez-Llorca, L., Rodriguez, J.-R., Boluda, S., Muntane, G., Ferrer, I., et al. (2009). Diminished perisomatic GABAergic terminals on cortical neurons adjacent to amyloid plaques. Front. Neuroanat. 3:28. doi: 10.3389/neuro.05.028.2009
Giannakopoulos, P., Herrmann, F. R., Bussiere, T., Bouras, C., Kövari, E., Perl, D. P., et al. (2003). Tangle and neuron numbers, but not amyloid load, predict cognitive status in Alzheimer’s disease. Neurology 60, 1495–1500. doi: 10.1212/01.wnl.0000063311.58879.01
Goedert, M., Wischik, C. M., Crowther, R. A., Walker, J. E., and Klug, A. (1988). Cloning and sequencing of the cDNA encoding a core protein of the paired helical filament of Alzheimer disease: identification as the microtubule-associated protein tau. Proc. Natl. Acad. Sci. U S A 85, 4051–4055. doi: 10.1073/pnas.85.11.4051
Gong, C.-X., and Iqbal, K. (2008). Hyperphosphorylation of microtubule-associated protein tau: a promising therapeutic target for Alzheimer disease. Curr. Med. Chem. 15, 2321–2328. doi: 10.2174/092986708785909111
Gonzalez-Riano, C., Tapia-González, S., García, A., Muñoz, A., DeFelipe, J., and Barbas, C. (2017). Metabolomics and neuroanatomical evaluation of post-mortem changes in the hippocampus. Brain Struct. Funct. 222, 2831–2853. doi: 10.1007/s00429-017-1375-5
Grundke-Iqbal, I., Iqbal, K., Tung, Y. C., Quinlan, M., Wisniewski, H. M., and Binder, L. I. (1986). Abnormal phosphorylation of the microtubule-associated protein tau (tau) in Alzheimer cytoskeletal pathology. Proc. Natl. Acad. Sci. U S A 83, 4913–4917. doi: 10.1073/pnas.83.13.4913
Gundersen, H. J. G. (1988). The nucleator. J. Microsc. 151, 3–21. doi: 10.1111/j.1365-2818.1988.tb04609.x
Hoenig, M. C., Bischof, G. N., Hammes, J., Faber, J., Fliessbah, K., van Eimeren, T., et al. (2017). Tau pathology and cognitive reserve in Alzheimer’s disease. Neurobiol. Aging 57, 1–7. doi: 10.1016/j.neurobiolaging.2017.05.004
Hyman, B. T., Phelps, C. H., Beach, T. G., Bigio, E. H., Cairns, N. J., Carrillo, M. C., et al. (2012). National insitute on aging- Alzheimer’s association guidelines for the neuropathologic assessment of Alzheimer’s disease. Alzheimers Dement. 8, 1–13. doi: 10.1016/j.jalz.2011.10.007
Hyman, B. T., Van Hoesen, G. W., and Damasio, A. R. (1990). Memory-related neural systems in Alzheimer’s disease: an anatomic study. Neurology 40, 1721–1730. doi: 10.1212/wnl.40.11.1721
Hyman, B. T., Van Hoesen, G. W., Kromer, L. J., and Damasio, A. R. (1986). Perforant pathway changes and the memory impairment of Alzheimer’s disease. Ann. Neurol. 20, 472–481. doi: 10.1002/ana.410200406
Ittner, L. M., and Götz, J. (2011). Amyloid-β and tau—a toxic pas de deux in Alzheimer’s disease. Nat. Rev. Neurosci. 12, 65–72. doi: 10.1038/nrn2967
Jung, C. K. E., Keppler, K., Steinbach, S., Blazquez-Llorca, L., and Herms, J. (2015). Fibrillar amyloid plaque formation precedes microglial activation. PLoS One 10:e0119768. doi: 10.1371/journal.pone.0119768
Kimura, T., Ono, T., Takamatsu, J., Yamamoto, H., Ikegami, K., Kondo, A., et al. (1996). Sequential changes of tau-site-specific phosphorylation during development of paired helical filaments. Dementia 7, 177–181. doi: 10.1159/000106875
Lazarczyk, M. J., Hof, P. R., Bouras, C., and Giannakopoulos, P. (2012). Preclinical Alzheimer disease: identification of cases at risk among cognitively intact older individuals. BMC Med. 10:127. doi: 10.1186/1741-7015-10-127
Llorens-Martín, M., Blazquez-Llorca, L., Benavides-Piccione, R., Rabano, A., Hernandez, F., Avila, J., et al. (2014). Selective alterations of neurons and circuits related to early memory loss in Alzheimer’s disease. Front. Neuroanat. 8:38. doi: 10.3389/fnana.2014.00038
Lyck, L., Santamaria, I. D., Pakkenberg, B., Chemnitz, J., Schrøder, H. D., Finsen, B., et al. (2009). An empirical analysis of the precision of estimating the numbers of neurons and glia in human neocortex using a fractionator-design with sub-sampling. J. Neurosci. Methods 182, 143–156. doi: 10.1016/j.jneumeth.2009.06.003
Mai, J., Majtanik, M., and Paxinos, G. (2016). Atlas of the Human Brain. 4th Edn. San Diego, CA: Academic Press.
Merino-Serrais, P., Benavides-Piccione, R., Blazquez-Llorca, L., Kastanauskaite, A., Rábano, A., Avila, J., et al. (2013). The influence of phospho-tau on dendritic spines of cortical pyramidal neurons in patients with Alzheimer’s disease. Brain 136, 1913–1928. doi: 10.1093/brain/awt088
Merino-Serrais, P., Knafo, S., Alonso-Nanclares, L., Fernaud-Espinosa, I., and DeFelipe, J. (2011). Layer-specific alterations to CA1 dendritic spines in a mouse model of Alzheimer’s disease. Hippocampus 21, 1037–1044. doi: 10.1002/hipo.20861
Mirra, S. S., Heyman, A., McKeel, D., Sumi, S. M., Crain, B. J., Brownlee, L. M., et al. (1991). The consortium to establish a registry for Alzheimer’s disease (CERAD). Part II. Standardization of the neuropathologic assessment of Alzheimer’s disease. Neurology 41, 479–486. doi: 10.1212/wnl.41.4.479
Mondragón-Rodríguez, S., Perry, G., Luna-Muñoz, J., Acevedo-Aquino, M. C., and Williams, S. (2014). Phosphorylation of tau protein at sites Ser(396–404) is one of the earliest events in Alzheimer’s disease and down syndrome. Neuropathol. Appl. Neurobiol. 40, 121–135. doi: 10.1111/nan.12084
Morris, G. P., Clark, I. A., and Vissel, B. (2018). Questions concerning the role of amyloid-β in the definition, aetiology and diagnosis of Alzheimer’s disease. Acta Neuropathol. 136, 663–689. doi: 10.1007/s00401-018-1918-8
Nelson, P. T., Alafuzoff, I., Bigio, E. H., Bouras, C., Braak, H., Cairns, N. J., et al. (2012). Correlation of Alzheimer disease neuropathologic changes with cognitive status: a review of the literature. J. Neuropathol. Exp. Neurol. 71, 362–381. doi: 10.1097/NEN.0b013e31825018f7
Pakkenberg, B., and Gundersen, H. J. (1997). Neocortical neuron number in humans: effect of sex and age. J. Comp. Neurol. 384, 312–320. doi: 10.1002/(SICI)1096-9861(19970728)384:2<312::AID-CNE10>3.0.CO;2-K
Parbo, P., Ismail, R., Hansen, K. V., Amidi, A., Mårup, F. H., Gottrup, H., et al. (2017). Brain inflammation accompanies amyloid in the majority of mild cognitive impairment cases due to Alzheimer’s disease. Brain 140, 2002–2011. doi: 10.1093/brain/awx120
Petersen, R. C., Aisen, P. S., Beckett, L. A., Donohue, M. C., Gamst, A. C., Harvey, D. J., et al. (2009). Alzheimer’s disease neuroimaging initiative (ADNI): clinical characterization. Neurology 74, 201–209. doi: 10.1212/WNL.0b013e3181cb3e25
Polanco, J. C., Li, C., Bodea, L.-G., Martinez-Marmol, R., Meunier, F. A., and Götz, J. (2017). Amyloid-β and tau complexity—towards improved biomarkers and targeted therapies. Nat. Rev. Neurol. 14, 22–39. doi: 10.1038/nrneurol.2017.162
Rajendran, L., Honsho, M., Zahn, T. R., Keller, P., Geiger, K. D., Verkade, P., et al. (2006). Alzheimer’s disease β-amyloid peptides are released in association with exosomes. Proc. Natl. Acad. Sci. U S A 103, 11172–11177. doi: 10.1073/pnas.0603838103
Regalado-Reyes, M., Furcila, D., Hernández, F., Ávila, J., DeFelipe, J., and León-Espinosa, G. (2019). Phospho-tau changes in the human CA1 during Alzheimer’s disease progression. J. Alzheimers Dis. 69, 277–288. doi: 10.3233/jad-181263
Robinson, J. L., Lee, E. B., Xie, S. X., Rennert, L., Suh, E., Bredenberg, C., et al. (2018). Neurodegenerative disease concomitant proteinopathies are prevalent, age-related and APOE4-associated. Brain 141, 2181–2193. doi: 10.1093/brain/awy146
Sepulcre, J., Sabuncu, M. R., Becker, A., Sperling, R., and Johnson, K. A. (2013). In vivo characterization of the early states of the amyloid-β network. Brain 136, 2239–2252. doi: 10.1093/brain/awt146
Serrano-Pozo, A., Muzikansky, A., Gómez-Isla, T., Growdon, J. H., Betensky, R. A., Frosch, M. P., et al. (2013). Differential relationships of reactive astrocytes and microglia to fibrillar amyloid deposits in Alzheimer disease. J. Neuropathol. Exp. Neurol. 72, 462–471. doi: 10.1097/nen.0b013e3182933788
Simic, G., Kostovic, I., Winblad, B., and Bogdanovic, N. (1997). Volume and number of neurons of the human hippocampal formation in normal aging and Alzheimer’s disease. J. Comp. Neurol. 379, 482–494. doi: 10.1002/(sici)1096-9861(19970324)379:4<482::aid-cne2>3.0.co;2-z
Spires-Jones, T. L., Attems, J., and Thal, D. R. (2017). Interactions of pathological proteins in neurodegenerative diseases. Acta Neuropathol. 134, 187–205. doi: 10.1007/s00401-017-1709-7
Steffener, J., and Stern, Y. (2012). Exploring the neural basis of cognitive reserve in aging. Biochim. Biophys. Acta 1822, 467–473. doi: 10.1016/j.bbadis.2011.09.012
Stern, Y. (2012). Cognitive reserve in ageing and Alzheimer’s disease. Lancet Neurol. 11, 1006–1012. doi: 10.1016/S1474-4422(12)70191-6
Su, J. H., Cummings, B. J., and Cotman, C. W. (1994). Early phosphorylation of tau in Alzheimer’s disease occurs at Ser-202 and is preferentially located within neurites. Neuroreport 5, 2358–2362. doi: 10.1097/00001756-199411000-00037
Su, J. H., Cummings, B. J., and Cotman, C. W. (1996). Plaque biogenesis in brain aging and Alzheimer’s disease: I. Progressive changes in phosphorylation states of paired helical filaments and neurofilaments. Brain Res. 739, 79–87. doi: 10.1016/s0006-8993(96)00811-6
Takahashi, R. H., Nagao, T., and Gouras, G. K. (2017). Plaque formation and the intraneuronal accumulation of β-amyloid in Alzheimer’s disease. Pathol. Int. 67, 185–193. doi: 10.1111/pin.12520
Tang, Y., Nyengaard, J. R., De Groot, M. G., and Gundersen, H. J. G. (2001). Total regional and global number of synapses in the human brain neocortex. Synapse 41, 258–273. doi: 10.1002/syn.1083
Thal, D. R., Rüb, U., Orantes, M., and Braak, H. (2002). Phases of A β-deposition in the human brain and its relevance for the development of AD. Neurology 58, 1791–1800. doi: 10.1212/wnl.58.12.1791
Tucker, A. M., and Stern, Y. (2011). Cognitive reserve in aging. Curr. Alzheimer Res. 8, 354–360. doi: 10.2174/156720511795745320
van de Pol, L., Hensel, A., Barkhof, F., Gertz, H., Scheltens, P., and van der Flier, W. (2006). Hippocampal atrophy Alzheimer disease: age matters. Neurology 66, 236–238. doi: 10.1212/01.wnl.0000194240.47892.4d
Velez-Pardo, C., Arellano, J. I., Cardona-Gomez, P., Jimenez Del Rio, M., Lopera, F., and DeFelipe, J. (2004). CA1 hippocampal neuronal loss in familial Alzheimer’s disease presenilin-1 E280A mutation is related to epilepsy. Epilepsia 45, 751–756. doi: 10.1111/j.0013-9580.2004.55403.x
von Gunten, A., Kövari, E., Bussière, T., Rivara, C. B., Gold, G., Bouras, C., et al. (2006). Cognitive impact of neuronal pathology in the entorhinal cortex and CA1 field in Alzheimer’s disease. Neurobiol. Aging 27, 270–277. doi: 10.1016/j.neurobiolaging.2005.02.008
West, M. J., and Gundersen, H. J. G. (1990). Unbiassed stereological estimation of the number of neurons in the human hippocampus. J. Comp. Neurol. 296, 1–22. doi: 10.1002/cne.902960102
West, M. J., Kawas, C. H., Stewart, W. F., Rudow, G. L., and Troncoso, J. C. (2004). Hippocampal neurons in pre-clinical Alzheimer’s disease. Neurobiol. Aging 25, 1205–1212. doi: 10.1016/j.neurobiolaging.2003.12.005
Keywords: amyloid-β protein, dementia, hippocampal formation, neuronal density, plaques density, neurodegeneration, stereology
Citation: Furcila D, Domínguez-Álvaro M, DeFelipe J and Alonso-Nanclares L (2019) Subregional Density of Neurons, Neurofibrillary Tangles and Amyloid Plaques in the Hippocampus of Patients With Alzheimer’s Disease. Front. Neuroanat. 13:99. doi: 10.3389/fnana.2019.00099
Received: 10 June 2019; Accepted: 28 November 2019;
Published: 19 December 2019.
Edited by:
Patrick R. Hof, Icahn School of Medicine at Mount Sinai, United StatesReviewed by:
Goran Simic, University of Zagreb, CroatiaDeniz Yilmazer-Hanke, University of Ulm, Germany
Copyright © 2019 Furcila, Domínguez-Álvaro, DeFelipe and Alonso-Nanclares. This is an open-access article distributed under the terms of the Creative Commons Attribution License (CC BY). The use, distribution or reproduction in other forums is permitted, provided the original author(s) and the copyright owner(s) are credited and that the original publication in this journal is cited, in accordance with accepted academic practice. No use, distribution or reproduction is permitted which does not comply with these terms.
*Correspondence: Lidia Alonso-Nanclares, aidil@cajal.csic.es