Differences in vocal brain areas and astrocytes between the house wren and the rufous-tailed hummingbird
 Carolina López-Murillo1
  Santiago Hinestroza-Morales1
  Pablo Henny2
  Jorge Toledo3
  Gloria Patricia Cardona-Gómez4
  Héctor Rivera-Gutiérrez5
  Rafael Posada-Duque1*
- 1Área de Neurofisiología Celular, Grupo de Neurociencias de Antioquia, Instituto de Biología, Facultad de Ciencias Exactas y Naturales, Universidad de Antioquia, Medellin, Colombia
- 2Laboratorio de Neuroanatomía, Departamento de Anatomía, and Centro Interdisciplinario de Neurociencia, NeuroUC, Escuela de Medicina, Pontificia Universidad Católica de Chile, Santiago, Chile
- 3Scientific Equipment Network REDECA, Faculty of Medicine, University of Chile, Santiago, Chile
- 4Área de Neurobiología Celular y Molecular, Grupo de Neurociencias de Antioquia, Facultad de Medicina, Sede de Investigaciones Universitarias, Universidad de Antioquia, Medellin, Colombia
- 5Grupo de Investigación de Ecología y Evolución de Vertebrados, Instituto de Biología, Universidad de Antioquia, Medellin, Colombia
The house wren shows complex song, and the rufous-tailed hummingbird has a simple song. The location of vocal brain areas supports the song’s complexity; however, these still need to be studied. The astrocytic population in songbirds appears to be associated with change in vocal control nuclei; however, astrocytic distribution and morphology have not been described in these species. Consequently, we compared the distribution and volume of the vocal brain areas: HVC, RA, Area X, and LMAN, cell density, and the morphology of astrocytes in the house wren and the rufous-tailed hummingbird. Individuals of the two species were collected, and their brains were analyzed using serial Nissl- NeuN- and MAP2-stained tissue scanner imaging, followed by 3D reconstructions of the vocal areas; and GFAP and S100β astrocytes were analyzed in both species. We found that vocal areas were located close to the cerebral midline in the house wren and a more lateralized position in the rufous-tailed hummingbird. The LMAN occupied a larger volume in the rufous-tailed hummingbird, while the RA and HVC were larger in the house wren. While Area X showed higher cell density in the house wren than the rufous-tailed hummingbird, the LMAN showed a higher density in the rufous-tailed hummingbird. In the house wren, GFAP astrocytes in the same bregma where the vocal areas were located were observed at the laminar edge of the pallium (LEP) and in the vascular region, as well as in vocal motor relay regions in the pallidum and mesencephalon. In contrast, GFAP astrocytes were found in LEP, but not in the pallidum and mesencephalon in hummingbirds. Finally, when comparing GFAP astrocytes in the LEP region of both species, house wren astrocytes exhibited significantly more complex morphology than those of the rufous-tailed hummingbird. These findings suggest a difference in the location and cellular density of vocal circuits, as well as morphology of GFAP astrocytes between the house wren and the rufous-tailed hummingbird.
Highlights
• This comparative study shows a differential spatial localization of vocal areas between the house wren and rufous-tailed hummingbird.
• The LMAN of the rufous-tailed hummingbird was more prominent and had higher cell density, while Area X was shown to be higher cell density in the house wren.
• GFAP astrocytes were more abundant in the house wren compared to the rufous-tailed hummingbird.
• GFAP astrocytes from the pallium of house wren exhibited greater morphology complexity than the rufous-tailed hummingbird.
Introduction
Vocalization in birds is a complex behavior essential to finding mates, defending territory, and maintaining social cohesion (Beecher and Brenowitz, 2005; Mooney et al., 2007). Some birds learn and memorize songs composed of sequences of various notes with different frequency and amplitude patterns over time, with variations in repertoire between species ranging from complex (many songs and compositions) to simple songs (few songs and notes) (Brainard and Doupe, 2002; Araya and Wright, 2013). Vocal learning in birds has been detected in three different groups: hummingbirds (Apodiformes), parrots (Psittaciformes), and songbirds (Passeriformes, Oscines) (Jiménez et al., 2001; Scott, 2005; Mooney, 2009a). Although parrots and songbirds are phylogenetically related groups, hummingbirds do not share the same evolutionary history (Skutch, 1931; Baptista and Schuchmann, 1990; Williams and Houtman, 2008; Araya and Wright, 2013). Therefore, vocal learning may have had an independent evolutionary origin in these three groups.
The learning and production of song in birds involves a neural pathway connecting different vocal brain regions (Fortune and Margoliash, 1992; Smith, 1996) and the transmission of signals to the syrinx nuclei and respiratory pathways (Brainard and Doupe, 2002; Mooney, 2009a), thereby facilitating the production of song (Bradbury and Vehrencamp, 2011; Roberts and Mooney, 2013; Giordani et al., 2018). The bird’s brain has a nuclear organization consisting of regions such as the pallium, striatum, and pallidum (Jarvis et al., 2005; Pfenning et al., 2014). Hummingbirds and songbirds belong to two groups of birds that have standard forebrain circuits, involved in song production (Gahr, 2000); parts of this circuit are organized as nuclear-like structures. Neuroanatomical differences in the vocal brain areas of common tropical species that may serve as model species, such as the house wren and the rufous-tailed hummingbird, have yet to be described.
The neural circuit involved in acquiring and producing a learned song is composed of several interconnected brain regions that form three main pathways. The Song Motor Pathway (SMP), controls song production and primarily involves the high vocal center (HVC) located in the posterior nidopallium and the robust nucleus of the arcopallium (RA). The Anterior Forebrain Pathway (AFP) mediates song learning and plasticity and is mainly composed of Area X in the striatum and the lateral magnocellular nucleus of the anterior nidopallium (LMAN) (Sibley and Ahlquist, 1990; Araya and Wright, 2013). These two pathways converge with a third pathway, the auditory pathway, allowing perception of songs from the same species, different species, and even from the same individual (Nottebohm et al., 1976; Jarvis et al., 2000). The three pathways converge in the HVC nucleus, which plays a fundamental role in song learning and production (Mello, 2004; Reiner et al., 2004b). It has been observed that vocal areas such as the HVC, RA, and Area X show significant variations in size and shape, even within the same order of birds, and that these differences are closely related to the breeding season (Scharff and Nottebohm, 1991; Smith, 1996; Gulledge and Deviche, 1997; Smith et al., 1997; Brenowitz et al., 1998; Soma et al., 1999; Gahr, 2000; Poirier et al., 2008; Hall et al., 2010; Vellema et al., 2010, 2011; Fitch and Jams, 2015). These morphological variations between species and orders are pertinent to understanding brain organization concerning to song regions and their impact on the specific vocal capabilities of each species.
Song type and an individual’s learning stage can induce changes in the neural connections between different areas that, in turn, affect neuron properties. During the breeding season, there is an increase in recruited neurons in the HVC, mainly from the ventricular zone and olfactory bulb, suggesting a higher abundance during reproductive periods (Nieto, 2003; Kopec and Carew, 2013). However, it is essential to recognize the role of glial cells in ensuring the proper functioning of the central nervous system, such as the involvement of astrocytes in maintaining cerebral homeostasis and regulating synaptic transmission and neuronal plasticity in the vocal brain circuits (Tramontin and Brenowitz, 2000; Duncan and Saldanha, 2011; Haim and Rowitch, 2016; Zhang et al., 2016; Allen and Eroglu, 2017; Bailey et al., 2017). Although there are similarities in the organization of vocal areas between the different orders of birds (Fitch and Jams, 2015), differences have been documented in both the types of cells involved in vocal production and their distribution in the learning areas (Jarvis et al., 2000). A detailed study of this variation in the distribution and apparition of the vocal areas allows us to deepen our understanding of the neuroanatomical basis of vocalization in different wild bird species (Soma et al., 1999).
Astrocytes constitute a remarkably diverse cell population, demonstrating distinct morphologies, molecular profiles, anatomical distributions, physiologies, and functions across various species (Falcone, 2022). Different astrocyte markers such as GFAP and S100β exist. GFAP (Glial Fibrillary Acidic Protein) is considered a prototypical marker that provides information about the shape and function of astrocytes. This structural protein of the cytoskeleton plays a role in intracellular transport and is related to the integrity of the neurovascular unit (Wynne et al., 2008; Duncan et al., 2013). Regarding astrocytic protein S100β, it plays an important role in regulating intracellular calcium levels in astrocytes, influencing calcium homeostasis in the brain and, consequently, synaptic transmission (W’mningham-Major et al., 1989; Michetti et al., 2019). Nevertheless, most research on astrocytes has focused primarily on mammals and rodents, which are highly complex and heterogeneous, possibly due to the complexity of the central nervous system and its energy demands (Miller and Raff, 1984; Oberheim et al., 2009; Verkhratsky et al., 2019; Falcone, 2022). Astrocyte morphology and functions in birds are like those of mammals (Falcone, 2022). During the breeding season, an increase in the number and complexity of GFAP astrocytes has been observed in the HVC area of the canary Serinus canaria (Kafitz et al., 1999). Furthermore, vimentin astrocytes are prominent in the juvenile stage and in the fall, with a simpler morphology compared to GFAP astrocytes (Nottebohm et al., 1986; Kafitz et al., 1999; Kubikova et al., 2014). It has been observed that species with larger brains and more developed cognitive abilities have a higher density and complexity of astrocytes (Diamond et al., 1985; Colombo et al., 2006; Eroglu et al., 2009; Oberheim et al., 2009; Jeff and Cagla, 2017). These investigations suggest that the appearance of astrocytes contributes to increased brain size and behavior complexity (Kálman and Pritz, 2001; Falcone, 2022) it necessary to clarify the role of astrocytes in volitional communication, which is considered a complex behavior that occurs in birds as song learning.
Astrocytes appear to modulate vocal learning and production circuits, a sexually selected trait in many bird species (Gadagkar et al., 2016; Turk et al., 2021). There are few studies characterizing astrocytes in vocal areas, which have been conducted on migratory birds and non-passerine birds (Steinman et al., 2013; Carvalho-Paulo et al., 2018; Karatu et al., 2020). In mammals, astrocytes participate in dopaminergic circuits and motor control, which suggests that these glial cells have an essential role in the modulation of vocal production circuits, which is a sexual characteristic in many bird species (Gadagkar et al., 2016; Turk et al., 2021). Although astrocytes may play a role in somatosensory circuit refinement during postnatal stages (Molofsky et al., 2014), their involvement in adult birds has been poorly investigated.
Despite the distant phylogenetic relationship between hummingbirds and songbirds, there is evidence of convergent learned singing in these species (Gahr, 2000; Jarvis et al., 2000; Araya and Wright, 2013; Johnson and Clark, 2020; Kuhl et al., 2021). The functionality of hummingbird singing is equivalent to that of songbirds, and this character is generally considered ancestral and widespread but only sporadically present (Monte et al., 2023). Notably, many tropical hummingbirds coexisting with songbirds have remarkable songs (Araya and Wright, 2013) that vary in complexity. Bird species produce songs with varying temporal and structural complexity (Clive, 2008; Bradbury and Vehrencamp, 2011). While the definition of acoustic complexity is still debated (Mikula et al., 2018), the number of different acoustic elements produced, known as repertoire size, is considered a reliable measure of complexity and provides biologically relevant information (Clive, 2008). Bird species can exhibit simple (formed by few acoustic elements) or complex (many different acoustic elements) repertoires. While songbirds (Passeriformes, suborder Passeri) produce and learn complex songs, hummingbirds are known for their simpler vocalizations. Two well-characterized species in Colombia exemplify this contrast: the house wren (Passerine oscine: Troglodytes aedon (Ta)) produces complex songs with many different elements and with high variation in frequency and temporal characteristics. On the other hand, there are hummingbirds such as the rufous-tailed hummingbird [Trochiliforme: Amazilia tzacatl (At)], which produce songs with few different acoustic elements and with low variation in acoustic structure. Examples of such varied acoustic complexity are depicted in Figure 1.
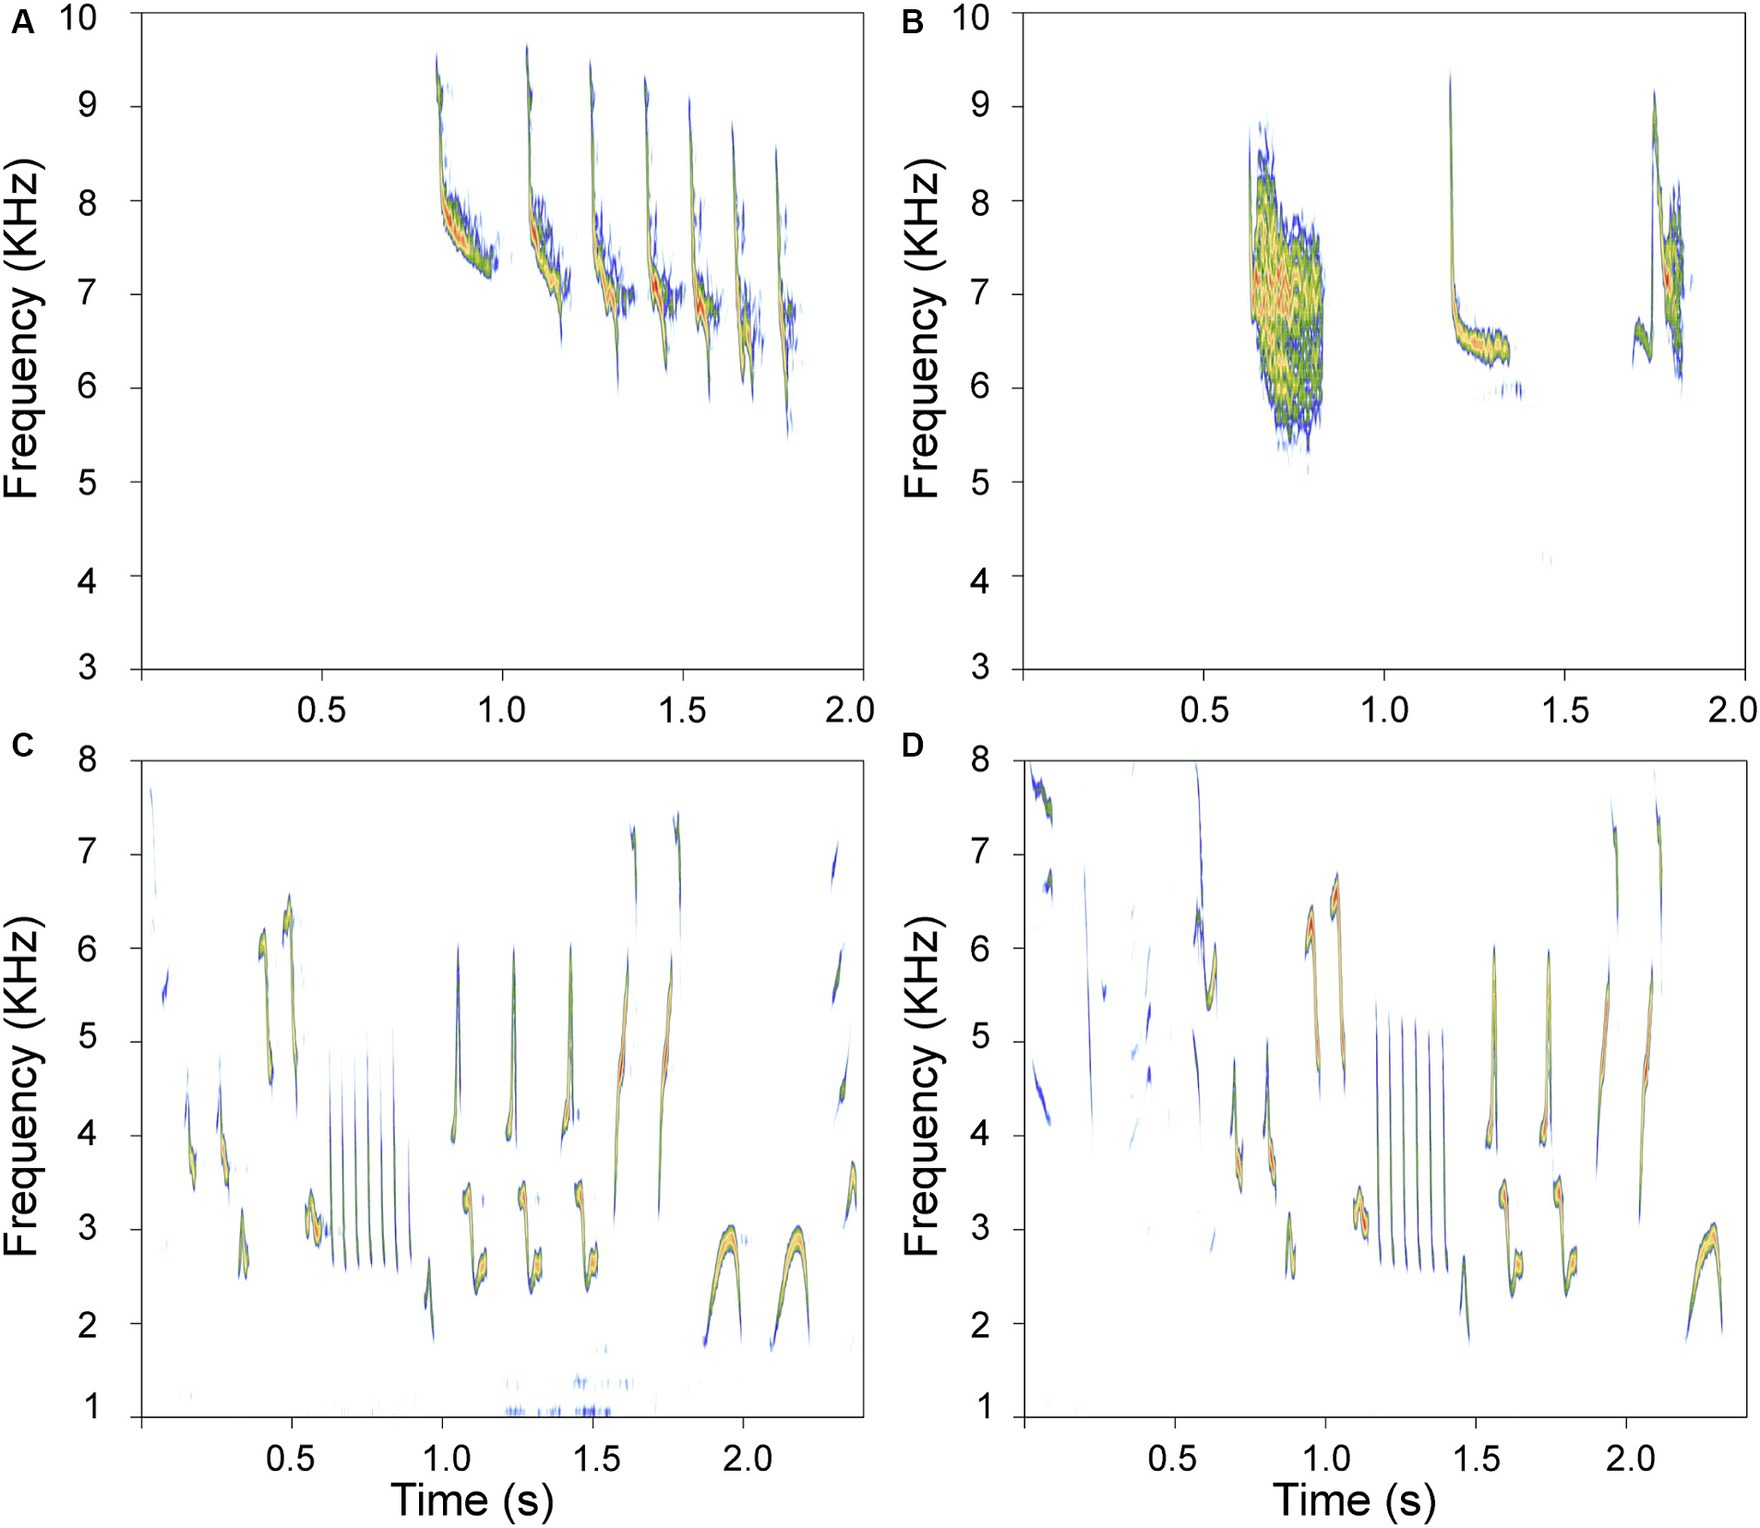
Figure 1. Examples of songs differing in complexity. (A,B) are sonograms of simple songs produced by the rufous-tailed hummingbird; (C,D) depict complex songs produced by the house wren. These spectrograms show representative motifs recorded from a house wren and available recordings of adult Rufous-tailed hummingbirds at www.Xeno-Canto.org (XC821348, XC843613). Each motif was taken from a different song. Note that each rendition is very different for each species.
Animal behavior is not solely driven by neuronal activity but involves coordinated interactions between astrocytes and neurons (Kofuji and Araque, 2021). Understanding the role of astrocytes in vocal brain circuits is crucial for a comprehensive understanding of how behaviors originate and can be complex. Since the astrocytes are critically involved in the control of complex motor behaviors, such as vocal circuits (Khan et al., 2001; Morquette et al., 2015; Xin et al., 2019; Corkrum et al., 2020; Turk et al., 2021; Turk and SheikhBahaei, 2022), and these species differing song complexities; we hypothesized differences in brain vocal areas, such as more relative size, cell density, and a more complex astrocyte structure and organization in the house wren compared to a rufous-tailed hummingbird. Also, since these species frequently perch and cohabit rural and semi-urban landscapes along with their ease of observation in tropical regions, we conducted a study comparing the distribution of the HVC, RA, Area X, and LMAN areas, cell density, and astrocyte morphology in these wild species.
Materials and methods
Bird information
Male individuals of the house wren (Ta) (n = 9) and the rufous-tailed hummingbird (At) (n = 4) were collected at the University of Antioquia – Campus Sede Oriente, Carmen de Viboral. The same sampling effort was made for both species in two reproductive seasons; however, collecting house wren was much easier due to their territorial behavior and abundance. Juvenile and female birds were avoided to preserve their population index and to discount any neurobiological differences due to age. These species are considered common and abundant, classified as “Least Concern” in Colombia’s birds red list (Echeverry-Galvis et al., 2022). Additionally, they are widely distributed and relatively common in both urban areas and agricultural landscapes. Furthermore, these species have a broad distribution and are relatively housed in urban areas and agroscapes (Scott, 2005). The collection of biological specimens is covered by the framework permit for the collection of wild specimens for non-commercial purposes, which was issued by ANLA in resolution 1,461 of December 3, 2014. The size sampling permission and the procedure was approved by the Ethics Committee for Animal Experimentation at the University (CEEA), resolution 139 of March 29, 2021.
Wild bird collection
Birds were captured using the “Manual of Methods for Biodiversity Inventory Development” (Álvarez et al., 2004). They were collected using four 12 × 2 m mist nets with 30 mm mesh eye nets, each checked every 20 min from 6:00 to 13:00 h. Captured individuals were identified as sacrificed, and various morphometric parameters were measured, including sex, mass, exposed and total culmen length, beak height and width, closed wing length, and tarsus length. For euthanasia, isoflurane was administered at a dose of 2 mL per 125 g B.W. or less in a sealed box containing a cotton ball soaked with the anesthetic. The box was allowed to saturate with the anesthetic for at least 3 min, and then the bird was placed in the anesthesia chamber, the lid was closed, and the birds were left undisturbed for 30–60 s until they became immobile. If they remained active after this time, the dose was re-administered. After the last breath of the bird, a 30-s waiting period was observed, then decapitation was performed, and the skull was dissected to extract the brain. During the procedure, a portion of the metatarsus, breast, liver, and gonads were also collected for pathological analyzes and hormonal status. The brain of one individual of the house wren was not extracted but was preserved in a 4% paraformaldehyde solution, along with the bony part of the head. Table 1 depicts the collected individuals’ information.
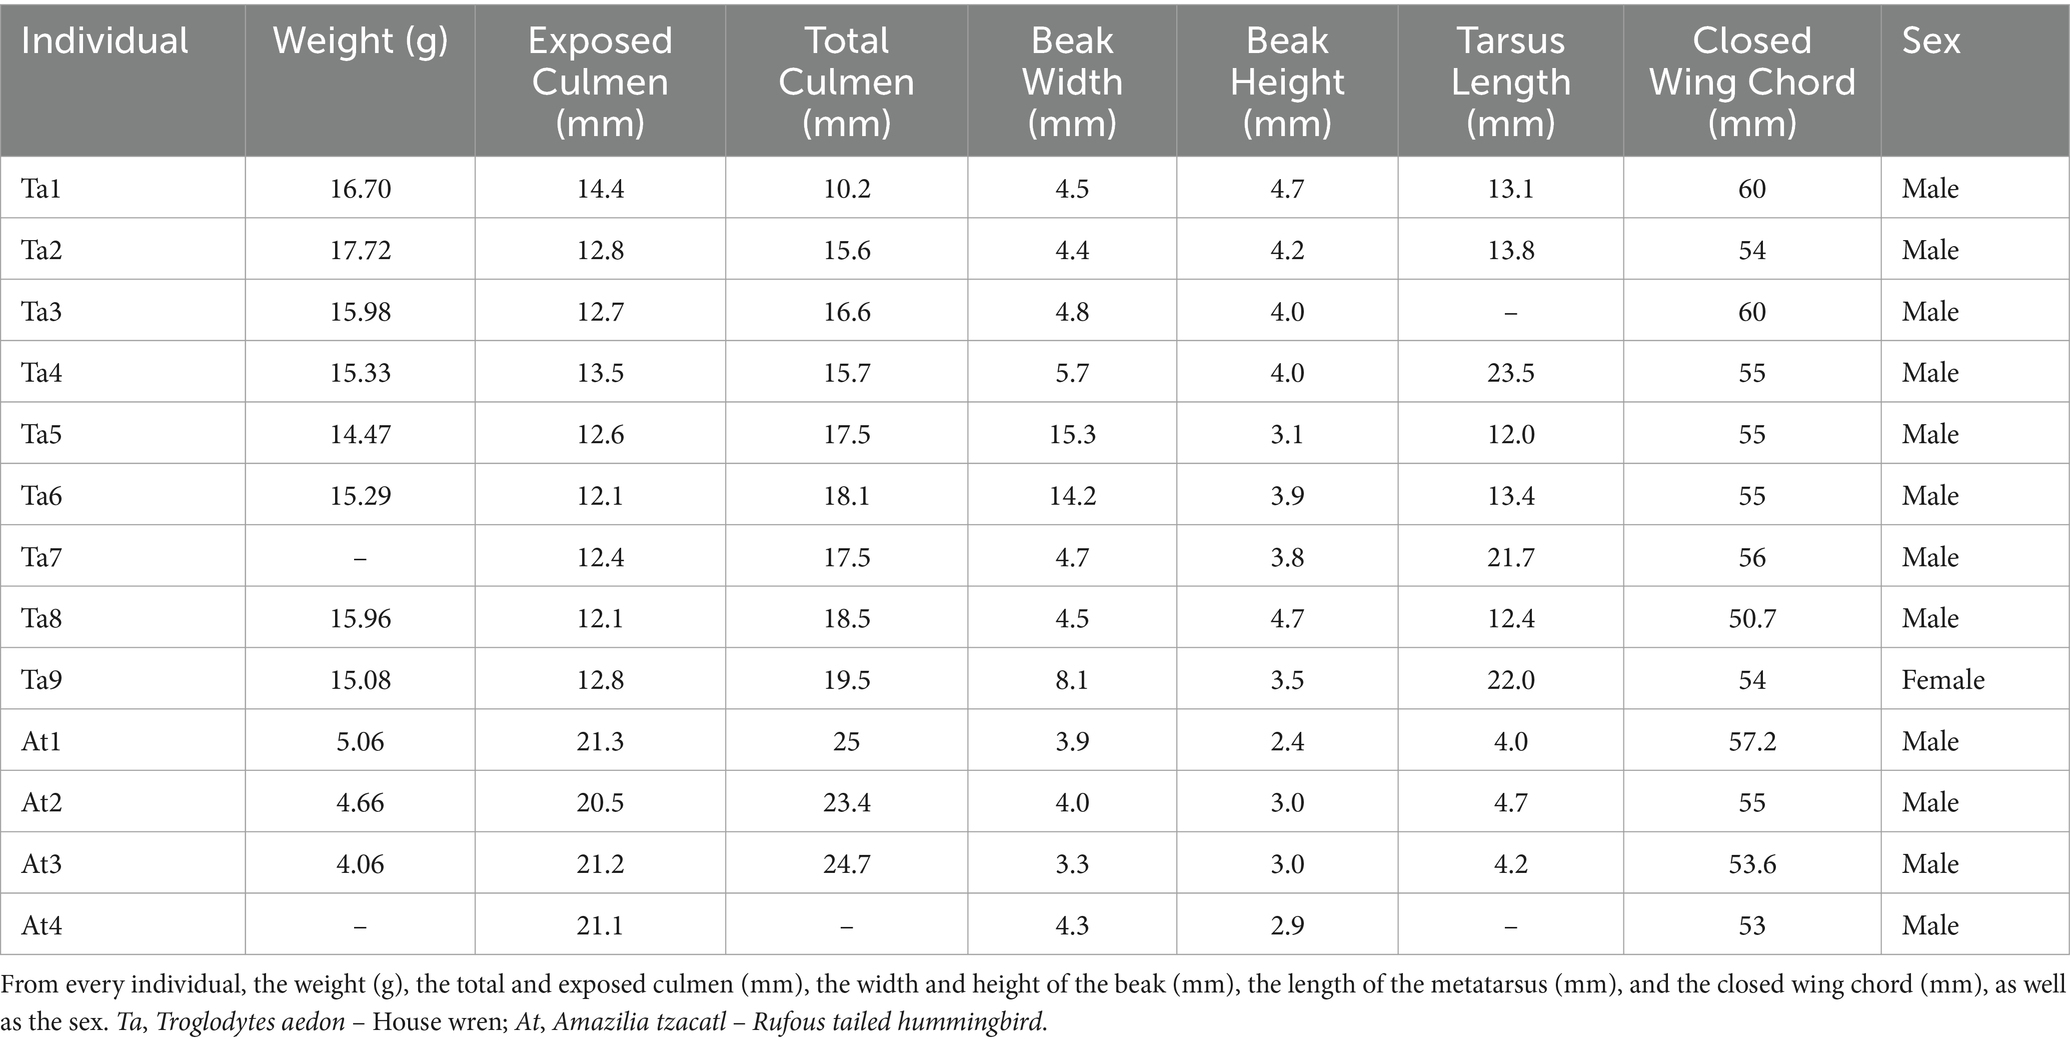
Table 1. Data of collected birds.
After extracting the brain, it was washed with PBS 1X solution and then fixed in 4% paraformaldehyde in a cytoskeleton buffer with changes every 24 h for 3 days (Posada-Duque et al., 2013). Subsequently, a sucrose gradient was performed with concentrations of 7, 25, and 30% over three consecutive days, increasing the concentration daily. The brains that were not used immediately were stored at −20°C in a cryopreservative solution; the rest were sectioned using a cryostat.
Tissue sectioning
One brain was selected for each of the two species. Once the sucrose gradient process was completed, the brains were washed with phosphate Buffer (PB) (0.1 M pH: 7.4) and a sagittal cut of the hemispheres was made using a blade. Then, using a 0.5 mm needle, four lateral-to-medial perforations were made along each hemisphere. This was done to subsequently locate the perforations in the slices and align the tissues for the 3D reconstruction of the main vocal areas. Next, parasagittal sections of the entire hemisphere were prepared using the cryostat (LEICA CM1850 UV). Each hemisphere embedded in OCT was positioned laterally on the specimen holder, with a weight on top, and allowed to freeze (approximately 3–5 min). Then, the entire hemisphere was sliced using a blade (LEICA 819 - Low Profile) with blade changes every 20 cuts, and the sections stored in 48-well plates with PB 0.1 M solution (pH: 7.4) + 0.1% Azide. Later, the sections were mounted on labeled glass slides (SuperFrost PLUS-0006E) in the correct order and left to dry in a dust-protected tray.
Nissl staining for the 3D reconstruction of vocal brain areas
A gradual rehydration was performed by slightly tilting each slide to quickly impregnate the tissues with 100, 70, and 50% alcohol. Then, excess alcohol was removed, through rinsing with distilled water, and allowed to drain. Next, the tissues were stained with Toluidine Blue dye [1:10] and left to act, followed by rinsing with distilled water and draining. Subsequently, dehydration was carried out using 70, 96, and 100% alcohol. The final dehydration and clearing were done in an extraction chamber using xylene, and Shandon Consul-Mount (Thermo Scientific; 9,990,440) was added to adhere the glass cover, and then the slides were left to dry.
Whole brain imaging, processing, and analysis
All the Nissls slides were scanned with a NanoZoomer-XR brightfield tissue scanner microscope (Hamamatsu), equipped with a 20x objective (NA 0.75; UPlanSApo; Olympus) using a 40x digital zoom at a single layer. They were opened with QuPath software (Bankhead et al., 2017) to perform quality control (excluding tissues with tears or folds) and export each tissue as TIFF format, considering the order of each tissue for subsequent analysis with Stereo Investigator software (MBF Bioscience - MicrobrightField, Version: 2021). One hemisphere from each species was selected to draw and obtain the 3D reconstruction of the vocal areas and perform volumetric quantification using Neurolucida Explorer software (MBF Bioscience - MicrobrightField, Version: 2021).
For the delimitation and reconstruction of the vocal areas, the following parameters were considered: i. A detailed review of the research by Karten et al. (2013) and Stokes et al. (1974) for the house wren, and the research by Jarvis et al. (2000) and Gahr (2000) for the rufous-tailed hummingbird, in order to locate the vocal areas and identify the parameters they had used. ii. The sequential order of the tissues for each species. Iii. Histological description of the shape of each area, cell labeling, and cell clustering; type of cellular labeling that distinguishes the center or interior from the border or exterior of each area. iv. Sequential and complete drawing of each of the vocal areas. v. Location of markers (icons) on the perforations made with the needle for 3D rotation and reconstruction. vi. Rotation of the tissues to fit into the tracings and markers made at each hole created with the needle. Vii. Validation of the vocal areas in a different individual from the 3D reconstruction using immunohistochemistry for the nuclear marker mouse anti-NeuN (Sigma-Aldrich; MAB377; [1:250]) and with mouse anti-MAP2 (Sigma-Aldrich; M9942; [1:250]), using different tissues that included the initial and final bregmas of the main areas of the song (Supplementary Figure S1A).
Mediolateral location of vocal nuclei
After recognizing the anatomical vocal brain nucleus, its most medial and lateral limits (in μm from midline) were determined. To compare the location and width of a given song nucleus between both species, the nucleus’s relative mediolateral limits for each species were calculated, considering 0 as the midline and 1 as the brain maximal extension. The song nuclei’s maximal width was calculated by subtracting each nucleus’s most lateral and medial limits.
Analysis of the cellular density profile in the vocal areas
From the Nissl-stained tissues used for 3D reconstruction, 50% of the bregmas encompassing each of the four vocal areas were selected, and cell counting was performed. Cellular density analysis was conducted using a fractionated scanning method with equidistant grids to count cells in the area of interest. Cell counts were performed within these grid points and then extrapolated to the entire area of interest. The “Area Fraction Fractionator” tool in the Stereo Investigator software allowed for the estimation of cell counts within an area of interest using predetermined parameters for grid size and distance between grid points, which were then extrapolated to the total measured area (Supplementary Figure S1B). Using the “icon” option, each cell within the grid was marked without touching the lower or left boundary for each grid point in the entire area of interest. At the end of this process, the cell counts were extrapolated to the size of the total area, ensuring that the Cruz-Orive/Geiser, Schmitz-Hof, and Scheaffer error coefficients were below 0.1 to verify the accuracy of the sampling.
Images scanned from Nissl stained slices within the vocal brain area per specimen were processed and analyzed using QuPath software (Bankhead et al., 2017). Whole nuclei were delineated, and cells per 1 mm2 from three slices were quantified from whole delineated nuclei of the house wren (n = 7) and rufous-tailed hummingbird (n = 4).
Immunohistochemistry
Sections of 30 μm were obtained using a cryostat, similar to those used for the 3D reconstruction of vocal brain areas. Antigen retrieval was performed using 1X citrate buffer (pH: 6) (Master-diagnostic; MAD-004071R/D) at 85°C for 20 min with constant dripping onto the tissues. Subsequently, endogenous peroxidase activity was blocked with a peroxidase blocker (Master-diagnostic; MAD-021540Q-125) for 20 min to prevent nonspecific antibody binding. Samples were incubated in 1% bovine serum albumin (BSA; Sigma-Aldrich, A9647), 0.3% Triton-X100 (Sigma-Aldrich, T9284-500ML), and 0.1 M PB (pH: 7.4) for 1 h at room temperature with constant agitation. This was followed by a 72-h incubation at 4°C in a primary antibody solution containing anti-GFAP mouse (Sigma-Aldrich; G3893 – RRID: AB_477010; [1:250]), anti-S100β rabbit (Dako-Agilet; Z0311 – RRID: AB_10013383; [1:250]), anti-MAP2 mouse (Sigma-Aldrich; M9942 – RRID: AB_477256; [1:250]), or anti-NeuN mouse (Sigma-Aldrich; MAB377 – RRID: AB_2298772; [1:250]) diluted in 0.3% BSA, 0.3% Triton-X100, and 0.1 M PB with constant agitation. After 20 min of washing off excess antibodies, the tissues were incubated for 2 h at room temperature with biotinylated goat anti-mouse secondary antibody (Invitrogen; 31,800 – RRID: AB_228305; [1:250]) or biotinylated goat anti-rabbit secondary antibody (Invitrogen; B-2770 – RRID: AB_2536431; [1:250]) diluted in 0.3% BSA, 0.3% Triton-X100, and 0.1 M PB with constant agitation. Subsequently, the tissues were vigorously washed in 0.1 M PB solution three times for 5 min each, followed by a 1-h incubation in the avidin-biotin peroxidase standard staining kit (Thermo Scientific; 32,020) at room temperature. Development was carried out for 3–4 min using 3,3′-diaminobenzidine tablets (Sigma-Aldrich; D4293). The tissues were then mounted on glass slides and subjected to sequential dehydration with ethanol (70, 96, 100%) and xylene. Finally, without allowing the tissues to dry with xylene, coverslips were mounted using Shandon Consul-Mount (Thermo Scientific; 9,990,440) for drying and observation under the microscope.
Imaging of immunohistochemistry
Whole brain imaging for GFAP slides [Ta (n = 6) At (n = 4)] was scanned with a Ventana-DP 200 brightfield tissue scanner microscope (Roche), equipped with a 40x objective (NA 0.75; UPlanSApo; Olympus) using a 40x digital zoom at a single layer.
Unique cell imaging for fractal morphological analysis of astrocytes was performed using brightfield microscope imaging. For this purpose, five cells were recorded per telencephalic region in the pallium (Laminar edge of pallium (LEP) and vascular pallium), the pallidum, and the mesencephalon for Ta (n = 6) and At (n = 3). These cells were randomly selected and captured using an Olympus CX35 microscope (Model X31RBSFA) equipped with a 100x oil immersion objective (NA 1.25; PlanC N; Olympus) and a Swift camera (SC1803R).
Bright-field image analysis
Image processing of Nissl and GFAP was performed in QuPath 0.3.2 software for Ta (n = 6) and At (n = 4) (Bankhead et al., 2017). Quantifying the percentage of GFAP area in pallium was performed using a particle detector using the same threshold, and the GFAP area was shown by heatmap.
The single-cell images were processed, segmented, and analyzed using FIJI software (NIH ImageJ) (Schindelin et al., 2012). For the morphological analysis of astrocytes, the images were converted to 8-bits, and astrocyte somas were manually segmented using the brush selection tools. The Simple Neurite Tracer plugin was utilized to segment the cellular processes, and then a merge of the soma and processes of each astrocyte was obtained (Longair et al., 2011). Subsequently, morphological parameters of the soma, cellular processes, and the entire cell were obtained using the FracLac plugin (Karperien, n.d.) and FIJI tools. Finally, based on Fernández-Arjona et al. (2017), morphological characteristics related to complexity (fractal dimension, lacunarity, roughness, density, and compactness), size (area, perimeter, and major axes), shape (circularity and aspect ratio), and spatial domain (scaling and shape features of the convex hull, bounding rectangle, and fitted ellipse) were analyzed.
Immunofluorescence of brain samples
The brains of songbirds were extracted and fixed as previously described. Subsequently, the samples were sectioned into parasagittal slices of 30 μm thickness using a Leica cryostat for songbirds. Before immunostaining, antigen retrieval was performed on the songbird slices using citrate buffer at 95°C for 20 min, respectively. Autofluorescence was blocked using 50 mM NH4Cl prepared in H2O. The samples were incubated in 1% bovine serum albumin (BSA, Sigma-Aldrich, A9647) for 1 h at room temperature to prevent nonspecific antibody binding. The brain sections were incubated for 72 h at 4°C in primary antibodies, rabbit anti-GFAP (Sigma-Aldrich; ab5804 – RRID: AB_305124; [1:250]) with mouse anti-NeuN (Sigma-Aldrich; MAB377 – RRID: AB_2298772; [1:250]), diluted in an antibody solution containing 0.3% BSA, 0.3% Triton-X100, and PB (0.1 M, pH 7.4). After removing excess antibodies through a 20-min wash, the sections were incubated for 2 h at room temperature in a secondary antibody solution with goat anti-mouse Alexa Fluor 488 (Invitrogen; A-11001; 1:250) and goat anti-rabbit Alexa Fluor 594 (Invitrogen; A-11012; [1:250]); the nuclear marker Hoescht (Vector Labs; DL-1068; [1:2500]) was also incubated. Subsequently, the samples were vigorously washed in PB (0.1 M) three times for 5 min each. Finally, the sections were mounted on glass slides with FluorSave Reagent (Millipore; 345,789).
Confocal microscopy of birdsong brain samples
Astrocytes in the telencephalon and mesencephalon for bird song were captured using confocal microscopy. Three high-magnification images per slide were obtained from the triple immunostaining, and they were captured using an Olympus FV1000 scanning confocal microscope equipped with a 60X oil immersion objective (NA 1.42; PLAPON; Olympus) with a zoom factor of 4, three lasers at 488, 594 nm, and DAPI in FluoView 3.1.1.9 software (Olympus). Sixteen-bit TIFF images of 1,024 × 1,024 pixels (105.47 × 105.47 μm) were obtained with an XY pixel size of 103 nm and a 400 nm spacing between Z sections. 26 optical sections were captured from each field (with a thickness of 10 μm). In addition, we created a confocal mosaic image for each bird to generate a complete representation of the brain slide in GFAP areas, using a 10X air objective (NA 0.4; APLANPOS; Olympus). For the house wren, we used a 9×9 grid, while for the hummingbird, we used a 7 × 7 grid, and the final reconstructed images were achieved using FluoView 3.1.1.9 software (Olympus).
Confocal image processing and analysis of birdsong brain samples
The confocal images were deconvoluted, processed, segmented, and 3D reconstructions were created. Image deconvolution was performed using Huygens Essential 23.3 software (Scientific Volume Imaging B.V.). The classic maximum likelihood estimation (CMLE) algorithm was used for image deconvolution with a signal-to-noise ratio of 21, and the bird images were deconvoluted using the deconvolution assistant. The images were converted to 8 bits and subsequently processed and analyzed in FIJI software. Immunofluorescence signals were segmented using intensity thresholding with the Huang algorithm to standardize fluorescence signals across all images. Z-projections using the standard deviation of segmented stacks were employed to assess astrocyte structure. These Z-projections were segmented and used to quantify astrocyte processes. Finally, for illustrative purposes, surface rendering was performed to display the 3D projections of deconvoluted images using the 3D Surface rendering option in Huygens Essential 23.4 (Scientific Volume Imaging B.V.).
Sholl analyzes: number of astrocyte processes
The astrocyte processes were counted using deconvoluted images. Excess background illumination was subtracted from a value of 25 using the Image-Pro Plus Subtract tool. The images were processed, segmented, and analyzed using FIJI software (NIH ImageJ) (Schindelin et al., 2012). For crossing number of astrocyte processes, the images were converted to 8-bits and segmented using intensity thresholding by the Huang algorithm. Skeletonization was carried out, and the processes stemming from the soma were quantified using the Simple Neurite Tracer plugin, employing Sholl analysis to count the number of intersecting processes. Finally, the images were processed to obtain the representative figures.
Statistical analysis
For the analysis of cell density in each of the vocal brain regions of the house wren (n = 7) and the rufous-tailed hummingbird (n = 4), cells were quantified in three sections, blind to the conditions. The GFAP area percentage was quantified in two sections, blind to the conditions. We performed a descriptive analysis of the distribution of each cell detected in the vocal areas through box and whisker plots, showing the median (middle line), 25th to 75th percentiles (box limits), and Min to Max value (whiskers limits) of house wren (green), and rufous-tailed hummingbird (orange), depicting cellular area quantifications performed in QuPath. Data normality was assessed using the Shapiro–Wilk test. A non-parametric Mann–Whitney test was conducted to compare cell density between the house wren and the rufous-tailed hummingbird.
Fractal morphology analysis and astrocyte intersections (Sholl analysis) were performed using five images per brain region for each specimen, house wren (n = 6) and hummingbird (n = 3). Data normality was assessed using the Shapiro–Wilk test. For parametric univariate data, a one-way analysis of variance (ANOVA) was employed, followed by Tukey’s multiple comparison tests to compare astrocytes within LEP, FLP, and FRL of the house wren. A non-parametric Mann–Whitney test was conducted to compare the fractal morphology and Sholl analysis of astrocytes in LEP between the house wren (n = 7) and the rufous-tailed hummingbird (n = 3). All groups were processed simultaneously to mitigate potential experimental variations. Statistical analyzes were performed using GraphPad Prism software, version 8.0. Significance levels were determined as follows: * for p < 0.05, ** for p < 0.01, and *** for p < 0.001.
Results
The vocal areas were closer to the midline in house wren, while they were intermediate in rufous-tailed hummingbird
Body condition reflects the quality of life related to survival, reproduction, and behavior. The wild birds collected during the breeding season and the morphometric patterns obtained were related to adult birds based on established criteria (Table 1) (Scott, 2005; Johnson and Clark, 2020). The brain volume-to-body weight ratio was 19,008 mm3/g for the house wren and 17,323 mm3/g for the rufous-tailed hummingbird.
Among bird species, there are variations in the location, shape, and volume of the vocal areas (Jarvis et al., 2000; Mooney, 2009b). From the manually delimited contours for the entire hemisphere and all the vocal areas, we generated a 3D brain reconstruction to describe the position and volume of representative vocal areas. In the house wren, the vocal areas were closer to the midline, whereas in the rufous-tailed hummingbird, they were at an intermediate location between the lateral portion and midline (Figure 2; Table 2). The house wren showed LMAN and Area X in an anterior hemisphere position, while RA and HVC were in a posterior location (Figure 2A; Supplementary Figures S2A,B; Table 2). Despite the rufous-tailed hummingbird showing similarity in the location of LMAN, Area X, and RA; the HVC area spans both the anterior-dorsal and posterior regions of the hemisphere, being longer but narrower compared to the house wren (Figure 2B; Supplementary Figures S2C,D). These findings suggest a differential spatial localization of vocal brain areas between the house wren and rufous-tailed hummingbird.
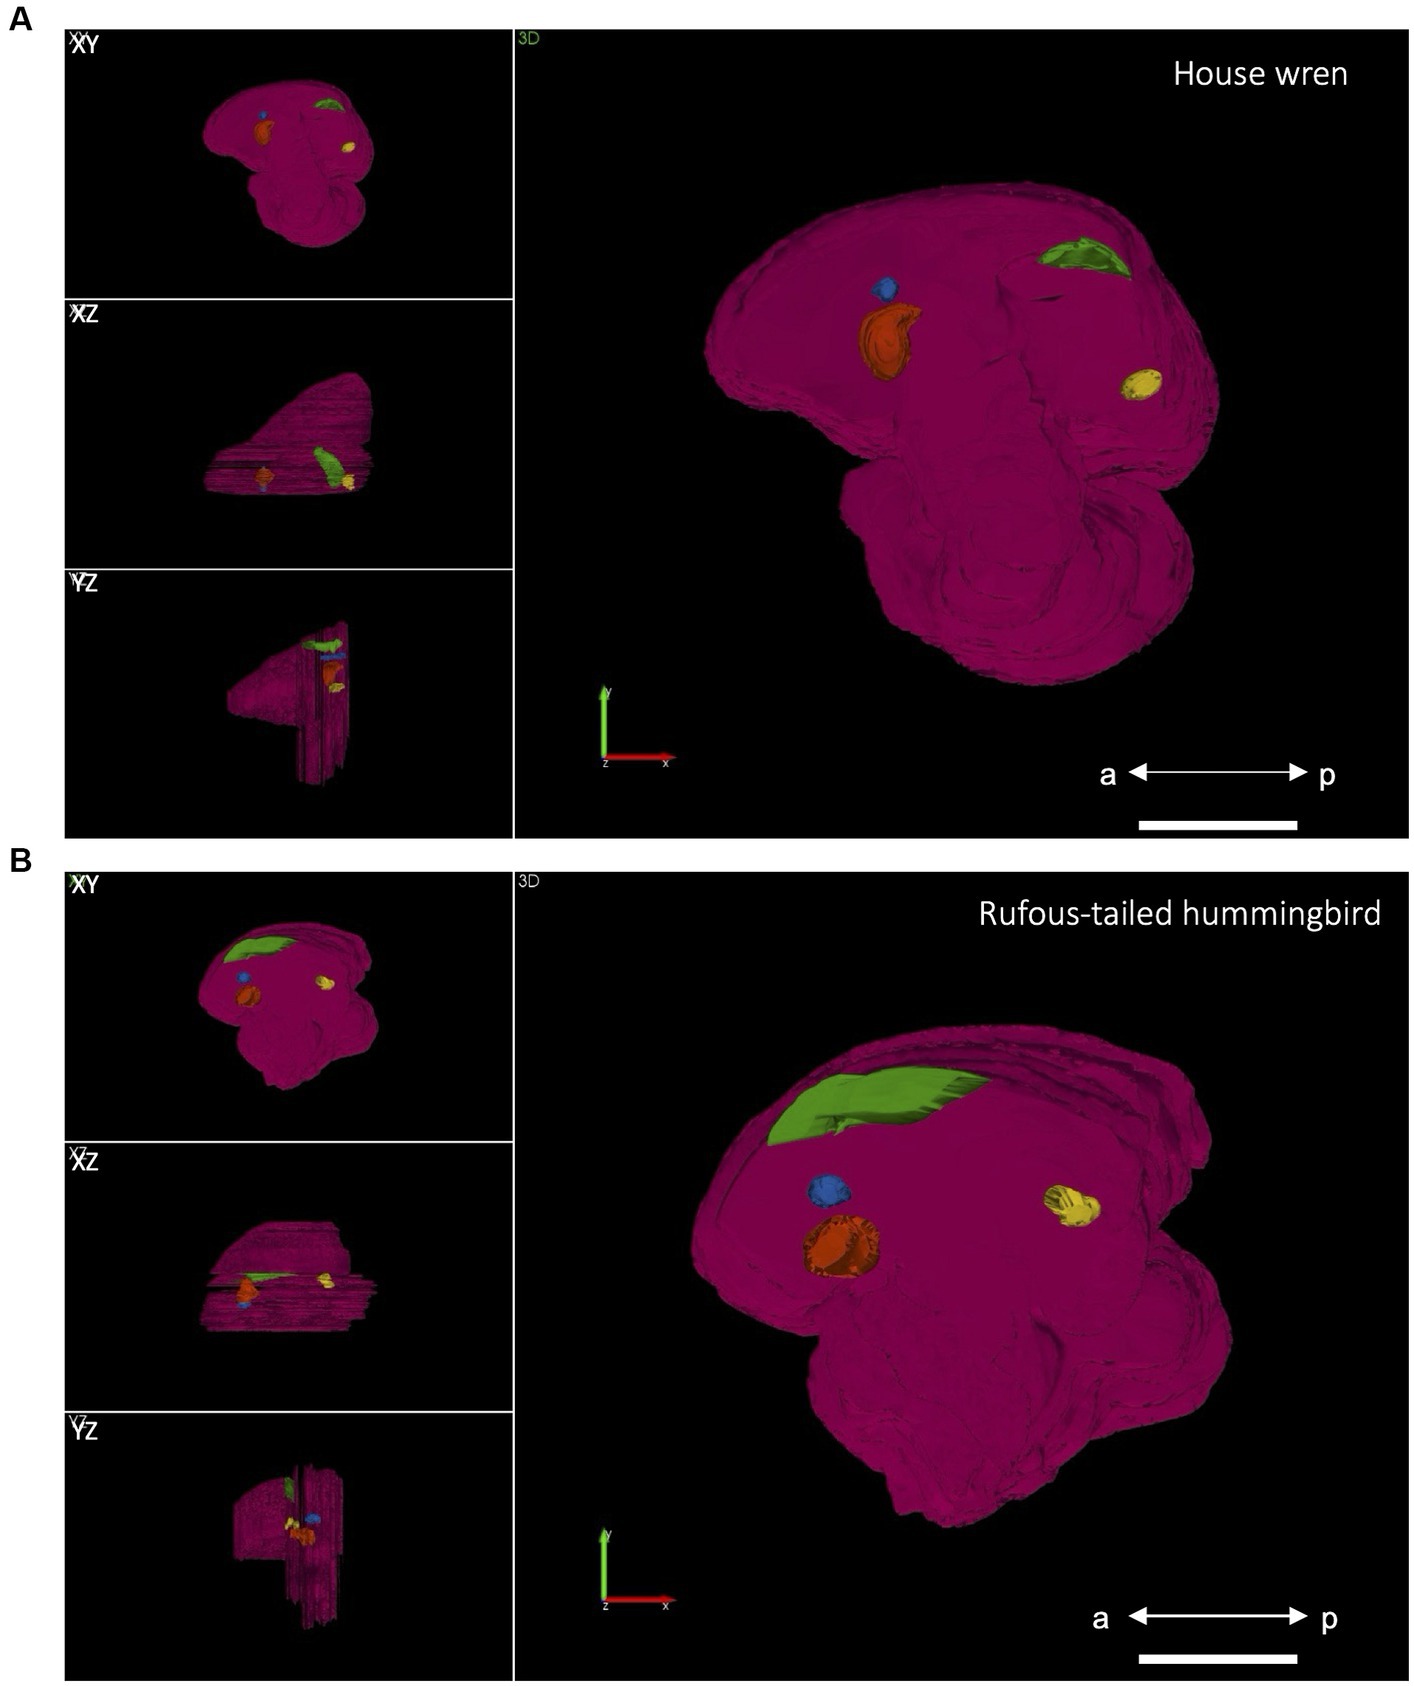
Figure 2. Three-dimensional reconstruction of the vocal brain areas in lateral (XY), ventral (XZ), and posterior (YZ) views. (A) In the house wren, the vocal brain areas are shown in a position close to the midline. Scale bar 3 mm. (B) In the rufous-tailed hummingbird, the vocal brain areas are shown in a position intermediate between the midline and the lateral aspect, and the HVC is located in an anterior position Scale bar 1.5 mm. The LMAN is shown in blue, Area X in orange, HVC in green, and RA in yellow; a: anterior position, p: posterior position.
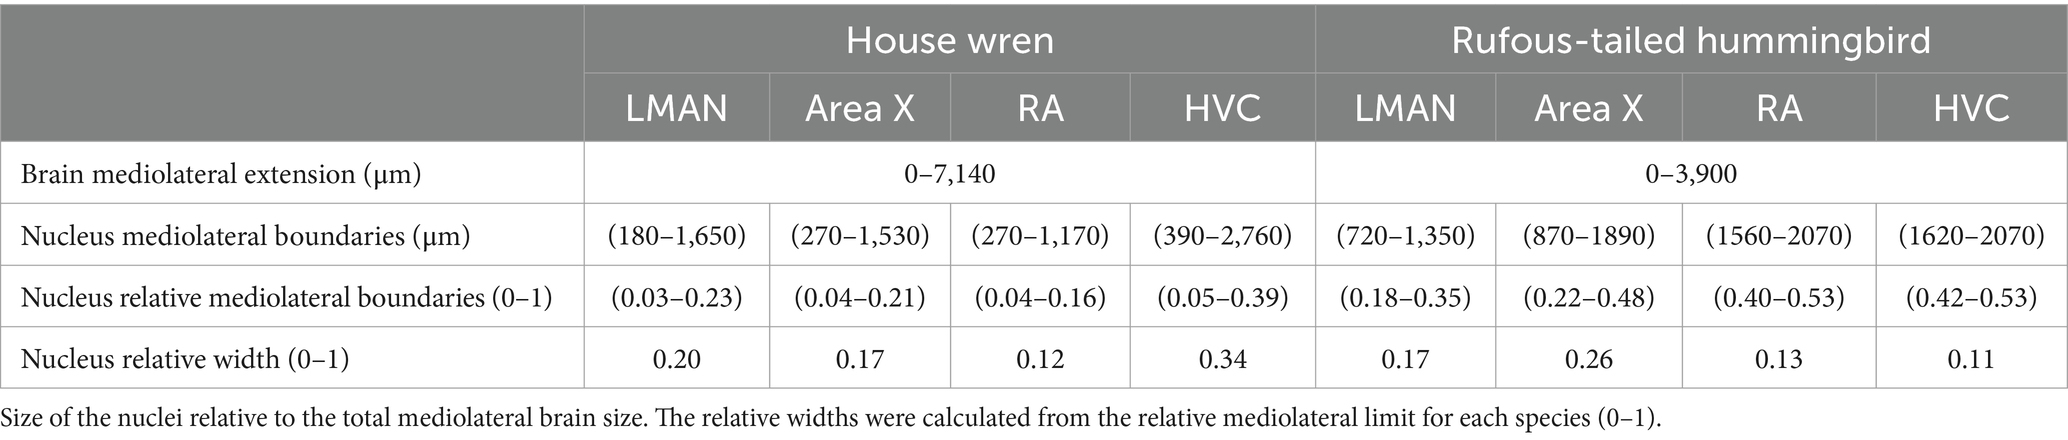
Table 2. Mediolateral location and width of telencephalic song nuclei.
Starting from the 3D construction of each nucleus, we determined the most medial and lateral limits and, hence, were able to calculate their mediolateral extensions (widths). Then, their widths were relativized to the maximal mediolateral extension of the hemisphere (Table 2). Interestingly, relative to the hemisphere extension, the house wren showed a wider HVC compared to the rufous-tailed hummingbird, while Area X was wider for the rufous-tailed hummingbird, compared to the house wren, suggesting differences in the size of production and learning vocal areas between both species.
The volume and cellular morphology of vocal areas in house wren and rufous-tailed hummingbird
We described the cellular morphology and distribution of vocal areas for the house wren and the rufous-tailed hummingbird based on whole and unique cellular imaging of the vocal areas and the quantitative area registration of each cell contained in each region (Figure 3). In the house wren and the rufous-tailed hummingbird, the LMAN area showed a volume of 0.0993 and 0.2018 mm3, respectively (Figure 3C). We observed large and elongated cells with a pyramid shape and intense staining, surrounded by scattered cells forming a sphere in the house wren; contrastingly in the rufous-tailed hummingbird, the LMAN area showed smaller elongated cells, closely packed together, surrounded by scattered cells forming an oval shape (Figures 3C,G.I; Supplementary Figure S3A). Interestingly, the LMAN of the rufous-tailed hummingbird showed an intense patch of blue color, suggesting a possible higher cellular density compared to the house wren (Figure 4A; Supplementary Figure S3A).
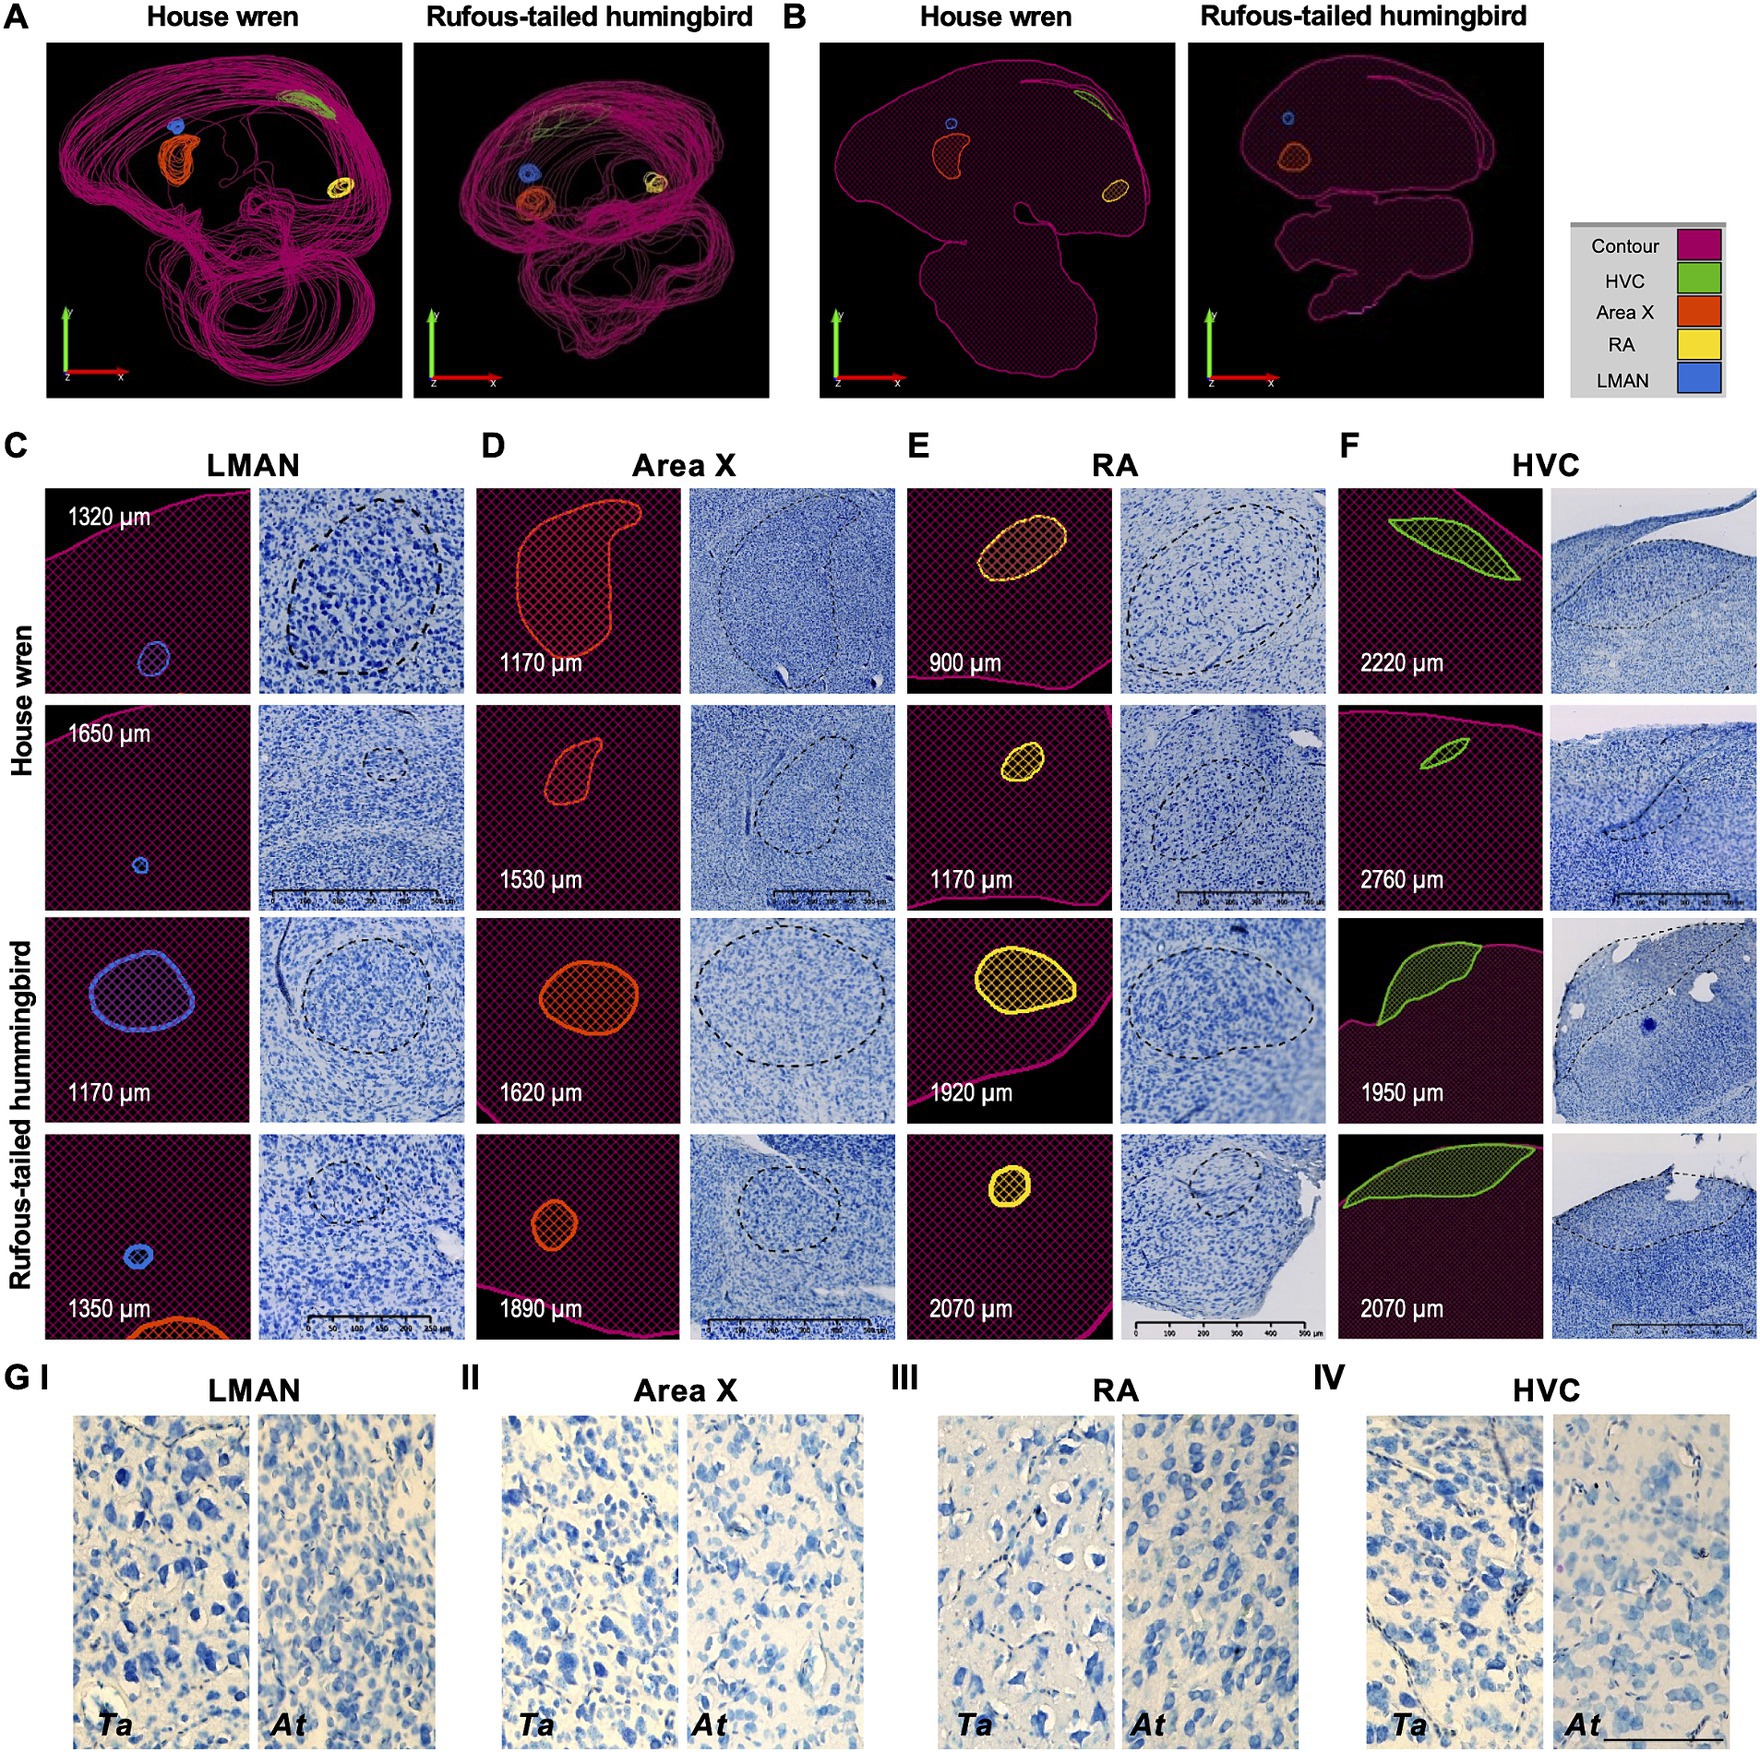
Figure 3. Reconstruction and localization of the vocal brain areas in the house wren and rufous-tailed hummingbird at different bregma levels from the midline to the lateral part. (A) Three-dimensional representation of the vocal brain areas of house wren and rufous-tailed hummingbird. The LMAN is shown in blue, Area X in orange, the HVC in green; and the RA in yellow. (B) Location of the vocal brain areas of house wren and rufous-tailed hummingbird, respectively. The value indicates mediolateral slices represented. The LMAN and Area X are shown in the anterior regions, while the HVC and RA are located in the posterior positions. (C) Traced contour (left) and image (right) are shown for all the vocal brain areas at two different mediolateral positions and for each species. The LMAN is shown at 1320 and 1,650 μm, and at 1170 and 1,350 μm from the midline in the house wren and rufous-tailed hummingbird, respectively. (D) The Area X is shown at 1170 and 1,530 μm, and at 1620 and 1890 μm from the midline in the house wren and rufous-tailed hummingbird, respectively. (E) The RA is shown at 900 and 1,170 μm, and at 1920 and 2070 μm from the midline in the house wren and rufous-tailed hummingbird, respectively. (F) The HVC is shown at 2220 and 2,760 μm, and at 1950 and 2070 μm from the midline in the house wren and rufous-tailed hummingbird, respectively. (G) Magnification of each of the vocal brain areas in both species. I LMAN; II Area X; III RA; IV HVC. Left side corresponds to house wren an right side corresponds to rufous-tailed hummingbird. (C) House wren: Scale bar: 500 μm, Rufous-tailed hummingbird: 250 μm, (D,E) Scale bar: 500 μm, (F) House wren: Scale bar: 500 μm, Rufous-tailed hummingbird: 1000 μm, (G) Scale bar: 100 μm.
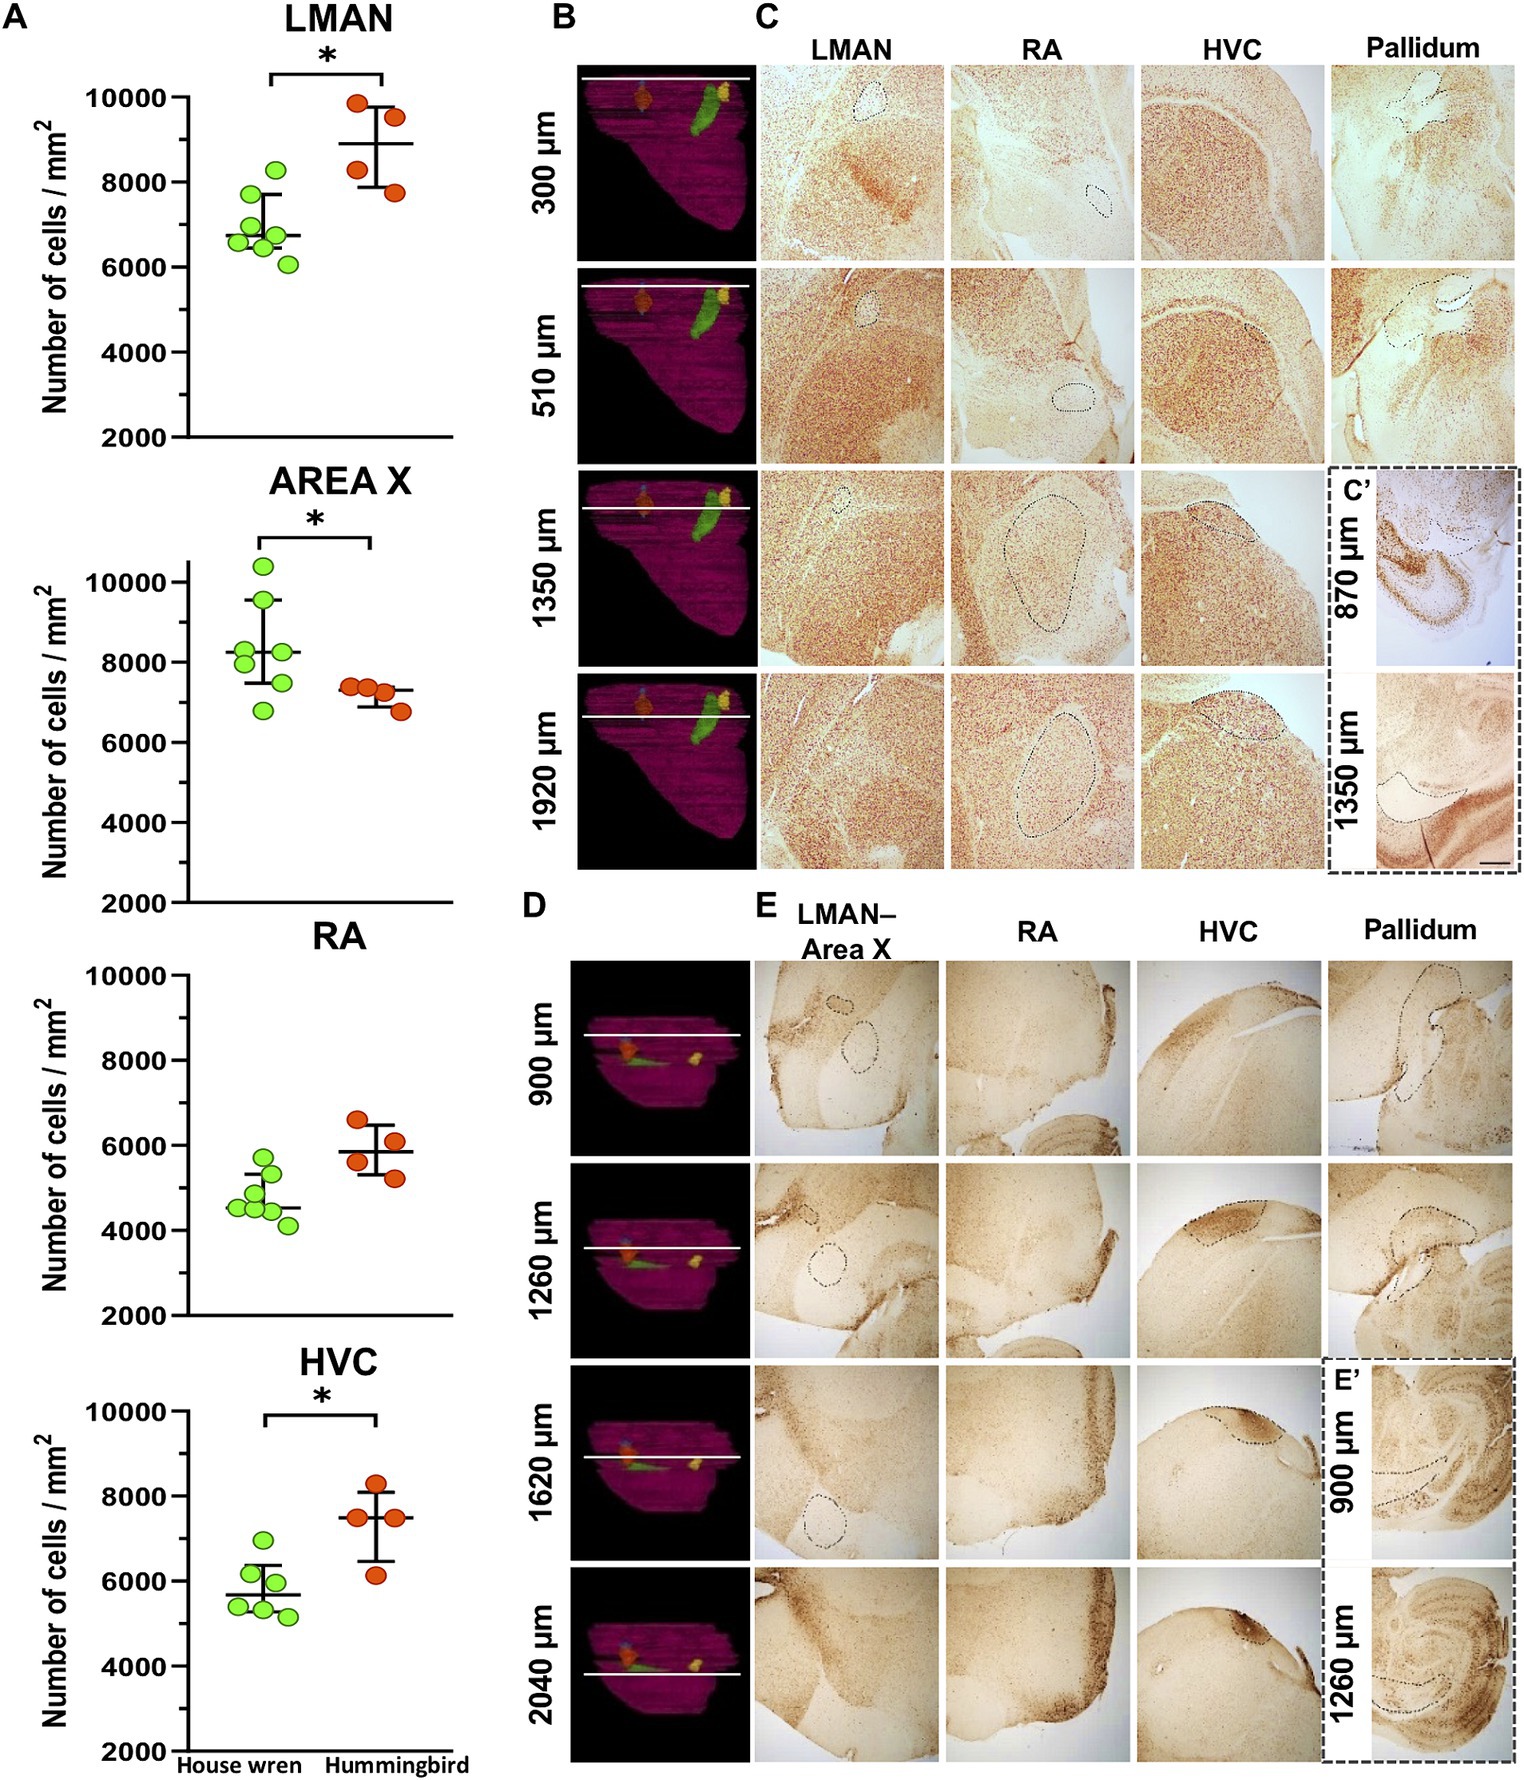
Figure 4. Cell density and validation at different bregma’s from the midline of the vocal brain areas in the house wren and rufous-tailed hummingbird using NeuN staining. (A) Comparison of cellular density in vocal areas among two species. Green circles show the house wren, and Orange circles show the rufous-tailed hummingbird. A representative diagram showing the location of each bregma across the width of the hemisphere in the house is shown in (B,C). (B) The white line shows the location of each bregma. (C) The LMAN was validated from bregma 300 to approximately 1,350 μm, the RA area from bregma 300 to approximately 1920 μm, and the HVC area from 510 to approximately 1920 μm. (C′) Section showing the pallidum and mesencephalon where the white matter appears. Representative diagram showing the location of each bregma across the width of the hemisphere in the rufous-tailed hummingbird in (D,E). (D) The white line shows the location of each bregma. (E) Validation of the LMAN located from bregma 900 to approximately 1,260 μm, the Area X from bregma 900 to approximately 1,620 μm, the HVC area from 1,260 to approximately 2040 μm. (E′) Section the pallidum and mesencephalon where the white matter appears. Statistical analysis was performed with Mann Whitney test for comparing distributions of two independent groups LMAN: * p = 0.0121; Area X: * p = 0.0424, RA: p = 0.0524 and HVC: * p = 0.0381. Ta: n = 7 – At: n = 4. (C,D) Scale bar: 500 μm.
Area X had a volume of 0.6764 and 0.0405 mm3 in the house wren and the rufous-tailed hummingbird, respectively (Figure 3D). In the house wren, Area X showed various types of cells, including small, round, elongated, and big cells dispersed throughout the area, with intense-staining pyramid-shaped cells. Its shape resembled a water droplet, narrower at the upper dorsal and rounder at the lower ventral part. While in the rufous-tailed hummingbird, Area X was spherical and composed of cells of various sizes, with a predominance of big cells in clusters (Figures 3D,G.II; Supplementary Figure S3A).
The RA area in the house wren and the rufous-tailed hummingbird had volumes of 0.1694 and 0.0432 mm3, respectively (Figure 3E). In the house wren, the RA area was mainly comprised of pyramid-shaped cells spaced apart, with intense staining distinguishing them from the surrounding environment. An oval shape on the area’s outer part was formed by elongated and closely spaced cells. In contrast, in the rufous-tailed hummingbird, the RA area mainly showed round cells close to each other, with lighter staining compared to the elongated and separate surrounding cells, forming a slight oval shape around them (Figures 3E,G.III; Supplementary Figure S3A).
The HVC area showed 0.5431 and 0.1451 mm3 volumes for the house wren and the rufous-tailed hummingbird, respectively (Figure 3F). In the house wren, the HVC area displayed different types of cells distributed variably (Supplementary Figure S3A). Sections close to the midline showed small and closely packed cells forming a thin band near the hippocampus, while in sections further away from the midline, cells were a more dispersed and with a more intense staining. The HVC area took on an oval shape with flattened ends and was surrounded by small, elongated cells close to each other. And in the rufous-tailed hummingbird, the HVC area mainly exhibited round cells close to each other. At the upper-dorsal part of the area, elongated cells with intense staining were found, extending towards the anterior nidopallium, making its morphology similar to that of the house wren (Figures 3F,G.IV).
Higher cell density in LMAN and Area X are, respectively, observed in the rufous-tailed hummingbird and the house wren
We performed the 3D rendering of each hemisphere and each vocal area and calculated the percentage of occupancy of each nucleus relative to the total size of the hemisphere. We analyzed the relation between the volume of the vocal areas and the total volume of the hemisphere in the house wren and the rufous-tailed hummingbird, and the LMAN showed an occupancy percentage of 0.0655 and 0.0924; Area X of 0.4459 and 0.4605; RA of 0.1117 and 0.0986; and HVC of 0.3580 and 0.3311, respectively (Table 3).
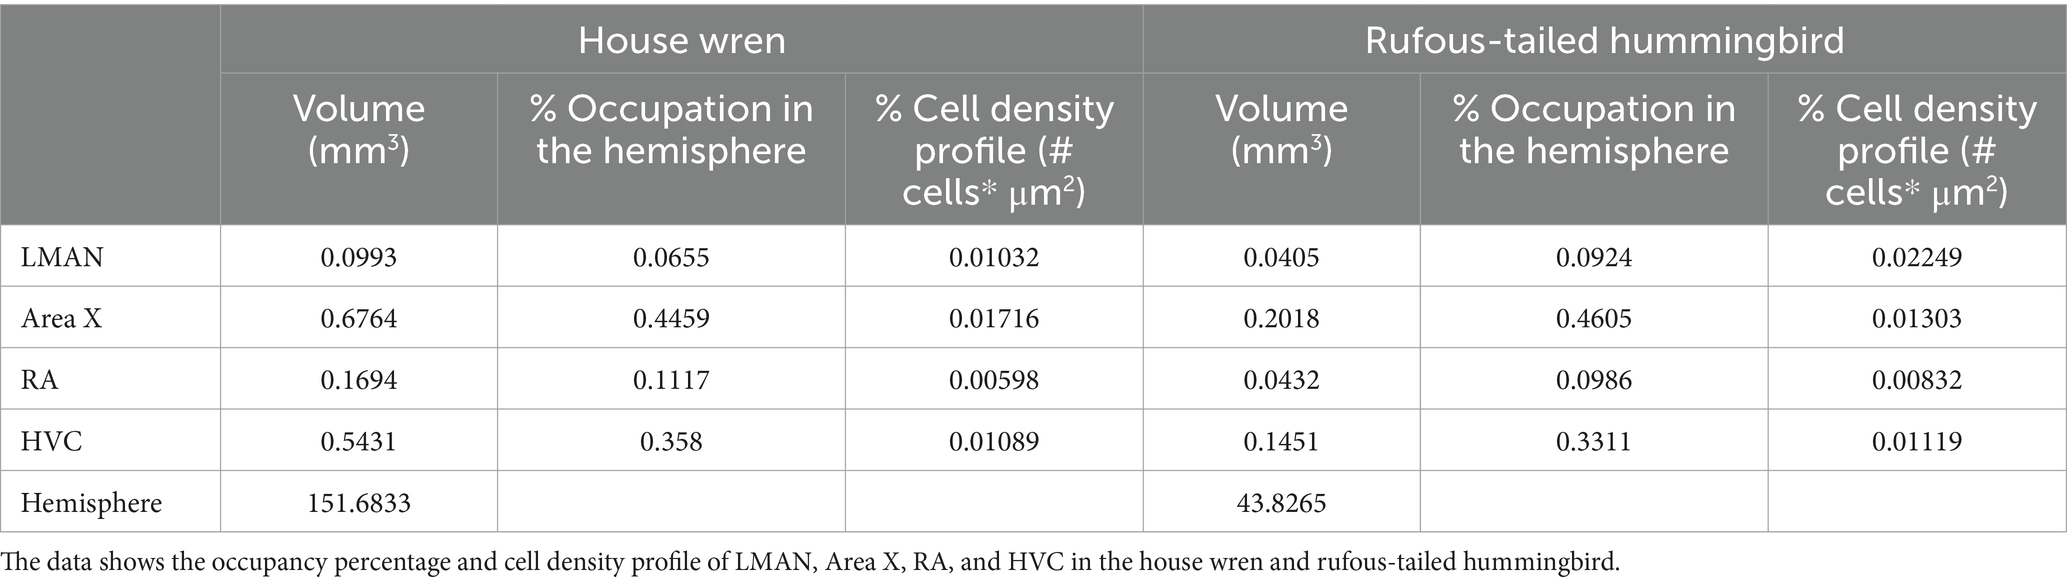
Table 3. Percentage of occupancy in songbird brain areas.
In order to explain the volumetric differences between both species, we performed a cellular density analysis of the vocal areas. For this purpose, a fractionated scanning method was used in the area of interest, overlaying equidistant grids (as shown in Supplementary Figure S1B). Although the cellular density in RA area was similar for both species, we observed that the house wren exhibited a higher cellular density in Area X, while in the rufous-tailed hummingbird, this higher density was found in the LMAN and HVC areas (Table 3) (Figure 4A; Mann–Whitney test, * p value <0.05). This suggests a differential occupation and cellular density of LMAN, HVC and Area X between the house wren and rufous-tailed hummingbird.
The vocal areas showed MAP2 and NeuN markers, validating 3D location and nuclear pattern
The contours of the vocal areas were delineated through a meticulous analysis of their location and cellular and histological description. We used specific neuronal proteins, NeuN and MAP2, to validate the location of the vocal areas. Specifically, we used representative slices at the bregma where each vocal song area began and ended. The corresponding contours for LMAN, Area X, RA, and HVC were drawn in the specific location using both markers (Figure 4; Supplementary Figures S3B–E). The nuclear pattern and the location of all the vocal areas were found between positions 270–1920 μm, from the midline, for the house wren (Figures 4B,C; Supplementary Figures S3B,C) and 870–2040 μm for the rufous-tailed hummingbird (Figures 4D,E; Supplementary Figures S3D,E). This nuclei pattern from neuronal markers reproduces the 3D location of the vocal areas at the proposed bregma in the house wren and the rufous-tailed hummingbird.
The house wren has a greater abundance of GFAP astrocytes compared to the rufous-tailed hummingbird
Neuroanatomical studies of the vocal areas have focused on neuronal circuits (Gahr, 2000; Poirier et al., 2008; Vellema et al., 2011). However, astrocytes might participate in vocal areas (Kafitz et al., 1999; Haim and Rowitch, 2016). We labeled GFAP astrocytes with an antibody previously used in birds [Anti-GFAP (Rb) (Merk-millipore; ab5804)] (Polomova et al., 2019), and we also probed human and murine-tested anti-GFAP and anti-S100β antibody [anti-GFAP (Ms) (Sigma-Aldrich; G3893) and anti-S100β (Rb) (Dako-Agilet; Z0311)] (Rantamäki et al., 2013; Laddach et al., 2023). Consistently, we found that anti-GFAP tested for birds labeled effectively for both species, even for recognition in humans (Supplementary Figure S4A). Therefore, we examined the distribution of GFAP and S100β astrocytes in the vocal areas LMAN, Area X, RA, and HVC. Although these areas did not show classical astrocytic morphology, we found a GFAP and S100β punctate pattern in both species (Supplementary Figure S4B). Consistently, we found GFAP astrocytes in other brain regions, such as the telencephalon in the pallium located in the laminar edge of pallium (LEP) and vascular portions for house wren, as well as in the pallidum and mesencephalon, specifically, in the lateral prosencephalic fascicle (FPL) and the lateral mesencephalic reticular formation (FRL) for house wren (Figures 5, 6A,C). These regions were located at the same bregma point where the vocal areas were situated (Supplementary Figure S2), as was referenced in the known zebra finch atlas brain (Lovell et al., 2020). We did not observe an apparent label of S100β astrocytes in the same areas in the house wren (Figures 5A,B, 6A,B). In the rufous-tailed hummingbird, we found GFAP-positive astrocytes in the LEP region but not in the FPL and FRL, and consistently, we found a varicose pattern of s100β processes resembling astrocytes in the three regions (Figures 5C,B, 6C,D, and Supplementary Figure S5). We quantified the total GFAP in the pallium and mesencephalon and showed it on a heat scale for each species, finding that GFAP astrocytes were more abundant in the house wren than in the rufous-tailed hummingbird (Figure 5E).
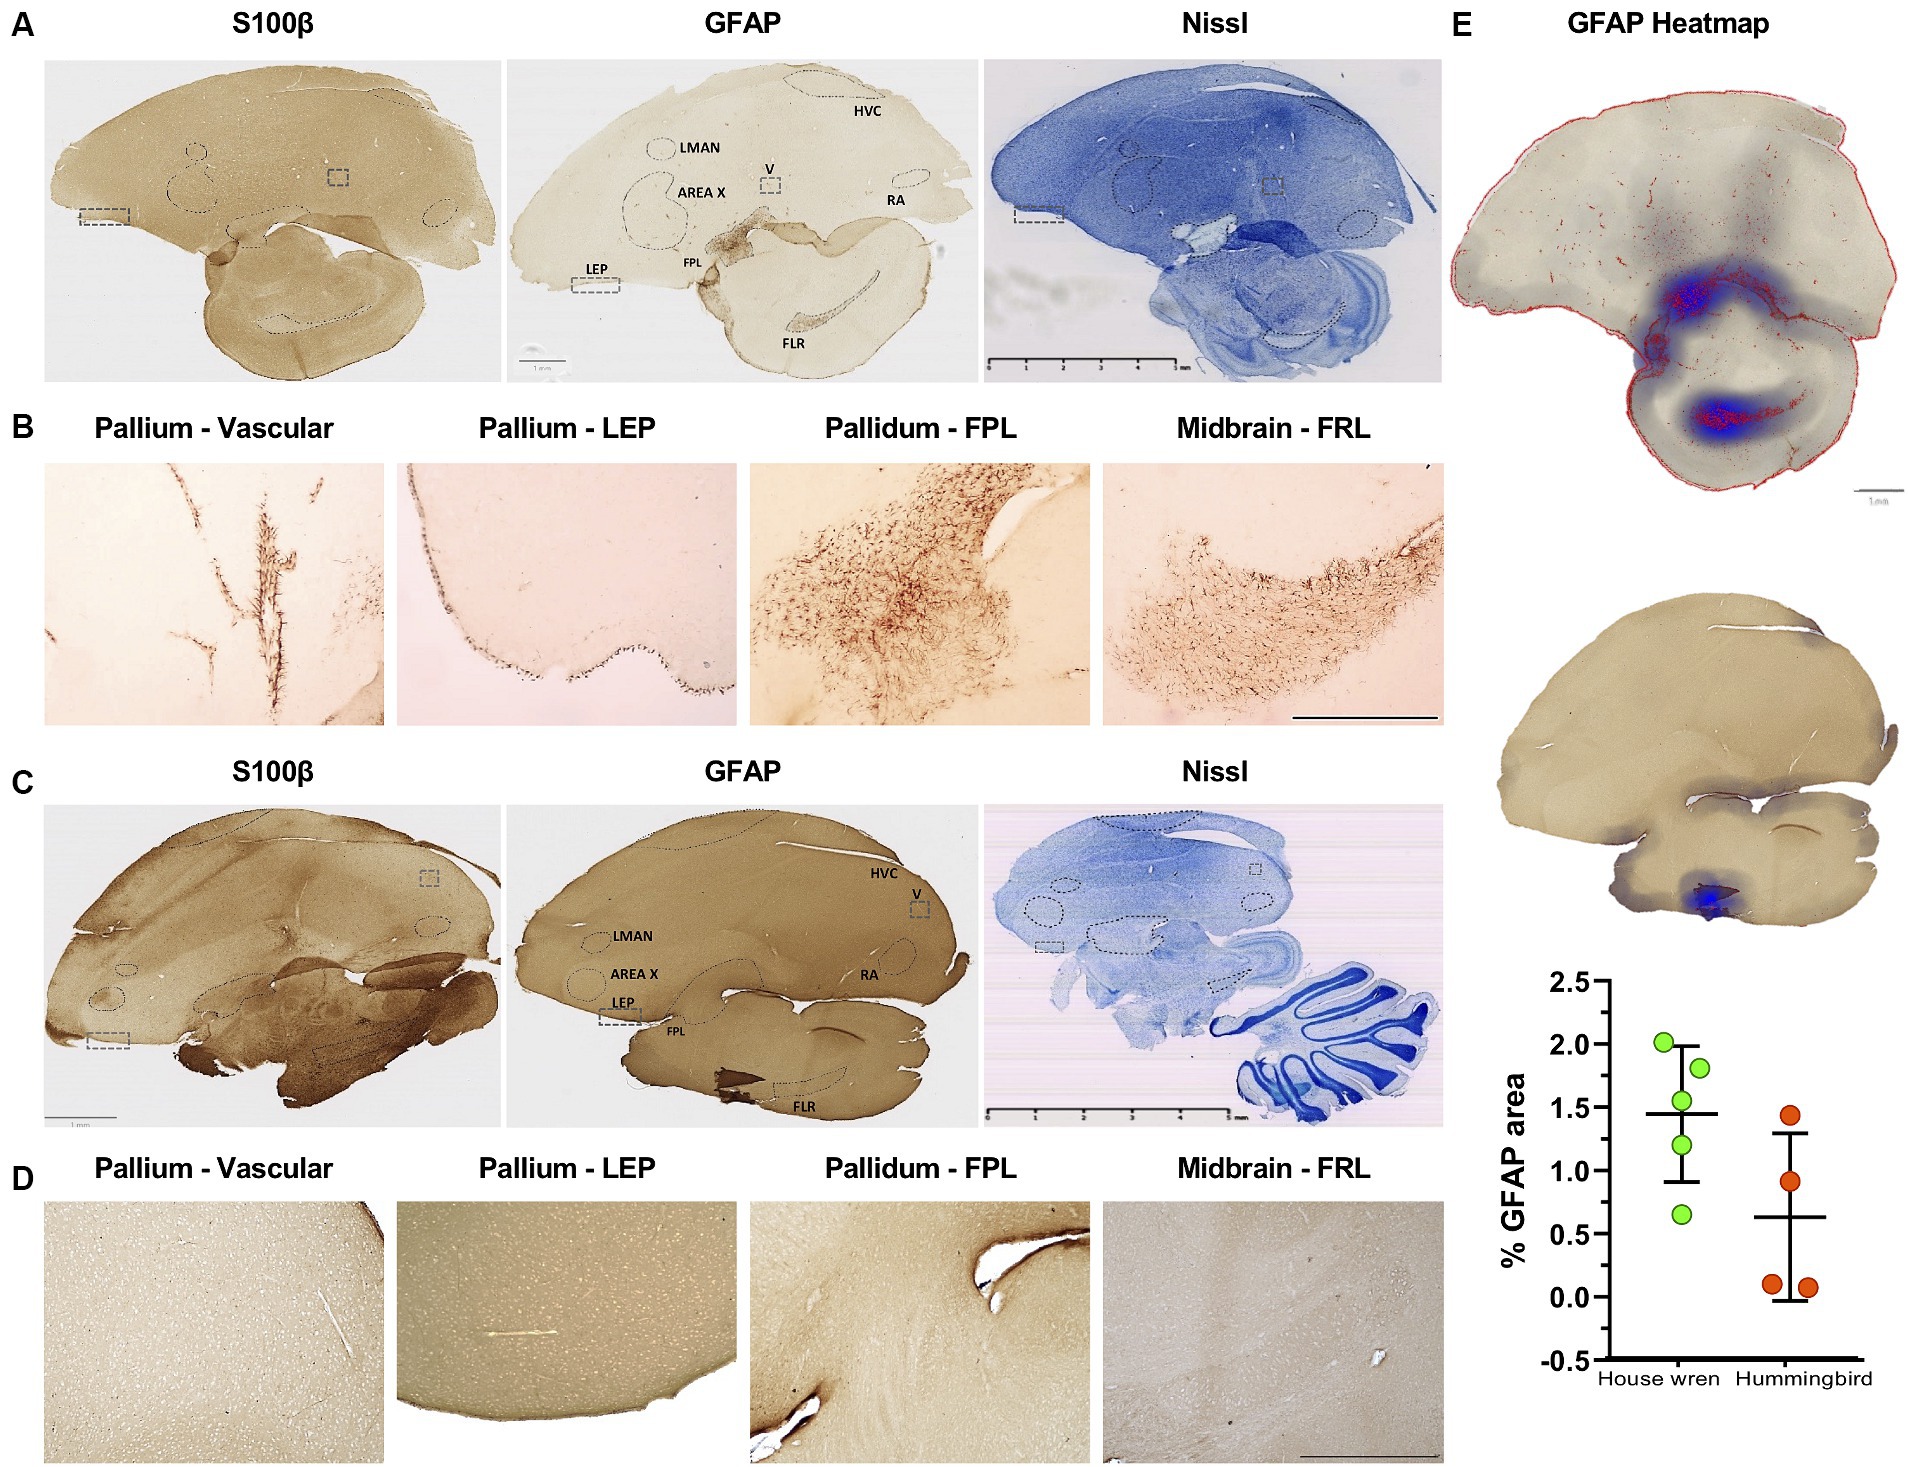
Figure 5. Different distribution of GFAP and S100 astrocytes in vocal and motor relay regions in the house wren and the rufous-tailed hummingbird. (A) Whole tissue scan with S100β, GFAP, and Nissl staining in the house wren (B) GFAP astrocyte labeling in the house wren brain regions such as the vascular pallium and the laminar edge of pallium (LEP), as well as in the pallidum in the FPL and the mesencephalon in FRL. (C) Whole tissue scan with S100β, GFAP, and Nissl staining in the rufous-tailed hummingbird (D) GFAP astrocyte labeling in the rufous-tailed hummingbird brain regions such as the vascular pallium and LEP, as well as in the pallidum in the FPL and the mesencephalon in the FRL. (E) Heatmap of GFAP staining of the pallidum and mesencephalon. Quantification of percentage of GFAP area in the pallium. Statistical analysis was performed with Mann Whitney test for comparing distributions of two independent groups, p value = 0.1111. GFAP astrocytes labeled in LEP region (A,C) Scale bar: 5 mm, (B,D) Scale bar: 500 μm. (C–E) Scale bar: 500 μm. Ta: n = 6 – At: n = 4.
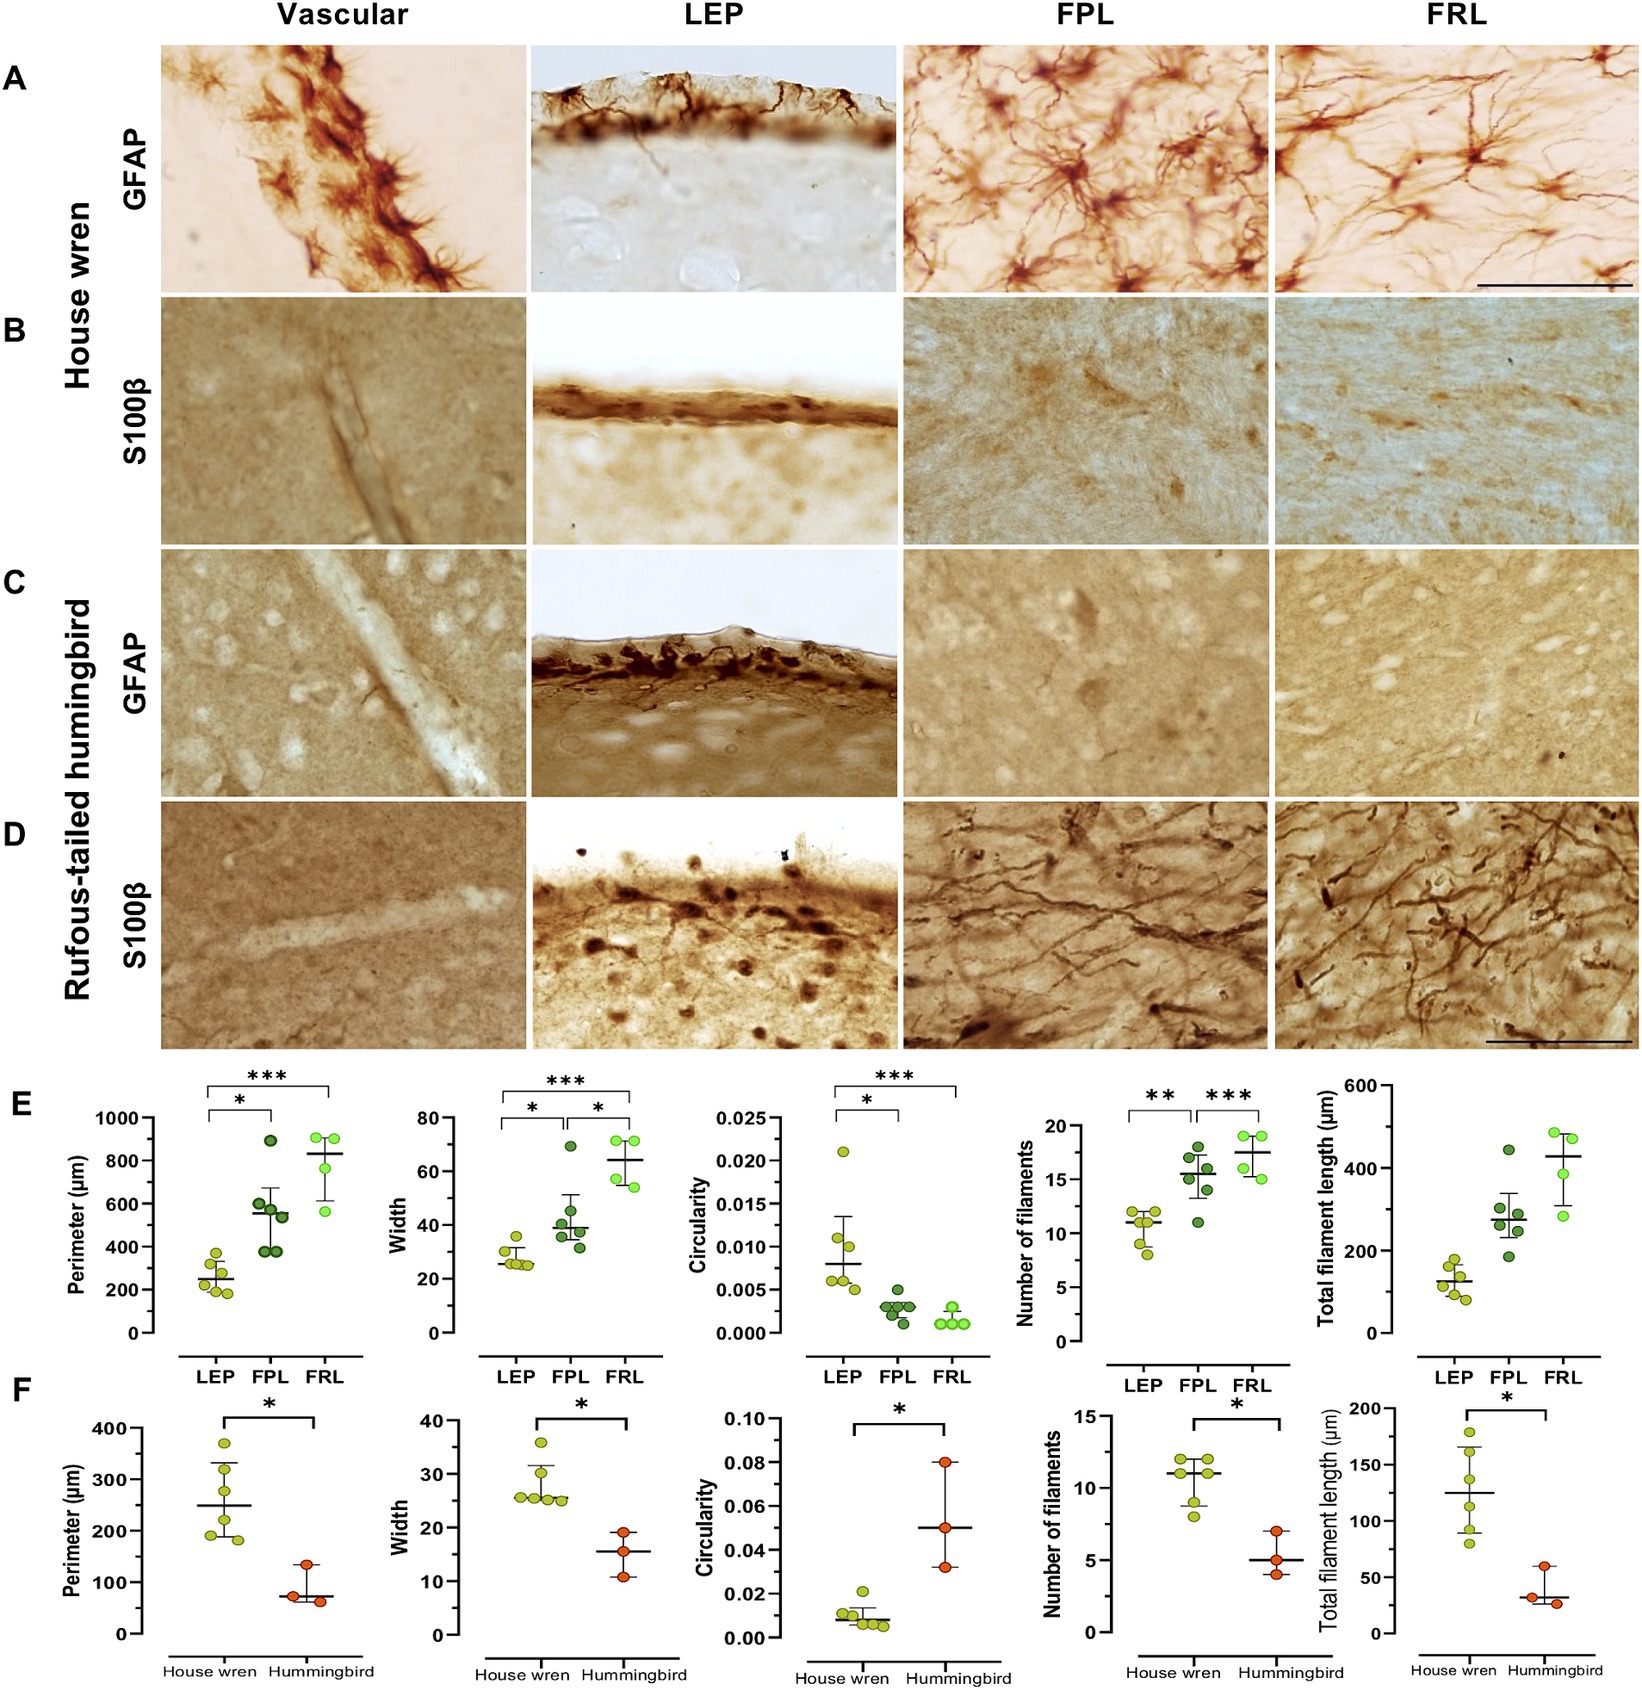
Figure 6. Morphology of GFAP and S100β astrocytes in the telencephalon of the house wren and the rufous-tailed hummingbird in the vascular pallium, LEP, FPL, and FRL. Representative images of GFAP astrocytes and S100β like processes of the house wren in (A) and (B); and the rufous-tailed hummingbird in (C,D), respectively. (E) Morphological parameters (perimeter, width, circularity, number of filaments, total filament length) of GFAP astrocytes processes in the house wren. (F) Comparison of morphological parameters of GFAP astrocytes processes in the LEP region between the two species. Green circles show the house wren, and orange circles show the rufous-tailed hummingbird. One-way ANOVA with Tukey’s post hoc test was performed for multiple comparisons for (E). Mann Whitney test was performed to compare distributions of two independent groups for (F). The significance levels were set at (E) Perimeter: * p = 0.0104, *** p = 0.0003; Width: * p = 0.0192, *** p = 0.0003, * p = 0.0458; Circularity: * p = 0.0190, * p = 0.0130; Number of filaments: ** p = 0.0052, *** p = 0.0007 and (F) Perimeter, Width, Circularity: * p = 0.0238; Number of filaments and Total filament length: * p = 0.0119. Ta: n = 6 – At: n = 3. (A–D) Scale bar: 50 μm.
The GFAP astrocytes in the pallium of the house wren display more complex morphological features compared to those in the rufous-tailed hummingbird
The GFAP astrocytes of each area were segmented and analyzed for fractal parameters to determine their complexity. The house wren showed a typical morphology of GFAP astrocytes and cells with low levels of somatic S100β (Figures 5A,B). Comparing GFAP astrocytes within house wren, the GFAP astrocytes of the FPL and FRL showed a greater complexity, with more extended and more filamentous structures compared to astrocytes at LEP (Figures 6A,E, and Supplementary Figure S6A; ANOVA and Tukey’s test, * p < 0.05, ** p < 0.01, and *** p < 0.001). Interestingly, in the rufous-tailed hummingbird, S100β astrocytes exhibited a more straightforward punctate pattern in the LEP and a pattern of long filamentous in the FPL and FRL (Figure 5S). In addition, we found typical GFAP astrocytes in the LEP rufous-tailed hummingbird (Figure 5D). Therefore, we characterized the fractal morphology of GFAP astrocytes in the LEP of both species, resulting in a greater perimeter, width, and process length in the house wren compared to the rufous-tailed hummingbird (Figures 6A,C,F; Supplementary Figure S6B; ANOVA and Mann–Whitney test, * p < 0.05).
Subsequently, we performed a morphological analysis comparing GFAP astrocytes between the two species using immunofluorescence and confocal microscopy. This analysis would support observations by immunohistochemistry and delve into the three-dimensional detail of the astrocytes. Specifically, we identified astrocytes within the regions above (Figures 7A,B). Furthermore, the Sholl analysis, which shows the branching of astrocytic processes and GFAP astrocytes in the house wren, exhibited greater complexity across all examined areas, specifically in FPL and FRL, as shown above (Figures 7C,D; ANOVA and Tukey’s test, ** p < 0.01, and *** p < 0.001 7; 7E; Mann–Whitney test, * p < 0.05). Consistently, LEP GFAP astrocytes were compared; they showed more significant branching in the house wren compared to those in the rufous-tailed hummingbird. These findings indicate that astrocytes are considerably more complex in the house wren compared to the rufous-tailed hummingbird.
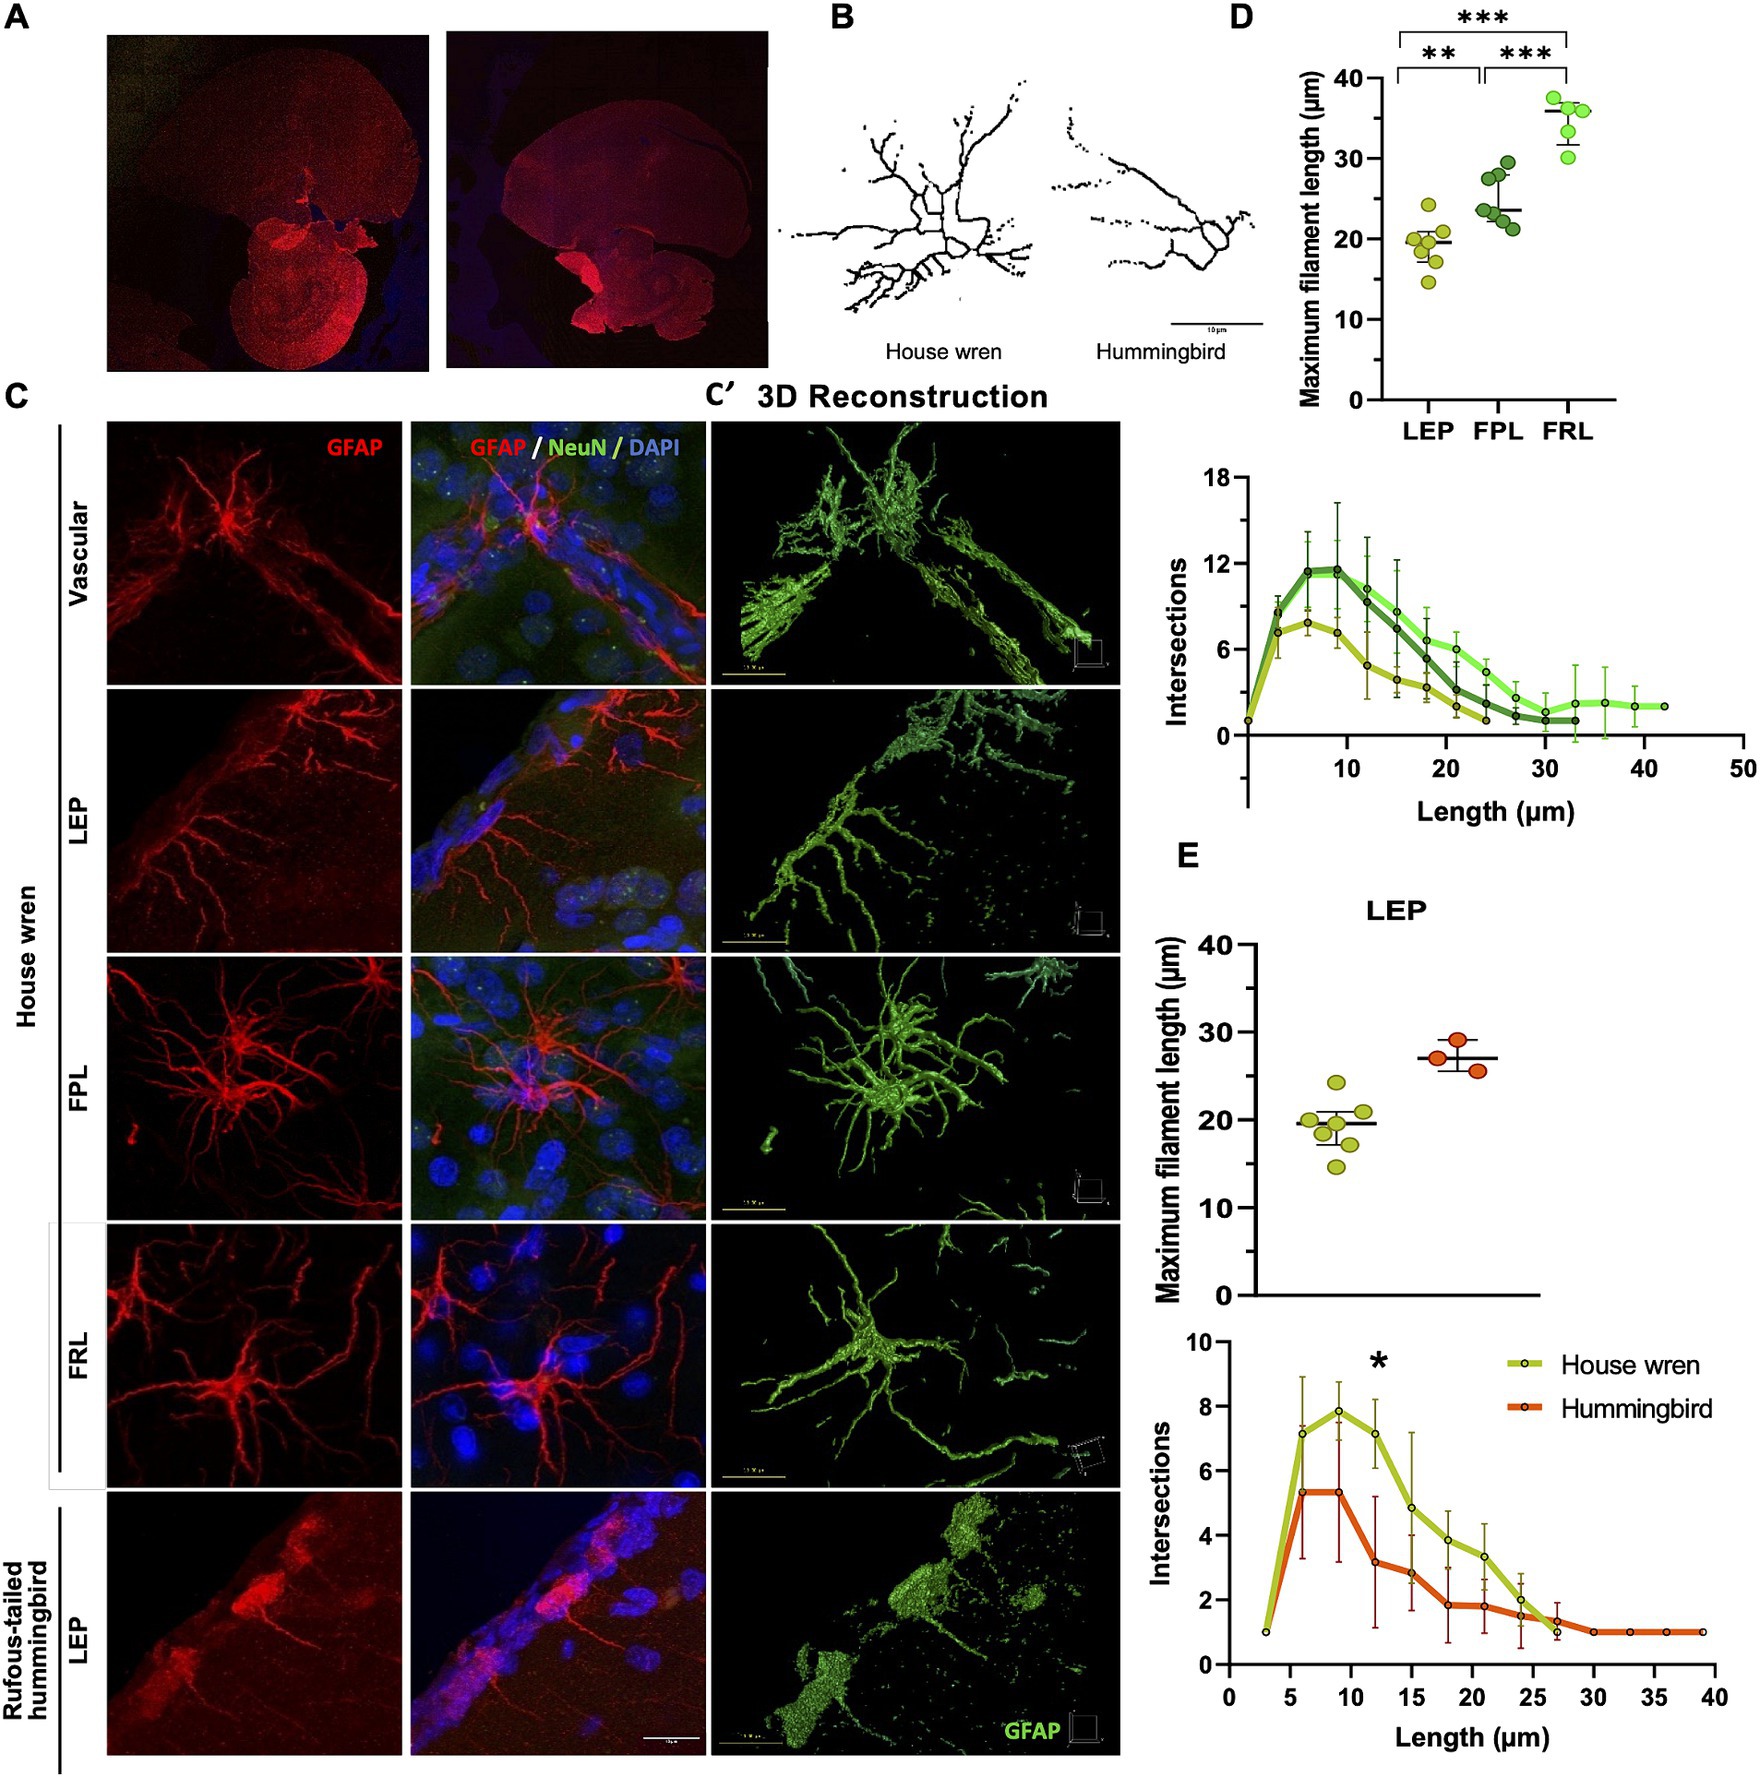
Figure 7. Comparison of processes ramification of GFAP astrocytes of the house wren and the rufous-tailed hummingbird. (A) Confocal tiling imaging of whole GFAP staining (red) in the house wren and the rufous-tailed hummingbird. (B) Representative images of GFAP astrocyte skeleton of sholl analysis from LEP of the house wren and hummingbird. (C) Representative 3D maximal projection images of GFAP astrocyte (red), NeuN (green), and nuclei (blue) immunofluorescence of the house wren (LEP, FPL, and FRL) and the rufous-tailed hummingbird (LEP). (C′) Representative surface 3D rendering images of GFAP astrocyte (green) of the house wren (LEP, FPL, and FRL) and the rufous-tailed hummingbird (LEP). (D) The maximum length and number of intersections of astrocytic processes in the LEP, FPL, and FRL of house wren. (E) Comparison of GFAP astrocytes in the LEP region between the two species. Green circles show the house wren, and orange circles show the rufous-tailed hummingbird. One-way ANOVA, and Tukey’s post hoc test were performed for multiple comparisons for (D); and t-test comparison for (E). The significance levels were set at (D) ** p = 0.0082, *** p = 0.0002 and (E) * p = 0.0105. Ta: n = 7 – At: n = 3 (C) Scale bar: 10 μm.
Discussion
This comparative study introduces a novel framework for examining variations in the localization, volume, and cell density of vocal areas and disparities in astrocyte characteristics, which may support variations in the complexity of songs between these two wild bird species. This comparative study shows a differential spatial localization of the vocal areas of the house wren and the rufous-tailed hummingbird. Specifically, the LMAN of the rufous-tailed hummingbird was more prominent and had a higher cell density, while Area X was shown to have a higher cell density in the house wren. GFAP astrocytes were more abundant in the house wren compared to the rufous-tailed hummingbird, and LEP GFAP astrocytes in the house wren exhibited greater morphological complexity than the rufous-tailed hummingbird.
The study introduces a 3D reconstruction of vocal brain regions, LMAN, Area X, RA, and HVC, in the house wren and rufous-tailed hummingbird obtained through advanced microscopy and histological analysis, which facilitates volumetric and cellular analysis of the vocal brain areas. The provided volumetric, spatial, and cellular data is significant given the fact that no prior brain atlas existed for the song regions of these two species, allowing for comparison based on vocal complexity.
Specifically, these birds perch and coexist in rural and semiurban buildings, and they require a conspecific tutor to learn vocalization, like humans. Introducing a bioacoustic comparison, it is widely accepted that the house wren and the rufous-tailed hummingbird differ in the complexity of their songs, with the former having a complex song and the latter a simple one. Wrens (Trogloditidae), in general have a complex song (Kroodsma, 1980; Marler and Peters, 1988), and the song of the rufous-tailed hummingbird and similar species is characterized by simplicity and less variability in their repertoire (Mooney, 2009a; Jarvis, 2019).
Both species exhibited brain nucleus associated with vocal production and learning, along with GFAP astrocytes, indicating a convergent neural substrate for learning (Jarvis et al., 2000; Araya and Wright, 2013; Johnson and Clark, 2020; Kuhl et al., 2021). Recent findings demonstrate that hummingbirds have acquired songs functionally equivalent to those of songbirds, suggesting homology in vocal brain areas (Monte et al., 2023). This study uniquely establishes a relation between the convergence of GFAP astrocytes and regions involved in motor control (Morquette et al., 2015; Xin et al., 2019; Corkrum et al., 2020; Turk and SheikhBahaei, 2022). The observed neuroanatomical convergence aligns with the substantial genetic similarity, exceeding 90%, between hummingbirds and songbirds, particularly in astrocyte orthologous genes (Aqp4, S100β, Vimentin) and genes related to synaptic plasticity and singing (ZENK, PSD95, Synapsin, Parvalbumin, Doublecortin) (Jarvis et al., 2015). Acknowledging variations in vocal areas and astrocytes among species, it is postulated that the differences may stem from the non-homologous 10% of orthologous genes. This implies that while a portion of the singing learning mechanism is shared, another part evolves independently in response to complexity of communication. While it cannot be definitively concluded that phylogenetic differences explain astrocyte distinctions, the similarity in apprenticeship suggests a relation between astrocyte variations and song complexity at least in house wren. In this species, the abundance and morphological parameters of the astrocytes of the pallium and mesencephalon correlated significantly with the cellular density of the vocal areas involved in complex singing (Supplementary Figure S7). The intricacies observed in astrocytes and vocal areas may be considered a shared vulnerability, emphasizing the intertwined nature of their evolutionary paths.
The difference in the complexity of learned vocalizations between the house wren and the rufous-tailed hummingbird could be related to the cellular density and volume of the vocal areas in the brain. Here, we showed that the brain-to-body weight ratio in the house wren is slightly higher in than the rufous-tailed hummingbird. Also, the RA and HVC were shown to be more prominent in the house wren. It has been found that the size of the vocal repertoire positively correlates with the volume of the HVC and RA in species such as Cistothorus palustris, Serinus canaria, Acrocephalus schoenobaenus, Taeniopygia guttata, and Sturnus vulgaris (Nottebohm et al., 1981; Kroodsma and Canady, 1985; Nixdorf-Bergweiler, 1996; Airey et al., 2000; Airey and DeVoogd, 2000; Tramontin and Brenowitz, 2000). This indicates that these brain areas are related to vocal complexity, even among males and females of the same species who not engage in duet singing (Nixdorf-Bergweiler, 1996). It has also been observed that the HVC of the zebra finch Taeniopygia guttata exhibits neuronal clusters and greater myelination compared to the HVC of the hummingbird Amazilia (Gahr, 2000). The HVC, a brain region that integrates the song pathways, a sexually dimorphic trait, contains estrogen receptors, as well as expression of the aromatase enzyme. It should, however, be noted that this does not occur in hummingbirds. These enzymes are activated during the breeding season and are related to the increase in the volume of the vocal brain areas, especially the HVC and RA (Balthazart et al., 1992; Schlinger and Arnold, 1992; Gahr et al., 1993; Gahr and Metzdorf, 1997; Metzdorf et al., 1999; Brenowitz and Larson, 2015; Frankl-Vilches and Gahr, 2018; Larson, 2020).
Although a clear relationship between function and cell density in the vocal areas has not been established, it has been found in the White-browned Sparrow Weaver (Plocepasser mahali), a species with a social hierarchy, that the volume and gene expression of HVC and RA, as well as the total number of cells, depending on the social status of males. Dominant males have a larger volume and number of cells in these areas, as well as larger testes. However, this is not reflected in circulating levels of sex hormones (Voigt et al., 2007). Additionally, a relationship has been established between cell size and flight capacity, where smaller cells have a faster metabolism, favoring efficient gas exchange (Gregory, 2018). It can be inferred that the house wren, with its complex song, increases the volume of HVC and RA to facilitate interaction with the syrinx and respiration areas, allowing for more complex vocalization.
We showed that Area X of the house wren had a higher cell density than the rufous-tailed hummingbird. In the canary (Serinus canaria), Area X occupies a volume of 2.17 mm3, which is much larger than the volume of the RA and HVC (Vellema et al., 2011), suggesting that this structure allows for the incorporation of new repertoires that are regulated by new connections and synaptic plasticity mechanisms like LTP and LTD (Tramontin and Brenowitz, 2000; Ding and Perkel, 2004). Lesions in Area X in adult birds result in changes in the duration and sequence of the song (Kubikova et al., 2014). Being located in the striatum region, an essential part of the basal ganglia, Area X receives glutamate inputs from the pallium and certain regions of the thalamus, such as the medial part of the dorsolateral thalamic nucleus (DLM). It also receives dopaminergic innervation from the mesencephalon. These connections demonstrate the interaction of different brain regions for the song control system to function appropriately (Person et al., 2008). Additionally, Area X has a higher cell density in order to learn songs and maintains the plasticity of the repertoire through more extensive connections in the neural circuits.
We showed that the LMAN of the rufous-tailed hummingbird was more prominent and had higher cell density than the house wren. The LMAN area plays a vital role in vocal learning, although it is not directly involved in song production. Lesions in this area in juveniles reduce vocal learning capacity (Bottjer et al., 1984; Scharff and Nottebohm, 1991; Kittelberger and Mooney, 1999). In Amazilia amazilia and Calypte anna hummingbirds, it has been observed that the LMAN area exhibits higher cell density compared to the surrounding areas. This area becomes specialized from the early stages of development, enabling juveniles to learn to distinguish the song of their species (Gahr, 2000). For example, in male Anna’s hummingbirds, exposure to the tutor’s song induces song learning, demonstrating a process of attention and learning of acoustic stimuli in hummingbirds (Johnson and Clark, 2020). In comparison, in the rufous-tailed hummingbird, there is a strengthening of song learning in the LMAN area, which allows for feedback on songs produced by conspecifics and enables a similarity of vocalizations.
Although astrocytes have been extensively investigated in humans, there still needs to be more understanding of their broader evolutionary nature in other vertebrates. In birds, astrocytes are similar to mammalian astrocytes in structure and function, but there may be differences among species (Verkhratsky et al., 2019; Falcone, 2022). The HVC and the RA contain neuronal cells, glial cells such as astrocytes, ependymal cells, oligodendrocytes, and oligodendrocyte precursor cells (Roberts et al., 2017; Colquitt et al., 2021). Although we did not find robust labeling of astrocytes in the specific vocal areas (LMAN, Area X, RA, and HVC) in the two species, the presence of astrocytes was observed in the pallium, specifically in LEP, and in vascular regions.
We showed abundant astrocytes in like white matter regions, such as the pallidum and mesencephalon, corresponding to the FPL and FRL, respectively. The lateral prosencephalic fascicle (FPL), also known as the medial telencephalic fascicle, is a bundle of nerve fibers that connects the hypothalamus with the limbic system, which is involved in the reward system and basal ganglia (Reiner et al., 2004a; Hernandez et al., 2006; Bradbury and Vehrencamp, 2011; Coenen et al., 2018) It is believed that the FPL plays similar roles in birds, coordinating song production in response to territorial defense and sexual selection, seeking a final reward such as deterring intruders or reproducing. In juvenile zebra finches, Taeniopygia guttata, the accuracy of song imitation correlates with brain areas distinct from those in the song motor control system. These areas in the pallium and pallidum, play a role in the early stages of learning before vocal production containing axonal fibers that facilitate connections between various brain regions and the participation of astrocytes, may hold a pivotal role in orchestrating this intricate process (Hamaide et al., 2020). In addition, the reticular formation of the brainstem (FRL) connects the spinal cord and the brain through ascending and descending connections. It plays roles in autonomic, motor, sensory, behavioral, and cognitive functions (Mettler, 1959; Hamaide et al., 2020). Brainstem-spinal pathways are involved in avian locomotion, with predominant locomotor areas found in the ventromedial gigantocellular reticular formation and dorsolateral parvocellular reticular formation (Steeves et al., 1987). These findings have been observed in other vertebrates (Steeves and Jordan, 1980; Eidelberg et al., 1981).
We found GFAP astrocytes in the LEP in the house wren and rufous-tailed hummingbird, also in the FPL and FRL in the house wren, and S100β astrocytes in the same three regions in the hummingbird. These areas are mainly composed of white matter and show strong myelination (Karten et al., 2013; Gedman et al., 2021). The presence of myelin in the brain and spinal cord areas suggests a need for fast and efficient communication between brain regions through the pathways passing through the FPL and FRL (Nickel and Gu, 2018). Myelination in these pathways is crucial for the precise control of bird vocalization. During development, differences in the speed and degree of myelination are observed in the vocal areas, with the DLM region showing early myelination and the HVC exhibiting a slower process (Champoux et al., 2021). Bird vocalization relies on the basal ganglia circuits, a region that integrates different brain areas (Creese and Iversen, 1975). Both neurons and astrocytes play a role in regulating dopamine levels in the basal ganglia (Smith and Kieval, 2000; Björklund and Dunnett, 2007; Rice et al., 2011; Vaughan and Foster, 2013). A lack of myelination can lead to disorders in motor coordination, cognition, and speech in humans (Duncan and Radcliff, 2016).
Comparative studies of astrocytes are based on cellular morphology. The GFAP protein is a house marker used to detect mature astrocytes, but it does not represent the entire heterogeneity of the astrocyte population. Immunostaining for GFAP allows visualization of astrocyte morphology (Hol and Pekny, 2015; Yang and Wang, 2015; O’Leary and Mechawar, 2021; Falcone, 2022). Additionally, the S100β protein is mainly found in astrocytes and is used as a marker in neurological diseases (Michetti et al., 2019). This contributes to understanding the presence and function of astrocytes in regions where they are expressed. Astrocyte morphology can vary between species, such as fish, amphibians, reptiles, and birds. GFAP is observed around the ventricles in thick and straight bundles in fish (Chen et al., 2020). In amphibians, astrocytes do not exhibit the typical star-shaped form (Onteniente et al., 1983). In reptiles, cells with clear astrocyte morphology are found (Bodega et al., 1990). In birds, astrocytes have similar functions to mammals, surrounding neuronal synapses and contacting blood vessels (Bairati and Bartoli, 1955; King, 1966).
The shape of astrocytes in birds varies according to the species, with different numbers and locations (Bairati and Bartoli, 1955; Falcone, 2022). In humans, protoplasmic astrocytes are mainly found in the brain’s gray matter, such as the cerebral cortex. They have large, ramified cell bodies with multiple short and dense processes extending in different directions, involved in contact with neurons and synapses (Bushong et al., 2002). On the other hand, fibrous astrocytes are housed in the white matter of the brain and have elongated and thin cell bodies, with long and slender processes predominantly in one direction. These processes provide structural and metabolic support along the nerve pathways (Miller and Raff, 1984; Oberheim et al., 2009, 2012; Sofroniew and Vinters, 2010; Tabata, 2015). In both species of birds, GFAP astrocytes located in the LEP had a morphology like protoplasmic astrocytes, while in house wren the FPL and FRL, astrocytes showed a morphology similar to fibrous astrocytes; this arrangement allows the bird to hear and perceive its environment, as well as respond appropriately to auditory stimuli. In the rufous-tailed hummingbird, S100β astrocytes have a simpler morphology, resembling varicosities or processes with a barely apparent soma from the mesencephalic areas to the vocal areas. Based on the heterogeneity of astrocyte populations, we recommend extending the analysis using astrocyte markers, such as GS and EAAT, which possibly link synaptic activity in vocal brain areas.
In conclusion, this comparative study provides valuable information on differences in vocal areas and astrocytes in two species of vocal learning birds, which suggests specific specialization in each species that would support differences in song complexity in these species. Despite not finding a typical astrocytic morphology in vocal areas, the GFAP astrocytes were located in motor relay areas necessary to support vocal production and complexity. These findings allow us to propose new ecophysiological studies in which incorporating other phylogenetically separated species and more individuals of each species could reproduce the associations between astrocytes and vocal behavior.
Data availability statement
The original contributions presented in the study are included in the article/Supplementary material, further inquiries can be directed to the corresponding author.
Ethics statement
The collection of biological specimens is covered by the framework permit for the collection of wild specimens for non-commercial purposes, which was issued by ANLA in resolution 1461 of December 3, 2014. The size sampling permission and the procedure was approved by the Ethics Committee for Animal Experimentation at the University (CEEA), resolution 139 of March 29, 2021.
Author contributions
CL-M: Data curation, Formal analysis, Investigation, Methodology, Software, Validation, Writing – original draft, Writing – review & editing. SH-M: Data curation, Formal analysis, Investigation, Methodology, Software, Writing – review & editing. PH: Data curation, Formal analysis, Investigation, Methodology, Software, Writing – review & editing. JT: Data curation, Formal analysis, Investigation, Methodology, Software, Writing – review & editing. GC-G: Data curation, Formal analysis, Investigation, Methodology, Software, Writing – review & editing. HR-G: Conceptualization, Funding acquisition, Investigation, Supervision, Writing – review & editing, Methodology. RP-D: Conceptualization, Formal analysis, Funding acquisition, Investigation, Methodology, Project administration, Supervision, Writing – original draft, Writing – review & editing.
Funding
The author(s) declare that financial support was received for the research, authorship, and/or publication of this article. This project was funded by CODI-UdeA 2020-33794 and young research program CODI UdeA 2021-46070.
Acknowledgments
The authors especially thank the University of Antioquia at Carmen de Viboral campus that supported the bird sampling location, Katherine Peña, for veterinarian assistance with the bird collection, the Biobank of the Neuroscience Group of Antioquia for the cryostat facility and the Confocal Microscopy Facility of the Institute of Biology at the University of Antioquia. The REDECA supported access to the Tissue scanning facility, the Laboratorio de Neuroanatomía at Pontificia Universidad Católica de Chile, which supported the 3D reconstruction of vocal brain areas. We thank Valeria Zapata for cellular density quantification and Helen Burnham for editing the English language style in the manuscript.
Conflict of interest
The authors declare that the research was conducted in the absence of any commercial or financial relationships that could be construed as a potential conflict of interest.
The author(s) declared that they were an editorial board member of Frontiers, at the time of submission. This had no impact on the peer review process and the final decision.
Publisher’s note
All claims expressed in this article are solely those of the authors and do not necessarily represent those of their affiliated organizations, or those of the publisher, the editors and the reviewers. Any product that may be evaluated in this article, or claim that may be made by its manufacturer, is not guaranteed or endorsed by the publisher.
Supplementary material
The Supplementary material for this article can be found online at: https://www.frontiersin.org/articles/10.3389/fnana.2024.1339308/full#supplementary-material
References
Airey, D. C., Buchanan, K. L., Szekely, T., Catchpole, C. K., and DeVoogd, T. J. (2000). Song, sexual selection, and a song control nucleus (HVc) in the brains of European sedge warblers. J. Neurobiol. 44, 1–6. doi: 10.1002/1097-4695(200007)44:1<1::AID-NEU1>3.0.CO;2-V
Airey, D. C., and DeVoogd, T. J. (2000). Greater song complexity is associated with augmented song system anatomy in zebra finches. Neuroreport 11, 2339–2344. doi: 10.1097/00001756-200007140-00054
Allen, N. J., and Eroglu, C. (2017). Cell biology of astrocyte-synapse interactions. Neuron 96, 697–708. doi: 10.1016/J.NEURON.2017.09.056
Álvarez, M., Córdoba, S., Mendoza, H., Ospina, M., Escobar, F., Umaña, A. M., et al. (2004). “Manual de MÉTODOS Para el DESARROLLO de INVENTARIOS de BIODIVERSIDAD,” C. M. Villa (Instituto de investigación de recursos biológicos Alexander Von Humboldt). Available at: http://repository.humboldt.org.co/bitstream/handle/20.500.11761/31419/63.pdf (accessed October 28, 2021).
Araya, M., and Wright, T. (2013). Open-ended song learning in a hummingbird. Biol. Lett. 9:20130625. doi: 10.1098/RSBL.2013.0625
Bailey, D. J., Makeyeva, Y. V., Paitel, E. R., Pedersen, A. L., Hon, A. T., Gunderson, J. A., et al. (2017). Hippocampal aromatization modulates spatial memory and characteristics of the synaptic membrane in the male Zebra finch. Endocrinology 158, 852–859. doi: 10.1210/EN.2016-1692
Bairati, A., and Bartoli, E. (1955). Ricerche morfologiche ed istochimiche sulla glia del nevrasse di vertebrati. IIℴ uccelli. Z. Zellforsch. 42, 273–304. doi: 10.1007/BF00319071/METRICS
Balthazart, J., Foidart, A., Wilson, E. M., and Ball, G. F. (1992). Immunocytochemical localization of androgen receptors in the male songbird and quail brain. J. Comp. Neurol. 317, 407–420. doi: 10.1002/CNE.903170407
Bankhead, P., Loughrey, M. B., Fernández, J. A., Dombrowski, Y., McArt, D. G., Dunne, P. D., et al. (2017). QuPath: open source software for digital pathology image analysis. Sci. Rep. 7:16878. doi: 10.1038/S41598-017-17204-5
Baptista, L., and Schuchmann, K. (1990). Song learning in the Anna hummingbird (Calypte anna). Ethology 84, 15–26. doi: 10.1111/J.1439-0310.1990.TB00781.X
Beecher, M., and Brenowitz, E. (2005). Functional aspects of song learning in songbirds. Trends Ecol. Evol. 20, 143–149. doi: 10.1016/J.TREE.2005.01.004
Björklund, A., and Dunnett, S. B. (2007). Dopamine neuron systems in the brain: an update. Trends Neurosci. 30, 194–202. doi: 10.1016/J.TINS.2007.03.006
Bodega, G., Suárez, I., Rubio, M., and Fernández, B. (1990). Distribution and characteristics of the different astroglial cell types in the adult lizard (Lacerta lepida) spinal cord. Anat. Embryol. (Berl) 181, 567–575. doi: 10.1007/BF00174628/METRICS
Bottjer, S. W., Miesner, E. A., and Arnold, A. P. (1984). Forebrain lesions disrupt development but not maintenance of song in passerine birds. Science 224, 901–903. doi: 10.1126/science.6719123
Bradbury, J., and Vehrencamp, S. (2011). Principles of animal communication (Libro, 2011) [WorldCat.org]. Available at: https://www.worldcat.org/title/principles-of-animal-communication/oclc/747947250 (accessed October 21, 2021).
Brainard, M., and Doupe, A. (2002, 2002). What songbirds teach us about learning. Nature 417:4176886, 351–358. doi: 10.1038/417351a
Brenowitz, E. A., Baptista, L. F., Lent, K., and Wingfield, J. C. (1998). Seasonal plasticity of the song control system in wild Nuttall’s white-crowned sparrows - Brenowitz - 1998 - Journal of neurobiology - Wiley online library. J. Neurobiol. 34, 69–82. doi: 10.1002/(sici)1097-4695(199801)34:1<69::aid-neu6>3.0.co;2-a
Brenowitz, E. A., and Larson, T. A. (2015). Neurogenesis in the adult avian song-control system. Cold Spring Harb. Perspect. Biol. 7, 1–24. doi: 10.1101/CSHPERSPECT.A019000
Bushong, E. A., Martone, M. E., Jones, Y. Z., and Ellisman, M. H. (2002). Protoplasmic astrocytes in CA1 stratum radiatum occupy separate anatomical domains. J. Neurosci. 22, 183–192. doi: 10.1523/JNEUROSCI.22-01-00183.2002
Carvalho-Paulo, D., de Morais Magalhães, N. G., de Almeida Miranda, D., Diniz, D. G., Henrique, E. P., Moraes, I. A. M., et al. (2018). Hippocampal astrocytes in migrating and wintering semipalmated sandpiper calidris pusilla. Front. Neuroanat. 11:126. doi: 10.3389/FNANA.2017.00126/BIBTEX
Champoux, K. L., Miller, K. E., and Perkel, D. J. (2021). Differential development of myelin in zebra finch song nuclei. J. Comp. Neurol. 529, 1255–1265. doi: 10.1002/CNE.25019
Chen, J., Poskanzer, K. E., Freeman, M. R., and Monk, K. R. (2020). Live-imaging of astrocyte morphogenesis and function in zebrafish neural circuits. Nat. Neurosci. 23, 1297–1306. doi: 10.1038/s41593-020-0703-x
Clive, K., (2008). Bird song: Biological themes and variations. Cambridge University Press. Cambridge
Coenen, V. A., Schumacher, L. V., Kaller, C., Schlaepfer, T. E., Reinacher, P. C., Egger, K., et al. (2018). The anatomy of the human medial forebrain bundle: ventral tegmental area connections to reward-associated subcortical and frontal lobe regions. NeuroImage. Clin. 18, 770–783. doi: 10.1016/J.NICL.2018.03.019
Colombo, J. A., Reisin, H. D., Miguel-Hidalgo, J. J., and Rajkowska, G. (2006). Cerebral cortex astroglia and the brain of a genius: a propos of A. Einstein’s. Brain Res. Rev. 52, 257–263. doi: 10.1016/J.BRAINRESREV.2006.03.002
Colquitt, B. M., Merullo, D. P., Konopka, G., Roberts, T. F., and Brainard, M. S. (2021). Cellular transcriptomics reveals evolutionary identities of songbird vocal circuits. Science 371:eabd9704. doi: 10.1126/SCIENCE.ABD9704
Corkrum, M., Covelo, A., Lines, J., Bellocchio, L., Pisansky, M., Loke, K., et al. (2020). Dopamine-evoked synaptic regulation in the nucleus Accumbens requires astrocyte activity. Neuron 105, 1036–1047.e5. doi: 10.1016/J.NEURON.2019.12.026
Creese, I., and Iversen, S. D. (1975). The pharmacological and anatomical substrates of the amphetamine response in the rat. Brain Res. 83, 419–436. doi: 10.1016/0006-8993(75)90834-3
Diamond, M. C., Scheibel, A. B., Murphy, G. M., and Harvey, T. (1985). On the brain of a scientist: Albert Einstein. Exp. Neurol. 88, 198–204. doi: 10.1016/0014-4886(85)90123-2
Ding, L., and Perkel, D. J. (2004). Long-term potentiation in an avian basal ganglia nucleus essential for vocal learning. J. Neurosci. 24, 488–494. doi: 10.1523/JNEUROSCI.4358-03.2004
Duncan, I. D., and Radcliff, A. B. (2016). Inherited and acquired disorders of myelin: the underlying myelin pathology. Exp. Neurol. 283, 452–475. doi: 10.1016/J.EXPNEUROL.2016.04.002
Duncan, K. A., and Saldanha, C. J. (2011). Neuroinflammation induces glial aromatase expression in the uninjured songbird brain. J. Neuroinflammation 8:81. doi: 10.1186/1742-2094-8-81
Duncan, K. A., Walters, B. J., and Saldanha, C. J. (2013). Traumatized and inflamed - but resilient: glial aromatization and the avian brain. Horm. Behav. 63, 208–215. doi: 10.1016/j.yhbeh.2012.02.026
Echeverry-Galvis, Á. M., Acevedo-Charry, O., Avendaño, E. J., Gómez, C., Stiles, F. G., Estela, F. A., et al. (2022). Lista oficial de las aves de Colombia 2022: Adiciones, cambios taxonómicos y actualizaciones de estado checklist of the birds of Colombia 2022: additions, taxonomic changes, and status update. Ornitol. Colomb. 22, 25–51. doi: 10.59517/oc.e548
Eidelberg, E., Walden, J. G., and Nguyen, L. H. (1981). Locomotor control in macaque monkeys. Brain 104, 647–663. doi: 10.1093/BRAIN/104.4.647-A
Eroglu, Ç., Allen, N. J., Susman, M. W., O’Rourke, N. A., Park, C. Y., Özkan, E., et al. (2009). Gabapentin receptor α2δ-1 is a neuronal thrombospondin receptor responsible for excitatory CNS synaptogenesis. Cell 139, 380–392. doi: 10.1016/J.CELL.2009.09.025
Falcone, C. (2022). Evolution of astrocytes: from invertebrates to vertebrates. Front. Cell Dev. Biol. 10:1586. doi: 10.3389/FCELL.2022.931311/BIBTEX
Fernández-Arjona, M. D. M., Grondona, J. M., Granados-Durán, P., Fernández-Llebrez, P., and López-Ávalos, M. D. (2017). Microglia morphological categorization in a rat model of neuroinflammation by hierarchical cluster and principal components analysis. Front. Cell. Neurosci. 11:235. doi: 10.3389/fncel.2017.00235
Fitch, W. T., and Jams, E. D. (2015). “Birdsong and other animal models for human speech, song, and vocal learning” in Language, Music, and the Brain: A Mysterious Relationship. ed. M. A. Arbib (Cambridge, MA: MIT Press)
Fortune, E., and Margoliash, D. (1992). Cytoarchitectonic organization and morphology of cells of the field L complex in male zebra finches (Taenopygia guttata). J. Comp. Neurol. 325, 388–404. doi: 10.1002/CNE.903250306
Frankl-Vilches, C., and Gahr, M. (2018). Androgen and estrogen sensitivity of bird song: a comparative view on gene regulatory levels. J. Comp. Physiol. A Neuroethol. Sens. Neural Behav. Physiol. 204, 113–126. doi: 10.1007/S00359-017-1236-Y
Gadagkar, V., Puzerey, P. A., Chen, R., Baird-Daniel, E., Farhang, A. R., and Goldberg, J. H. (2016). Dopamine neurons encode performance error in singing birds. Science 80, 1278–1282. doi: 10.1126/SCIENCE.AAH6837/SUPPL_FILE/GADAGKAR.SM.PDF
Gahr, M. (2000). Neural song control system of hummingbirds: comparison to swifts, vocal learning (songbirds) and nonlearning (suboscines) passerines, and vocal learning (budgerigars) and nonlearning (dove, owl, gull, quail, chicken) nonpasserines. J. Comp. Neurol. 426, 182–196. doi: 10.1002/1096-9861(20001016)426:2<182::aid-cne2>3.0.co;2-m
Gahr, M., Güttinger, H. -R., and Kroodsma, D. E. (1993). Estrogen receptors in the avian brain: survey reveals general distribution and forebrain areas unique to songbirds. J. Comp. Neurol. 327, 112–122. doi: 10.1002/CNE.903270109
Gahr, M., and Metzdorf, R. (1997). Distribution and dynamics in the expression of androgen and estrogen receptors in vocal control systems of songbirds. Brain Res. Bull. 44, 509–517. doi: 10.1016/S0361-9230(97)00233-5
Gedman, G., Haase, B., Durieux, G., Biegler, M. T., Fedrigo, O., and Jarvis, E. D. (2021). As above, so below: whole transcriptome profiling demonstrates strong molecular similarities between avian dorsal and ventral pallial subdivisions. J. Comp. Neurol. 529, 3222–3246. doi: 10.1002/CNE.25159
Giordani, C., Rivera-Gutierrez, H., Zhe, S., and Micheletto, R. (2018). Simulation of the song motor pathway in birds: A single neuron initiates a chain of events that produces birdsong with realistic spectra properties. PLoS One 13:e0200998. doi: 10.1371/JOURNAL.PONE.0200998
Gregory, T. R. (2018). Genome size and brain cell density in birds. Can. J. Zool. 96, 379–382. doi: 10.1139/CJZ-2016-0306
Gulledge, C. C., and Deviche, P. (1997). Androgen control of vocal control region volumes in a wild migratory songbird (Junco hyemalis) is region and possibly age dependent. J. Neurobiol. 32, 391–402. doi: 10.1002/(SICI)1097-4695(199704)32:4
Haim, L. B., and Rowitch, D. H. (2016, 2016). Functional diversity of astrocytes in neural circuit regulation. Nat. Rev. Neurosci. 181, 31–41. doi: 10.1038/nrn.2016.159
Hall, Z. J., MacDougall-Shackleton, S. A., Osorio-Beristain, M., and Murphy, T. G. (2010). Male Bias in the song control system despite female Bias in song rate in streak-backed orioles (Icterus pustulatus). Brain Behav. Evol. 76, 168–175. doi: 10.1159/000320971
Hamaide, J., Lukacova, K., Orije, J., Keliris, G. A., Verhoye, M., and van der Linden, A. (2020). In vivo assessment of the neural substrate linked with vocal imitation accuracy. eLife 9:e49941. doi: 10.7554/ELIFE.49941
Hernandez, G., Hamdani, S., Rajabi, H., Conover, K., Stewart, J., Arvanitogiannis, A., et al. (2006). Prolonged rewarding stimulation of the rat medial forebrain bundle: neurochemical and behavioral consequences. Behav. Neurosci. 120, 888–904. doi: 10.1037/0735-7044.120.4.888
Hol, E. M., and Pekny, M. (2015). Glial fibrillary acidic protein (GFAP) and the astrocyte intermediate filament system in diseases of the central nervous system. Curr. Opin. Cell Biol. 32, 121–130. doi: 10.1016/J.CEB.2015.02.004
Jarvis, E. D. (2019). Evolution of vocal learning and spoken language. Science 366, 50–54. doi: 10.1126/SCIENCE.AAX0287
Jarvis, E., Güntürkün, O., Bruce, L., Csillag, A., Karten, H., Kuenzel, W., et al. (2005). Avian brains and a new understanding of vertebrate brain evolution. Nat. Rev. Neurosci. 62, 151–159. doi: 10.1038/nrn1606
Jarvis, E. D., Mirarab, S., Aberer, A. J., Li, B., Houde, P., Li, C., et al. (2015). Phylogenomic analyzes data of the avian phylogenomics project. Gigascience 4:4. doi: 10.1186/S13742-014-0038-1/2707489
Jarvis, E. D., Ribeiro, S., Da Silva, M. L., Ventura, D., Vielliard, J., and Mello, C. V. (2000). Behaviourally driven gene expression reveals song nuclei in hummingbird brain. Nature 406, 628–632. doi: 10.1038/35020570
Jeff, A., and Cagla, E. (2017). The interplay between neurons and glia in synapse development and plasticity. Curr. Opin. Neurobiol. 42, 1–8. doi: 10.1016/J.CONB.2016.09.016
Jiménez, R., Navarro, A., and Benítez, H. (2001). “Viii. El LENGUAJE de las AVES,” in El dominio del aire, FONDO DE CULTURA ECONÓMICA (FCE) (Mexico). Available at: http://bibliotecadigital.ilce.edu.mx/sites/ciencia/volumen3/ciencia3/138/htm/sec_13.htm (accessed December 21, 2021).
Johnson, K. E., and Clark, C. J. (2020). Ontogeny of vocal learning in a hummingbird. Anim. Behav. 167, 139–150. doi: 10.1016/J.ANBEHAV.2020.07.010
Kafitz, K. W., Güttinger, H. R., and Müller, C. M. (1999). Seasonal changes in astrocytes parallel neuronal plasticity in the song control area HVc of the canary. Glia 27, 88–100. doi: 10.1002/(sici)1098-1136(199907)27:1<88::aid-glia9>3.0.co;2-a
Kálman, M., and Pritz, M. B. (2001). Glial fibrillary acidic protein-immunopositive structures in the brain of a crocodilian, Caiman crocodilus, and its bearing on the evolution of astroglia | request PDF. J. Comp. Neurol. 431, 460–480. doi: 10.1002/1096-9861(20010319)431:4<460::aid-cne1083>3.3.co;2-8
Karatu, A. L., Olopade, F., Folarin, O. R., and Ladagu, A. (2020). Some aspects of Neuromorphology, and the co-localization of glial related markers in the brains of striped owl (Asioclamator) from north East Nigeria. Niger. J. Physiol. Sci. 35, 109–114.
Karperien, A. (n.d.). “FracLac for ImageJ.” Available at: https://imagej.nih.gov/ij/plugins/fraclac/FLHelp/Introduction.htm (accessed March 30, 2023).
Karten, H. J., Brzozowska-Prechtl, A., Lovell, P. V., Tang, D. D., Mello, C. V., Wang, H., et al. (2013). Digital atlas of the zebra finch (Taeniopygia guttata) brain: A high-resolution photo atlas. J. Comp. Neurol. 521, 3702–3715. doi: 10.1002/CNE.23443
Khan, Z. U., Koulen, P., Rubinstein, M., Grandy, D. K., and Goldman-Rakic, P. S. (2001). An astroglia-linked dopamine D2-receptor action in prefrontal cortex. Proc. Natl. Acad. Sci. USA 98, 1964–1969. doi: 10.1073/PNAS.98.4.1964/ASSET/4745C72E-2626-4998-9062-D471BEF809EF/ASSETS/GRAPHIC/PQ0415882006.JPEG
King, J. S. (1966). A comparative investigation of neuroglia in representative vertebrates: a silver carbonate study. J. Morphol. 119, 435–465. doi: 10.1002/JMOR.1051190405
Kittelberger, J. M., and Mooney, R. (1999). Lesions of an avian forebrain nucleus that disrupt song development Alter synaptic connectivity and transmission in the vocal premotor pathway. J. Neurosci. 19, 9385–9398. doi: 10.1523/JNEUROSCI.19-21-09385.1999
Kofuji, P., and Araque, A. (2021). Astrocytes and behavior. Annu. Rev. Neurosci. 44, 49–67. doi: 10.1146/ANNUREV-NEURO-101920-112225
Kopec, A. M., and Carew, T. J. (2013). Growth factor signaling and memory formation: temporal and spatial integration of a molecular network. Learn. Mem. 20, 531–539. doi: 10.1101/LM.031377.113
Kroodsma, D. E. (1980). Winter wren singing behavior: a pinnacle of song complexity. Condor 82, 357–364. doi: 10.2307/1367556
Kroodsma, D. E., and Canady, R. A. (1985). Differences in repertoire size, singing behavior, and associated neuroanatomy among marsh wren populations have a genetic basis. Auk 102, 439–446. doi: 10.1093/AUK/102.3.439
Kubikova, L., Bosikova, E., Cvikova, M., Lukacova, K., Scharff, C., and Jarvis, E. D. (2014). Basal ganglia function, stuttering, sequencing, and repair in adult songbirds. Sci. Rep. 4:6590. doi: 10.1038/SREP06590
Kuhl, H., Frankl-Vilches, C., Bakker, A., Mayr, G., Nikolaus, G., Boerno, S. T., et al. (2021). An unbiased molecular approach using 3′-UTRs resolves the avian family-level Tree of life. Mol. Biol. Evol. 38, 108–127. doi: 10.1093/MOLBEV/MSAA191
Laddach, A., Chng, S. H., Lasrado, R., Progatzky, F., Shapiro, M., Erickson, A., et al. (2023). A branching model of lineage differentiation underpinning the neurogenic potential of enteric glia. Nat. Commun. 14, 1–20. doi: 10.1038/s41467-023-41492-3
Larson, T. A. (2020). Cell death in the avian brain with emphasis on the development and plasticity of the song control system. Int. Rev. Cell Mol. Biol. 352, 83–113. doi: 10.1016/BS.IRCMB.2020.01.001
Longair, M. H., Baker, D. A., and Armstrong, J. D. (2011). Simple neurite tracer: open source software for reconstruction, visualization and analysis of neuronal processes. Bioinformatics 27, 2453–2454. doi: 10.1093/BIOINFORMATICS/BTR390
Lovell, P. V., Wirthlin, M., Kaser, T., Buckner, A. A., Carleton, J. B., Snider, B. R., et al. (2020). ZEBrA: Zebra finch expression brain atlas-A resource for comparative molecular neuroanatomy and brain evolution studies. J. Comp. Neurol. 528, 2099–2131. doi: 10.1002/cne.24879
Marler, P., and Peters, S. (1988). The role of song phonology and syntax in vocal learning preferences in the song sparrow, Melospiza melodia. Ethology 77, 125–149. doi: 10.1111/J.1439-0310.1988.TB00198.X
Mello, C. V. (2004). Gene regulation by song in the auditory telencephalon of songbirds. Front. Biosci. 9, 63–73. doi: 10.2741/1201
Mettler, F. A. (1959). The reticular formation of the brain stem; anatomical aspects and functional correlations. J. Neuropathol. Exp. Neurol. 18, 649–650. doi: 10.1097/00005072-195910000-00019
Metzdorf, R., Gahr, M., and Fusani, L. (1999). Distribution of aromatase, estrogen receptor, and androgen receptor mRNA in the forebrain of songbirds and nonsongbirds. J. Comp. Neurol. 407, 115–129. doi: 10.1002/(SICI)1096-9861(19990428)407:1<115::AID-CNE9>3.0.CO;2-W
Michetti, F., D’Ambrosi, N., Toesca, A., Puglisi, M. A., Serrano, A., Marchese, E., et al. (2019). The S100B story: from biomarker to active factor in neural injury. J. Neurochem. 148, 168–187. doi: 10.1111/JNC.14574
Mikula, P., Petrusková, T., and Albrecht, T. (2018). Song complexity—no correlation between standard deviation of frequency and traditionally used song complexity metrics in passerines: A comment on Pearse et al. (2018). Evolution 72, 2832–2835. doi: 10.1111/EVO.13634
Miller, R. H., and Raff, M. C. (1984). Fibrous and protoplasmic astrocytes are biochemically and developmentally distinct. J. Neurosci. 4, 585–592. doi: 10.1523/JNEUROSCI.04-02-00585.1984
Molofsky, A. V., Kelley, K. W., Tsai, H.-H., Redmond, S. A., Chang, S. M., Madireddy, L., et al. (2014). Astrocyte-encoded positional cues maintain sensorimotor circuit integrity. Nature 509, 189–194. doi: 10.1038/NATURE13161
Monte, A., da Silva, M. L., and Gahr, M. (2023). Absence of song suggests heterogeneity of vocal-production learning in hummingbirds. J. Ornithol. 164, 721–727. doi: 10.1007/S10336-023-02057-9
Mooney, R. (2009a). Neural mechanisms for learned birdsong. Learn. Mem. 16, 655–669. doi: 10.1101/lm.1065209
Mooney, R. (2009b). Neurobiology of song learning. Curr. Opin. Neurobiol. 19, 654–660. doi: 10.1016/J.CONB.2009.10.004
Mooney, R., Prather, J., and Roberts, T. (2007). Neurophysiology of birdsong learning. Learn. Mem. A Compr. Ref. 3, 441–474. doi: 10.1016/B978-012370509-9.00116-9
Morquette, P., Verdier, D., Kadala, A., Féthière, J., Philippe, A. G., Robitaille, R., et al. (2015). An astrocyte-dependent mechanism for neuronal rhythmogenesis. Nat. Neurosci. 18, 844–854. doi: 10.1038/nn.4013
Nickel, M., and Gu, C. (2018). Regulation of central nervous system myelination in higher brain functions. Neural Plast. 2018, 1–12. doi: 10.1155/2018/6436453
Nieto, M. (2003). Plasticidad neural. Mente y Cereb., 72–80. Available at: http://s3.amazonaws.com/academia.edu.documents/36346978/plasticidad_neuronal.pdf?AWSAccessKeyId=AKIAJ56TQJRTWSMTNPEA&Expires=1482690634&Signature=wK0U4Zpyt4UTPMvzOGtrkcKZjgU%3D&response-content-disposition=inline%3B.filename%3DPlasticidad_neuronal.pdf (accessed December 22, 2021).
Nixdorf-Bergweiler, B. E. (1996). Divergent and parallel development in volume sizes of telencephalic song nuclei in and female zebra finches - Nixdorf-Bergweiler - 1996 - Journal of comparative neurology - Wiley online library. J. Comp. Neurol. 375, 445–456. doi: 10.1002/(SICI)1096-9861(19961118)375:3<445::AID-CNE7>3.0.CO;2-2
Nottebohm, F., Kasparian, S., and Pandazis, C. (1981). Brain space for a learned task. Brain Res. 213, 99–109. doi: 10.1016/0006-8993(81)91250-6
Nottebohm, F., Nottebohm, M. E., and Crane, L. (1986). Developmental and seasonal changes in canary song and their relation to changes in the anatomy of song-control nuclei. Behav. Neural Biol. 46, 445–471. doi: 10.1016/S0163-1047(86)90485-1
Nottebohm, F., Stokes, T. M., and Leonard, C. M. (1976). Central control of song in the canary, Serinus canarius. J. Comp. Neurol. 165, 457–486. doi: 10.1002/CNE.901650405
O’Leary, L. A., and Mechawar, N. (2021). Implication of cerebral astrocytes in major depression: A review of fine neuroanatomical evidence in humans. Glia 69, 2077–2099. doi: 10.1002/GLIA.23994
Oberheim, N. A., Goldman, S. A., and Nedergaard, M. (2012). Heterogeneity of astrocytic form and function. Methods Mol. Biol. 814:23. doi: 10.1007/978-1-61779-452-0_3
Oberheim, N. A., Takano, T., Han, X., He, W., Lin, J. H. C., Wang, F., et al. (2009). Uniquely hominid features of adult human astrocytes. J. Neurosci. 29, 3276–3287. doi: 10.1523/JNEUROSCI.4707-08.2009
Onteniente, B., Kimura, H., and Maeda, T. (1983). Comparative study of the glial fibrillary acidic protein in vertebrates by PAP immunohistochemistry. J. Comp. Neurol. 215, 427–436. doi: 10.1002/CNE.902150407
Person, A. L., Gale, S. D., Farries, M. A., and Perkel, D. J. (2008). Organization of the songbird basal ganglia, including area X. J. Comp. Neurol. 508, 840–866. doi: 10.1002/CNE.21699
Pfenning, A., Hara, E., Whitney, O., Rivas, M., Wang, R., Roulhac, P., et al. (2014). Convergent transcriptional specializations in the brains of humans and song-learning birds. Science 346:1256846. doi: 10.1126/SCIENCE.1256846
Poirier, C., Vellema, M., Verhoye, M., Van Meir, V., Wild, J. M., Balthazart, J., et al. (2008). A three-dimensional MRI atlas of the zebra finch brain in stereotaxic coordinates. NeuroImage 41, 1–6. doi: 10.1016/J.NEUROIMAGE.2008.01.069
Polomova, J., Lukacova, K., Bilcik, B., and Kubikova, L. (2019). Is neurogenesis in two songbird species related to their song sequence variability? Proc. R. Soc. B Biol. Sci. 286:20182872. doi: 10.1098/RSPB.2018.2872
Posada-Duque, R. A., Velasquez-Carvajal, D., Eckert, G. P., and Cardona-Gomez, G. P. (2013). Atorvastatin requires geranylgeranyl transferase-I and Rac1 activation to exert neuronal protection and induce plasticity. Neurochem. Int. 62, 433–445. doi: 10.1016/J.NEUINT.2013.01.026
Rantamäki, T., Kemppainen, S., Autio, H., Stavén, S., Koivisto, H., Kojima, M., et al. (2013). The impact of Bdnf gene deficiency to the memory impairment and brain pathology of APPswe/PS1dE9 mouse model of Alzheimer’s disease. PLoS One 8:e68722. doi: 10.1371/JOURNAL.PONE.0068722
Reiner, A., Perkel, D. J., Bruce, L. L., Butler, A. B., Csillag, A., Kuenzel, W., et al. (2004a). Revised nomenclature for avian telencephalon and some related brainstem nuclei. J. Comp. Neurol. 473, 377–414. doi: 10.1002/cne.20118
Reiner, A., Perkel, D. J., Mello, C. V., and Jarvis, E. D. (2004b). Songbirds and the revised avian brain nomenclature. Ann. N. Y. Acad. Sci. 1016, 77–108. doi: 10.1196/ANNALS.1298.013
Rice, M. E., Patel, J. C., and Cragg, S. J. (2011). Dopamine release in the basal ganglia. Neuroscience 198, 112–137. doi: 10.1016/J.NEUROSCIENCE.2011.08.066
Roberts, T. F., Hisey, E., Tanaka, M., Kearney, M. G., Chattree, G., Yang, C. F., et al. (2017). Identification of a motor-to-auditory pathway important for vocal learning. Nat. Neurosci. 20, 978–986. doi: 10.1038/nn.4563
Roberts, T., and Mooney, R. (2013). Motor circuits help encode auditory memories of vocal models used to guide vocal learning. Hear. Res. 303, 48–57. doi: 10.1016/J.HEARES.2013.01.009
Scharff, C., and Nottebohm, F. (1991). A comparative study of the behavioral deficits following lesions of various parts of the zebra finch song system: implications for vocal learning. J. Neurosci. 11, 2896–2913. doi: 10.1523/JNEUROSCI.11-09-02896.1991
Schindelin, J., Arganda-Carreras, I., Frise, E., Kaynig, V., Longair, M., Pietzsch, T., et al. (2012). Fiji: an open-source platform for biological-image analysis. Nat. Methods 9, 676–682. doi: 10.1038/NMETH.2019
Schlinger, B. A., and Arnold, A. P. (1992). Circulating estrogens in a male songbird originate in the brain. Proc. Natl. Acad. Sci. USA 89, 7650–7653. doi: 10.1073/PNAS.89.16.7650
Scott, J. (2005). “House wren (Troglodytes aedon)” in The Birds of North America. ed. P. G. Rodewald (Ithaca: Cornell Lab of Ornithology)
Sibley, C. G., and Ahlquist, J. E. (1990). Phylogeny and classification of birds: a study in molecular evolution. Yale University Press New Haven
Skutch, A. (1931). The life history Of’rieffer’s hummingbird (Amazilia Tzacatl Tzacatl) in panama and honduras. Auk A Q. J. Ornithol. XLVIII, 481–500. Available at: https://sora.unm.edu/sites/default/files/journals/auk/v048n04/p0481-p0500.pdf (accessed May 4, 2023).
Smith, T. (1996). Seasonal plasticity in the song nuclei of wild rufous-sided towhees. Brain Res. 734, 79–85. doi: 10.1016/0006-8993(96)00613-0
Smith, G. T., Brenowitz, E. A., Beecher, M. D., and Wingfield, J. C. (1997). Seasonal changes in testosterone, neural attributes of song control nuclei, and song structure in wild songbirds. J. Neurosci. 17, 6001–6010. doi: 10.1523/jneurosci.17-15-06001.1997
Smith, Y., and Kieval, J. Z. (2000). Anatomy of the dopamine system in the basal ganglia. Trends Neurosci. 23, S28–S33. doi: 10.1016/S1471-1931(00)00023-9
Sofroniew, M. V., and Vinters, H. V. (2010). Astrocytes: biology and pathology. Acta Neuropathol. 119, 7–35. doi: 10.1007/S00401-009-0619-8
Soma, K. K., Hartman, V. N., Wingfield, J. C., and Brenowitz, E. A. (1999). Seasonal changes in androgen receptor immunoreactivity in the song nucleus HVc of a wild bird. J. Comp. Neurol. 409, 224–236. doi: 10.1002/(SICI)1096-9861(19990628)409:2<224::AID-CNE4>3.0.CO;2-V
Steeves, J. D., and Jordan, L. M. (1980). Localization of a descending pathway in the spinal cord which is necessary for controlled treadmill locomotion. Neurosci. Lett. 20, 283–288. doi: 10.1016/0304-3940(80)90161-5
Steeves, J. D., Sholomenko, G. N., and Webster, D. M. S. (1987). Stimulation of the pontomedullary reticular formation initiates locomotion in decerebrate birds. Brain Res. 401, 205–212. doi: 10.1016/0006-8993(87)91406-5
Steinman, M. Q., Valenzuela, A. E., Siopes, T. D., and Millam, J. R. (2013). Tuberal hypothalamic expression of the glial intermediate filaments, glial fibrillary acidic protein and vimentin across the Turkey hen (Meleagris gallopavo) reproductive cycle: further evidence for a role of glial structural plasticity in seasonal reproduction. Gen. Comp. Endocrinol. 193, 141–148. doi: 10.1016/J.YGCEN.2013.08.001
Stokes, T. M., Leonard, C. M., and Nottebohm, F. (1974). The telencephalon, diencephalon, and mesencephalon of the canary, Serinus canaria, in stereotaxic coordinates. J. Comp. Neurol. 156, 337–374. doi: 10.1002/CNE.901560305
Tabata, H. (2015). Diverse subtypes of astrocytes and their development during corticogenesis. Front. Neurosci. 9:114. doi: 10.3389/FNINS.2015.00114/BIBTEX
Tramontin, A. D., and Brenowitz, E. A. (2000). Seasonal plasticity in the adult brain. Trends Neurosci. 23, 251–258. doi: 10.1016/S0166-2236(00)01558-7
Turk, A. Z., Lotfi Marchoubeh, M., Fritsch, I., Maguire, G. A., and SheikhBahaei, S. (2021). Dopamine, vocalization, and astrocytes. Brain Lang. 219:104970. doi: 10.1016/J.BANDL.2021.104970
Turk, A. Z., and SheikhBahaei, S. (2022). Morphometric analysis of astrocytes in vocal production circuits of common marmoset (Callithrix jacchus). J. Comp. Neurol. 530, 574–589. doi: 10.1002/CNE.25230
Vaughan, R. A., and Foster, J. D. (2013). Mechanisms of dopamine transporter regulation in normal and disease states. Trends Pharmacol. Sci. 34, 489–496. doi: 10.1016/J.TIPS.2013.07.005
Vellema, M., Van Der Linden, A., and Gahr, M. (2010). Area-specific migration and recruitment of new neurons in the adult songbird brain. J. Comp. Neurol. 518, 1442–1459. doi: 10.1002/CNE.22281
Vellema, M., Verschueren, J., Van Meir, V., and Van der Linden, A. (2011). A customizable 3-dimensional digital atlas of the canary brain in multiple modalities. NeuroImage 57, 352–361. doi: 10.1016/J.NEUROIMAGE.2011.04.033
Verkhratsky, A., Ho, M. S., and Parpura, V. (2019). Evolution of neuroglia. Adv. Exp. Med. Biol. 1175, 15–44. doi: 10.1007/978-981-13-9913-8_2
Voigt, C., Leitner, S., and Gahr, M. (2007). Socially induced brain differentiation in a cooperatively breeding songbird. Proc. R. Soc. B Biol. Sci. 274, 2645–2652. doi: 10.1098/RSPB.2007.0858
W’mningham-Major, F., Staecker, J. L., Barger, S. W., Coats, S., and Van Eldik, L. J. (1989). Neurite extension and neuronal survival activities of recombinant $100 proteins that differ in the content and position of cysteine residues. J. Cell Biol. 109, 3063–3071. doi: 10.1083/jcb.109.6.3063
Williams, B., and Houtman, A. (2008). Song of Costa’s hummingbird (Calypte Costae). Auk A Q. J. Ornithol. 125, 663–669. doi: 10.1525/AUK.2008.07058
Wynne, R. D., Walters, B. J., Bailey, D. J., and Saldanha, C. J. (2008). Inhibition of injury-induced glial aromatase reveals a wave of secondary degeneration in the songbird brain. Glia 56, 97–105. doi: 10.1002/GLIA.20594
Xin, W., Schuebel, K. E., Jair, K. W., Cimbro, R., De Biase, L. M., Goldman, D., et al. (2019). Ventral midbrain astrocytes display unique physiological features and sensitivity to dopamine D2 receptor signaling. Neuropsychopharmacology 44, 344–355. doi: 10.1038/S41386-018-0151-4
Yang, Z., and Wang, K. K. W. (2015). Glial fibrillary acidic protein: from intermediate filament assembly and gliosis to neurobiomarker. Trends Neurosci. 38, 364–374. doi: 10.1016/J.TINS.2015.04.003
Zhang, Y., Sloan, S. A., Clarke, L. E., Caneda, C., Plaza, C. A., Blumenthal, P. D., et al. (2016). Purification and characterization of progenitor and mature human astrocytes reveals transcriptional and functional differences with mouse. Neuron 89, 37–53. doi: 10.1016/J.NEURON.2015.11.013
Glossary
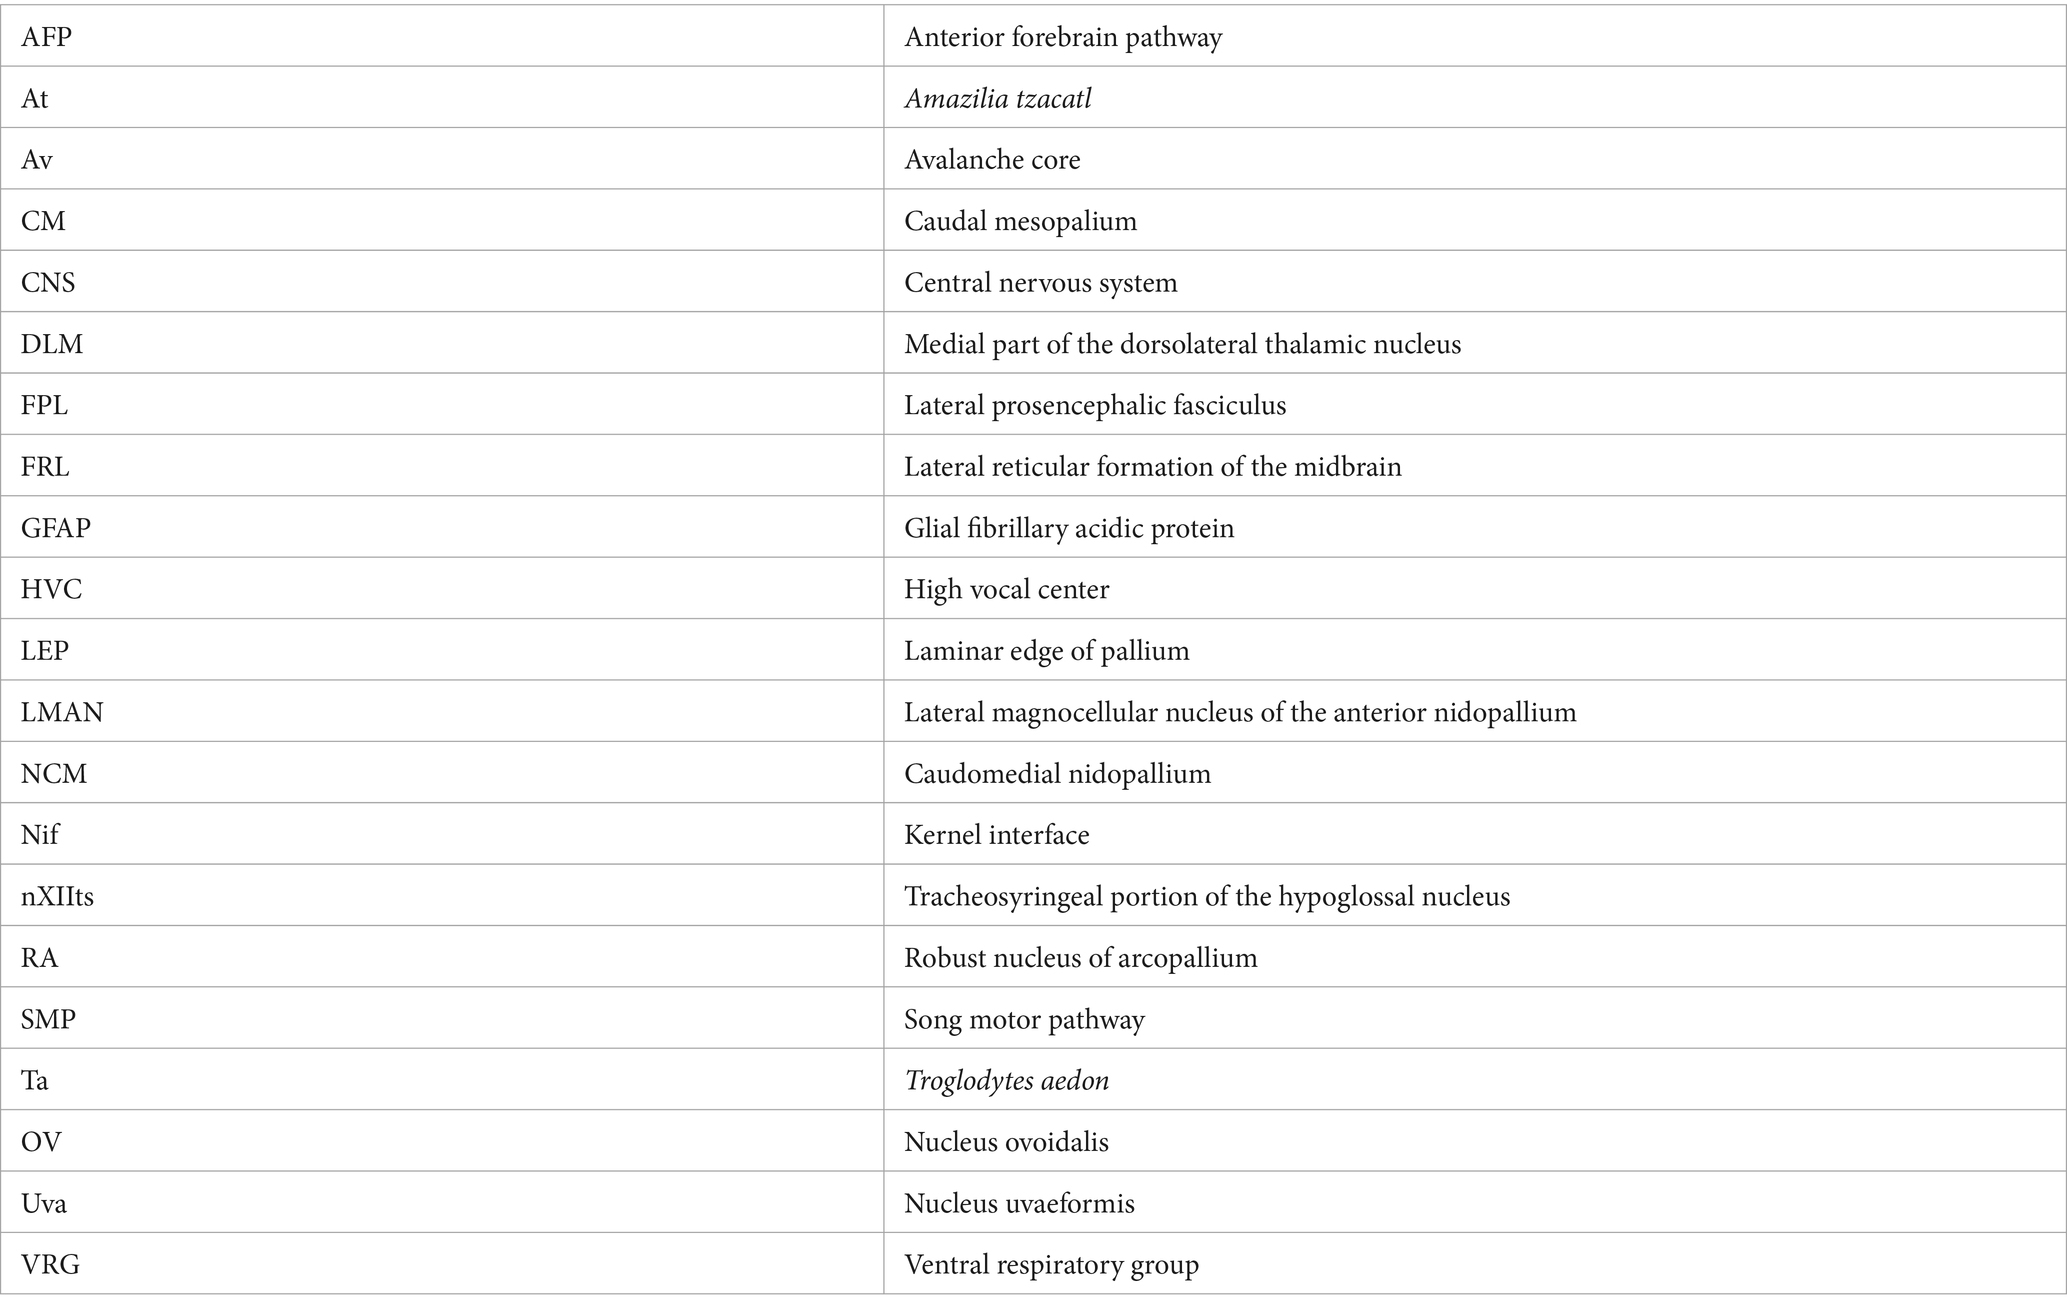
Keywords: vocal areas, HVC, LMAN, RA, astrocytes, GFAP, hummingbird, songbird
Citation: López-Murillo C, Hinestroza-Morales S, Henny P, Toledo J, Cardona-Gómez GP, Rivera-Gutiérrez H and Posada-Duque R (2024) Differences in vocal brain areas and astrocytes between the house wren and the rufous-tailed hummingbird. Front. Neuroanat. 18:1339308. doi: 10.3389/fnana.2024.1339308
Edited by:
Thomas E. Finger, University of Colorado Anschutz Medical Campus, United StatesReviewed by:
Daniel Menezes Guimarães, Western University, CanadaYuxiang Liu, University of Texas Southwestern Medical Center, United States
Copyright © 2024 López-Murillo, Hinestroza-Morales, Henny, Toledo, Cardona-Gómez, Rivera-Gutiérrez and Posada-Duque. This is an open-access article distributed under the terms of the Creative Commons Attribution License (CC BY). The use, distribution or reproduction in other forums is permitted, provided the original author(s) and the copyright owner(s) are credited and that the original publication in this journal is cited, in accordance with accepted academic practice. No use, distribution or reproduction is permitted which does not comply with these terms.
*Correspondence: Rafael Posada-Duque, rafael.posada@udea.edu.co