Calibration-Less DNA Concentration Measurements Using EOF Volumetric Flow and Single Molecule Counting
 Nasim Farajpour
 Lauren S. Lastra
  Vinay Sharma
 Kevin J. Freedman
- Department of Bioengineering, University of California Riverside, Riverside, CA, United States
Nanopore sensing is a promising tool well suited to capture and detect DNA and other single molecules. DNA is a negatively charged biomolecule that can be captured and translocated through a constricted nanopore aperture under an applied electric field. Precise assessment of DNA concentration is of crucial importance in many analytical processes and medical diagnostic applications. Recently, we found that hydrodynamic forces can lead to DNA motion against the electrophoretic force (EPF) at low ionic strength. This study utilized glass nanopores to investigate the DNA capture mechanism and detect DNA molecules due to volumetric flow at these low ionic strength conditions. We measured the DNA capture rate at five different pico-molar concentrations. Our findings indicated that the translocation rate is proportional to the concentration of DNA molecules and requires no calibration due to the volumetric flow rate and DNA counting directly correlates with concentration. Using finite element analysis, we calculated the volumetric flow and proposed a simple, straightforward approach for accurate DNA quantification. Furthermore, these experiments explore a unique transport mechanism where one of the most highly charged molecules enters a pore against electric field forces. This quantitative technique has the potential to provide distinct insight into nanopore-based biosensing and further enhance the nanopore’s capability as a biomolecule concentration sensor.
Introduction
Classical electrostatics play a significant role in molecular biology. The strength and unique structure of molecules are due to the electrostatic forces. DNA is a strong, homogeneously charged biomolecule that contains the necessary data to encode proteins and other cellular components. The electrical charge of this organic material is about 2qe among the individual atoms within each DNA bases. Within the DNA structure, the negatively charged phosphate backbone is responsible for the DNA’s highly negative charge. Prognosis and diagnosis of numerous DNA-related diseases and disorders would be possible by analyzing this inherited compound (Swerdlow and Role, 2011; Türkcan et al., 2013; Leal et al., 2020). For example, fetal DNA detection in maternal circulation and circulating cancer cells (Bianchi, 2004; Fiala and Diamandis, 2018). Therefore, quantifying these isolated biomolecules is crucial for numerous biomedical and life science applications including sample conservation, sequence analysis, and high-throughput genotyping (Haque et al., 2003; Fu et al., 2011; Robin et al., 2016). For instance, inaccurate DNA quantification can increase PCR product variability, which reduces the reliability of genotype scoring (Bergen et al., 2005; Dhanasekaran et al., 2010; Zhou et al., 2019). Various optical and digital sensing approaches have been proposed to determine DNA concentrations. The three main methods for evaluating the DNA quantity include: 1) fluorescent dye spectroscopy (Holden et al., 2009; Nakayama et al., 2016; Gallagher, 2017) (e.g., PicoGreen, which specifically binds to double-stranded DNA), 2) UV absorbance spectroscopy at 260 nm (Holden et al., 2009; Baldock and Hutchison, 2016; Nakayama et al., 2016; Gallagher, 2017), and 3) relative counting of a specific DNA sequence based on quantitative PCR approach [e.g., digital PCR (Hudecova, 2015; Bergallo et al., 2017), digital ELOHA (Guan et al., 2015), and digital ELISA (Kim et al., 2012; Tighe et al., 2015)]. In optical methods, the main idea is based on the correlation of the analog output response to the bulk sample concentration. Fluorescent spectroscopy is an indirect approach that requires the creation of a standard curve in advance of the main measurement. This technique is more complex than UV absorbance due to the necessities of sample and standards preparation with the fluorescent dye (Leal et al., 2020). In contrast, the UV absorbance spectroscopy approach quantifies the greatest nucleic acid absorbance; therefore, the distinction between the single and double-stranded DNAs, RNA, and nucleotides cannot be differentiated (Bergen et al., 2005; Zhou et al., 2019). In digital PCR approaches, the mechanism is typically based on dividing the sample into several smaller sections in the way that each section has a discrete molecule number. There will be a binary signal of 0 or 1 based on no molecule or at least one molecule per section. The Poisson statistics estimate the concentration based on the ratio of the positive sections over the entire sections (Holden et al., 2009). In this regard, quantitative PCR techniques precisely detect the target sequence quantity with high sensitivity (Nakayama et al., 2016). However, this method is more expensive than fluorescent dye spectroscopy or UV spectroscopy and takes much longer performing and processing time for quantifying the concentration (Gallagher, 2017).
Nanopore systems are an emerging class of biosensors capable of analyzing and inspecting individual unlabeled molecules (e.g., DNA, ligand, and proteins) (Freedman et al., 2013; Cox et al., 2019; Cox et al., 2020; Farajpour et al., 2021) with high accuracy and excellent sensitivity. The general concept of these unique single-molecule counting devices is based on fluctuation (blockage) in ionic current due to the momentary occupancy of the molecule inside the nanopore while being pulled through the pore under an externally applied electric field. Therefore, capturing each single molecule results in generating a current blockage that the nanopore system can directly detect. Previous theoretical (Grosberg and Rabin, 2010; Wanunu et al., 2010) and experimental (Wanunu et al., 2008; Kong et al., 2016) studies have indicated that with negligible molecular interactions, the molar concentration (mol/m3) of the molecule is linearly proportional to the molecule capture rate (s−1) but requires calibration. The capture process involves two phases: initially, DNA molecules are being captured by the funnel electric field in the vicinity of the pore. Subsequently, they are being threaded into the nanopore by the electrostatic forces. Studies indicate this process involves a free energy barrier for capturing the DNA corresponding to the threading of the first few bases (Meller and Branton, 2002; Zhang and Shklovskii, 2007).
There are two significant contributions in threading DNA through the pore. Firstly, the electrophoretic force (EPF) depends on the electric field gradient and the electrophoretic mobility of the DNA. Secondly, hydrodynamic drag (electroosmotic flow velocity) is driven by counterion motion and is considered to be a significant factor influencing DNA translocation (Nkodo et al., 2001; Luan and Aksimentiev, 2008). Existing reports indicated evidence of the electroosmotic flow (EOF) ability to generate an absorbing field capturing peptide against its electric field by α-HL nanopore (Asandei et al., 2016). Moreover, the anomalous translocation nature through solid-state nanopores has been reported in earlier studies (Han et al., 2008; Firnkes et al., 2010). Findings have shown that negatively charged molecules threaded through the pore toward the negatively charged electrode against their electric field (Firnkes et al., 2010). Therefore, the capture mechanism of these translocations has involved the electroosmotic effects, as these phenomena cannot be explained by electrophoresis. Here, we developed a finite element analysis model to study the principle of DNA capture mechanism and explore DNA motion against its electric field at low ionic strength. Moreover, EOF dominant DNA captures were achieved at five distinct pico-molar DNA concentrations using glass nanopore sensors. Utilizing the simulated volumetric flows and EOF dominant capture rates, we proposed a straightforward strategy for quantifying DNA concentration with high precision. This calibration-less computing technique has the capability to analyze the concentration of unlabeled DNA molecules directly from the solution without the need for any optical detections or physical partitioning. We expect this proposed approache to address the current challenges in DNA counting, assist DNA detection from biological samples, and broadly impact nanopore-based diagnosis.
Capture Zone of Electroosmotic Flow
When EPF is dominant, the capture zone surrounding the pore opening demonstrates an almost spherical shape. In lower ionic concentrations, the EOF can dominate the capturing process and drive the DNA through the nanopore. We investigated the capture zone in glass nanopores under high and low ionic strength (KCl salt) using finite element analysis. We modeled a conical shape glass shape nanopore in two distinct ionic strengths (10 mM and 1 M KCl salt). DNA first diffuses around the ionic solution, once it reaches the EOF or EPF capture zone (mostly dependent on ionic strength), it is translocated through the pore. Figure 1 shows the simulation results for the capture zone of a 70 nm pore in different salt concentrations. Under low ionic strength conditions, the fluid flow map can reveal the capture zone as the DNA can be captured in the opposite direction of EPF. Additionally, the velocity field direction indicates a confined shape along the nanopore walls (Figure 1A). Under high ionic strength conditions, DNA translocates through the pore via EPF. Therefore, the electric field map can reveal the capture zone. The electric field direction indicates a spherical shape surrounding the pore mouth in EPF dominant capture zone at high salt (Figure 1B).
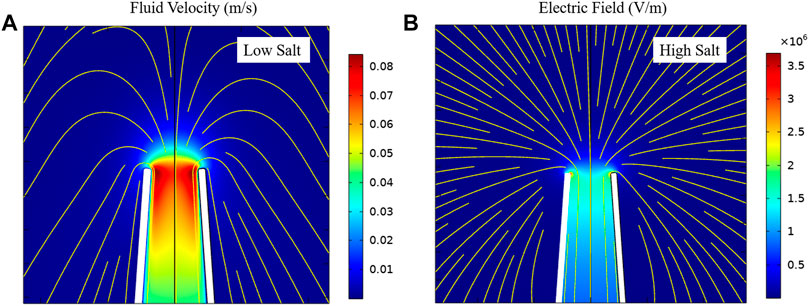
FIGURE 1. Capture zone at different salt concentrations in a 70 nm conical glass nanopores. (A) electroosmotic flow driven capture zone at low salt. The color map shows the velocity magnitude. Streamlines represent the velocity field. (B) electrophoretic driven capture zone at high salt. The color map shows the electric field norm. Streamlines represent the electric field.
We investigated both contributed factors at low ionic strength (10 mM KCl) using finite element analysis. Figure 2A determines the mean fluid flow velocity at various voltages ranging from −800 mV to +800 mV. The simulation results revealed that by increasing the applied voltage from 0 mV, the mean fluid velocity also increases. For negative applied voltages, by increasing the applied voltages toward 0 mV, the mean fluid velocity decreased. The direction of fluid flow velocity was toward the pore in negative applied voltages, which resulted in EOF-driven DNA captures. In contrast, by applying a positive voltage, the fluid flow direction shifted away from the nanopore. Figure 2B schematically represents the DNA capture passing through the pore by EOF dominating the EPF transport at low ionic strength. We performed simulations for 70 nm conical glass nanopore in 10 mM KCl and calculated the net force considering both EOF and EPF dragging in opposite directions through the pore. The mean fluid velocity was used in EOF simulation and EPF was calculated based on multiplying the electric field (E) by DNA electrophoretic mobility (μ). DNA electrophoretic mobility is a function of salt concentration and experimental conditions. Therefore, to investigate the turning point from EPF to EOF dominant capture zone, four different µ values ranging from 4.25 × 10⁻⁴ to 3.0 × 10⁻⁴ (cm2 V−1s−1) were selected. We chose these values according to literature reports at similar conditions and salt concentrations to our experimental conditions. Figures 2C–F demonstrate the net forces through the pore for different µ values of DNA. Initially, the direction of the net force was toward the EPF, but by reducing the µ to 3.25 × 10⁻⁴ (cm2 V−1s−1), the net force direction shifted toward the EOF, indicating that EOF dominated the EPF transport. The simulations demonstrated that the EPF drift velocity is extremely sensitive to µ and tuning the actual value of µ drastically affects the nanopore transport properties. Our findings indicate that the EPF decayed faster in comparison to EOF, which results in the dominance of the EOF inside the nanopore. To further explore the DNA capture mechanism at the pore, we investigated the EPF and EOF-driven net forces at various ranges of ionic strength from 10 mM to 1 M KCl for two distinct pore sizes. Simulation results for 70 and 600 nm pore size has shown in Supplementary Figures S4, S5, respectively. Our results indicated that the net force is dominated by the EOF solely at very low ionic strength (less than 20 mM KCl concentration). We determined the net force turning point from EPF dominant zone to EOF at 10 mM salt concentration. This trend was consistent for both nanopores, however, there was an increase in EOF by increasing the pore size.
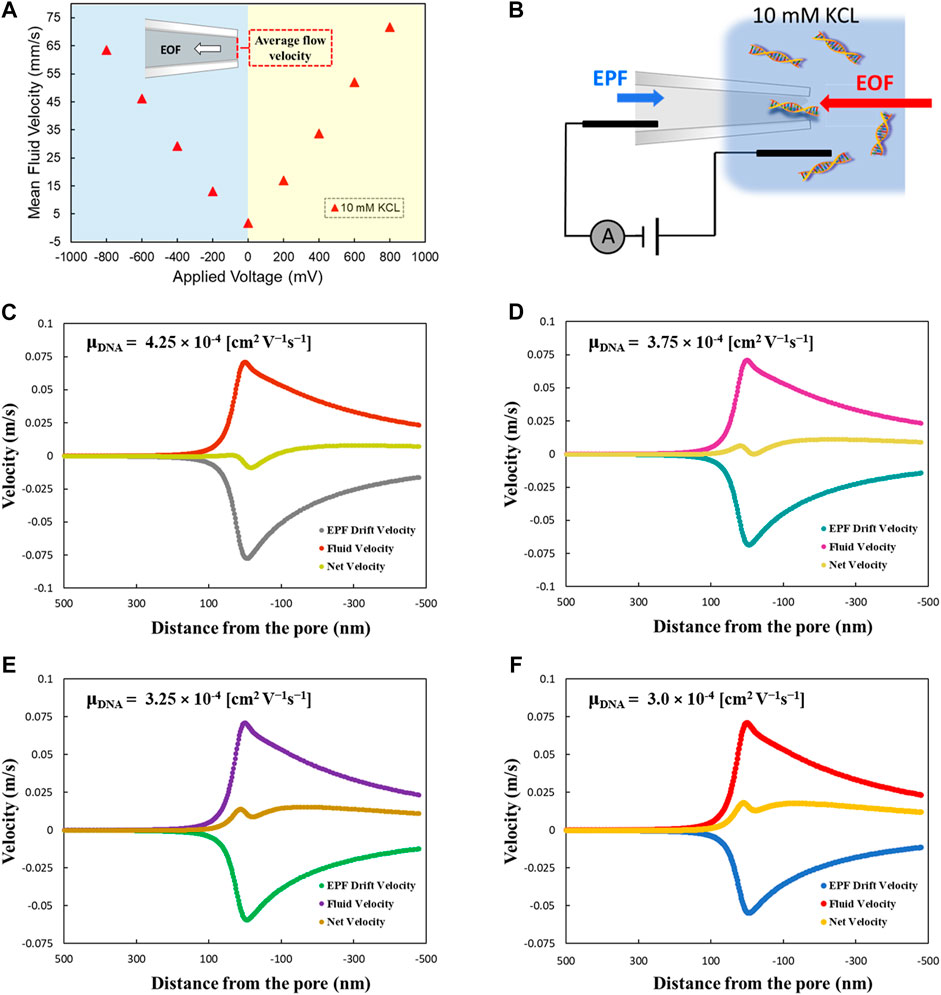
FIGURE 2. (A) Mean fluid velocity (EOF velocity) at different voltages within the glass nanopore. Fluid velocity was averaged over a 2D line spanning the width of the nanopore opening. Peak velocity was at the center of the pore due to the no-slip boundary conditions. (B) represents the schematic of DNA molecules passing through the pore under condition of EOF dominating at low ionic strength. (C–F) EPF, EOF and net force calculation based on different µ values of DNA at low ionic strength.
Since there was a volumetric fluid flow in low ionic strength, the fluid flow rate through the nanopore can be achieved by integrating the fluid velocity over the pore area. In addition, the fluid flow rate can be obtained more precisely using a line integration method by evaluating the velocity magnitude over a cutline 2D data line spanning the width of the nanopore opening. Therefore, we determined the fluid flow rate value equal to 9.49*10–18 m3/s through the line integration method in our developed finite element model.
We further investigated our simulation results experimentally by capturing λ-DNA at low salt using different DNA concentrations. The details of the experiments and results will be discussed in the following sections.
Dominant Translocation Mechanisms
As mentioned before, studies indicate that the capture process involves a free energy barrier due to threading DNA ends through the pore. Since DNA is a highly charged molecule, in addition to the DNA confinement, there are some probable unfavorable DNA interactions with the nanopore itself which can form a free energy barrier for the capturing process. These energetic barriers have been investigated theoretically (Zhang and Shklovskii, 2007) and experimentally (Meller and Branton, 2002; Wanunu et al., 2010) for DNA translocation through biological and solid-state nanopores. There is an exponential dependence of the DNA capture rate on the applied voltage due to the free energetic barriers. On the contrary, multiple studies (Wong and Muthukumar, 2007; Gershow and Golovchenko, 2007) reported a linear dependence of the DNA capture rate on the applied voltage associated with a diffusion-based capture mechanism. We investigated the free energy behavior of the capture mechanism by measuring the DNA capture rate as a function of applied voltage through glass nanopores. Glass nanocapillaries were fabricated using a CO2 laser assist pipette puller using specific pulling protocols to yield two identical nanopores. Supplementary Figure S1A demonstrates the conical shape of the glass nanopore. The taper lengths were measured under an optical microscope. The glass nanopores possessed a mean taper length of 1.5 mm. The fabrication process and nanopore measurement setup are explained in detail in the material and methods section. Briefly, the nanopipettes were filled with a low salt solution (10 mM KCl), and two silver electrodes were placed inside the nanopore as well as the solution chamber containing the same buffer including λ-DNA. The nanopore was secured inside the measurement setup (Axopatch 200B amplifier) for measuring the ionic current. After confirming the nanopore’s stability, the current-voltage (I-V) analysis was performed to estimate the pore diameter. Electrical conductance measurements have been frequently used in nanopore literature to approximate the nanopore sizes. The pore size estimation was calculated using the following equation (Smeets et al., 2006):
Where G is the electrical conductance, σ is the bulk conductivity, l is the taper length, di is the diameter of the pore, and db is the capillary inner diameter. Supplementary Figure S1B demonstrates a linear I-V relationship that indicates an ohmic electrical property with an average conductance of 2.6 nS. The approximate pore diameters were calculated around 70 nm (±5 nm), consistent with the conductance values. Moreover, the fabricated nanopores were imaged by transmission electron microscope (TEM) to confirm the accuracy of the conductance-based estimations. Supplementary Figure S1C represents the TEM image of a typical glass nanopore fabricated by the laser assist pipette puller with 70 nm pore size. The nanopore size measured by the TEM indicated the same size (±5 nm) as approximate pore sizes by the electrical conductance estimations. The geometry of conical glass nanopore is defined by the pore diameter and length of the nanopore, both be contingent on the pulling parameters. In all the experiments, nanopores were inspected for a stable open-pore current for 10–15 min before the I-V analysis.
We performed the λ-DNA translocation experiment at low ionic strength (10 mM KCl solution) and calculated the mean capture rate under multiple applied voltages. Figure 3A demonstrates the current traces showing EOF-driven DNA events at different applied voltages. The increase of translocation events in the current traces is noticeable by increasing the applied voltages. Figure 3B indicates the sketch of our experimental observation results. Principally, at zero voltage some free energetic barriers exist. These barriers will be higher by applying a negative voltage that is unfavorable in the translocation mechanism. By considering EOF plus the negative voltage, DNA event translocations are caused by some decrease in free energetic barriers. Therefore, taking both voltage and EOF from the pore entrance, the free energy will be favoring the DNA forcing into the pore. Figure 3C demonstrates DNA capture rate as a function of various voltage ranging from −300 to −800 mV. The capture rate showed a linear increase from 2.2 s−1 to 17.8 s−1 by increasing the voltage from −300 to −800 mV, respectively. We found a linear dependence of the capture rate on the applied voltages, which is indicative of the diffusion-limited capture process. Investigation of dwell time and current drop distributions at different applied voltages have been shown in Supplementary Figure S3. At lower voltages, the average dwell time was higher, indicating slower translocation of DNA molecules through the pore. Moreover, the results demonstrated a linear increase of the mean current drop from 40 to 64 pA by increasing the voltage from −300 toward −800 mV applied voltages.
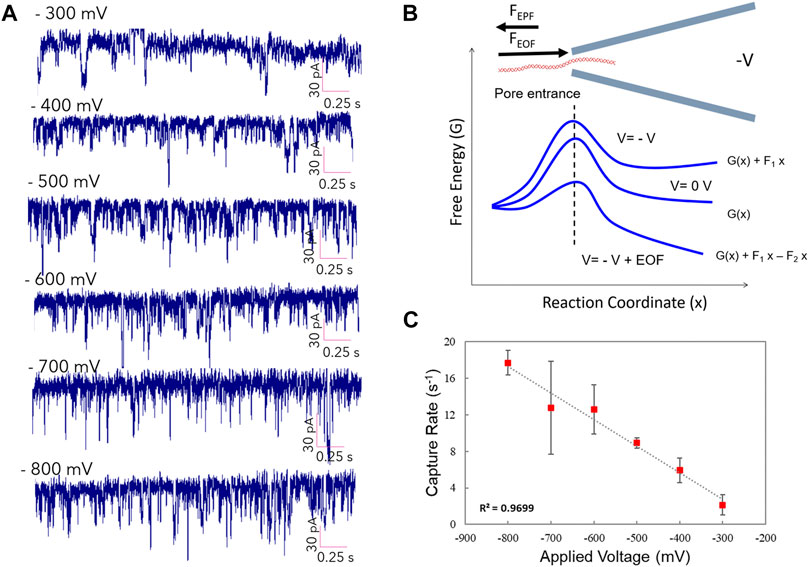
FIGURE 3. DNA capture rate as the function of applied voltage. (A) Current trace showing EOF-driven DNA events at different applied voltages. (B) diagram demonstrates physics of translocation events (C) DNA capture rate as a function of various voltage ranging from −300 to −800 mV through the glass nanopore.
The capture mechanism defines the process of transitioning the molecule from a diffusion-dominated region far from the pore to a voltage and/or pressure dominated region surrounding the pore. As the DNA molecule approaches the vicinity of the nanopore, the magnitude of the voltage gradient increases, however, EOF also increases with electric field. DNA velocity can be explained by the following equation in the case of EOF-driven translocations:
where µ is the electrophoretic mobility of the DNA. The value of the µ does not depend on DNA length longer than a few persistence lengths. (Olivera et al., 1964; Wanunu et al., 2010) For purely EPF-driven transport, the diffusion-limited flux is equal to J diff = R diff c, where c is the concentration of the DNA. The same applies to EOF-driven translocations however the analytical expression for capture rate is different than EPF-driven events and does not depend on EPF drift velocity. Instead, the capture rate is dictated solely by the EOF volumetric flow which depends on the diameter of the pore and the applied voltage (i.e. EOF).
DNA Capture Quantification
We furthered performed studies on detecting DNA molecules and quantifying the DNA concentration using our glass nanopores. We could capture EOF-driven events at low salt (10 mM KCl solution) in five distinct concentrations of λ-DNA: 100, 500, 1,000, 1,500 and 2,000 pM. Figure 4A demonstrates the current traces for the EOF-driven DNA events at an applied voltage of −700 mV for five different DNA concentrations. Translocations occurred more frequently with an increase in DNA concentration. The capture rates were calculated using two different methods. The first technique was based on calculating the interarrival time using a custom written MATLAB program. The semi-logarithmic distribution of interarrival time for each DNA concentration has been shown in Figure 4B The exponential fitting of these distributions is typically used to achieve the capture rate (Meller and Branton, 2002; Wanunu et al., 2010). We defined the time interval between successive events as delta T (
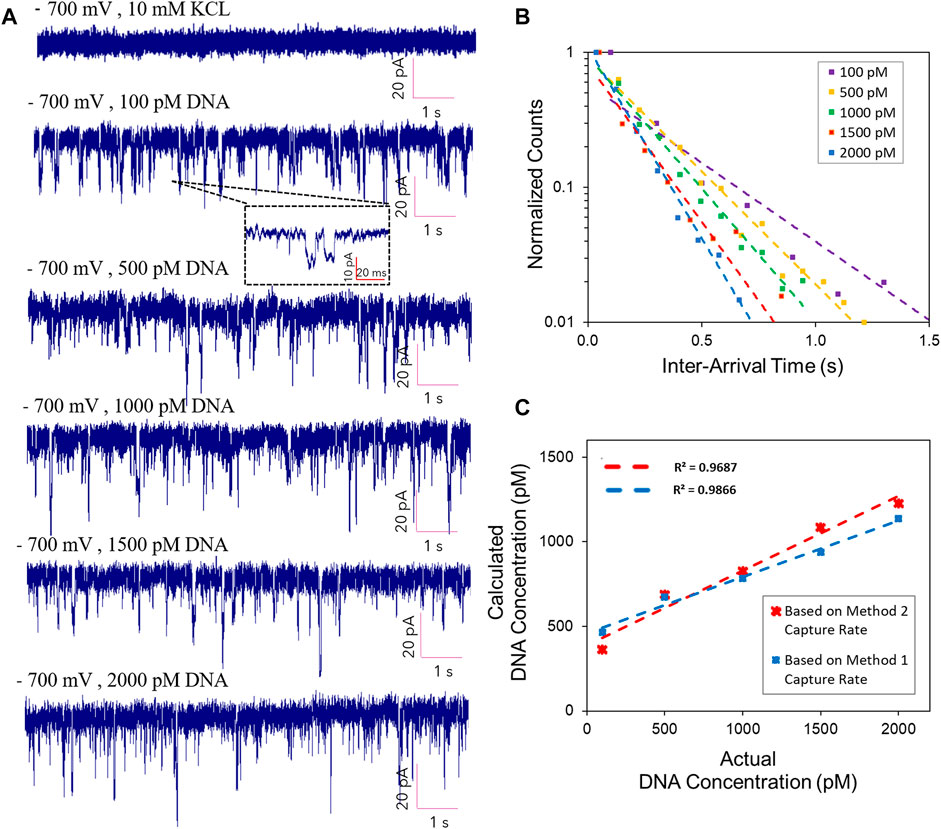
FIGURE 4. (A) Current trace showing EOF-driven DNA events at −700 mV applied voltage for three different DNA concentrations. (B) Event capture frequency in different concentrations of DNA at −700 mV applied voltages. (C) Calculated concentration of DNA versus the actual values along with the standard errors based on two distinct capture rate calculations.
The EOF-driven capture rates were utilized to measure the concentration of DNA using the calculated flow rates specific to EOF in the finite element analysis model. At low ionic strength, there was a volume fluid flow; therefore, quantifying the DNA concentration were achieved by dividing the flow rate (nm3s−1) over the number of DNA events (s−1) captured by the nanopore sensor. The DNA concentration were obtained as the number of DNA molecules per nm3Table 1 indicates values of the calculated DNA concentration per each of the actual values (100, 500, 1000, 1500, 2000 pM) based on method 2 capture rates. Figure 4C demonstrates a semi-linear relationship between the actual versus the calculated values for five distinct DNA concentrations. Using the capture rates from both methods, we found a linear relationship along with excellent approximation between the actual DNA concentration values and the calculated values based on the EOF-driven capture frequency and volumetric fluid flow rates.
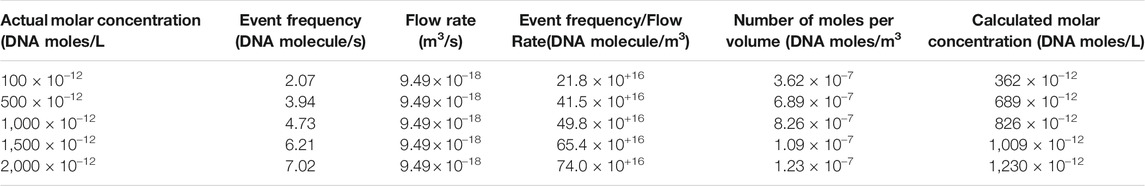
TABLE 1. Estimated molar concentration values using calculated fluid flow rates.
Event Properties
The current drop and dwell time distributions were investigated in different DNA concentrations. Figure 5 demonstrates the current drop and dwell time distributions of EOF-driven captures in three distinct DNA concentrations at −700 mV applied voltage. The current drop peak in 100 and 500 pM concentration of DNA was around 27 pA which showed a bit higher value than 1,000 pM concentration of DNA with a 23 pA distribution peak (Figures 5A,C,E). Results indicated longer dwell time values, with the most probable translocation time at around 6 ms for all DNA concentrations (Figures 5B,D,F). Considering the pore size was around 70 nm, these large dwell time values reveal all DNA configurations, most likely, linear and folded DNA configurations. Moreover, since EOF and EPF are competing in these captured events, the net force would be lower than purely voltage-driven translocation events with no opposing forces. Therefore, as we applied the electroosmotic flow as the opposing force, the DNA transition time through the pore would be slower than in the case with no competing force. The number of EOF-driven translocation events recorded per each analysis was 932, 1445, and 994 for 100, 500, and 1000 pM concentration of DNA, respectively.
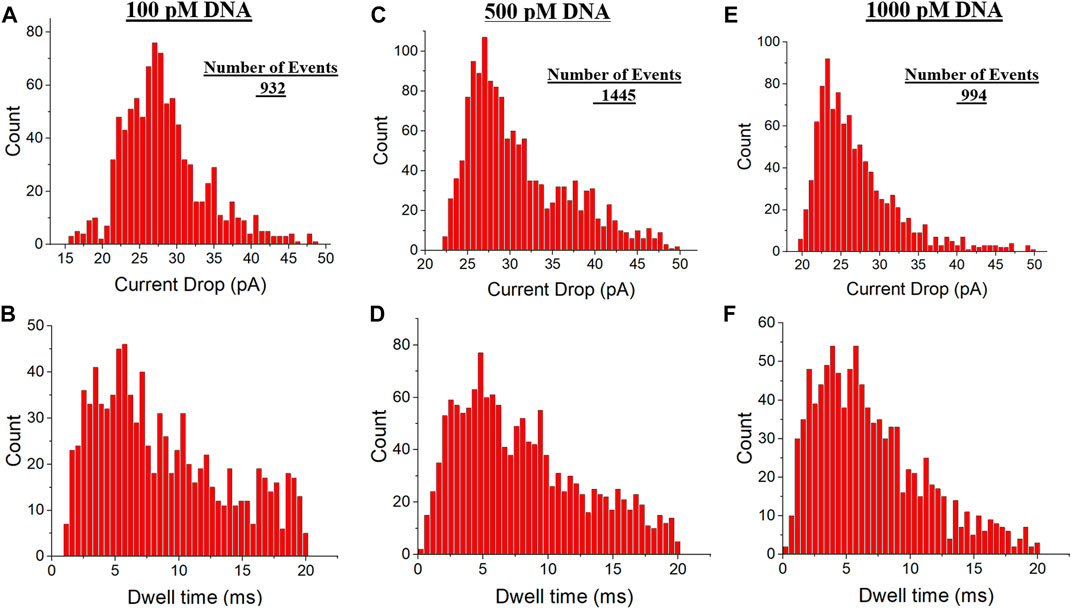
FIGURE 5. Current Drop and dwell time distributions of hydrodynamic-driven events in three distinct DNA concentrations at −700 mV applied voltage. (A,B) Current Drop and dwell time distributions in 100 pM DNA concentration, respectively. (C,D). Current Drop and dwell time distributions in 500 pM DNA concentration, respectively. (E,F) Current Drop and dwell time distributions in 1,000 pM DNA concentration, respectively.
Conclusion
In summary, finite element analysis was utilized to model the capture zone by conical glass nanopores under low ionic strength conditions. We investigated the capture mechanism and calculated the fluid flow velocity using our developed model. Experimentally, we could detect EOF-driven DNA capture rate due to the volumetric flow at low salt. Combining the simulation results and experimental data, we could develop a novel, precise approach for quantifying DNA concentration with high accuracy. We validated the proposed method using five different concentrations of DNA molecules. Comparing results demonstrated a linear relationship with an excellent precision between the actual and approximated DNA concentrations. Our findings reveal that the hydrodynamic-driven DNA captures can be exploited for precise DNA counting in multiple quantitative measurements such as DNA manipulation and molecular analysis applications.
Materials and Methods
Glass capillaries were purchased with an inner diameter (ID) of 0.5 mm, the outer diameter of 1 mm, and 5.0 cm in length (Sutter Instrument-United States). After plasma cleaning of the capillaries, a CO2 laser assist pipette puller device (P-2000, Sutter Instrument-United States) was used for nanopore fabrication. The pulling parameters involved a four-line program which caused glass elongation in initial cycles followed by a hard pull at the end to separate the capillary into two identical conical shape nanocapillaries with a pore at the tip. The details of the pulling protocols are described on Supplementary Table S1 in supporting information. The average duration of laser activation was about 5 ± 0.5 s. It is worth mentioning that the nanopore pulling parameters are instrument-specific and can be varied by various factors such as local temperature, humidity, and surface impurities. The estimated size of the nanopores was about 70 nm with a mean taper length of 1.5 mm. The taper lengths of glass nanopores were imaged under an optical microscope and measured using ImageJ software. The fabricated nanopores were imaged by transmission electron microscopy (TEM, FEI-United States) to characterize the pore diameter. The details of nanopore imaging and characterization are discussed in Supplementary Note S1 and Supplementary Figure S1 of the supporting information.
The glass capillaries with the nanopore at one end were filled with the buffer solution (filtered 10 mM KCl). The nanopores were examined for any bobbles or impurities under an optical microscope. After inspection, the silver wire electrodes were placed inside the nanopore and the solution chamber containing the same buffer plus λ-DNA (New England Biolabs-United States). The λ-DNA with a stock 500 μgml−1 concentration was diluted in 10 mM KCl at different molarities to achieve 100, 500, and 1,000 pM concentrations. The Axopatch 200B amplifier and Axon Digidata 1550B (Molecular Device-United States) were used for measuring and digitalizing the ionic current. The cell conductance was inspected by performing a standard current-voltage (I-V) measurement. A range of different voltages from -500 to +500 mV was applied to achieve the current responses as the function of applied potentials. The conductance was calculated based on fitting the obtained results into a linear function after an approximate 15 min of stabilization. The gain was optimized before each experiment. The signal was filtered with an internal lowpass filter at 10 kHz, and the sampling rate was set to 200 kHz. A custom-written MATLAB code was used for analyzing DNA translocations events. All data were initially filtered using a low pass 2000 Hz Bessel filter. The average open pore current was around 2,100 pA at −700 mV voltage. To set the optimum threshold, a few trials were run to make sure all the events are selected properly. In addition to MATLAB analysis, we manually inspected the current traces and estimated the capture frequencies per each recorded file by zooming into the current traces at different points. By quantifying the number of events at random points per file, we could achieve an estimated value for the event frequencies before analyzing the data. For all the analyzed files we compared the estimated event numbers with the event frequency which we obtained from MATLAB to confirm the accuracy of our data processing approach. All the simulations detail and finite element modeling are discussed on Supplementary Note S2 of the supporting information.
Data Availability Statement
The raw data supporting the conclusion of this article will be made available by the authors, without undue reservation.
Author Contributions
KF formulated the idea, NF performed the experiments, carried out data analysis, and simulated experiments using COMSOL multiphysics under the guidance of KF. LL, and VS performed preliminary experiments. NF and KF wrote the manuscript with contributions from all other authors.
Funding
This work was partially supported by an internal grant provides by the University of California Riverside.
Conflict of Interest
The authors declare that the research was conducted in the absence of any commercial or financial relationships that could be construed as a potential conflict of interest.
Publisher’s Note
All claims expressed in this article are solely those of the authors and do not necessarily represent those of their affiliated organizations, or those of the publisher, the editors and the reviewers. Any product that may be evaluated in this article, or claim that may be made by its manufacturer, is not guaranteed or endorsed by the publisher.
Supplementary Material
The Supplementary Material for this article can be found online at: https://www.frontiersin.org/articles/10.3389/fnano.2021.689584/full#supplementary-material
References
Asandei, A., Schiopu, I., Chinappi, M., Seo, C. H., Park, Y., and Luchian, T. (2016). Electroosmotic Trap against the Electrophoretic Force Near a Protein Nanopore Reveals Peptide Dynamics during Capture and Translocation. ACS Appl. Mater. Inter. 8, 13166–13179. doi:10.1021/acsami.6b03697
Baldock, B. L., and Hutchison, J. E. (2016). UV-visible Spectroscopy-Based Quantification of Unlabeled DNA Bound to Gold Nanoparticles. Anal. Chem. 88, 12072–12080. doi:10.1021/acs.analchem.6b02640
Bergallo, M., Galliano, I., Montanari, P., Cambieri, I., Fumagalli, M., Casarin, S., et al. (2017). Absolute Quantification of Residual DNA in a New Extracellular Matrix Derived from Human Reticular Dermis (HADM) Using Real-Time TaqMan MGB-PCR. Bme 29, 43–52. doi:10.3233/bme-171711
Bergen, A. W., Qi, Y., Haque, K. A., Welch, R. A., and Chanock, S. J. (2005). Effects of DNA Mass on Multiple Displacement Whole Genome Amplification and Genotyping Performance. BMC Biotechnol. 5, 1–11. doi:10.1186/1472-6750-5-24
Bianchi, D. W. (2004). Circulating Fetal DNA: Its Origin and Diagnostic Potential-A Review. Placenta 25, S93–S101. doi:10.1016/j.placenta.2004.01.005
Cox, B. D., Ghimire, M. L., Bertino, M. F., and Reiner, J. E. (2020). Resistive-Pulse Nanopore Sensing of Ligand Exchange at the Single Nanocluster Limit for Peptide Detection. ACS Appl. Nano Mater. 3, 7973–7981. doi:10.1021/acsanm.0c01451
Cox, B. D., Woodworth, P. H., Wilkerson, P. D., Bertino, M. F., and Reiner, J. E. (2019). Ligand-Induced Structural Changes of Thiolate-Capped Gold Nanoclusters Observed with Resistive-Pulse Nanopore Sensing. J. Am. Chem. Soc. 141, 3792–3796. doi:10.1021/jacs.8b12535
Dhanasekaran, S., Doherty, T. M., and Kenneth, J. (2010). Comparison of Different Standards for Real-Time PCR-Based Absolute Quantification. J. Immunological Methods 354, 34–39. doi:10.1016/j.jim.2010.01.004
Farajpour, N., Lastra, L. S., Sharma, V., and Freedman, K. J. (2021). Measuring Trapped DNA at the Liquid-Air Interface for Enhanced Single Molecule Sensing. Nanoscale 13. 5780-5790. doi:10.1039/d0nr07759c
Fiala, C., and Diamandis, E. P. (2018). Utility of Circulating Tumor DNA in Cancer Diagnostics with Emphasis on Early Detection. BMC Med. 16, 166. doi:10.1186/s12916-018-1157-9
Firnkes, M., Pedone, D., Knezevic, J., Döblinger, M., and Rant, U. (2010). Electrically Facilitated Translocations of Proteins through Silicon Nitride Nanopores: Conjoint and Competitive Action of Diffusion, Electrophoresis, and Electroosmosis. Nano Lett. 10, 2162–2167. doi:10.1021/nl100861c
Freedman, K. J., Haq, S. R., Edel, J. B., Jemth, P., and Kim, M. J. (2013). Single Molecule Unfolding and Stretching of Protein Domains inside a Solid-State Nanopore by Electric Field. Sci. Rep. 3, 1–8. doi:10.1038/srep01638
Fu, G. K., Hu, J., Wang, P.-H., and Fodor, S. P. A. (2011). Counting Individual DNA Molecules by the Stochastic Attachment of Diverse Labels. Proc. Natl. Acad. Sci. 108, 9026–9031. doi:10.1073/pnas.1017621108
Gallagher, S. R. (2017). Quantitation of DNA and RNA with Absorption and Fluorescence Spectroscopy. Curr. Protoc. Immunol. 116, A.3L.1–A.3L.14. doi:10.1002/cpim.20
Gershow, M., and Golovchenko, J. A. (2007). Recapturing and Trapping Single Molecules with a Solid-State Nanopore. Nat. Nanotech 2, 775–779. doi:10.1038/nnano.2007.381
Grosberg, A. Y., and Rabin, Y. (2010). DNA Capture into a Nanopore: Interplay of Diffusion and Electrohydrodynamics. J. Chem. Phys. 133, 165102. doi:10.1063/1.3495481
Guan, W., Chen, L., Rane, T., Kaushik, A., and Wang, J. T.-H. (2015). Droplet Digital Enzyme-Linked Oligonucleotide Hybridization Assay for Absolute RNA Quantification. Sci. Rep. 5, 13795. doi:10.1038/srep13795
Han, A., Creus, M., Schürmann, G., Linder, V., Ward, T. R., de Rooij, N. F., et al. (2008). Label-Free Detection of Single Protein Molecules and Protein−Protein Interactions Using Synthetic Nanopores. Anal. Chem. 80, 4651–4658. doi:10.1021/ac7025207
Haque, K. A., Pfeiffer, R. M., Beerman, M. B., Struewing, J. P., Chanock, S. J., and Bergen, A. W. (2003). Performance of High-Throughput DNA Quantification Methods. BMC Biotechnol. 3, 20. doi:10.1186/1472-6750-3-20
Holden, M. J., Haynes, R. J., Rabb, S. A., Satija, N., Yang, K., and Blasic, J. R. (2009). Factors Affecting Quantification of Total DNA by UV Spectroscopy and PicoGreen Fluorescence. J. Agric. Food Chem. 57, 7221–7226. doi:10.1021/jf901165h
Hudecova, I. (2015). Digital PCR Analysis of Circulating Nucleic Acids. Clin. Biochem. 48, 948–956. doi:10.1016/j.clinbiochem.2015.03.015
Kim, S. H., Iwai, S., Araki, S., Sakakihara, S., Iino, R., and Noji, H. (2012). Large-scale Femtoliter Droplet Array for Digital Counting of Single Biomolecules. Lab. Chip 12, 4986–4991. doi:10.1039/c2lc40632b
Kong, J., Bell, N. A. W., and Keyser, U. F. (2016). Quantifying Nanomolar Protein Concentrations Using Designed DNA Carriers and Solid-State Nanopores. Nano Lett. 16, 3557–3562. doi:10.1021/acs.nanolett.6b00627
Leal, A., van Grieken, N. C. T., Palsgrove, D. N., Phallen, J., Medina, J. E., Hruban, C., et al. (2020). White Blood Cell and Cell-free DNA Analyses for Detection of Residual Disease in Gastric Cancer. Nat. Commun. 11, 1–11. doi:10.1038/s41467-020-14310-3
Luan, B., and Aksimentiev, A. (2008). Electro-osmotic Screening of the DNA Charge in a Nanopore. Phys. Rev. E - Stat. Nonlinear, Soft Matter Phys. 78. doi:10.1103/physreve.78.021912
Meller, A., and Branton, D. (2002). Single Molecule Measurements of DNA Transport through a Nanopore. Electrophoresis 23, 2583–2591. doi:10.1002/1522-2683(200208)23:16<2583::aid-elps2583>3.0.co;2-h
Nakayama, Y., Yamaguchi, H., Einaga, N., and Esumi, M. (2016). Pitfalls of DNA Quantification Using DNA-Binding Fluorescent Dyes and Suggested Solutions. PLoS One 11, e0150528. doi:10.1371/journal.pone.0150528
Nkodo, A. E., Garnier, J. M., Tinland, B., Ren, H., Desruisseaux, C., McCormick, L. C., et al. (2001). Diffusion Coefficient of DNA Molecules during Free Solution Electrophoresis. Electrophoresis 22, 2424–2432. doi:10.1002/1522-2683(200107)22:12<2424::aid-elps2424>3.0.co;2-1
Olivera, B. M., Baine, P., and Davidson, N. (1964). Electrophoresis of the Nucleic Acids. Biopolymers 2, 245–257. doi:10.1002/bip.1964.360020306
Robin, J. D., Ludlow, A. T., La Ranger, R., Wright, W. E., and Shay, J. W. (2016). Comparison of DNA Quantification Methods for Next Generation Sequencing. Sci. Rep. 6, 1–10. doi:10.1038/srep24067
Smeets, R. M. M., Keyser, U. F., Krapf, D., Wu, M.-Y., Dekker, N. H., and Dekker, C. (2006). Salt Dependence of Ion Transport and DNA Translocation through Solid-State Nanopores. Nano Lett. 6, 89–95. doi:10.1021/nl052107w
Swerdlow, R. H., and Role, R. (2011). Role and Treatment of Mitochondrial DNA-Related Mitochondrial Dysfunction in Sporadic Neurodegenerative Diseases. Curr. Pharm. Des. 17, 3356–3373. doi:10.2174/138161211798072535
Tighe, P. J., Ryder, R. R., Todd, I., and Fairclough, L. C. (2015). ELISA in the Multiplex Era: Potentials and Pitfalls. Prot. Clin. Appl. 9, 406–422. doi:10.1002/prca.201400130
Türkcan, C., Akgöl, S., and Denizli, A. (2013). Silanized Polymeric Nanoparticles for DNA Isolation. Mater. Sci. Eng. C 33, 4498–4503. doi:10.1016/j.msec.2013.05.015
Wanunu, M., Morrison, W., Rabin, Y., Grosberg, A. Y., and Meller, A. (2010). Electrostatic Focusing of Unlabelled DNA into Nanoscale Pores Using a Salt Gradient. Nat. Nanotech 5, 160–165. doi:10.1038/nnano.2009.379
Wanunu, M., Sutin, J., McNally, B., Chow, A., and Meller, A. (2008). DNA Translocation Governed by Interactions with Solid-State Nanopores. Biophysical J. 95, 4716–4725. doi:10.1529/biophysj.108.140475
Wong, C. T. A., and Muthukumar, M. (2007). Polymer Capture by Electro-Osmotic Flow of Oppositely Charged Nanopores. J. Chem. Phys. 126, 164903. doi:10.1063/1.2723088
Zhang, J., and Shklovskii, B. I. (2007). Effective Charge and Free Energy of DNA inside an Ion Channel. Phys. Rev. E - Stat. Nonlinear, Soft Matter Phys. 75, 021906. doi:10.1103/physreve.75.021906
Keywords: nanopore sensing, DNA quantification, single molecule counting, electroosmotic flow, electrophoretic force
Citation: Farajpour N, Lastra LS, Sharma V and Freedman KJ (2021) Calibration-Less DNA Concentration Measurements Using EOF Volumetric Flow and Single Molecule Counting. Front. Nanotechnol. 3:689584. doi: 10.3389/fnano.2021.689584
Received: 01 April 2021; Accepted: 19 July 2021;
Published: 02 August 2021.
Edited by:
Jian-An Huang, University of Oulu, FinlandReviewed by:
Chan Cao, École Polytechnique Fédérale de Lausanne, SwitzerlandTsukuru Minamiki, National Institute of Advanced Industrial Science and Technology (AIST), Japan
Copyright © 2021 Farajpour, Lastra, Sharma and Freedman. This is an open-access article distributed under the terms of the Creative Commons Attribution License (CC BY). The use, distribution or reproduction in other forums is permitted, provided the original author(s) and the copyright owner(s) are credited and that the original publication in this journal is cited, in accordance with accepted academic practice. No use, distribution or reproduction is permitted which does not comply with these terms.
*Correspondence: Kevin J. Freedman, kfreedman@engr.ucr.edu