Contribution of GABAergic interneurons to the development of spontaneous activity patterns in cultured neocortical networks
- Institute of Physiology, Otto-von-Guericke-University Magdeburg, Magdeburg, Germany
Periodic synchronized events are a hallmark feature of developing neuronal networks and are assumed to be crucial for the maturation of the neuronal circuitry. In the developing neocortex, the early network oscillations coincide with an excitatory action of the neurotransmitter gamma-aminobutyric acid (GABA). A relationship between the emerging inhibitory action of GABA and the gradual disappearance of early synchronized network activity has been previously suggested. Therefore we investigate the interplay between the action of GABA and spontaneous activity in cultured networks of the lateral or dorsal embryonic rat neocortex, which show considerable difference in the content of GABAergic neurons. Here we present the results of long-term monitoring of spontaneous electrical activity of cultured networks growing on microelectrode arrays and the time course of changes in GABA action using calcium imaging. All cultures studied displayed stereotyped synchronized burst events at the end of the first week in vitro. As the GABAA depolarizing action decreases, naturally or after bumetanide treatment, network activity in lateral cortex cultures changed from stereotypic bursting to more clustered and asynchronous activity patterns. Dorsal cortex cultures and cultures lacking GABAA-receptor mediated synaptic transmission, retained an immature synchronous firing pattern, but developed prominent intraburst oscillations (∼3–10 Hz). Large, mostly parvalbumin positive, GABAergic neurons dominate the GABAergic population in lateral cortex cultures. These large interneurons were virtually absent in dorsal cortex cultures. Based on these results, we suggest that the richly interconnected large GABAergic neurons contribute to desynchronize and temporally differentiate the spontaneous activity of cultured cortical networks.
Introduction
The electrical activity of immature neuronal networks is characterized by recurrent correlated activity, which has been observed in many structures and experimental conditions (O’Donovan, 1999 ; Ben-Ari, 2001 ; Blankenship and Feller, 2010 ), including the cerebral cortex in vivo (Chiu and Weliky, 2001 ; Minlebaev et al., 2007 ; Yang et al., 2009 ), in slices (Garaschuk et al., 2000 ; McCabe et al., 2006 ; Allene et al., 2008 ) and in culture preparations (Kamioka et al., 1996 ; Opitz et al., 2002 ; Giugliano et al., 2004 ; Van Pelt et al., 2004 ; Chiappalone et al., 2006 ; Eytan and Marom, 2006 ; Wagenaar et al., 2006a ; Pasquale et al., 2008 ). The slow synchronous oscillatory activity has functional relevance during the formation of connections within the network (Ben-Ari, 2002 ; Owens and Kriegstein, 2002 ; Angenstein et al., 2004 ; Voigt et al., 2005 ; Ben-Ari et al., 2007 ).
GABAergic signaling and therefore gamma-aminobutyric acid (GABA) interneurons play an important role in the generation of spontaneous network oscillations in the developing neocortex and hippocampus (Moody and Bosma, 2005 ; Ben-Ari et al., 2007 ). Specifically, the emergence of early network activity in hippocampal slices depends on depolarizing action of GABA (Ben-Ari, 2001 ). The highly synchronous network activity recorded in acute cortical slices [cortical early network oscillations (cENOs)] is apparently not dependent on GABAergic drive (Garaschuk et al., 2000 ; Allene et al., 2008 ), but the developmental shift of GABAergic signaling has been postulated to induce their gradual disappearance (Garaschuk et al., 2000 ), with the subsequent appearance of a GABA-driven pattern [cortical giant depolarizing potentials (cGDPs)] with higher frequency and lower synchronization (Allene et al., 2008 ).
In a recent study Lischalk et al. (2009) suggest that temporal areas of the cortex function as pacemakers for the early network transients, which then propagate to the rest of the cortex (see also Garaschuk et al., 2000 ). Interestingly, lateral and dorsal regions of the cortex embryo differ in the developmental properties of their early neurons (Bellion et al., 2003 ). While lateral cortex explants hold GABAergic neurons with migrating characteristics of the ganglionic eminence lineage (Marin and Rubenstein, 2001 ; Wonders and Anderson, 2006 ), the dorsal cortex differentiates small bipolar GABAergic neurons, possibly of cortical origin, which migrated along axons in vitro (Letinic et al., 2002 ; Bellion et al., 2003 ). Because GABAergic neurons of different lineages also develop distinct physiological features (Butt et al., 2005 ; Batista-Brito and Fishell, 2009 ), neurons of the lateral cortex might form networks with physiological features and development different from those of dorsal cortex cultures. This leads to the question if the pacemaker function of the temporal cortex could be mediated by a unique development of the GABAergic circuitry. This is of interest because, first, the immature network patterns (cENOs) recorded in slices of the cerebral cortex occur in absence of GABAergic signaling (Garaschuk et al., 2000 ; Allene et al., 2008 ). Secondly, although cultured networks have been extensively used as models for cortical network studies (Feinerman et al., 2007 ; Le et al., 2007 ; Rolston et al., 2007 ; Bakkum et al., 2008 ; Baruchi et al., 2008 ; Chao et al., 2008 ; Pasquale et al., 2008 ; Raichman and Ben-Jacob, 2008 ; Shahaf et al., 2008 ), generating cultured cortical networks with a predictable activity pattern development has been difficult (Wagenaar et al., 2006a ). Finally, although early synchronized network activity is described as extremely robust behavior, due to homeostatic regulation of intrinsic features (Marder and Goaillard, 2006 ; Blankenship and Feller, 2010 ), the limits of homeostasis might be reached along maturation if the local circuitry is abnormally constructed. In fact, many developmental neuropathologies show both network oscillations abnormalities and alterations of interneuronal circuitry (Chagnac-Amitai and Connors, 1989 ; Lewis et al., 2005 ; Sudbury and Avoli, 2007 ; Gonzalez-Burgos and Lewis, 2008 ; Rheims et al., 2008 ; Uhlhaas et al., 2008 ).
In the present study we compared the early synchronized activity of neocortical cultures generated from the lateral or dorsal embryonic rat cortex growing on substrate integrated micro-electrode arrays (MEAs). Additionally, we asked if developmental alterations of the network activity are correlated with the GABA shift (Rivera et al., 2005 ; Blaesse et al., 2009 ) and if they are modified by the GABAA receptor (GABAAR) signaling or by the structure of the GABAergic network. We show that the development of a variable, less synchronized burst activity correlates with the gradual maturation of GABAAR signaling and depends on the presence of large GABAergic neurons with widespread connections in cultured networks.
Materials and Methods
Cell Culture
Monolayer neuronal cultures were prepared from cerebral cortices of Sprague Dawley rats at embryonic day E16 (day after insemination was E1; birth = E22). We plated cells either on Petri dishes or on microelectrode arrays (see below). To keep culture conditions between MEA and Petri dish cultures as close as possible, these cultures were derived from the same preparations (i.e., sister cultures). All experimental procedures were approved by local government (Landesverwaltungsamt Halle, Germany).
Petri dish cultures
For Petri dish cultures each plasma cleaned (Harrick Plasma, Ithaca, NY, USA) cover slip was fitted to a 20-mm hole in the bottom of a 60-mm Petri dish. A 30-mm acrylic glass ring was glued with silicon grease around the hole, to restrict the culture size and the volume of necessary media. The cover slips were treated overnight with poly-D-lysine (0.1 mg/ml in borate buffer, pH 8.5, 36°C). Astroglial cultures were prepared from cerebral hemispheres of P0-P3 Sprague Dawley rats as reported in detail previously (de Lima and Voigt, 1999 ). Purified astroglial cells were plated in the inner portion of the Petri dish (500 cells/mm2 inside the acrylic glass ring) 5 days before the neurons. The astroglia has neurotrophic effects and strongly reduces cell proliferation in culture (Schmalenbach and Müller, 1993 ; de Lima and Voigt, 1999 ). We used upper (dCtx) and lateral portions (vCtx) of the dorsal telencephalic vesicles (excluding hippocampal and basal telencephalic anlagen) as neuronal donor tissue for the two distinct culture types. Neurons for dCtx and vCtx cultures were dissected from the dorsal and lateral aspects of the presumptive dorsal pallium domain (Puelles and Rubenstein, 2003 ). Both donor regions were clearly situated above the pallial/subpallial boundary (Campbell, 2003 ). The dorsal cortex, used as donor for dCtx cultures, included the whole antero-posterior extension of the sensorimotor neocortical anlage. The lateral side of the dorsal pallium, used as donor for vCtx cultures, included also temporal cortical areas and prospective limbic subdivisions, i.e., perirhinal, entorhinal and insular cortices (Barbe and Levitt, 1991 ; Ferri and Levitt, 1995 ; Bellion et al., 2003 ). Similar to explants of the mouse cortex (Bellion et al., 2003 ; Bellion and Metin, 2005 ), networks derived from the dorsal and lateral regions of the rat embryonic cortex showed differences in their GABAergic neuronal populations (see Results).
The neocortical tissue was dissociated with trypsin/EDTA and seeded onto the poly-D-lysine coated glass cover slips in N2 medium (75% DMEM, 25% Ham’s F12, and N2 supplement; Invitrogen, Carlsbad, CA, USA). All cultures were maintained in a humidified 5% CO2/95% air atmosphere at 36°C.
MEA cultures
After plasma cleaning, each MEA dish was treated with poly-D-lysine, followed by the same glial and neuronal culture procedures as described above. Cells were seeded at densities ranging from 800 to 1300 cells/mm2, but the same density was used for different culture types within a preparation. No differences were observed in electrical activity patterns (i.e., irregular vs. regular bursting, see Results) among preparations within the cell density range used. The culture chamber was sealed by a screw cap to prevent infection and evaporation. Within the incubator the cap was loosened to allow gas circulation. Some MEA cultures were raised in the presence of the specific GABAAR blocker gabazine (20 μM), added 3 h after plating.
MEA Recording and Data Analysis
Recording of electrical activity was carried out by using microelectrode arrays [MEAs, Multi Channel Systems (MCS), Reutlingen, Germany] with 59 substrate embedded titanium nitride recording electrodes, arranged in a 10 × 6 rectangular array with one electrode missing in the first column. The electrodes, 30 μm in diameter, had an inter-electrode distance (center to center) of 500 μm. Signals were amplified 1100× and sampled at 25 kHz using a preamplifier (MEA1060-Inv-BC) and data acquisition card (both MCS). The spontaneous activity of individual cultures was monitored at 36°C for 20 min/day in vitro using MC_Rack software (MCS) at different stages of development (usually every 1–3 days, starting at 5 DIV) until at least 3 weeks after plating (i.e., ≥21 DIV). Recordings for different culture conditions (e.g., vCtx and dCtx cultures) within a preparation were always age-matched.
Spike detection
Spikes were detected on-line on the band-pass filtered (0.15–3.5 kHz) signal, using a threshold of −5× standard deviation from background noise. Spike waveforms were stored and analyzed off line. Overlapping spike waveforms were commonly seen during bursts, supposedly due to high action potential firing of several cells near a particular electrode. Given that the cells rarely fired between bursts, automatic spike sorting procedures were less reliable. Spike sorting was therefore not attempted in the present study.
Data processing
Custom written MATLAB (version 2007b, MathWorks, Natick, USA) programs were used for off-line analysis. Different parameters (e.g., burst frequency, see below) were extracted from 20-min recordings. We divided the recordings in three distinct age groups, following developmental properties, i.e., the change in GABAergic synaptic transmission [before (5–10 DIV), during (11–17 DIV), and after (18–24 DIV) the GABA shift]. Generally, evaluated parameters for a given culture condition and age varied more between different preparations than between sister cultures (i.e., within a preparation) (see also Wagenaar et al., 2006a ). Therefore, for each age and preparation the data was normalized by the mean of untreated vCtx networks and ultimately pooled for the different preparations. However, absolute datasets are given in Tables 1 and 2 .
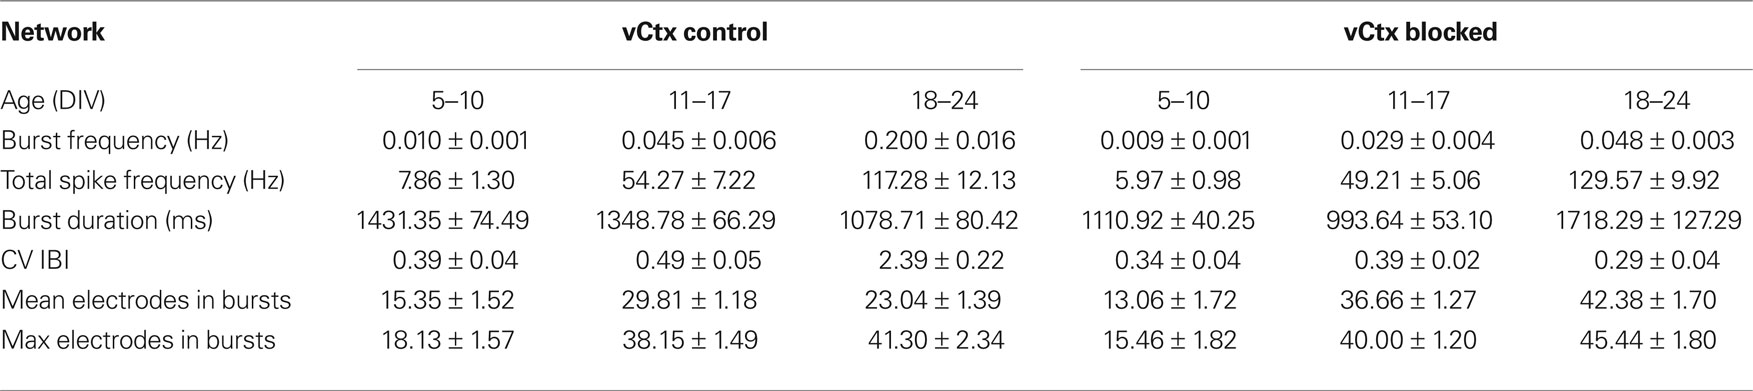
Table 1. All values are mean ± SEM of values pooled from different cultures. See Figure 8 for number of experiments, cultures and preparations.
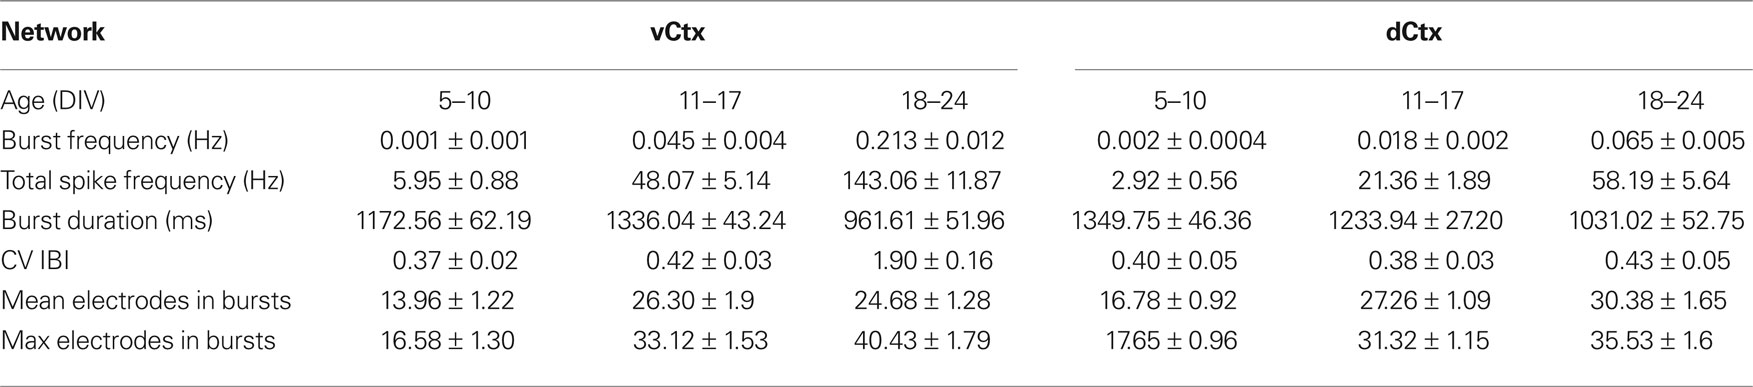
Table 2. All values are mean ± SEM of values pooled from different cultures. See Figure 11 for number of experiments, cultures and preparations.
Burst detection
Recurrent population burst is the most common activity pattern seen in developing cortical networks (Robinson et al., 1993 ; Maeda et al., 1995 ; Voigt et al., 2001 ; Marom and Shahaf, 2002 ; Opitz et al., 2002 ; Wagenaar et al., 2006a ). The preposition ‘population’ indicates that the activity of several, up to all, neurons in the network is modulated in synchrony into a ‘burst state’, whereas individual spikes are not necessarily synchronized (see Figure 2 , for example). If not otherwise stated, such population bursts are simply called bursts. More precisely, we define bursts as transient episodes of repetitive spiking >400 ms apart, which show some distribution across the network. The detection of burst then was accomplished by a top-down heuristic approach as follows. We first merged the spike times of all 59 electrodes onto a single virtual electrode, which accordingly contained all spike times for a given recording. We then searched on this virtual electrode for clusters of spikes with a maximal inter spike interval of 60 ms. If a cluster included at least 30 spikes and was a result of spikes detected on at least three electrodes, a burst was defined. The contribution of an electrode to a burst was assessed to be significant when at least three spikes were detected. This approach reliably detected bursts in our datasets, even in young cultures where the spike frequency during bursts was relatively low. The following parameters were quantified: the frequency of burst discharges, the coefficient of variation of the interburst interval (CV IBI), and the number of electrodes with spiking activity during bursts (‘electrode attendance’). The latter was used as a measurement for the distribution of the activity through the network, i.e., synchronization of the bursts discharges along the electrode array.
Calcium Imaging
We used calcium imaging to investigate developmental changes in GABAAR mediated synaptic transmission (Chen et al., 1996 ; Owens et al., 1996 ; Ganguly et al., 2001 ). Petri dish cultures were incubated in 5 μM fluo-3 pentacetoxy-methylester (Molecular Probes; purchased from MoBiTec, Goettingen, Germany) dissolved in DMSO (Molecular Probes, Eugene, OR, USA) for 1 h, followed by several washes with artificial cerebrospinal fluid (aCSF). The ionic composition of the aCSF was (mM): 140 NaCl, 5 KCl, 1.5 CaCl2, 0.75 MgCl2, 1.25 NaH2PO4, 20 D-glucose and 15 HEPES/NaOH (pH 7.4), and resembled the main components of the N2 culture medium except the pH buffering system (HEPES vs. bicarbonate). The culture dishes were transferred to an inverted microscope (Axiovert S100 TV, Zeiss, Oberkochen, Germany) equipped with a charge-coupled device camera (Cool Snap ES, Visitron Systems, Puchheim, Germany) and allowed to equilibrate for 20 min, a time when de-esterification of the dye takes place. Recording fields (usually 890 × 665 μm2, 5–10 for each culture dish) were chosen randomly and sometimes marked with a diamond tool when repeated imaging was required. Fluorescence images were obtained with a frequency of 2 Hz during 90-s-long sessions using MetaMorph 7.0 software (Universal Imaging Corp., West Chester, PA, USA). Excitation wavelength was 470 ± 20 nm (Chroma Technology, Brattleboro, VT, USA). A differential interference contrast (DIC) image of each field was also acquired for later cell identification. During each recording session cells were locally perfused with an aCSF containing either high potassium (KCl, 60 mM) or the GABAAR agonist muscimol (200 μM) using a multibarreled perfusion system. The local application lasted 2 s, resembling prolonged activation as during population burst activity. In young cultures muscimol elicits a large intracellular calcium response in many neurons (see Results), which was blocked by simultaneous application of high concentrations of the GABAAR antagonist gabazine (200–400 μM) (not shown). A second application of high potassium served as a control against possible bleaching of the dye during the recording session. Time points of pharmacological application are indicated by bars in Figure 4 B. Images were processed off-line using MetaMorph software and custom written MATLAB programs. We calculated the maximal emitted fluorescence in response to local pharmacological application for each cell. These values were called FK1, FM and FK2 (a.u.) (see Figure 4 B). The trace (ΔF) then was normalized with respect to FK1 (FN = ΔF/FK1). A cell was considered responsive to muscimol if the change of the normalized fluorescence (FN) was larger than an empirically determined threshold (FN/dt ≥ 0.05). Using the change in fluorescence, rather than FM itself, rules out false positive detection in case a cell showed very slow recovery from the preceding potassium application (this was observed rarely). All imaging experiments were carried out in the presence of glutamatergic blockers [D(−)-AP-5 12.5 μM, 6-cyano-7-nitroquinoxaline-2,3-dione disodium (CNQX) 2.5 μM], to suppress the spontaneous bursting.
Drugs and Drug Application
All drugs were dissolved to 100–1000× stocks, stored at −20°C, and diluted to final concentration just before application. We purchased 5-aminomethyl-3-hydroxyisoxazole hydrobromide (muscimol) and (−)-bicuculline methiodide (bicuculline) from RBI (RBI/Sigma, Deisenhofen, Germany), and D-2-amino-5-phosphonopentanoic acid (D(−)-AP-5), 6-imino-3-(4-methoxyphenyl)-1(6H)-pyridazinebutanoic acid hydrobromide (gabazine) and CNQX and 3-(aminosulfonyl)-5-(butylamino)-4-phenoxybenzoic acid (bumetanide) from Tocris Cookson (Biotrend, Cologne, Germany). Drugs were applied either directly from the stocks in case of MEA recordings or via a magnetic valve controlled gravity-fed perfusion system (ALA Scientific Instruments, New York, NY, USA) during the calcium imaging experiments.
Immunocytochemistry
GABA immunocytochemistry was carried out as described previously (de Lima and Voigt, 1997 , 1999 ; Voigt et al., 2001 ; de Lima et al., 2007 ). Briefly, Petri dish cultures were fixed for 30 min at 36°C by adding 70% glutaraldehyde to the culture medium to make a final concentration of 3.5%. Aldehyde-fixed cultures were then thoroughly washed in 0.05 M Tris buffer containing 0.85% sodium metabisulfite (pH 7.5), and preincubated for 3 h at room temperature with 3% bovine serum albumin, 10% normal goat serum and 0.6% Triton X-100 in Tris/metabisulfite solution. After washing, successive antibody incubations were performed: mouse anti-GABA (Chemicon, Temecula, CA, USA; 1:200) in Tris/metabisulfite solution containing 3% bovine serum albumin, 10% normal goat serum, 0.6% Triton X-100 overnight at room temperature; goat anti-mouse and mouse peroxidase-anti-peroxidase (1:200 in PBS containing 10% normal goat serum, 2% bovine serum albumin, 5% sucrose and 0.3% Triton X-100, 2 h, room temperature, Sternberger, Baltimore, MD, USA). After the primary antibodies, all washes were performed with PBS (0.1 M, pH 7.4). Peroxidase-anti-peroxidase antibody complexes were made visible by incubating with a solution containing 0.01% 3,3′-diaminobenzidine tetrahydrochloride, 0.004% H2O2, 1% nickel ammonium sulfate and 50 mM imidazole in 50 mM Tris–HCl saline buffer. After a final PBS wash, coverslips were dehydrated in an ethanol series, cleared in two changes of xylene and mounted over clean slides with Fluoromount (BDH Laboratory Supplies, Poole, UK).
For double-immunofluorescence labeling, coverslips were fixed with 4% paraformaldehyde and 0.005% glutaraldehyde (20 min, 36°C). GABA immunocytochemistry was performed as described above, except that anti-mouse-Cy3 (1:400; Jackson ImmunoResearch, Dianova, Hamburg) was used as secondary antibody. After washing, coverslips were fixed again with 4% paraformaldehyde and stained for parvalbumin (polyclonal rabbit anti-parvalbumin, 1:5000, Swant, Bellinzona) followed by anti- rabbit-Cy2 (1:400; Jackson ImmunoResearch). Coverslips were shortly dehydrated and embedded with Fluoromount. Only cells with an intense GABA staining of soma and dendrites were considered for the analysis.
To estimate the density of GABAergic cells we counted GABA positive neurons at 200× magnification using bright field microscopy with the aid of a grid in the microscope eyepiece on an inverse microscope equipped with a CCD camera (Axiophot, Zeiss, Oberkochen, Germany) (12 fields per cover slip, chosen at regularly spaced points over the cover slip surface). For each field the total cell number was counted at 400× magnification and phase contrast optics. We also quantified the overall intensity of GABAergic staining by taking digital images and computing the average luminance for each image. The data obtained from vCtx and dCtx cultures were normalized by the mean luminance of all dCtx cultures (see Results). All images were taken on the same day and microscope; no contrast or brightness correction was made. Cell soma size was estimated using 400× magnification with the aid of MetaMorph software.
Results
First we describe the development of spontaneous activity in lateral cortex networks (vCtx) in control conditions (Figures 1 and 2 A). Then we compare this development (a) with the spontaneous activity development of similar vCtx networks chronically blocked with a GABAAR antagonist (Figures 2 B, 7 and 8 , Table 1 ), and (b) with the spontaneous activity development of dorsal cortex networks (dCtx), grown in control conditions (Figures 9 –11 , Table 2 ). The GABAergic neurons developing in vCtx and dCtx networks are described in Figure 6 . Figures 4 , 5 and 12 show the developmental GABA shift in vCtx and dCtx networks.
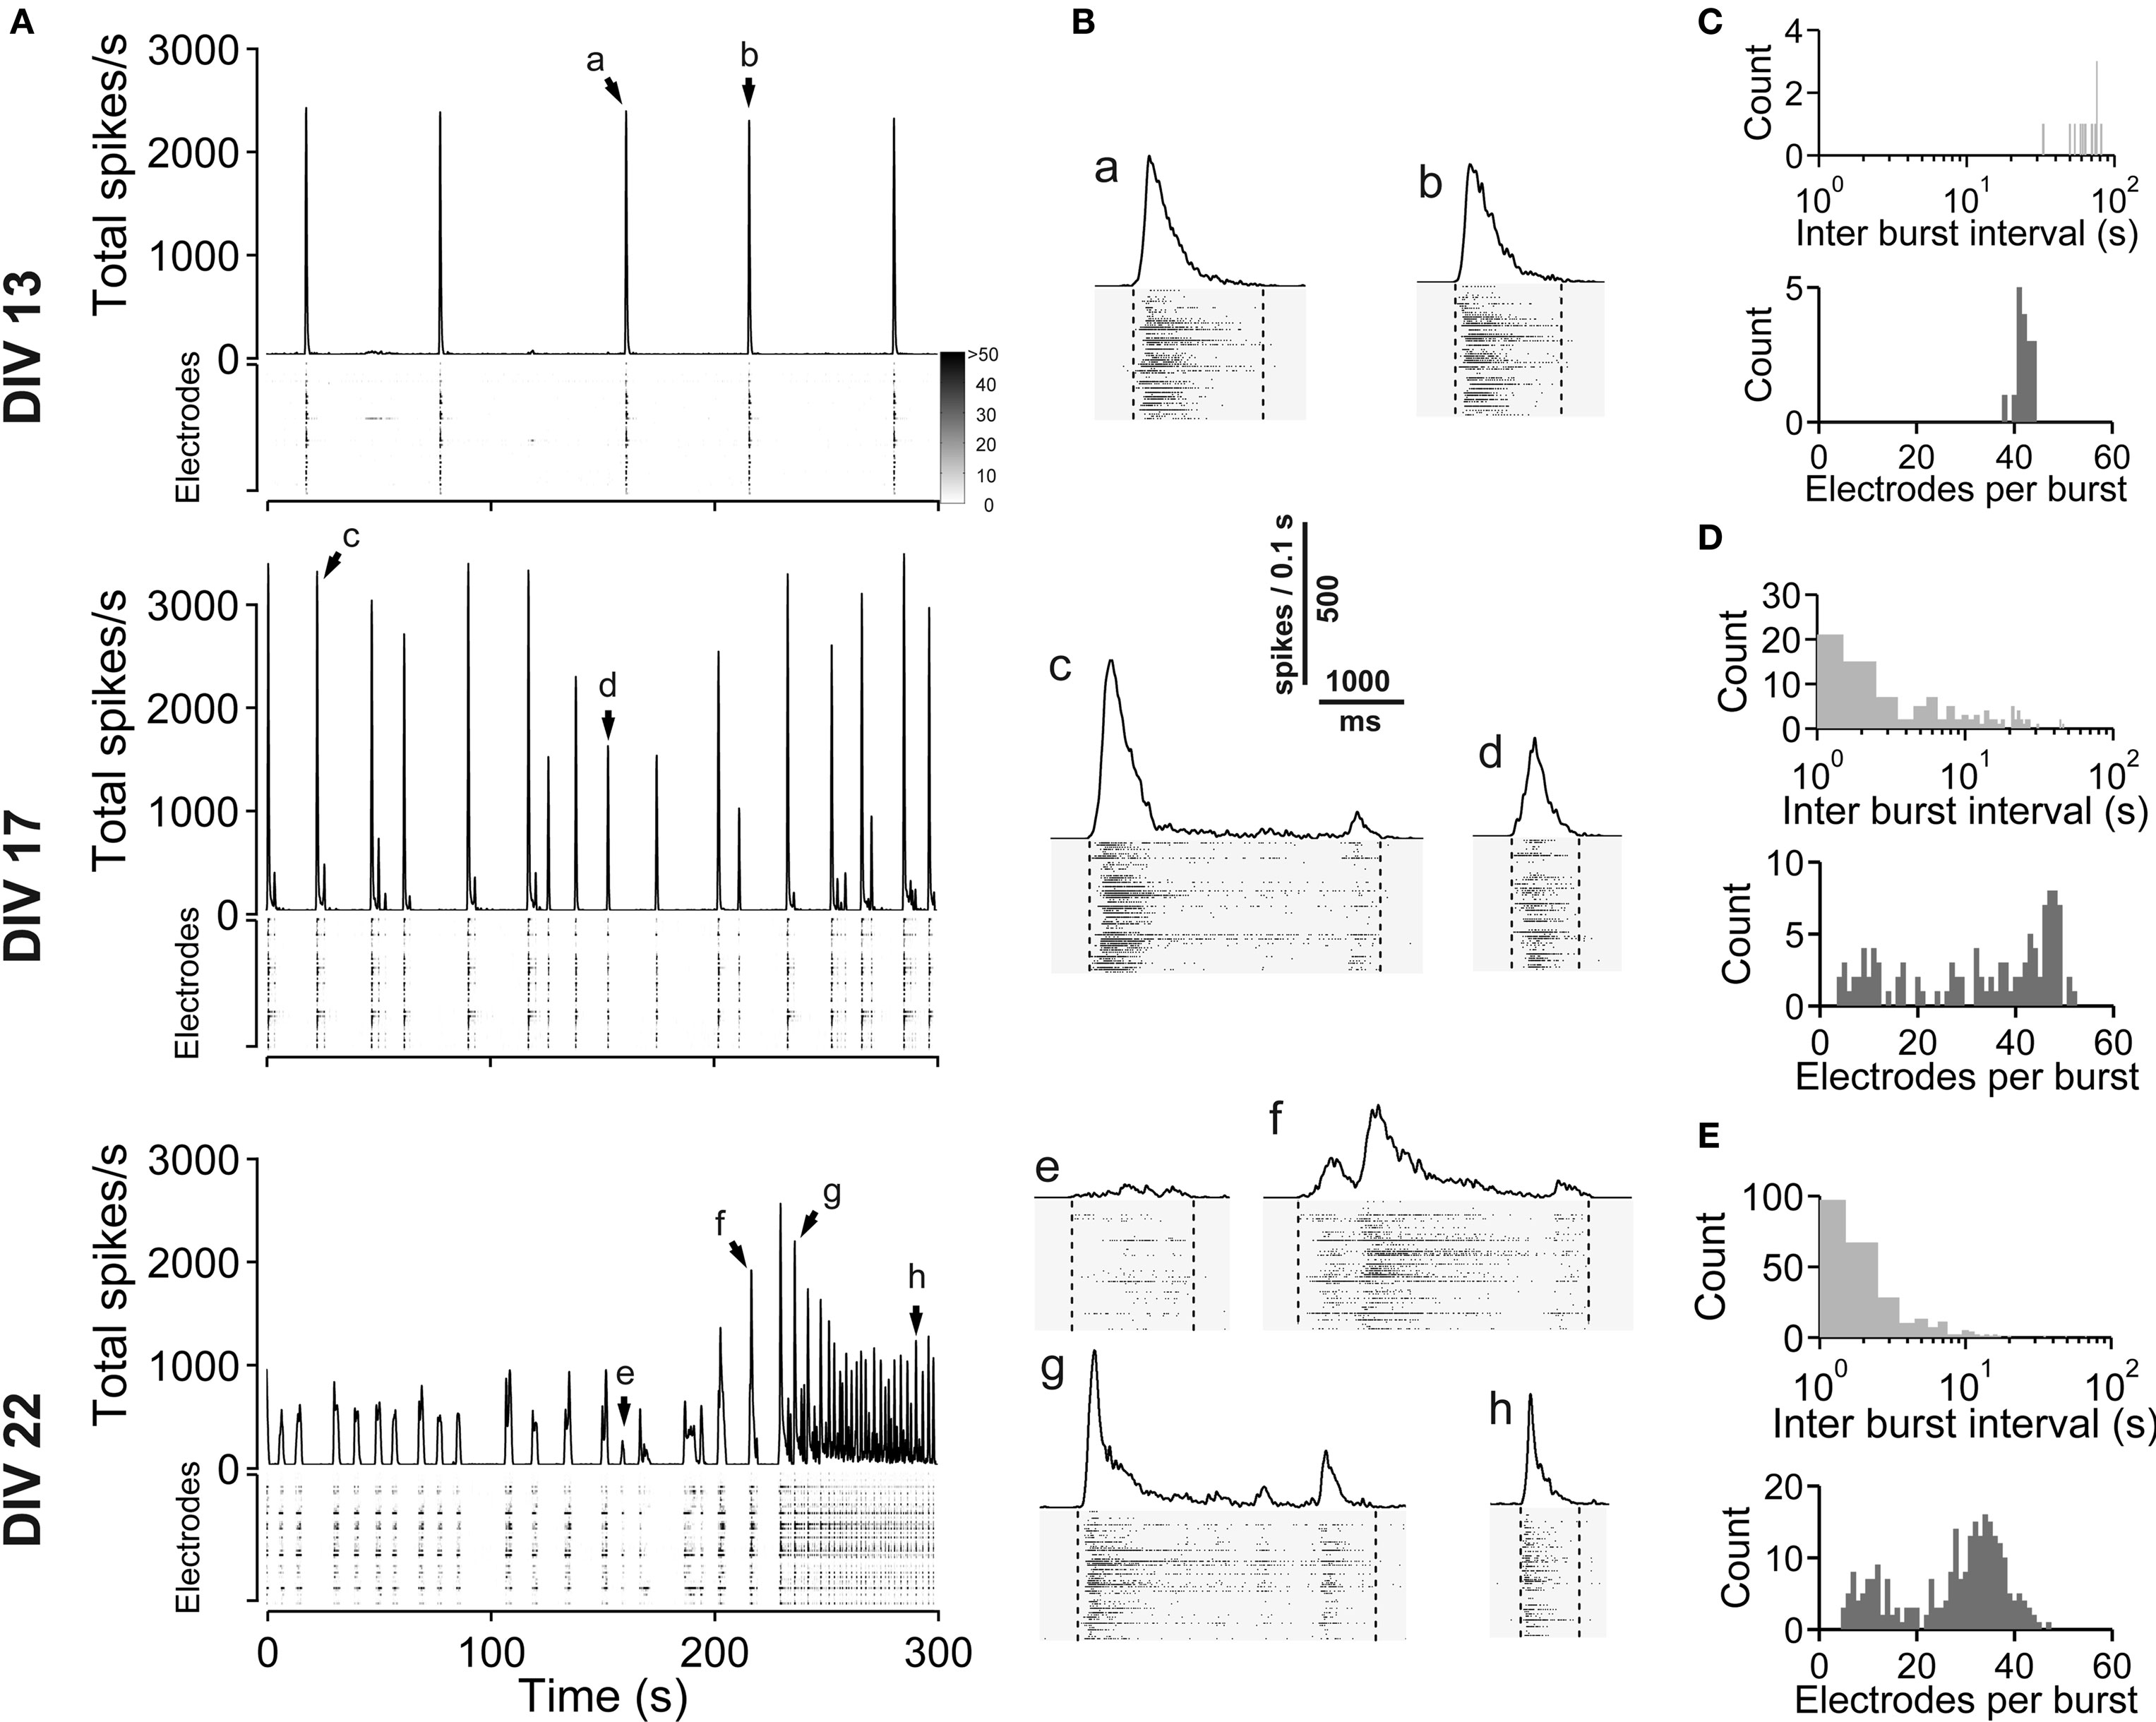
Figure 1. Spontaneous network activity development of lateral cortex cultures (vCtx). (A) The total spike frequency is shown over time for the same culture at different stages of development (DIV, see labeling on the left side). vCtx cultures develop a heterogeneous pattern of burst discharges when maintained several weeks in vitro. The upper part of each graph indicates the global firing rate, which is defined as the number of detected spikes through all MEA electrodes per time unit (second). Spikes detected by individual electrodes are indicated by gray levels in the lower part. The same scale (see gray scale at 13 DIV) was used for all graphs. Each of the vertically stacked horizontal lines corresponds to one electrode. For clarity only 5 min out of the 20-min recording sessions are shown. Arrows indicate bursts which are shown in higher temporal resolution in (B). (B) Individual population bursts in higher time resolution. Lower case letters correspond to labeling in (A). Dotted lines indicate detected burst limits. Time unit for the global firing rate is 0.1 s. (C) Histograms of the interburst interval (top) and electrode attendance in bursts (bottom) for a 20-min recording session for the culture shown in (A) at 13 DIV. Note the log scale for the interburst interval histogram (bin size is 1 s). (D) Same as (C) except for 17 DIV. (E) Same as (C) except for 22 DIV.
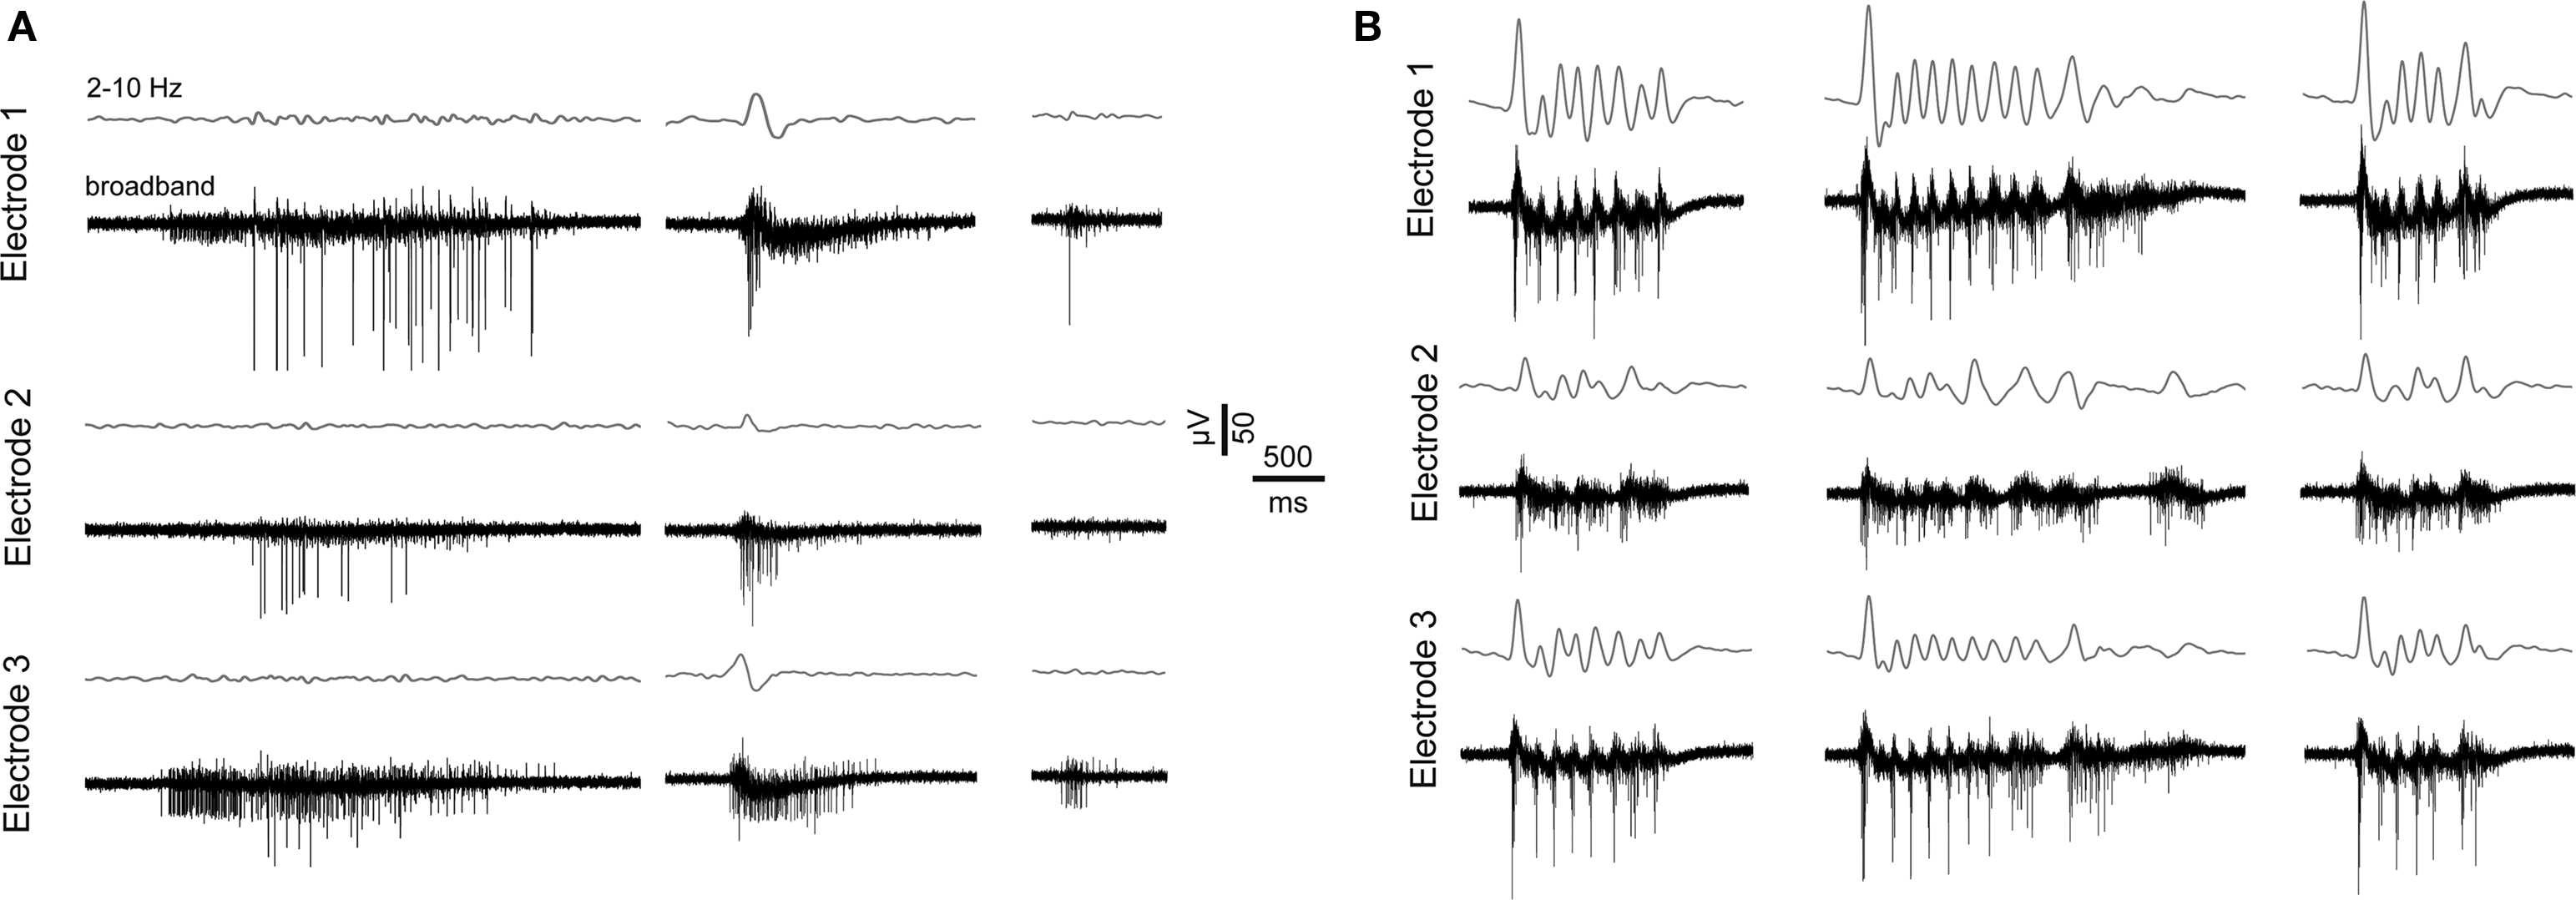
Figure 2. Features of spontaneous activity of vCtx networks. (A) Extracellularly recorded signals show three burst events of different magnitude from a 21-day-old vCtx culture. Gray lines above each raw trace indicate the band-pass filtered signal (2–10 Hz). The same burst event is shown on three different electrodes 1–2 mm apart. (B) Same as in (A), except that the vCtx culture was chronically blocked with gabazine (20 μM, added at 0 DIV).
Spontaneous Activity Development in vCtx Networks
Spontaneous electrical activity of cultures obtained from lateral cortex at embryonic day 16 (E16) was monitored by means of 59 substrate-integrated electrodes. At the earliest age studied (5 DIV) sporadic single spikes were detected on a few (∼1–5) electrodes. Afterwards spontaneous activity increased steadily. Figure 1 A shows exemplar recordings of spontaneous activity in cortical networks from 13-, 17- and 22-day-old vCtx networks. The total spike frequency (integrated over all electrodes) increased from an average 7.86 ± 1.30 Hz at 5–10 DIV (mean ± SEM, n = 28 recordings, eight cultures, three preparations) to 54.27 ± 7.22 Hz (n = 33) and 117.28 ± 12.13 Hz (n = 20) at 11–17 and 18–24 DIV, respectively (Table 1 ). By the end of the first week in vitro the cultures developed recurrent synchronous burst discharges, i.e., transient clusters of spikes, which spread over several electrodes (see Materials and Methods; Figures 1 and 2 A). Bursts that occurred at regular intervals were observed until about the end of the second week in vitro (Figure 1 A, DIV 13). Later bursts became irregular in their occurrence and synchronization along the electrode array (Figure 1 A, DIV 17, DIV 22). During the first 3 weeks in vitro the interburst interval (IBI) distribution steadily shifted toward lower values (Figures 1 C–E, top graphs). The burst frequency was on average 0.010 ± 0.001 Hz in 5- to 10-day-old vCtx cultures and increased to 0.05 ± 0.01 Hz and 0.20 ± 0.02 Hz in 11–17 DIV and 18- to 24-day-old cultures, respectively. During the IBIs, in the range of seconds to minutes, neurons showed virtually no spiking activity. The increase of variability of burst timing during the development is reflected in the CV IBI. The CV IBI was initially 0.39 ± 0.04 in 5- to 10-day-old vCtx cultures and increased to 0.49 ± 0.05 and 2.39 ± 0.23 in 11- to 17- and 18- to 24-day-old cultures, respectively. Burst duration was on average 1431.35 ± 74.49 ms in 5- to 10-day-old vCtx cultures, and 1348.78 ± 66.29 ms and 1078.71 ± 80.42 ms in 11- to 17- and 18- to 24-day-old vCtx cultures, respectively.
As a measure for burst synchrony, i.e., spread of burst firing across the electrode array, we determined the burst electrode attendance, i.e., the number of electrodes with spiking activity during each burst event. Note that the term synchronization does not apply at a time scale of single spikes, but on a longer time scale, i.e., firing rates of many cells are modulated in synchrony (see Figure 2 A). The mean electrode attendance was on average 15.35 ± 1.52 electrodes in 5- to 10-day-old vCtx cultures, increased to 29.81 ± 1.18 electrodes at 11–17 DIV and decreased significantly (p < 0.001, t-test) to 23.04 ± 1.39 electrodes in 18- to 24-day-old cultures. The maximal electrode attendance during the recording session shows a steady increase from initially 18.13 ± 1.57 electrodes at 5–10 DIV to 38.15 ± 1.49 and 41.30 ± 2.34 electrodes at 11–17 DIV and 18–24 DIV, respectively. Thus, the decreased mean burst synchrony in 18–24 DIV old cultures is not due to a declining of neuronal health. An initial single peak in the histogram of the electrode attendance in 2-week-old cultures (Figure 1 C, bottom) became broader and at least two peaks could be identified after approximately 3 weeks in vitro (Figure 1 E, bottom). That is, the network activity ultimately comprised both very synchronous and partially synchronized bursts.
The spontaneous population burst activity was fully blocked by application of AMPA and NMDA glutamate receptor blockers (CNQX, 10 μM, and D(−)-AP-5, 50 μM, respectively) in 3-week old vCtx cultures (n = 3; one preparation, not shown). The acute GABAAR blockade with bicuculline (5 μM) changed the variable burst discharges of vCtx cultures (>21 DIV) to more regular, stereotyped bursts (Figure 3 A). Compared with unblocked controls the burst frequency was decreased by 61.71 ± 4.05% (p < 0.001), the number of electrodes in bursts was increased by 60.79 ± 9.17% (p < 0.001), the burst duration was increased by 144.08 ± 62.75% (p < 0.05), the overall spike frequency was increased by 55.02 ± 16.85% (p < 0.05), and the CV IBI was decreased by 69.75 ± 9.29% (p < 0.001, n = 8 cultures, three preparations, t-test, Figures 3 C–G, dark gray bars).
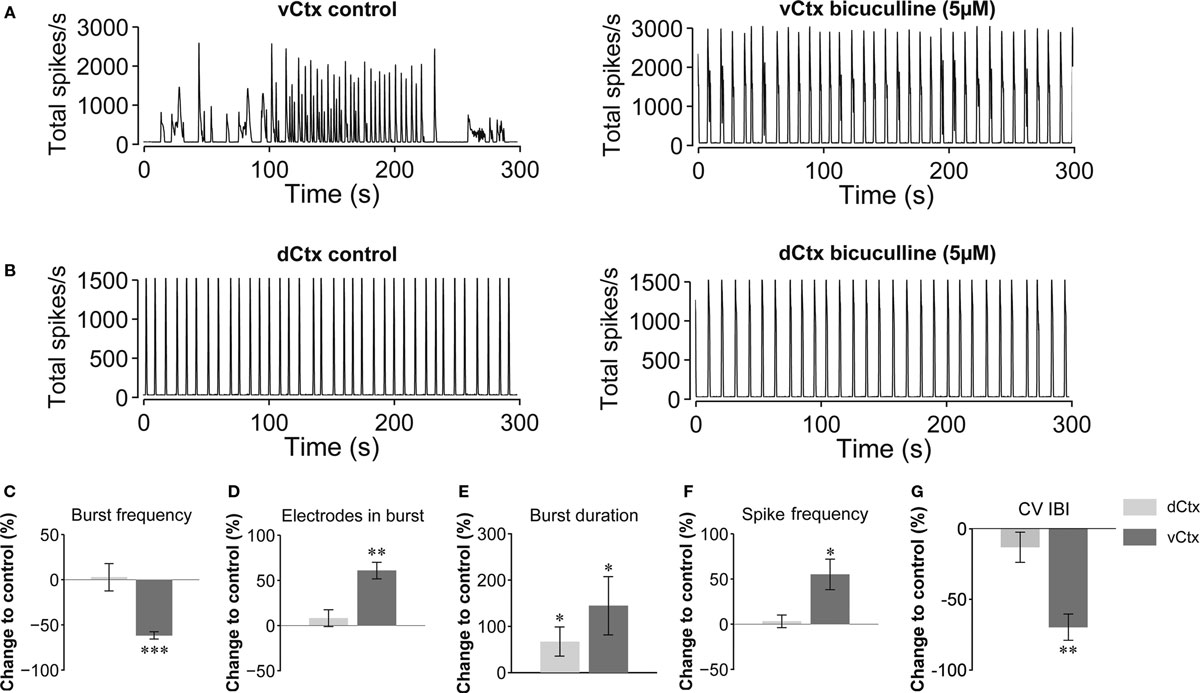
Figure 3. Acute GABAAR blockade of 3-week-old networks. (A) Bursting activity of a 21-day-old vCtx culture under control conditions (left) and during the presence of the GABAAR blocker bicuculline (5 μM) in the culture media (right). (B) Same as in (A) but for dCtx networks (see Figures 9 –11 ). (C–G) Dark gray bars in summary graphs show changes of burst properties of vCtx cultures in blocked compared with control conditions. Light gray bars show equivalent quantitative results for acutely blocked dCtx compared with control dCtx networks. Data were obtained from 20-min recording sessions of 20- to 28-day-old cultures (vCtx cultures: n = 8, dCtx cultures: n = 7, three preparations, asterisks indicate significance: *p < 0.05; **p < 0.001; ***p < 0.0001; t-test).
Next we asked if the maturation of the network activity pattern is correlated with the GABA shift. Early bursting activity in cortical neurons is accompanied by an increase of intracellular calcium (Opitz et al., 2002 ). Small increases of intracellular calcium concentration are usually associated with single spiking or subthreshold activation, whereas bursting leads to a very strong increase of intracellular calcium (Opitz et al., 2002 ; Cossart et al., 2005 ). The local application of the GABAAR agonist muscimol early in network development evokes a calcium transient due to the depolarizing action of GABA (Yuste and Katz, 1991 ; Lin et al., 1994 ; LoTurco et al., 1995 ; Garaschuk et al., 2000 ; Ganguly et al., 2001 ). In this set of experiments we locally applied short puffs of either high potassium (60 mM) or muscimol (200 μM, Figure 4 ), and recorded calcium transients by Fluo-3 imaging. The time course of the pharmacological applications is shown in Figure 4 B. In vCtx cultures, we found that the amplitude of intracellular calcium transients and the number of neurons with a significant increase of intracellular calcium decreased with development (Figures 4 D–G). The fraction of cells that showed a significant increase of intracellular calcium in response to muscimol decreased from initially 95.98 ± 1.23% at 5 DIV to 45.22 ± 4.10% at 29 DIV (Figure 4 E). Interestingly, some cells already showed very weak response to muscimol as early as DIV 5 (Figure 4 G). Moreover, concurrent with observations in cortical slices (Garaschuk et al., 2000 ), after the GABA shift >40% of neurons showed a small, but significant increase of intracellular calcium in response to the GABA agonist muscimol (Figures 4 E–G).
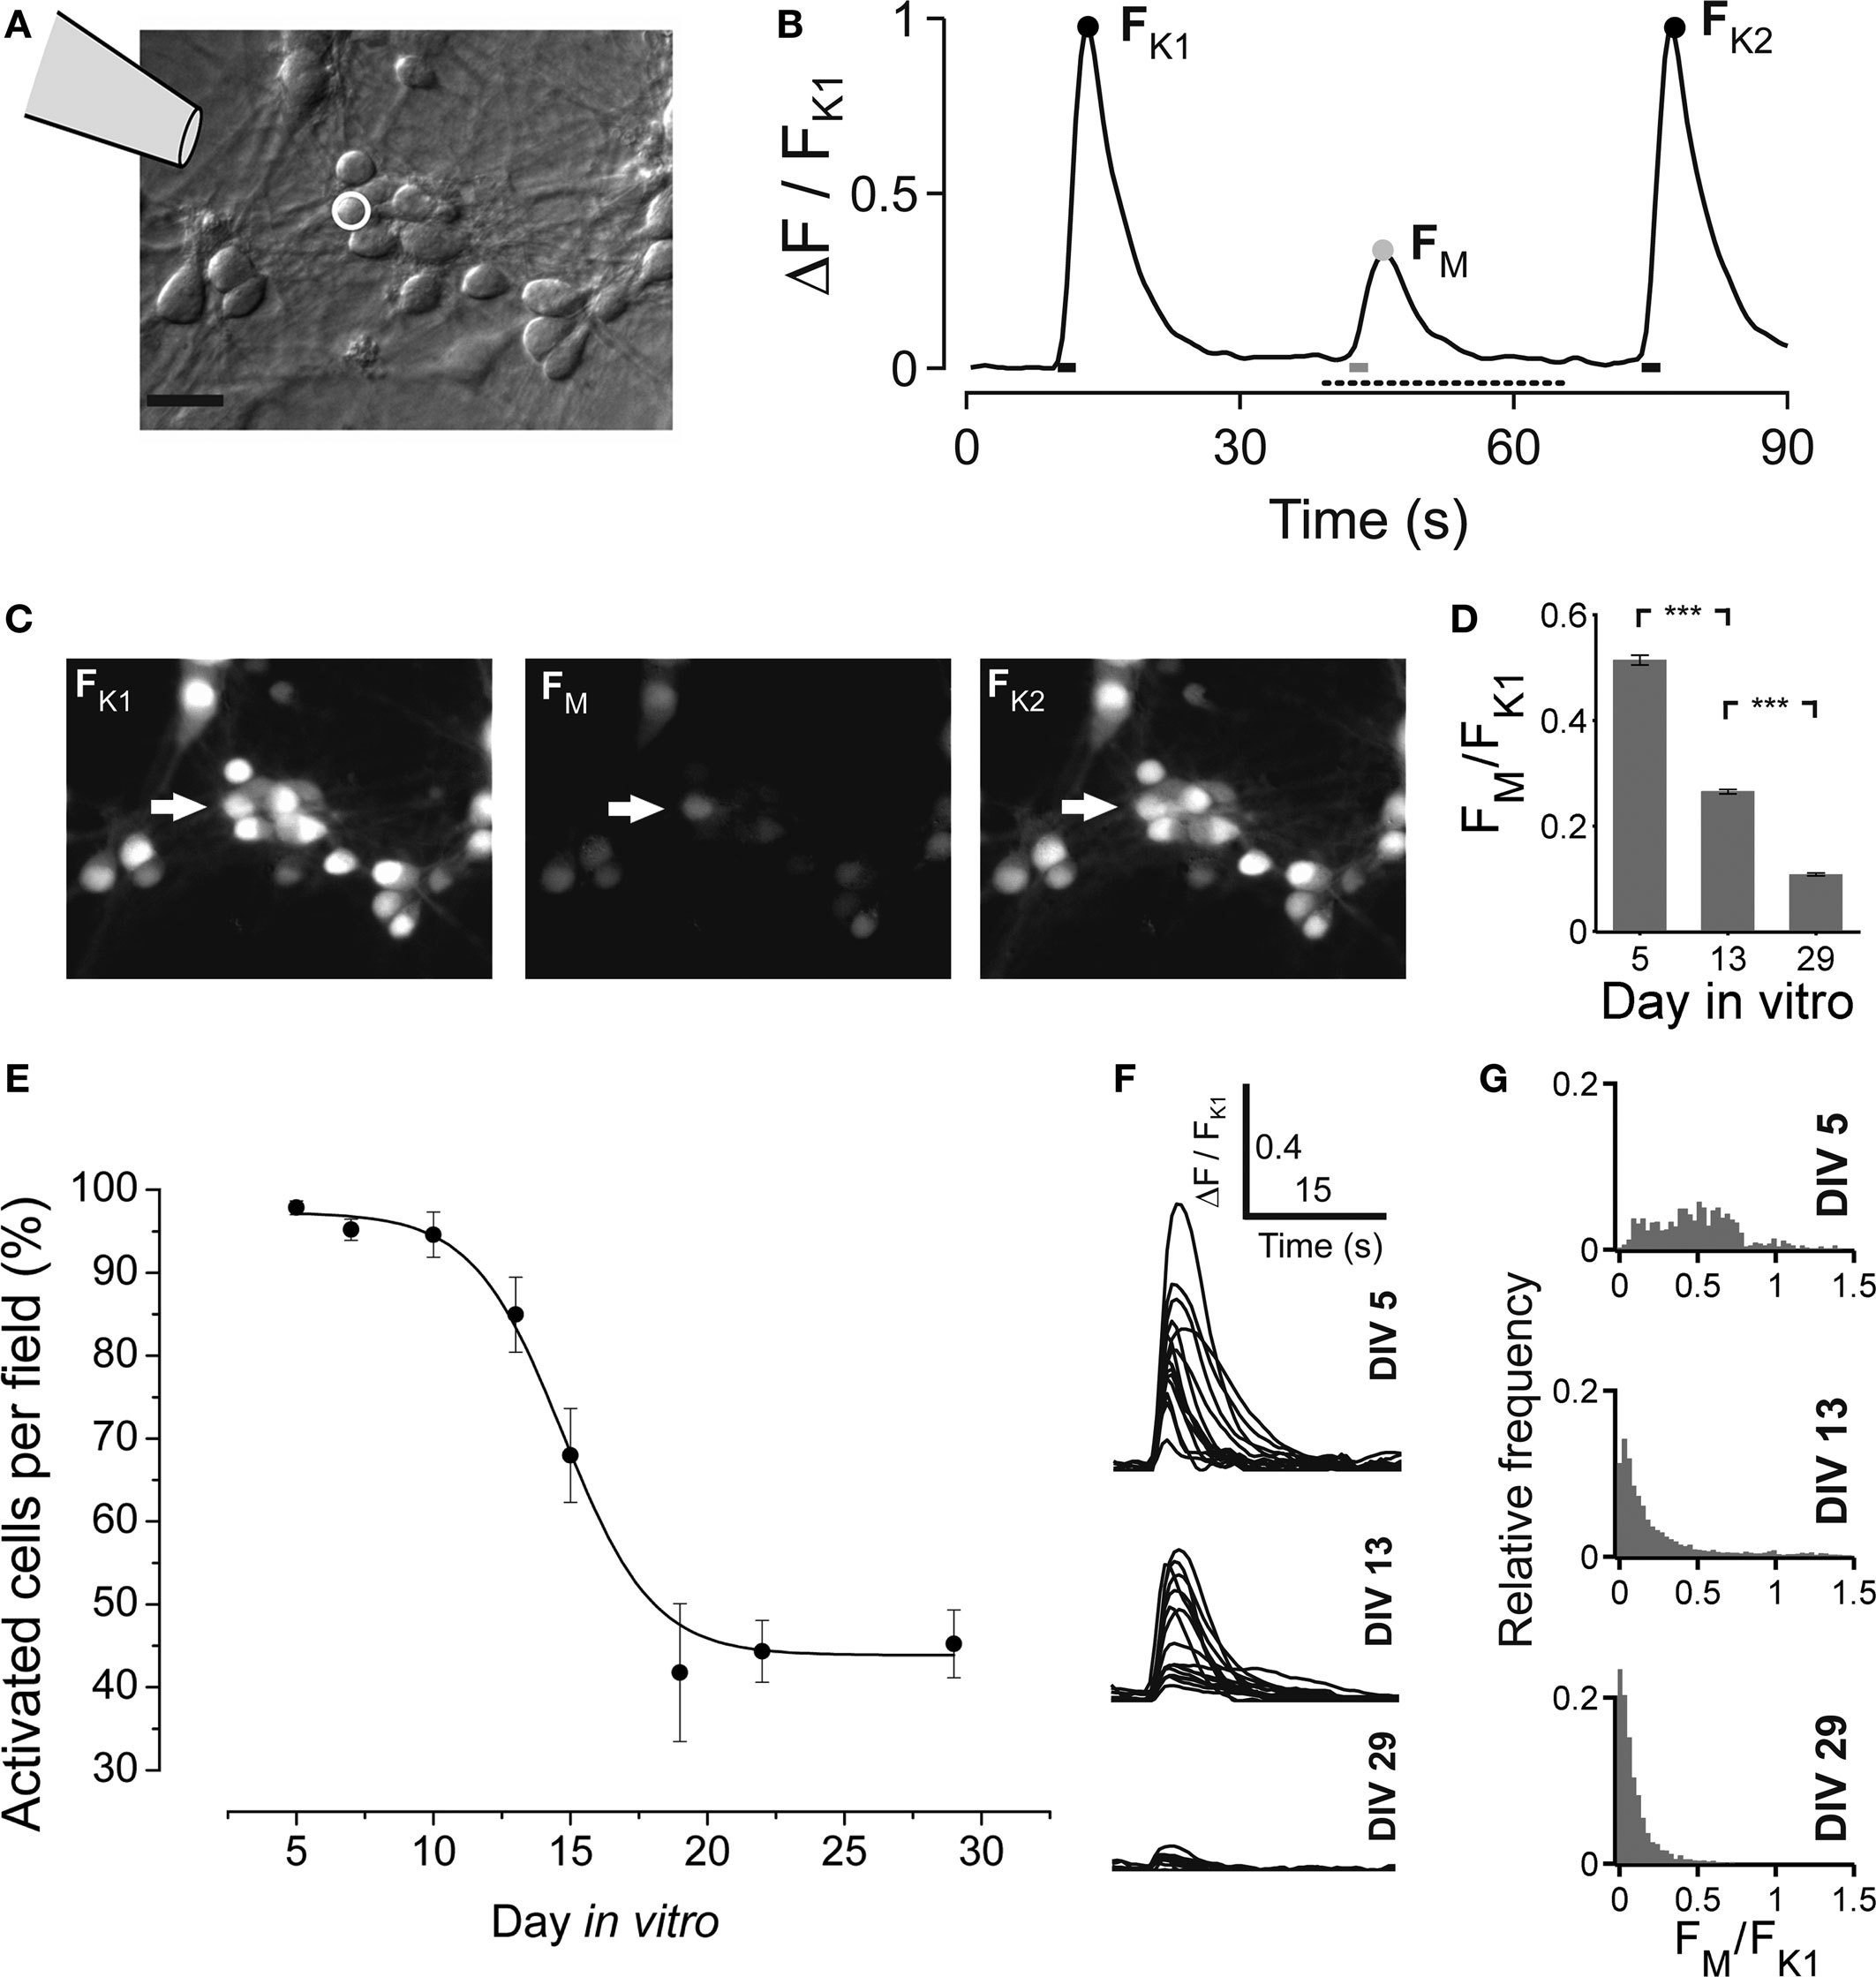
Figure 4. Developmental change of the GABAAR mediated calcium response in vCtx cultures. (A) Schematic drawing indicates the local drug application pipette over the differential interference contrast image of a 5-day-old culture (Scale bar = 20 μm). (B) Fluorescence changes of an individual cell [white circle in (A)] in response to a short pulse of either a solution containing high potassium (60 mM) or the GABAAR agonist muscimol (200 μM). The three calcium transients correspond to the time points of drug application, indicated by bars at the bottom. The black dots denote the maximum fluorescence in response to the K+ pulses (FK1 and FK2). The gray dot denotes the maximum fluorescence in response to local muscimol application (FM). (C) Fluo-3 fluorescence of the cells shown in (A) at FK1, FM and FK2. (D) Average ratio of the evoked calcium responses FM and FK1 at DIV 5, DIV 13 and DIV 29 (n = 1834, 1922 and 1643 cells, respectively; each from three independent preparations; asterisks indicate significance, p < 0.0001; t-test). (E) The fraction of cells with a significant increase of fluorescence in response to muscimol in each recorded field is shown as a function of time. Each dot represents the average of several recorded fields (>15), pooled from three cultures per DIV, three preparations. Solid line is a Boltzmann fitted sigmoid. (F) Example traces of muscimol elicited calcium transients for different ages for the time interval indicated by a dotted line in (B). (G) Histograms of the ratio FM and FK1 at the indicated days in vitro.
The results above suggest a causal relationship between the development of the hyperpolarizing postsynaptic effect of GABA and the network activity heterogeneity in mature (∼3-week-old) vCtx cultures. In the following we tested if a change in the polarity of GABA action can evoke a premature network activity differentiation in young cultures. The depolarizing effect of GABA in immature neurons is due to high intracellular chloride provided by the Na+, K+-2Cl− cotransporter NKCC1 (Ben-Ari, 2002 ; Yamada et al., 2004 ; Dzhala et al., 2005 ; Ben-Ari et al., 2007 ). A blockade of NKCC1 with bumetanide in young neurons results in a hyperpolarization shift of the GABAA reversal potential (Dzhala et al., 2005 , 2008 ; Sipila et al., 2006 ; Balena and Woodin, 2008 ). In vCtx cultures (9–11 DIV) we blocked the NKCC1 function with bumetanide (10 μM) and quantified the regularity of burst firing by the coefficient of variation of the intraburst frequency (CV IBF) and the CV IBI. NKCC1 blockade led to a significant increase of bursting variability (Figure 5 ). Compared with controls the CV IBI (Figure 5 G) and CV IBF (Figure 5 H) were increased by 105.85 ± 34.84% (p < 0.05) and 41.05 ± 14.87% (p < 0.05), respectively. Thus, a shift of the postsynaptic effect of GABA from depolarizing into the hyperpolarizing direction induced a change of the network activity from regular, highly synchronized bursting to less synchronized and irregular bursting in vCtx cultures.
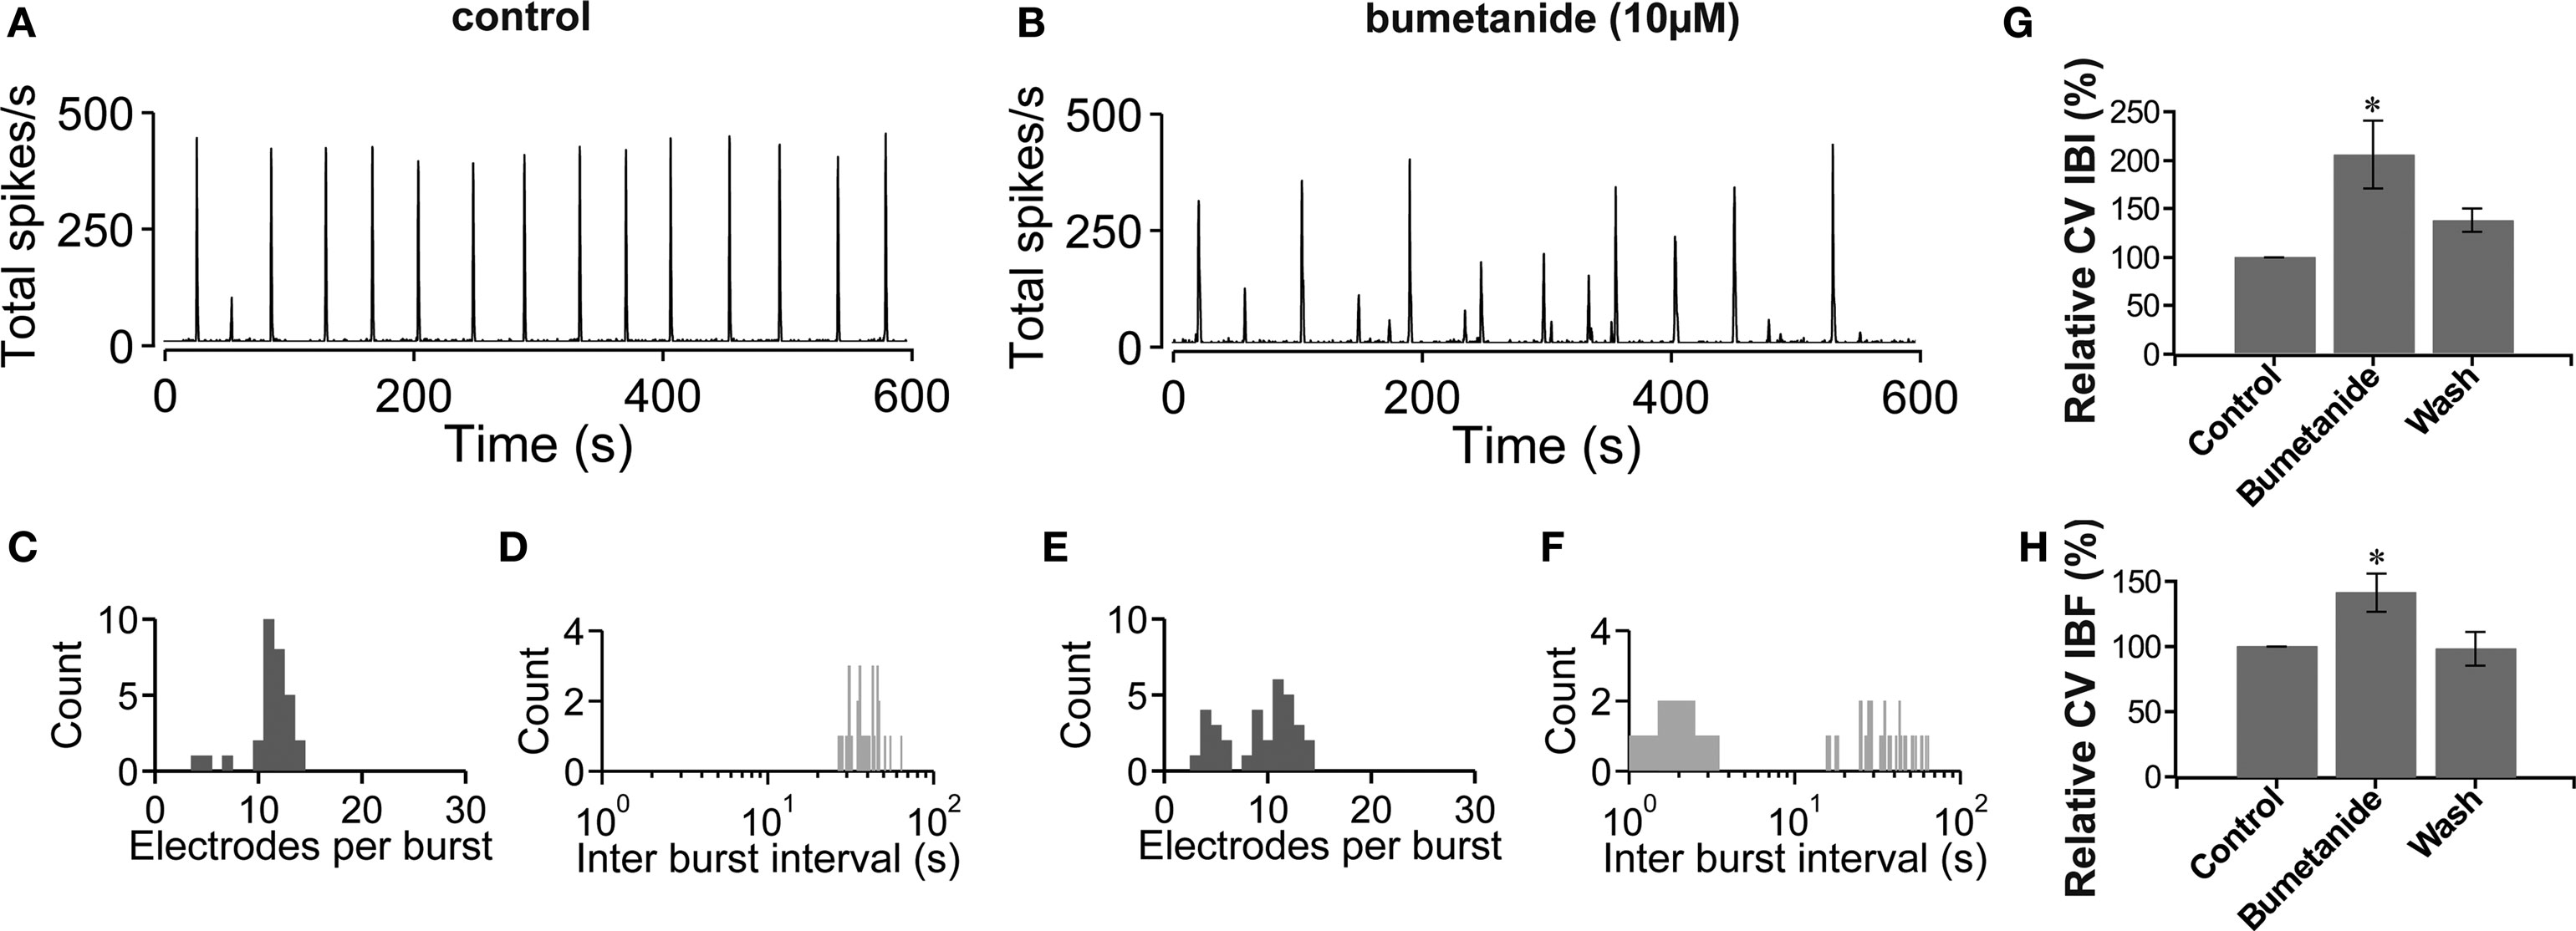
Figure 5. Blockade of NKCC1 function by bumetanide. (A,B) The total network spike frequency over time is shown for a 9-day-old vCtx culture in control conditions (A) and in the presence of bumetanide (10 μM) in the culture media (B). (C,D) Histograms of the electrode attendance during bursts (C) and interburst interval (D) for a 20-min recording period, of which 600 s are shown in (A). Note the log scale for the interburst interval histogram (bin size is 1 s). (E,F) Same as (C,D) except for the recording shown in (B). (G,H) Bumetanide induced changes in the variability of the interburst interval (G) and intraburst frequency (H). Asterisks indicate statistical significance: *p < 0.05, n = 7, two preparations, t-test).
In vCtx cultures, 4.68 ± 0.21% of the neurons at 1 DIV and 3.56 ± 0.54% of the neurons at 21 DIV (mean ± SEM, n = 8 cultures, three preparations) were labeled with GABA antibodies. The soma size of GABAergic neurons (21–22 DIV) showed a bimodal distribution (Figures 6 A,D), and, on average, 72.25 ± 5.45% (434 of 578 analyzed cells) of the GABAergic neurons had a soma area above 100 μm2 and 27.75% (144 cells) had a soma area below 100 μm2. Most large GABAergic cells in 21- to 22-day-old vCtx cultures were parvalbumin positive (77.11 ± 1.69%, 714 of 926 cells, eight cultures, three preparations, Figure 6 C). In contrast, small GABAergic neurons were invariably parvalbumin negative (Figure 6 C). The morphological and immunocytochemical characterization of GABAergic neurons are in line with previous findings in young neocortical cultures (de Lima and Voigt, 1997 ; de Lima et al., 2004 , 2009) .
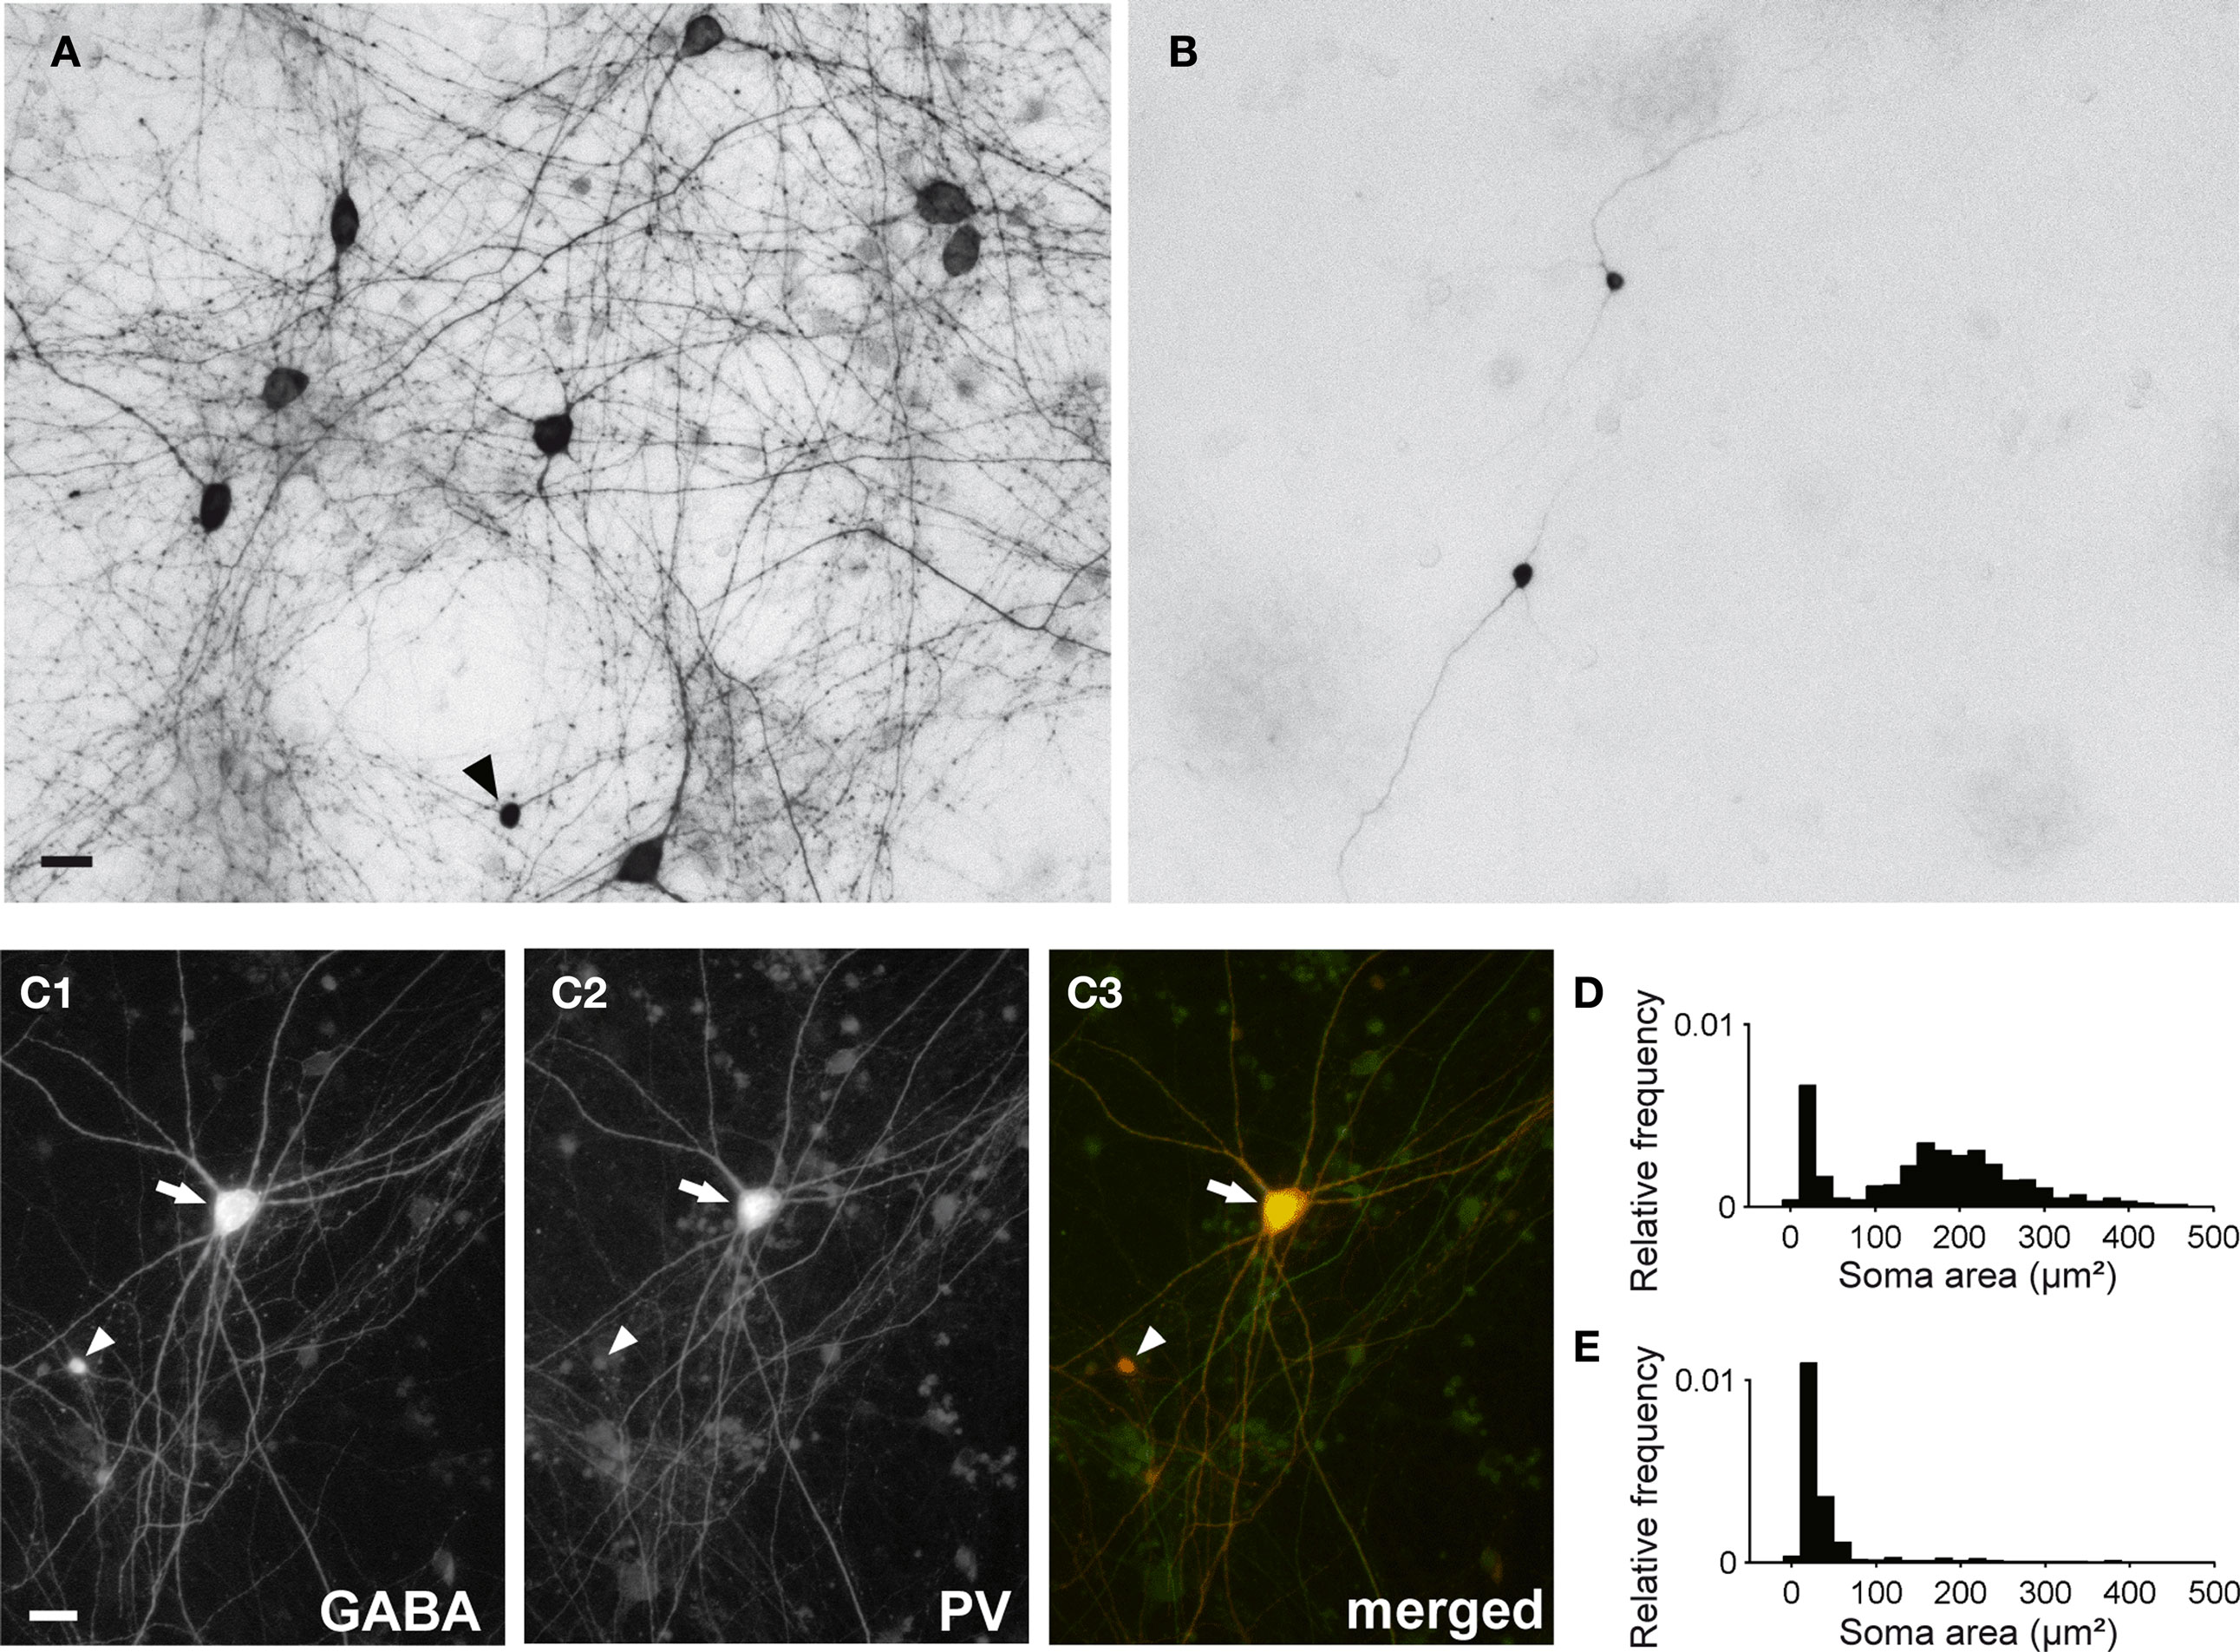
Figure 6. GABAergic neurons in 3-week-old cultured networks. (A) The bright field image shows several large GABA immunostained neurons in a 21-day-old vCtx culture (DAB staining). The arrowhead indicates a small GABAergic neuron. (B) Same as (A) except for dCtx culture. Two small GABAergic neurons can clearly be identified. (C1–3) Colocalization of gamma-aminobutyric acid (GABA) and parvalbumin (PV) immunofluorescence in a large GABAergic neuron (arrow) in a 21-day-old vCtx culture. The arrowhead indicates a small GABA+/PV− neuron. Scale bar is 20 μm. (D) Distribution of the soma size of GABAergic neurons in vCtx cultures (see main text for details). (E) Same as (D) except for dCtx cultures.
Spontaneous Network Activity Development with Blocked GABAA Signaling
After the GABA shift, the synchronization and regularity of spontaneous bursting decreases significantly (see above). The acute blockade of GABAAR signaling increased network activity synchronization and regularity. Here we ask if the chronic blockade of GABAARs can prevent the maturation of the spontaneous activity pattern in vCtx networks.
We examined the effect of GABAAergic signaling by comparing the spontaneous activity development of GABAAR-blocked vCtx cultures (gabazine 20 μM, added 3 h after plating, Figures 7 and 8 , Table 1 ) with control vCtx sister cultures (see above, Figures 1 and 2 ). Similar to controls, GABAAR-blocked vCtx cultures showed regular bursting at the end of the first week in vitro. Unlike control cultures, regular bursting persisted in the GABAAR-blocked cultures (Figure 7 A). Interestingly, spontaneous bursts in older cultures showed prominent oscillatory discharges (circa 3–15 discharges, ∼3–10/s) (Figures 2 B and 7 B).
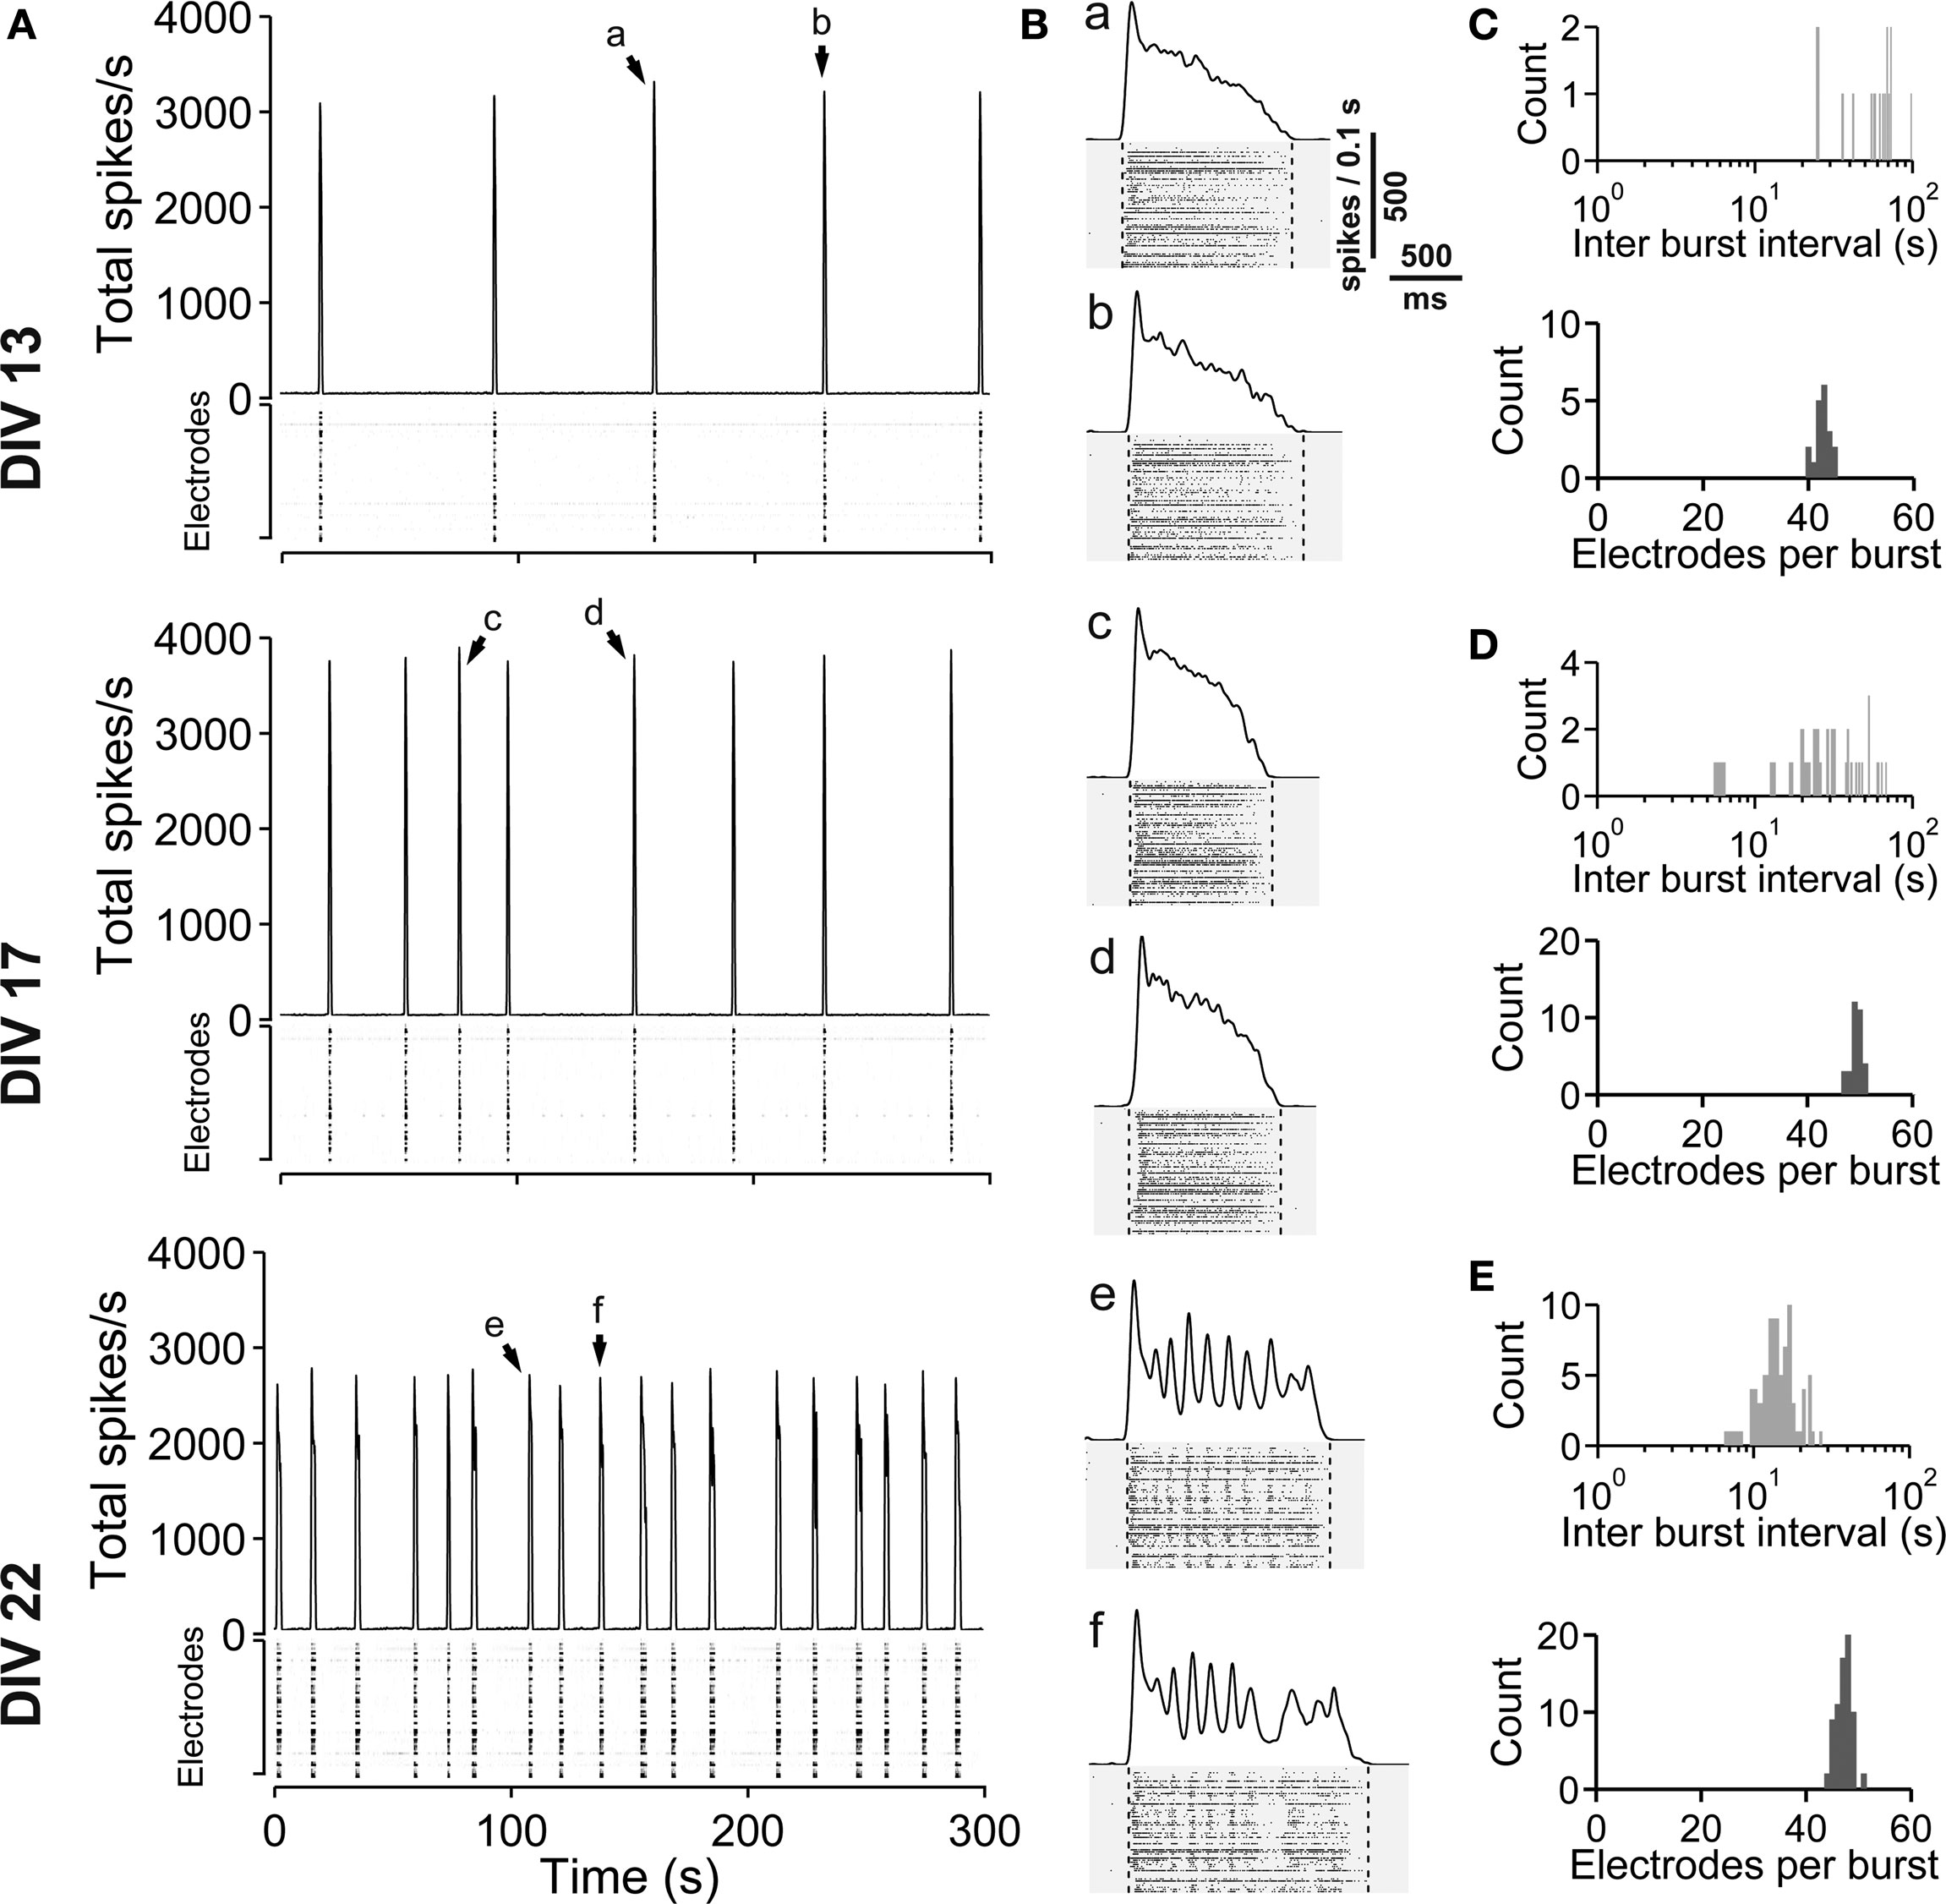
Figure 7. Spontaneous activity development of vCtx networks with chronically blocked GABAA receptors. (A) The total spike frequency is shown over time for vCtx cultures chronically treated with gabazine (20 μM, added at 0 DIV) at different stages of development (13, 17, 22 DIV). These networks develop a regular bursting pattern, which persists throughout their lifetime. See Figure 1 for graph description. Arrows indicate bursts which are shown in higher temporal resolution in (B). (B) Individual population bursts in higher time resolution. Oscillatory discharges emerge during the third week in vitro. Lower case letters correspond to labeling in (A). Dotted lines indicate detected burst limits. Time unit for the global firing rate is 0.1 s. (C) Histograms of the interburst interval (top) and electrode attendance in bursts (bottom) for a 20-min recording session for the culture shown in (A) at 13 DIV. Note the log scale for the interburst interval histogram (bin size is 1 s). (D) Same as (C) except for 17 DIV. (E) Same as (C) except for 22 DIV.
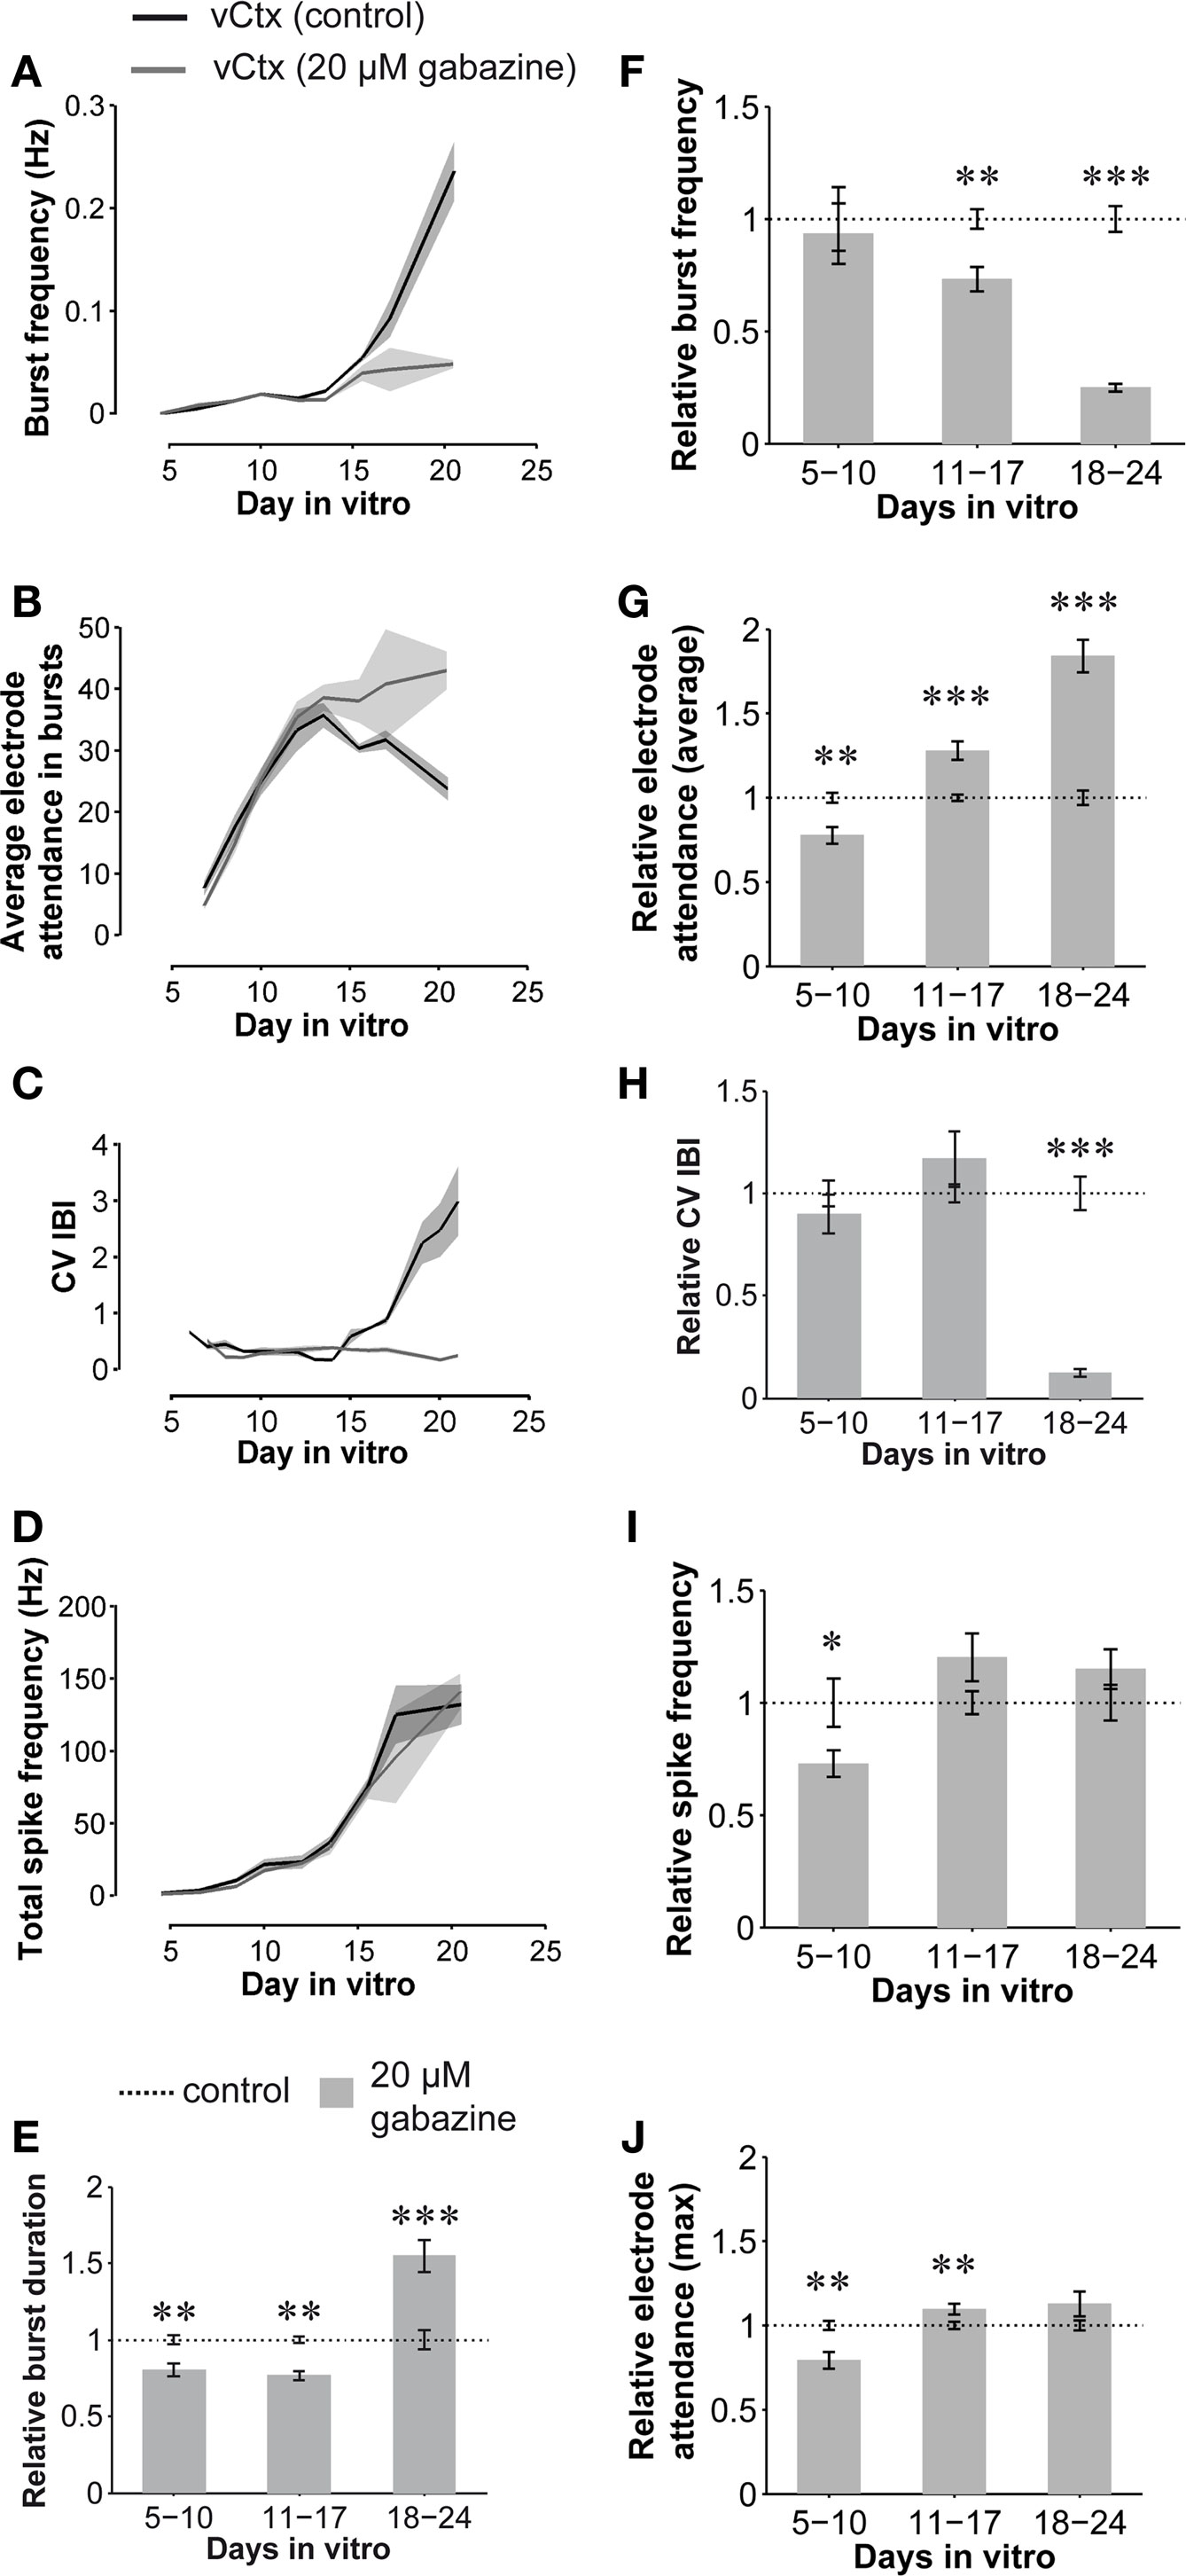
Figure 8. Quantitative features of spontaneous activity development: GABAAR-blocked compared with control vCtx networks. (A–D) Graphs show the development of spontaneous network activity features in control vCtx cultures and in sister vCtx cultures grown with GABAAR blocker gabazine (20 μM) added to the medium. (A) Shows the development of the burst frequency, (B) the average number of spiking electrodes during a burst event, (C) the coefficient of variation of the interburst interval (CV IBI) and (D) the total spike frequency for cultures obtained from one preparation. (A–D, n = 4, cultures per age group, shaded areas in this and subsequent figures indicate SEM). (E–J) Summary graphs of parameters of spontaneous activity development of blocked vCtx cultures pooled from different preparations normalized to values of age-matched control cultures in each preparation. Data were obtained from 20-min recording sessions per day in vitro. Asterisks indicate significance: *p < 0.05; **p < 0.001; ***p < 0.0001; t-test; 5–10 DIV n = 28 recordings of unblocked cultures/n = 27 recordings of blocked cultures; 11–17 DIV n = 33/n = 30; 18–24 DIV n = 20/n = 18; eight cultures per group; three preparations. Data are given in mean ± SEM.
Compared with control cultures, the total spike frequency was lower in the blocked networks until the middle of the second week in vitro (72.89 ± 5.99% of controls, p < 0.05, Figures 8 D,I). In the following weeks total spike frequency was not significantly different from control networks (p = 0.08, 11–17 DIV; p = 0.21, 18–24 DIV, Figures 8 D,I). The burst frequency of chronically blocked cultures did not differ significantly from that of the unblocked cultures until about the middle of the second week in vitro (5–10 DIV, p = 0.74, n = 28 recordings from eight unblocked cultures, n = 27 recordings from eight blocked cultures, three preparations, t-test, Figures 8 A,F). In older cultures, the burst frequency was decreased under the chronic GABAAR blockade (11–17 DIV: 73.20 ± 13.41% of controls, n = 33 recordings of unblocked cultures, n = 30 recordings of blocked cultures, p < 0.001; 18–24 DIV: 24.98 ± 1.72% of controls, n = 20 recordings of unblocked cultures, n = 18 recordings of blocked cultures, p < 0.0001). The CV IBI in 5- to 10- and 11- to 17-day-old blocked cultures did not differ significantly from age-matched controls (Figures 8 C,H). In 18- to 24-day-old blocked cultures, however, the CV IBI was significantly decreased (12.58 ± 1.88% of controls; p < 0.0001). Furthermore, while the mean burst duration of blocked vCtx cultures was decreased at 5–10 and 11–17 DIV (80.54 ± 4.25%, p < 0.001 and 76.51 ± 2.69%, p < 0.001, respectively), burst duration was increased in 18- to 24-day-old blocked cultures compared with aged matched controls (154.64 ± 10.63%, p < 0.0001) (Figure 8 E).
In contrast to the development in control cultures, the average electrode attendance during bursts increased during the first 2 weeks in vitro and remained stable afterwards in cultures with blocked GABAARs (Figure 8 B). The electrode attendance of blocked vCtx cultures was lower than controls (77.65 ± 4.83% of controls, p < 0.001) until the middle of the second week in vitro. This reversed with further development of the cultures. The average electrode attendance was 127.92 ± 5.53% (p < 0.0001) of control in 11–17 DIV old blocked vCtx cultures and 184.10 ± 9.72% (p < 0.0001) of controls in 18- to 24-day-old cultures (Figures 8 B,G). The maximal electrode attendance showed no significant differences (p = 0.11) between blocked and unblocked 3-week-old networks (Figure 8 J). The single peak in the electrode attendance histogram of blocked cultures mirrors the temporal regularity of burst firing and suggests the recruitment of the whole network during each burst event (see Figures 7 C–E, bottom plots).
The population of GABAergic neurons in cultures grown under GABAAR blockade was similar to control cultures (not shown). This is in accordance with previous results showing that the chronic blockade of GABAAR did not decrease the density of GABAergic neurons (de Lima et al., 2004 , 2007 ).
Spontaneous Activity Development of dCtx Networks
In the previous experiments, the embryonic tissue dissociated from the lateral cortex was limited to the lateral aspect of the neocortex, which, at E16, was populated by GABAergic neurons migrating upwards from the ventral telencephalic origins. Here we compared a set of vCtx cultures with sister cultures grown from more dorsal cortical tissue (dCtx cultures) (Figures 9 –11 , Table 2 ). The development of spontaneous network activity of this set of vCtx cultures was indistinguishable from the control vCtx cultures described above (Figures 1 and 2 A). In contrast to vCtx cultures, the network activity in dCtx cultures comprised regular burst firing throughout the culture period (Figure 9 A) and, similarly to experiments with chronic GABAAR blockade, intraburst oscillations emerged at an age of approximately 3 weeks in vitro (Figures 9 B and 10 ).
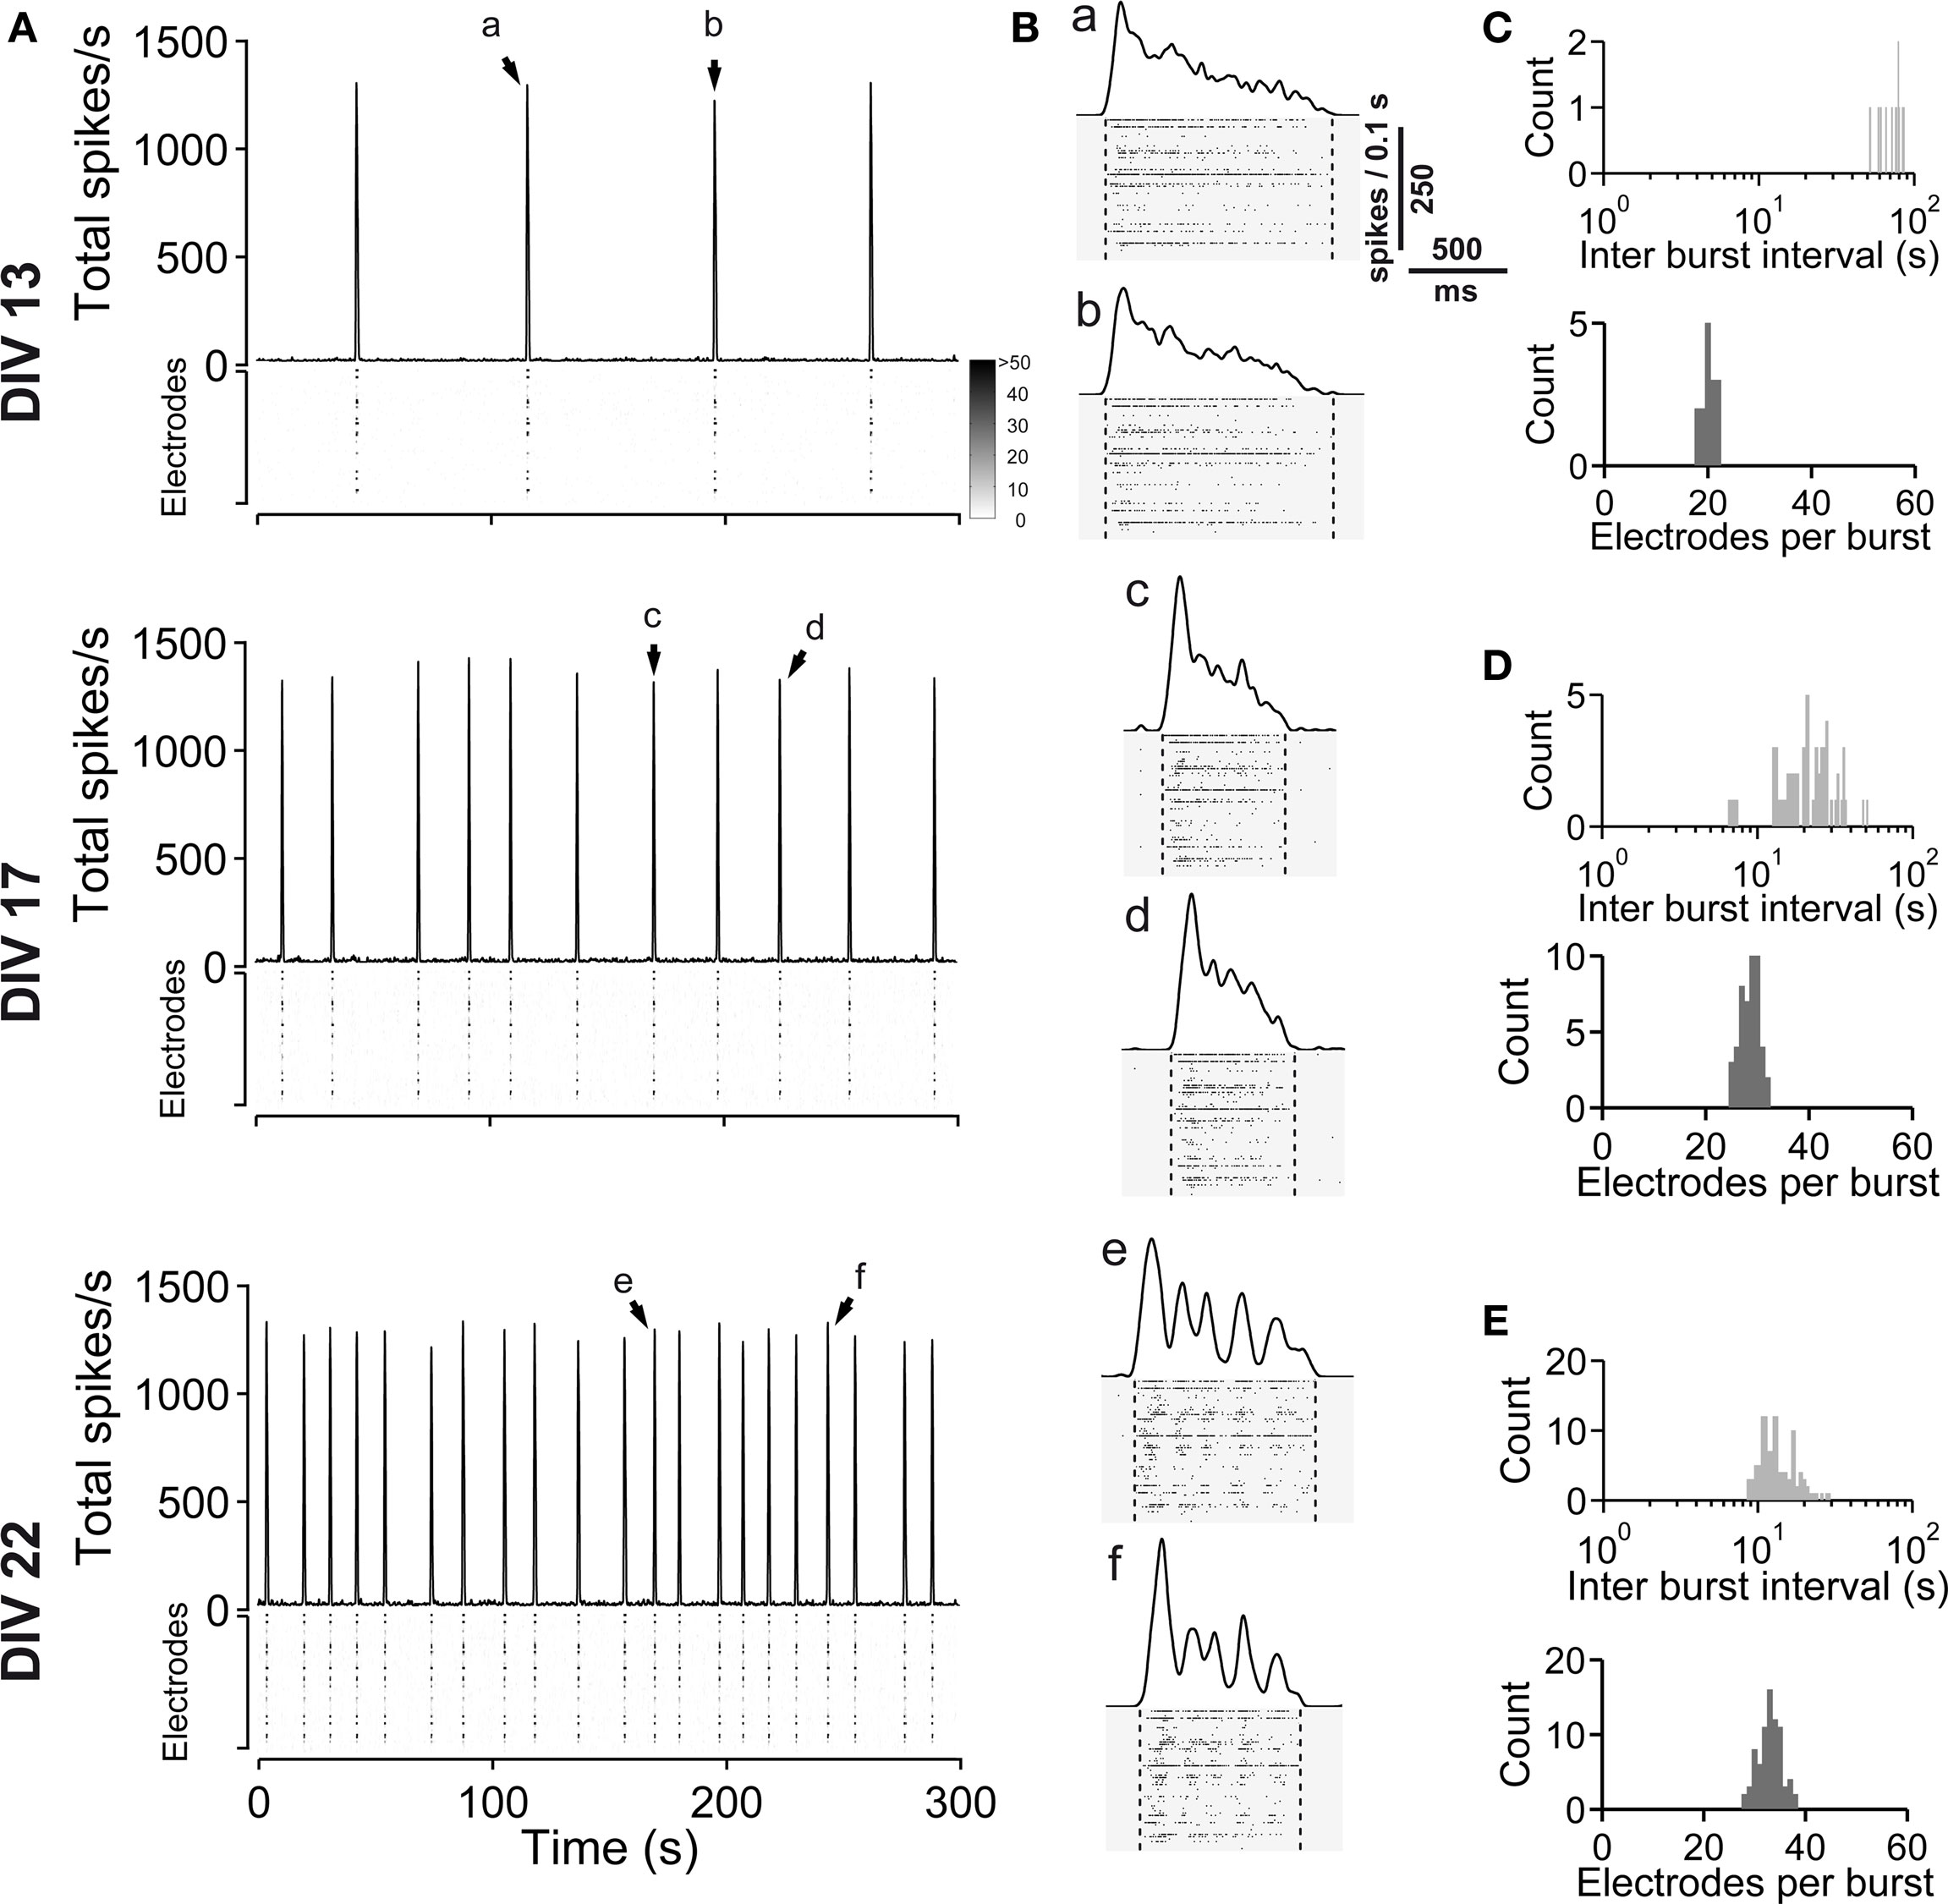
Figure 9. Spontaneous network activity development of dorsal cortex (dCtx) cultures. (A) The total spike frequency is shown over time for the same culture at different stages of development (DIV, see labeling on the left side). dCtx cultures develop a regular bursting pattern, which persists throughout their lifetime. See Figure 1 for graph description. Arrows indicate bursts which are shown in higher temporal resolution in (B). (B) Individual population bursts in higher time resolution. Oscillatory discharges emerge approximately during the third week in vitro. Lower case letters correspond to labeling in (A). Dotted lines indicate detected burst limits. Time unit for the global firing rate is 0.1 s. (C) Histograms of the interburst interval (top) and electrode attendance in bursts (bottom) for a 20-min recording session for the culture shown in (A) at 13 DIV. Note the log scale for the interburst interval histogram (bin size is 1 s). (D) Same as (C) except for 17 DIV. (E) Same as (C) except for 22 DIV.
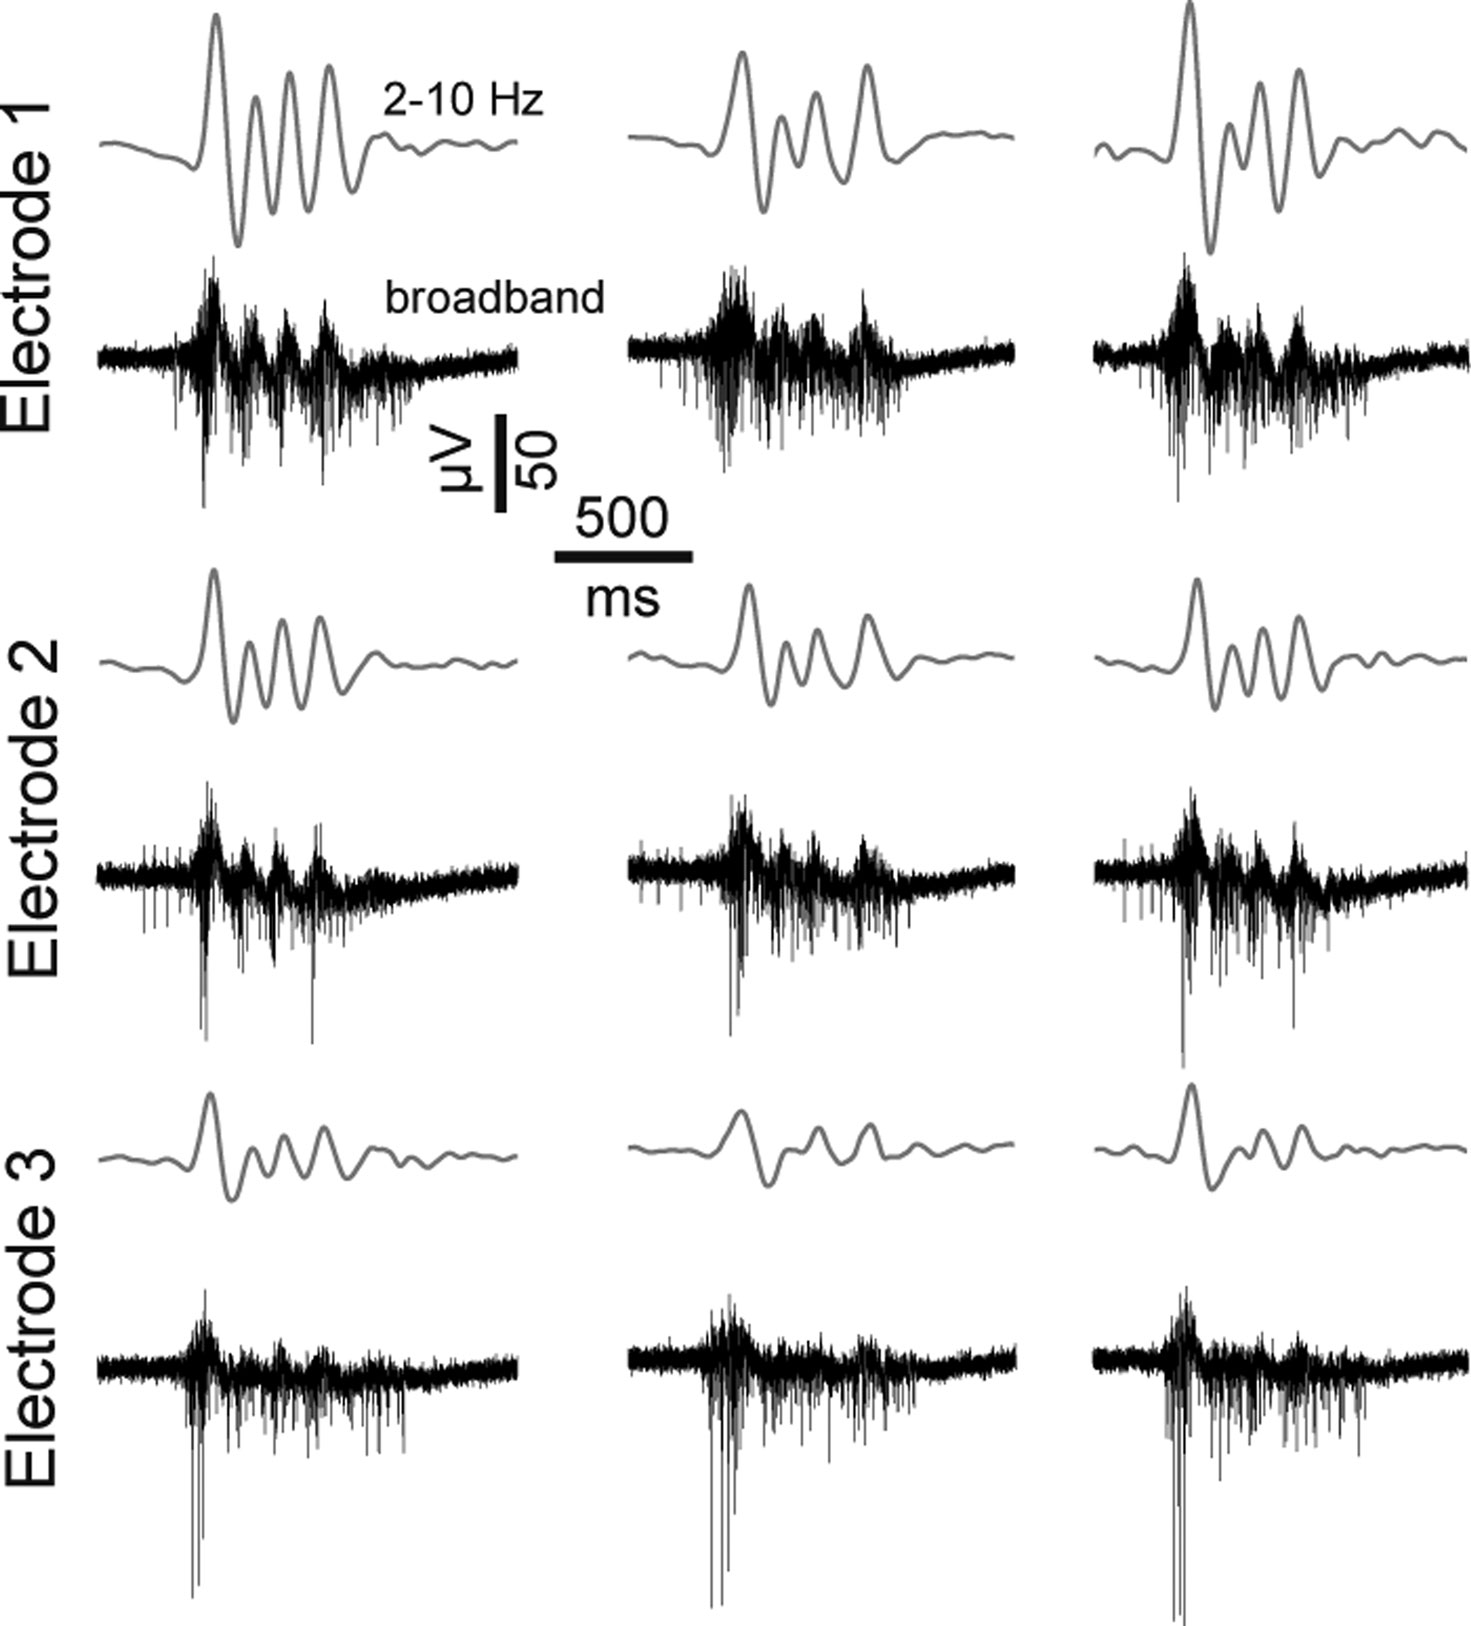
Figure 10. Features of dCtx spontaneous network activity. Extracellularly recorded signals from three burst events of a recording from a dCtx culture (21 DIV). Gray lines above each raw trace indicate the band-pass filtered signal (2–10 Hz). The same burst event is shown on three different electrodes.
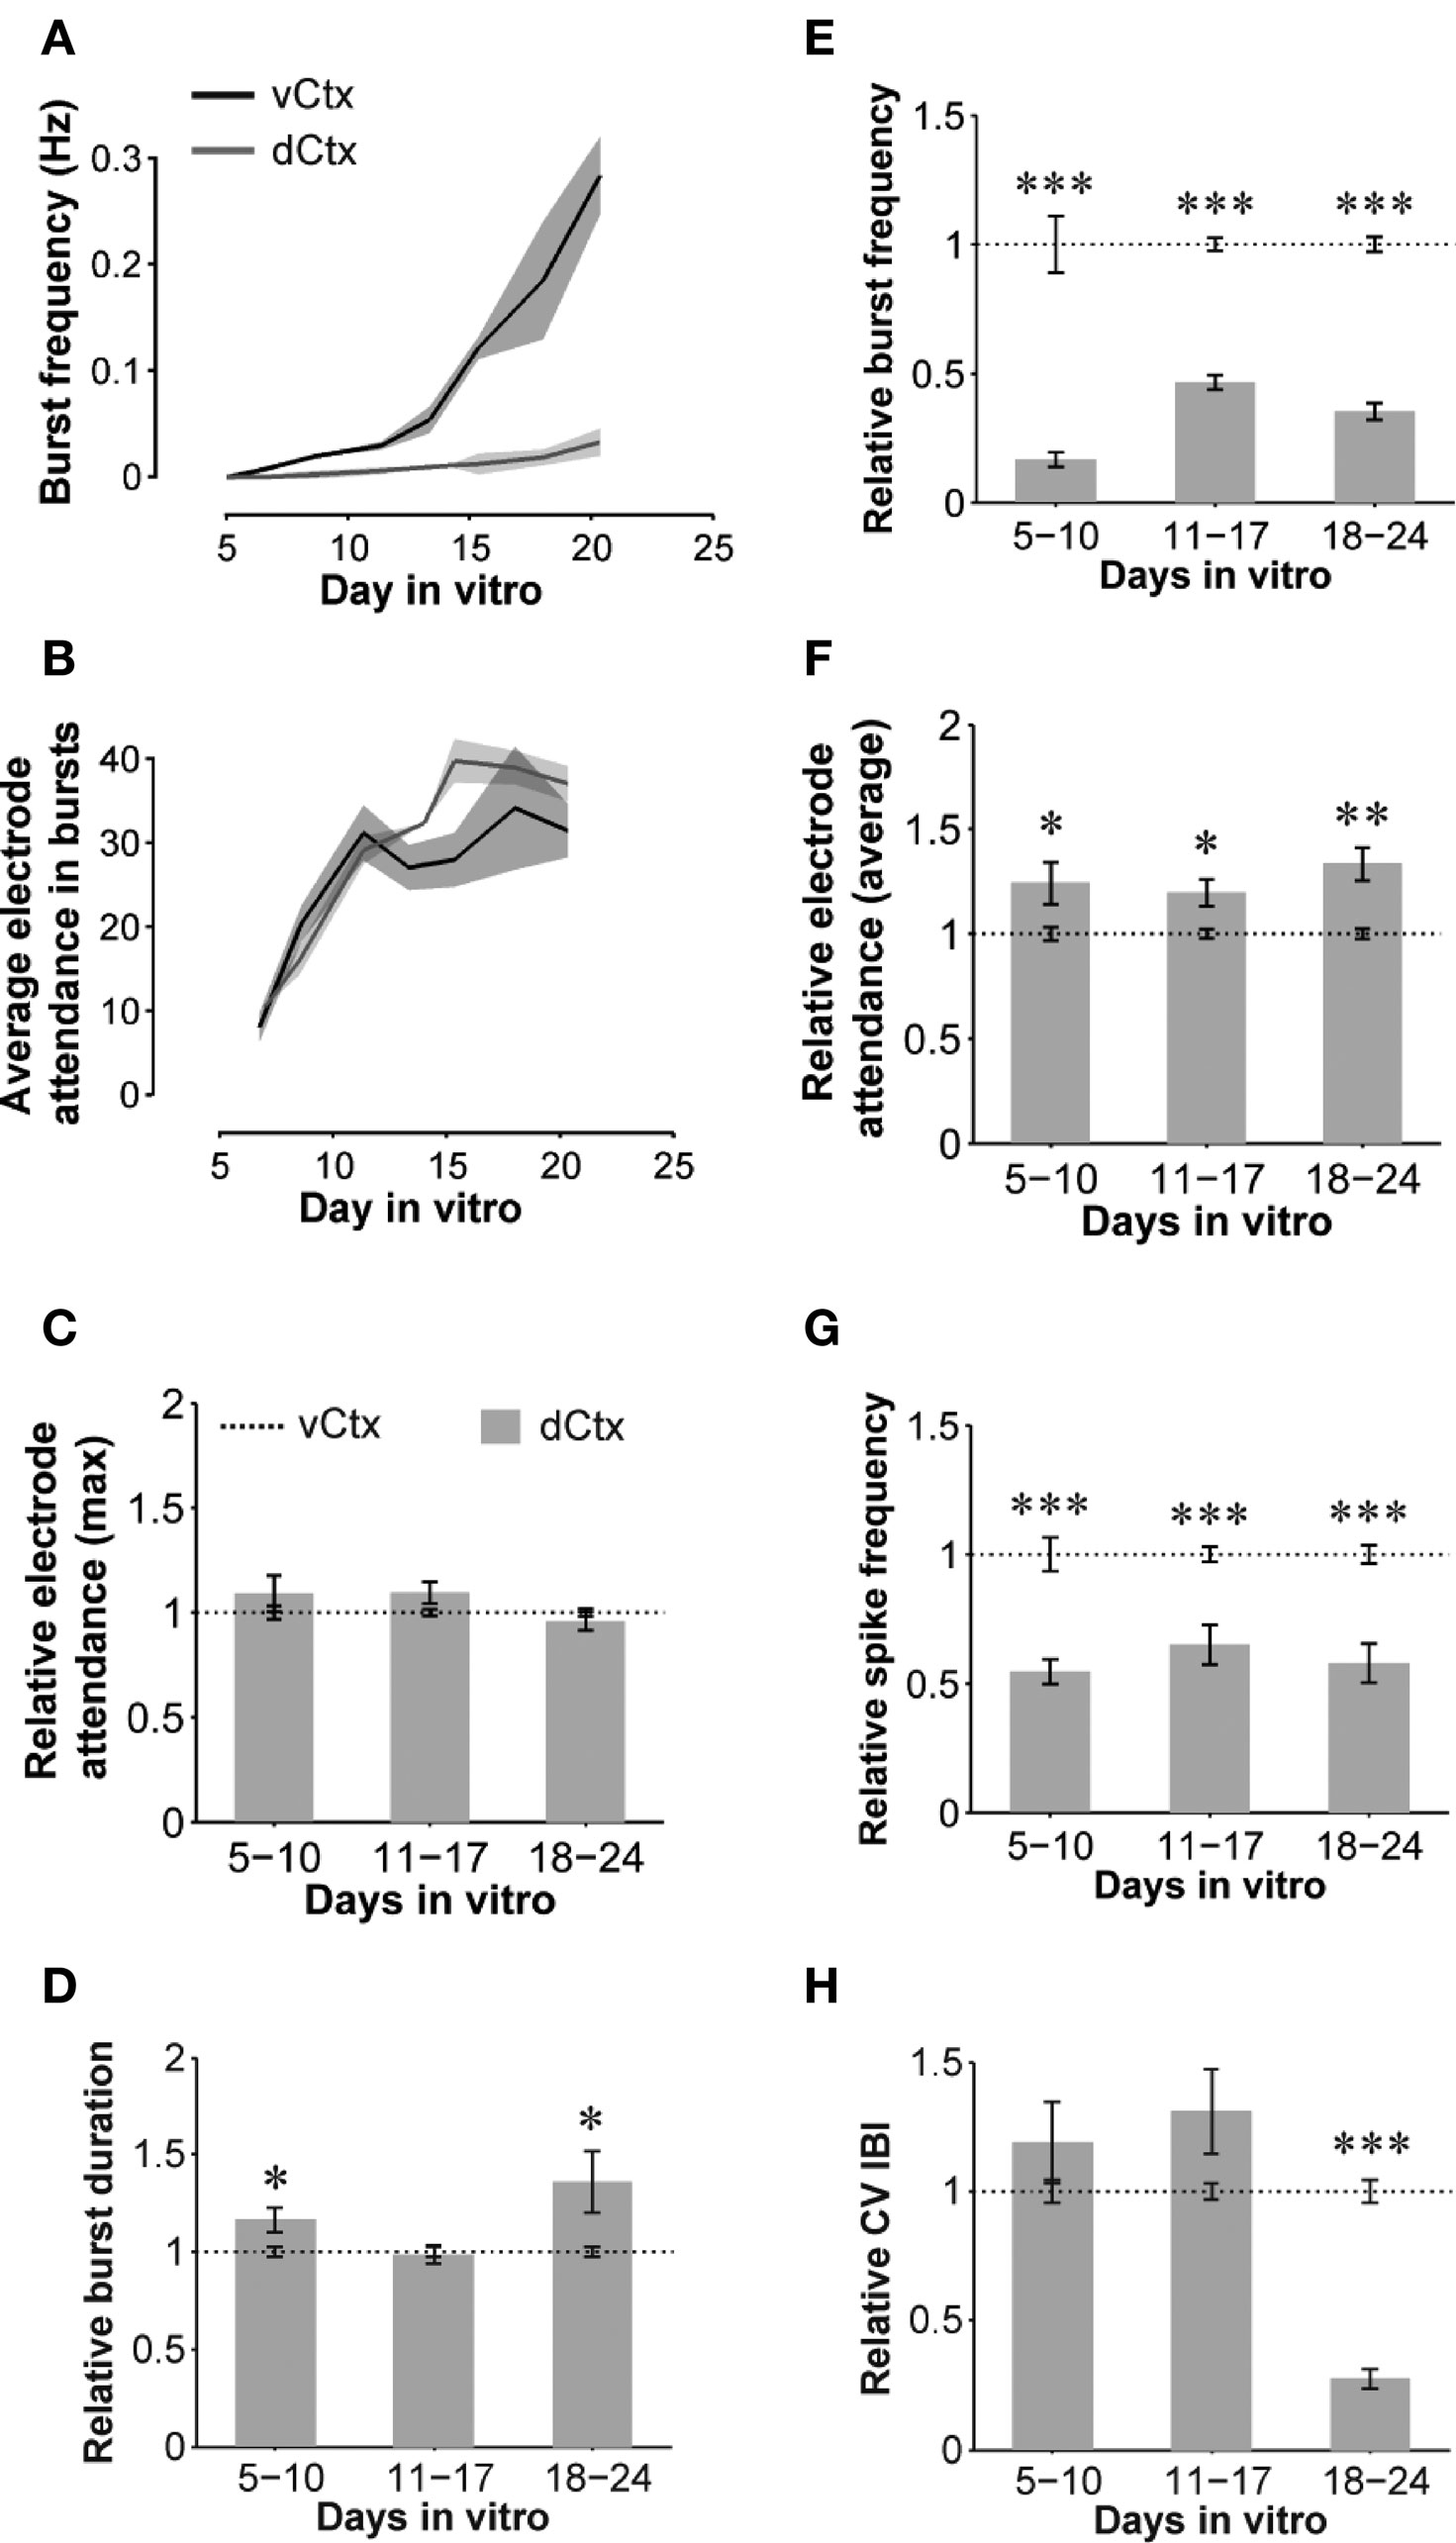
Figure 11. Quantitative features of spontaneous activity development: dCtx compared with vCtx networks. (A,B) Graphs show the development of spontaneous network activity features in control vCtx and in sister dCtx cultures from one preparation (n = 3 cultures per culture type). (A) shows the development of the burst frequency and (B) the electrode number in burst events as a function of time. (C–H) Summary graphs of parameters of spontaneous activity development of dCtx cultures pooled from different preparations normalized to values of age-matched vCtx sister cultures in each preparation. Data are obtained from 20-min recording sessions per day in vitro. Asterisks indicate significance: *p < 0.05; **p < 0.001; ***p < 0.0001; t-test; 5–10 DIV n = 36 recordings of vCtx cultures/n = 31 recordings of dCtx cultures; 11–17 DIV n = 56/n = 59; 18–24 DIV n = 44/n = 47; 12 cultures per group; five preparations.
When compared with vCtx cultures, the overall spike rate was low in dCtx networks (54.54 ± 4.80% of vCtx cultures, 5–10 DIV, p < 0.0001; 65.01 ± 7.61%, 11–17 DIV, p < 0.0001 and 57.82 ± 7.45%, 18–24 DIV, p < 0.0001) (Figure 11 G). Similarly, the burst frequency of dCtx networks was lower than in vCtx networks throughout the culturing period (p < 0.0001, 5–10 DIV; p < 0.0001, 11–17 DIV; p < 0.0001, 18–24 DIV; Figures 11 A,E). The CV IBI of dCtx cultures did not differ significantly from vCtx controls in 5–10 DIV and 11–17 DIV old cultures, but was significantly lower in 18- to 24-day-old cultures (27.18 ± 3.81% of vCtx cultures, p < 0.0001, Figure 11 H).
The histogram of electrode attendance during burst firing had a single peak (Figures 9 C–E, bottom plots), suggesting little variability in the synchronization of the burst discharges along the electrode array compared with vCtx cultures (Figures 1 C–E). The average number of electrodes with spikes during burst was higher than in vCtx cultures (Figures 11 B,F), indicating more synchronized burst firing in dCtx cultures. The average electrode attendance of dCtx cultures at 5–10 DIV was 124.32 ± 10.05% of age-matched vCtx cultures’ electrode attendance (p < 0.05, t-test, n = 36 recordings from 12 vCtx cultures, n = 31 recordings from 12 dCtx cultures, five preparations), 119.65 ± 6.42% of vCtx cultures attendance at 11–17 DIV (p < 0.05, n = 56 recordings from vCtx cultures, n = 59 recordings of dCtx cultures) and 133.39 ± 7.85% of vCtx cultures attendance at 18–24 DIV (p < 0.001, n = 44 recordings from vCtx cultures, n = 47 recordings of dCtx cultures). The maximum electrode attendance in dCtx and vCtx cultures did not differ significantly (p = 0.31, 5–10 DIV; p = 0.09, 11–17 DIV; p = 0.39, 18–24 DIV, Figure 11 C). The mean burst duration of dCtx cultures was significantly higher than in vCtx cultures at 5–10 DIV (116.55 ± 6.22% of vCtx cultures, p < 0.05) and 18–24 DIV (154.636 ± 10.626% of vCtx cultures, p < 0.05) (Figure 11 D).
The spontaneous population burst activity in 3-week-old dCtx networks was fully blocked by application of the glutamate receptor blockers CNQX (10 μM) and D(−)-AP-5 (50 μM; not shown, n = 2, one preparation). The acute blockade of GABAAR signaling in dCtx cultures with bicuculline (5 μM) had no significant effects on burst frequency (p = 0.87), total spike frequency (p = 0.67), spikes in bursts (p = 0.16), electrode attendance in burst (p = 0.41) and CV IBI (p = 0.26), but significantly increased the burst duration (p < 0.05, n = 7 cultures, 21 DIV, three preparations, t-test) (Figures 3 B–G, light gray bars).
With Fluo-3 imaging, we monitored the GABA shift in dCtx cultures. We quantified the amplitude of the transients elicited by locally applied short puffs of either a solution containing high potassium (60 mM) or muscimol (200 μM, Figure 12 ), and counted the cells showing calcium transients. Similar to what was observed in vCtx cultures (see Figure 4 ), in dCtx networks the amplitude of intracellular calcium transients decreased between 10 and 17 DIV (Figure 12 ). The fraction of cells showing a calcium transient in response to muscimol decreased from initially 94.17 ± 0.86% to 14.87 ± 1.86% (Figure 12 A). The data shows that GABA action changes in dCtx cultures, despite a reduced amount of GABAergic neurons (see below). Interestingly, the percentage of cells showing a calcium transient after muscimol application was lower than in vCtx cultures (Figures 4 E and 12 A). Whether this discrepancy is due to a homeostatic regulation due to GABA signaling differences, or due to a GABA independent mechanism, remains to be investigated.
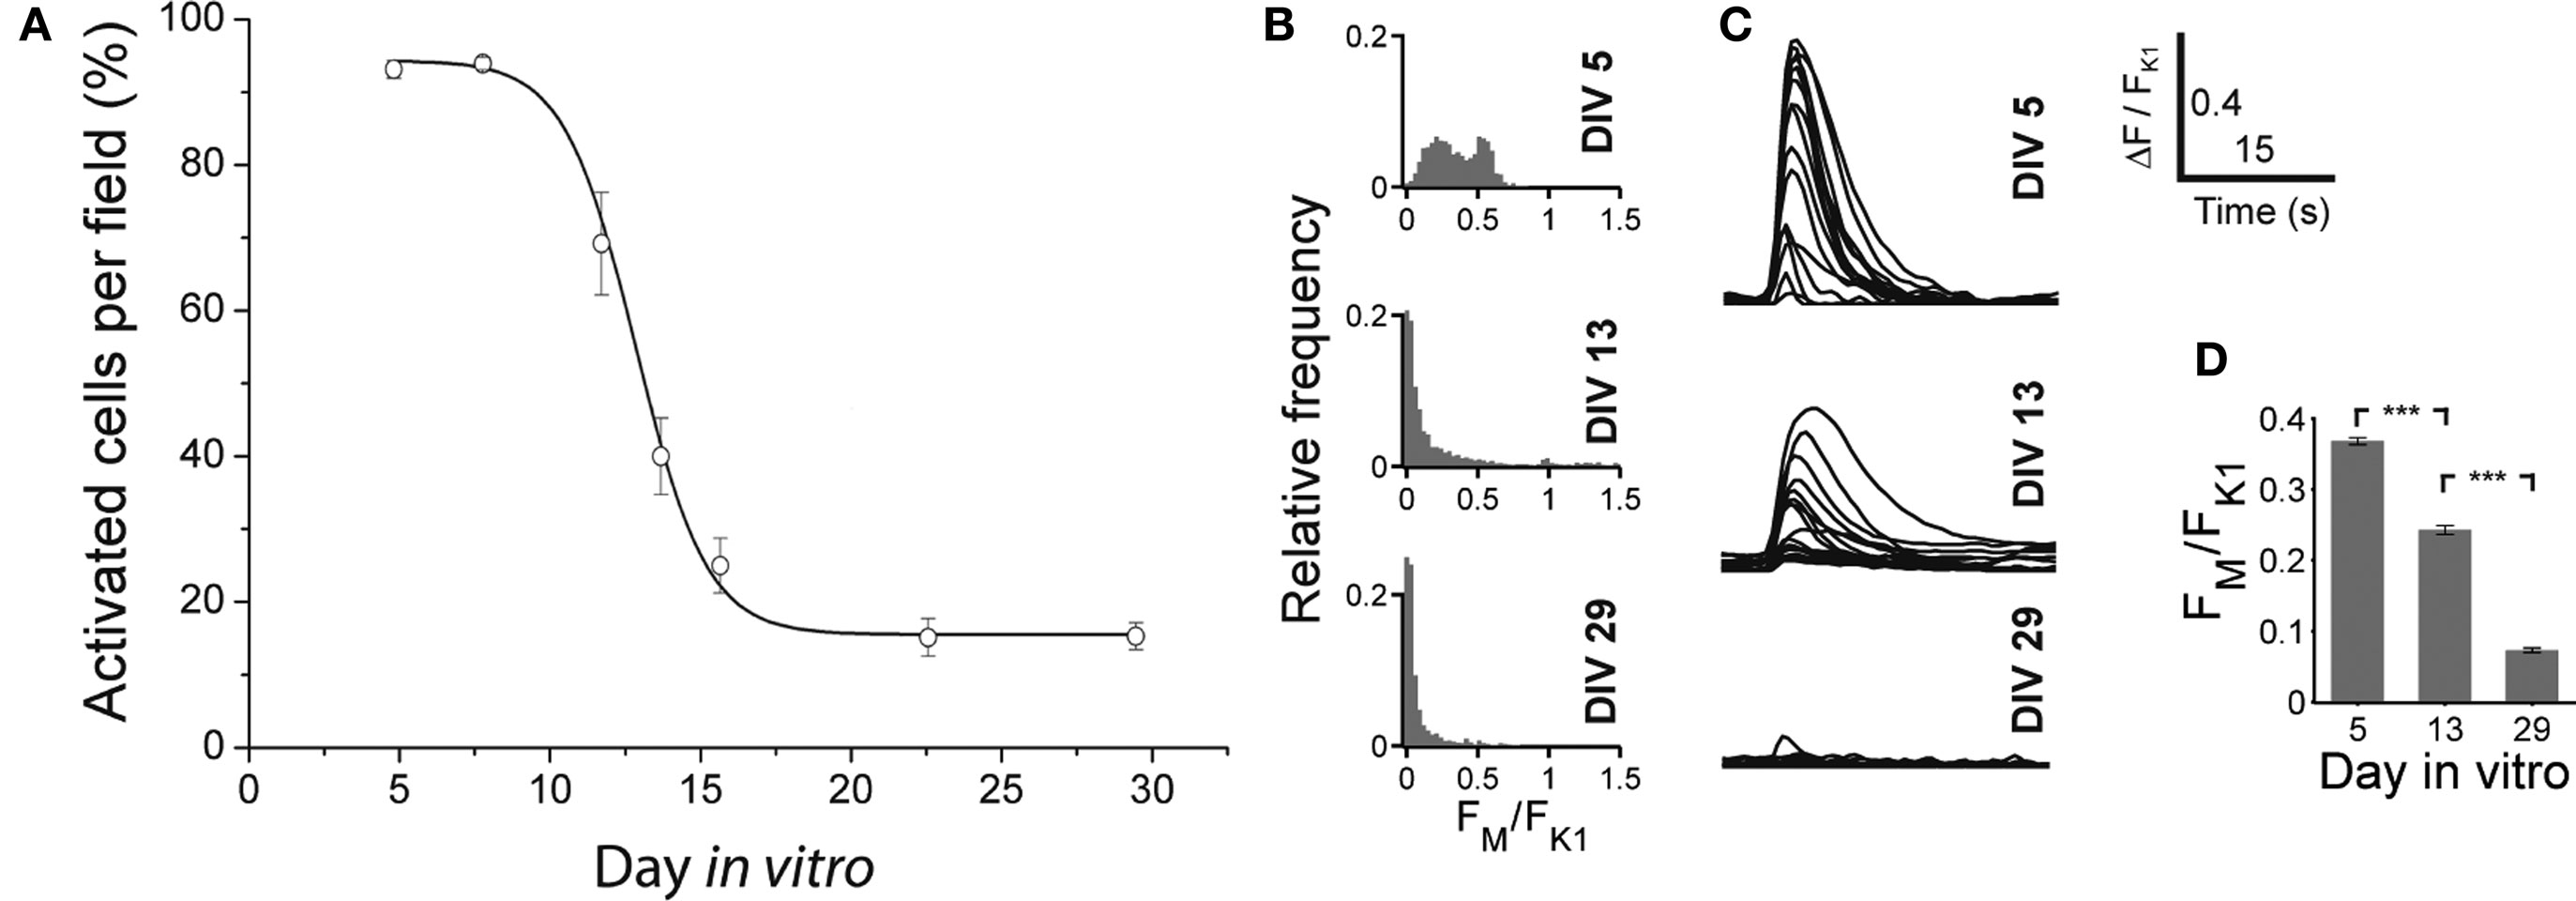
Figure 12. Developmental change of the GABAAR mediated calcium response in dCtx cultures. (A) Graph shows the fraction of neurons in dCtx cultures with a significant increase of fluorescence in response to muscimol, as a function of time. Each dot represents the average of several recorded fields (>15), pooled from three cultures from three preparations per time point. Solid line is a Boltzmann fitted sigmoid (see also Figure 4 for a more detailed description of the experimental configuration). (B) Histograms of the ratio FM and FK1 at the indicated days in vitro. (C) Example traces of muscimol elicited calcium fluorescence at the indicated ages. (D) Average ratio of the evoked calcium responses FM and FK1 at DIV 5, DIV 13 and DIV 29 (n = 1297, 2142 and 1613 cells, respectively; each from three independent preparations; asterisks indicate significance, p < 0.0001; t-test).
The immunocytochemical analysis showed that in 1-day-old dCtx cultures, no more than 0.04 ± 0.02% of the neurons were GABAergic (six cultures, three preparations). At 21–22 DIV, 1.79 ± 0.49% of the cells were GABAergic (seven cultures; three preparations). The vast majority of these GABAergic neurons had a very small soma size, a fusiform or bipolar morphology, and were not parvalbumin immunoreactive. The soma size distribution of GABAergic neurons was unimodal (21–22 DIV, Figures 6 B,E). On average 91.61 ± 2.97% (496 of 548 analyzed cells) of GABAergic neurons had a soma area below 100 μm2 and only 8.39% (52 cells) had a soma area above 100 μm2. The developmental increase of the smaller GABAergic neurons’ fraction concurs with the finding that GABAergic precursors are mitotically active in culture (de Lima and Voigt, 1997 , 1999 ).
Besides counting GABAergic somata, we compared the staining intensity of the GABAergic neuropil of dCtx and vCtx cultures. We determined the average staining intensity for each culture type (i.e., the attenuation of the light intensity due to stained regions) and normalized to the average values of dCtx cultures. We found that the GABA staining of vCtx cultures was on average 8.05 ± 0.73 times stronger than that of dCtx cultures (19–22 DIV, p < 0.0001, t-test; n = 55 and 58 fields of dCtx and vCtx cultures, respectively).
Discussion
Patterns of Network Activity
In all cultured networks recurrent network bursting started approximately at the end of the first week in vitro, continued throughout the culturing period and was absent in the presence of AMPA and NMDA glutamatergic receptor blockers. This is in line with previous observations on similar E16-donor cultures (Voigt et al., 2001 , 2005 ; Opitz et al., 2002 ) or cultures grown from older cortices (Maeda et al., 1995 ; Kamioka et al., 1996 ; Marom and Shahaf, 2002 ; Chiappalone et al., 2006 ; Wagenaar et al., 2006a ,b ; Shahaf et al., 2008 ). Early large scale bursts characteristically have IBIs up to minutes and reach maximal neuronal attendance during the second week in vitro. These large scale network bursts resemble the immature bursting activity in slices of the neonatal rodent cortex, called ‘cortical early network oscillations’ (cENOs) (Garaschuk et al., 2000 ), recorded by calcium imaging or patch clamp in acute or cultured slices of the cerebral cortex (Garaschuk et al., 2000 ; Corlew et al., 2004 ; McCabe et al., 2006 ; Allene et al., 2008 ; Sheroziya et al., 2009 ).
Population bursts with lower neuronal attendance and hence with decreased overall spiking appeared in culture several days after the appearance of the first large transients, and were unique to mature vCtx cultures (∼3-week-old). This kind of activity was blocked by acute application of GABAAR antagonists and was absent in cultures lacking large interneurons or in cultures chronically blocked by GABAAR antagonists. Notably, also in acute neocortical slices network events with small amplitudes and less participating neurons, cGDPs, develop later than the early network oscillations (cENOs) and were compared to the GDPs described in the hippocampus (Allene et al., 2008 ).
Characteristic of mature dCtx cultures and GABAAR-blocked vCtx cultures was a regular burst pattern with widespread burst synchrony (Figures 7 and 9 ) and intraburst oscillatory discharges (see Figures 2 B and 10 ). These bursts are mediated by ionotropic glutamatergic receptors activity and are reminiscent of intraburst oscillatory activity in spinal cord slices or disinhibited spinal cord cultures (Streit, 1993 ; Bracci et al., 1996 ; Yvon et al., 2007 ), picrotoxin induced afterdischarges in hippocampal slices (Miles et al., 1984 ) or endogenous spindle-burst activity in developing neocortex in vivo (Minlebaev et al., 2007 , 2009 ). In the neonatal barrel cortex, GABAergic synapses contribute minimally to the pace of the ubiquitous spindle-bursts activity (Minlebaev et al., 2007 ). Yvon et al. (2007) suggested that this kind of intraburst oscillation might be generated by the depolarization-induced modulation of inactivation dynamics of Na+ channels. This is in line with the observation that during oscillatory discharges the spike amplitudes progressively decrease during each intraburst episode and partially recovers until the next episode (Figures 2 B and 10 ).
Temporal Clustering of Network Activity in Lateral Cortex Cultures
In all vCtx cultures older than 17–20 DIV a gradual but predictable change in the network activity was observed, consisting of alternating periods of higher and lower burst incidence. Periods characterized by high burst incidence were observed in long-term E18 cortical cultures by Wagenaar et al. (2006a ), who termed such events ‘superbursts’, and in mega-slice co-cultures by Baker et al. (2006) who called them ‘network bursts’. The appearance of organized clustering of bursting activity in cultured cortical networks, however, hardly followed a predictable growing condition (Wagenaar et al., 2006a ).
Burst clustering in E16 cultures of the neocortex reliably develops in the presence of large GABAergic neurons and functional GABAAR mediated synaptic transmission. This activity pattern radically differed from network activity of vCtx cultures under chronic or acute pharmacological blockade of the GABAARs or from cultures lacking large GABAergic cells. In these cultures, bursting was stereotyped with little IBI variation. Therefore, GABAergic signaling provided by the large GABAergic neurons, either alone or together with other GABAergic neurons, promotes temporally clustered network activity.
Timing of Network Activity Differentiation
In cultured networks, the differentiation of early network activity, i.e., the increase of bursting frequency has been correlated with the increase of synaptogenesis and the functional maturation of synapses (Muramoto et al., 1993 ; Voigt et al., 2005 ). In slices and slice cultures, the regression of calcium transients with high attendance (Corlew et al., 2004 ), the disappearance of large scale calcium transients (Garaschuk et al., 2000 ), and the sequential development of more localized activity (Allene et al., 2008 ) have been described. The GABA shift, which occurs temporally correlated with these changes (Garaschuk et al., 2000 ), was proposed as the mechanism triggering spontaneous activity maturation.
The decrease in the number of neurons showing intracellular calcium transients upon GABAAR activation with muscimol (Figures 4 and 12 ) reflects the time course of the GABA shift (Lin et al., 1994 ; LoTurco et al., 1995 ; Chen et al., 1996 ; Owens et al., 1996 ; Garaschuk et al., 2000 ; Ganguly et al., 2001 ), which is typical for the early postnatal development of cortical and hippocampal networks (Ben-Ari et al., 2007 ; Blaesse et al., 2009 ). Our results show that both the decrease in large-scale synchronicity and the appearance of clustered burst activity with age were temporally correlated with the GABA shift. Accordingly, we asked if in cultures the maturation of network activity patterns might depend on the development of the GABA action.
The developmental change of the mode of GABA action is mediated by a decreased expression of the sodium-potassium-chloride cotransporter NKCC1, which accumulates chloride in young neurons, and an increased expression of the potassium chloride cotransporter KCC2, which extrudes chloride from mature neurons (Ben-Ari et al., 2007 ; Blaesse et al., 2009 ). Bumetanide, at doses that selectively block the chloride-importing by NKCC1, results in a hyperpolarization shift of the GABAAR reversal potential (Dzhala et al., 2005 , 2008 ; Sipila et al., 2006 ; Balena and Woodin, 2008 ; Zhu et al., 2008 ). The blockade of the NKCC1 function in young vCtx cultures induced a premature attenuation of burst regularity, including the appearance of less synchronized events (Figures 5 B,E). Taken together, these data suggest that the depolarizing to hyperpolarizing shift of GABA contributes significantly in shaping the early synchronized activity of neocortical networks in vitro.
GABAA Signaling and GABA Shift
Previous studies provide conflicting evidence as to the role of GABAA signaling in the causation of the GABA shift (for a review see: Ben-Ari et al., 2007 ). In the model put forward by Ganguly et al. (2001) , GABAA signaling acts as a self-limiting trophic factor during hippocampus development, causing its own shift from depolarizing to hyperpolarizing. According to this model, GABAA depolarization increases KCC2 expression, which then diminishes the intracellular chloride concentration. Although the general idea of the shift being modulated by depolarizing activity has been confirmed (Sernagor et al., 2003 ; Leitch et al., 2005 ), the concept that KCC2 expression and the GABA shift specifically depend on GABA signaling and GABAA mediated depolarization remains controversial (Ludwig et al., 2003 ; Titz et al., 2003 ; Wojcik et al., 2006 ; Sipila et al., 2009 ).
In the present study the dCtx networks show rare GABAergic neurons and GABAA signaling had only minor effects on the network activity. According to the Ganguly model, a GABA shift should be impaired or delayed in the absence of GABAergic neurons, as in dCtx networks. Contrary to this prediction, a shift of GABAergic action occurs in both vCtx and dCtx networks, independently of the GABAergic neuronal content. This is in line with previous results in hippocampal and midbrain cultures showing that a GABA shift and the up-regulation of KCC2 expression can take place in the complete absence of GABAAR signaling (Ludwig et al., 2003 ; Titz et al., 2003 ; Wojcik et al., 2006 ), or of depolarizing GABA signaling (Sipila et al., 2009 ).
Contribution of GABAergic Neurons to Network Activity Patterns
The activity dynamics of mature vCtx cultures with a well developed network of large GABAergic neurons remarkably differed from that of dCtx cultures with deficient GABAergic innervation. The presence of GABA interneurons with long-range connection seems necessary for the development of less synchronized and temporally clustered network activity pattern. With an exceptionally high density of synapses onto their dendrites and a widespread axonal arborization, large GABAergic neurons can effectively integrate inputs from presynaptic cells and propagate their output to close-by and distant neurons simultaneously (Voigt et al., 2001 ).
At this point it is not entirely clear if the small fraction of bipolar/bitufted GABAergic neurons contribute to the network activity development in vCtx or dCtx cultures. In dCtx cultures, small GABAergic neurons are present in very low density and fail to build a continuous network. dCtx networks thus represent a prototype of an immature network with predominantly glutamatergic circuitry that becomes spontaneously active with a local deficiency in GABAergic neurons from the ventral telencephalic lineage. Besides providing information about the role of GABAergic signaling to the development of network activity, these networks might be used to interrogate how the earlier development of the more lateral regions influences the development of dorsal regions. Lischalk et al. (2009) showed that temporal areas of the cortex may function as pacemakers for the early network transients, which then propagate to the rest of the cortex. Because GABAergic neurons invade the cortex from ventral to dorsal (Marin and Rubenstein, 2001 ), it is feasible to assume that these neurons differentiate faster in more lateral parts of the cortex, e.g., the temporal cortex. Given that vCtx cultures develop a faster pace of recurrent burst activity than age-matched dCtx cultures, more lateral cortical regions could prematurely drive the more dorsal cortex. If vCtx and dCtx cultures are grown in separate compartments, they connect to each other (see Voigt et al., 2005 ), and dCtx cultures show similar patterns of activity as vCtx cultures (de Lima and Voigt, unpublished results). Also in a local cortical network, this type of early functional interaction might be relevant for the development of, for example, layers of neurons with different GABAergic populations.
The development of spontaneous activity in cultures obtained from the embryonic cortex consistently varies in correlation with the content of GABAergic neurons. Although differences between the developing vCtx and dCtx cultures might not be limited to the GABAergic system (Bellion et al., 2003 ), our data suggest that the early GABAergic system sculptures early network activity dynamics, predictably influencing the microstructure and regularity of burst firing.
Conflict of Interest Statement
The authors declare that the research was conducted in the absence of any commercial or financial relationships that could be construed as a potential conflict of interest.
Acknowledgments
The authors thank Ms. B. Adam and Ms. A. Ritter for expert technical assistance. This work was supported by the Bundesministerium für Bildung und Forschung (grant BMBF/BNCN 016Q0702) and the Land Sachsen Anhalt (grant LSA 3431A/0302M).
References
Allene, C., Cattani, A., Ackman, J. B., Bonifazi, P., Aniksztejn, L., Ben-Ari, Y., and Cossart, R. (2008). Sequential generation of two distinct synapse-driven network patterns in developing neocortex. J. Neurosci. 28, 12851–12863.
Angenstein, F., Niessen, H. G., Goldschmidt, J., Vielhaber, S., Ludolph, A. C., and Scheich, H. (2004). Age dependent changes in MRI of motor brain stem nuclei in a mouse model of ALS. Neuroreport 15, 2271–2274.
Baker, R. E., Corner, M. A., and van Pelt, J. (2006). Spontaneous neuronal discharge patterns in developing organotypic mega-co-cultures of neonatal rat cerebral cortex. Brain Res. 1101, 29–35.
Bakkum, D. J., Chao, Z. C., and Potter, S. M. (2008). Spatio-temporal electrical stimuli shape behavior of an embodied cortical network in a goal-directed learning task. J. Neural Eng. 5, 310–323.
Balena, T., and Woodin, M. A. (2008). Coincident pre- and postsynaptic activity downregulates NKCC1 to hyperpolarize E(Cl) during development. Eur. J. Neurosci. 27, 2402–2412.
Barbe, M. F., and Levitt, P. (1991). The early commitment of fetal neurons to the limbic cortex. J. Neurosci. 11, 519–533.
Baruchi, I., Volman, V., Raichman, N., Shein, M., and Ben-Jacob, E. (2008). The emergence and properties of mutual synchronization in in vitro coupled cortical networks. Eur. J. Neurosci. 28, 1825–1835.
Batista-Brito, R., and Fishell, G. (2009). The developmental integration of cortical interneurons into a functional network. Curr. Top. Dev. Biol. 87, 81–118.
Bellion, A., and Metin, C. (2005). Early regionalisation of the neocortex and the medial ganglionic eminence. Brain Res. Bull. 66, 402–409.
Bellion, A., Wassef, M., and Metin, C. (2003). Early differences in axonal outgrowth, cell migration and GABAergic differentiation properties between the dorsal and lateral cortex. Cereb. Cortex 13, 203–214.
Ben-Ari, Y. (2002). Excitatory actions of gaba during development: the nature of the nurture. Nat. Rev. Neurosci. 3, 728–739.
Ben-Ari, Y., Gaiarsa, J. L., Tyzio, R., and Khazipov, R. (2007). GABA: a pioneer transmitter that excites immature neurons and generates primitive oscillations. Physiol. Rev. 87, 1215–1284.
Blaesse, P., Airaksinen, M. S., Rivera, C., and Kaila, K. (2009). Cation-chloride cotransporters and neuronal function. Neuron 61, 820–838.
Blankenship, A. G., and Feller, M. B. (2010). Mechanisms underlying spontaneous patterned activity in developing neural circuits. Nat. Rev. Neurosci. 11, 18–29.
Bracci, E., Ballerini, L., and Nistri, A. (1996). Spontaneous rhythmic bursts induced by pharmacological block of inhibition in lumbar motoneurons of the neonatal rat spinal cord. J. Neurophysiol. 75, 640–647.
Butt, S. J., Fuccillo, M., Nery, S., Noctor, S., Kriegstein, A., Corbin, J. G., and Fishell, G. (2005). The temporal and spatial origins of cortical interneurons predict their physiological subtype. Neuron 48, 591–604.
Campbell, K. (2003). Dorsal–ventral patterning in the mammalian telencephalon. Curr. Opin. Neurobiol. 13, 50–56.
Chagnac-Amitai, Y., and Connors, B. W. (1989). Horizontal spread of synchronized activity in neocortex and its control by GABA-mediated inhibition. J. Neurophysiol. 61, 747–758.
Chao, Z. C., Bakkum, D. J., and Potter, S. M. (2008). Shaping embodied neural networks for adaptive goal-directed behavior. PLoS Comput. Biol. 4, e1000042. doi: 10.1371/journal.pcbi.1000042.
Chen, G., Trombley, P. Q., and van den Pol, A. N. (1996). Excitatory actions of GABA in developing rat hypothalamic neurones. J. Physiol. (Lond.) 494, 451–464.
Chiappalone, M., Bove, M., Vato, A., Tedesco, M., and Martinoia, S. (2006). Dissociated cortical networks show spontaneously correlated activity patterns during in vitro development. Brain Res. 1093, 41–53.
Chiu, C., and Weliky, M. (2001). Spontaneous activity in developing ferret visual cortex in vivo. J. Neurosci. 21, 8906–8914.
Corlew, R., Bosma, M. M., and Moody, W. J. (2004). Spontaneous, synchronous electrical activity in neonatal mouse cortical neurones. J. Physiol. 560, 377–390.
Cossart, R., Ikegaya, Y., and Yuste, R. (2005). Calcium imaging of cortical networks dynamics. Cell Calcium 37, 451–457.
de Lima, A. D., Gieseler, A., and Voigt, T. (2009). Relationship between GABAergic interneurons migration and early neocortical network activity. Dev Neurobiol 69, 105–123.
de Lima, A. D., Lima, B. D., and Voigt, T. (2007). Earliest spontaneous activity differentially regulates neocortical GABAergic interneuron subpopulations. Eur. J. Neurosci. 25, 1–16.
de Lima, A. D., Opitz, T., and Voigt, T. (2004). Irreversible loss of a subpopulation of cortical interneurons in the absence of glutamatergic network activity. Eur. J. Neurosci. 19, 2931–2943.
de Lima, A. D., and Voigt, T. (1997). Identification of two distinct populations of GABAergic neurons in cultures of the rat cerebral cortex. J. Comp. Neurol. 388, 526–541.
de Lima, A. D., and Voigt, T. (1999). Astroglia inhibit the proliferation of neocortical cells and prevent the generation of small GABAergic neurons in vitro. Eur. J. Neurosci. 11, 3845–3856.
Dzhala, V. I., Brumback, A. C., and Staley, K. J. (2008). Bumetanide enhances phenobarbital efficacy in a neonatal seizure model. Ann. Neurol. 63, 222–235.
Dzhala, V. I., Talos, D. M., Sdrulla, D. A., Brumback, A. C., Mathews, G. C., Benke, T. A., Delpire, E., Jensen, F. E., and Staley, K. J. (2005). NKCC1 transporter facilitates seizures in the developing brain. Nat. Med. 11, 1205–1213.
Eytan, D., and Marom, S. (2006). Dynamics and effective topology underlying synchronization in networks of cortical neurons. J. Neurosci. 26, 8465–8476.
Feinerman, O., Segal, M., and Moses, E. (2007). Identification and dynamics of spontaneous burst initiation zones in unidimensional neuronal cultures. J. Neurophysiol. 97, 2937–2948.
Ferri, R. T., and Levitt, P. (1995). Regulation of regional differences in the differentiation of cerebral cortical neurons by EGF family-matrix interactions. Development 121, 1151–1160.
Ganguly, K., Schinder, A. F., Wong, S. T., and Poo, M. (2001). GABA itself promotes the developmental switch of neuronal GABAergic responses from excitation to inhibition. Cell 105, 521–532.
Garaschuk, O., Linn, J., Eilers, J., and Konnerth, A. (2000). Large-scale oscillatory calcium waves in the immature cortex. Nat. Neurosci. 3, 452–459.
Giugliano, M., Darbon, P., Arsiero, M., Luscher, H. R., and Streit, J. (2004). Single-neuron discharge properties and network activity in dissociated cultures of neocortex. J. Neurophysiol. 92, 977–996.
Gonzalez-Burgos, G., and Lewis, D. A. (2008). GABA neurons and the mechanisms of network oscillations: implications for understanding cortical dysfunction in schizophrenia. Schizophr. Bull. 34, 944–961.
Kamioka, H., Maeda, E., Jimbo, Y., Robinson, H. P. C., and Kawana, A. (1996). Spontaneous periodic synchronized bursting during formation of mature patterns of connections in cortical cultures. Neurosci. Lett. 206, 109–112.
Le, F. J., Rutten, W. L., Stegenga, J., Wolters, P. S., Ramakers, G. J., and van, P. J. (2007). Conditional firing probabilities in cultured neuronal networks: a stable underlying structure in widely varying spontaneous activity patterns. J. Neural Eng. 4, 54–67.
Leitch, E., Coaker, J., Young, C., Mehta, V., and Sernagor, E. (2005). GABA type-A activity controls its own developmental polarity switch in the maturing retina. J. Neurosci. 25, 4801–4805.
Letinic, K., Zoncu, R., and Rakic, P. (2002). Origin of GABAergic neurons in the human neocortex. Nature 417, 645–649.
Lewis, D. A., Hashimoto, T., and Volk, D. W. (2005). Cortical inhibitory neurons and schizophrenia. Nat. Rev. Neurosci. 6, 312–324.
Lin, M. H., Takahashi, M. P., Takahashi, Y., and Tsumoto, T. (1994). Intracellular calcium increase induced by GABA in visual cortex of fetal and neonatal rats and its disappearance with development. Neurosci. Res. 20, 85–94.
Lischalk, J. W., Easton, C. R., and Moody, W. J. (2009). Bilaterally propagating waves of spontaneous activity arising from discrete pacemakers in the neonatal mouse cerebral cortex. Dev Neurobiol 69, 407–414.
LoTurco, J. J., Owens, D. F., Heath, M. J. S., Davis, M. B. E., and Kriegstein, A. R. (1995). GABA and glutamate depolarize cortical progenitor cells and inhibit DNA synthesis. Neuron 15, 1287–1298.
Ludwig, A., Li, H., Saarma, M., Kaila, K., and Rivera, C. (2003). Developmental up-regulation of KCC2 in the absence of GABAergic and glutamatergic transmission. Eur. J. Neurosci. 18, 3199–3206.
Maeda, E., Robinson, H. P. C., and Kawana, A. (1995). The mechanisms of generation and propagation of synchronized bursting in developing networks of cortical neurons. J. Neurosci. 15, 6834–6845.
Marder, E., and Goaillard, J. M. (2006). Variability, compensation and homeostasis in neuron and network function. Nat. Rev. Neurosci. 7, 563–574.
Marin, O., and Rubenstein, J. L. (2001). A long, remarkable journey: tangential migration in the telencephalon. Nat. Rev. Neurosci. 2, 780–790.
Marom, S., and Shahaf, G. (2002). Development, learning and memory in large random networks of cortical neurons: lessons beyond anatomy. Q. Rev. Biophys. 35, 63–87.
McCabe, A. K., Chisholm, S. L., Picken-Bahrey, H. L., and Moody, W. J. (2006). The self-regulating nature of spontaneous synchronized activity in developing mouse cortical neurones. J. Physiol. 577, 155–167.
Miles, R., Wong, R. K., and Traub, R. D. (1984). Synchronized afterdischarges in the hippocampus: contribution of local synaptic interactions. Neuroscience 12, 1179–1189.
Minlebaev, M., Ben-Ari, Y., and Khazipov, R. (2007). Network mechanisms of spindle-burst oscillations in the neonatal rat barrel cortex in vivo. J. Neurophysiol. 97, 692–700.
Minlebaev, M., Ben-Ari, Y., and Khazipov, R. (2009). NMDA receptors pattern early activity in the developing barrel cortex in vivo. Cereb. Cortex 19, 688–696.
Moody, W. J., and Bosma, M. M. (2005). Ion channel development, spontaneous activity, and activity-dependent development in nerve and muscle cells. Physiol. Rev. 85, 883–941.
Muramoto, K., Ichikawa, M., Kawahara, M., Kobayashi, K., and Kuroda, Y. (1993). Frequency of synchronous oscillations of neuronal activity increases during development and is correlated to the number of synapses in cultured cortical neuron networks. Neurosci. Lett. 163, 163–165.
O’Donovan, M. J. (1999). The origin of spontaneous activity in developing networks of the vertebrate nervous system. Curr. Opin. Neurobiol. 9, 94–104.
Opitz, T., de Lima, A. D., and Voigt, T. (2002). Spontaneous development of synchronous oscillatory activity during maturation of cortical networks in vitro. J. Neurophysiol. 88, 2196–2206.
Owens, D. F., Boyce, L. H., Davis, M. B. E., and Kriegstein, A. R. (1996). Excitatory GABA responses in embryonic and neonatal cortical slices demonstrated by gramicidin perforated-patch recordings and calcium imaging. J. Neurosci. 16, 6414–6423.
Owens, D. F., and Kriegstein, A. R. (2002). Is there more to GABA than synaptic inhibition? Nat. Rev. Neurosci. 3, 715–727.
Pasquale, V., Massobrio, P., Bologna, L. L., Chiappalone, M., and Martinoia, S. (2008). Self-organization and neuronal avalanches in networks of dissociated cortical neurons. Neuroscience 153, 1354–1369.
Puelles, L., and Rubenstein, J. L. (2003). Forebrain gene expression domains and the evolving prosomeric model. Trends Neurosci. 26, 469–476.
Raichman, N., and Ben-Jacob, E. (2008). Identifying repeating motifs in the activation of synchronized bursts in cultured neuronal networks. J. Neurosci. Methods 170, 96–110.
Rheims, S., Represa, A., Ben-Ari, Y., and Zilberter, Y. (2008). Layer-specific generation and propagation of seizures in slices of developing neocortex: role of excitatory GABAergic synapses. J. Neurophysiol. 100, 620–628.
Rivera, C., Voipio, J., and Kaila, K. (2005). Two developmental switches in GABAergic signalling: the K+-Cl− cotransporter KCC2 and carbonic anhydrase CAVII. J. Physiol. 562, 27–36.
Robinson, H. P. C., Kawahara, M., Jimbo, Y., Torimitsu, K., Kuroda, Y., and Kawana, A. (1993). Periodic synchronized bursting and intracellular calcium transients elicited by low magnesium in cultured cortical neurons. J. Neurophysiol. 70, 1606–1616.
Rolston, J. D., Wagenaar, D. A., and Potter, S. M. (2007). Precisely timed spatiotemporal patterns of neural activity in dissociated cortical cultures. Neuroscience 148, 294–303.
Schmalenbach, C., and Müller, H. W. (1993). Astroglia–neuron interactions that promote long-term neuronal survival. J. Chem. Neuroanat. 6, 229–237.
Sernagor, E., Young, C., and Eglen, S. J. (2003). Developmental modulation of retinal wave dynamics: shedding light on the GABA saga. J. Neurosci. 23, 7621–7629.
Shahaf, G., Eytan, D., Gal, A., Kermany, E., Lyakhov, V., Zrenner, C., and Marom, S. (2008). Order-based representation in random networks of cortical neurons. PLoS Comput. Biol. 4:e1000228. doi: 10.1371/journal.pcbi.1000228.
Sheroziya, M. G., von Bohlen Und, H. O., Unsicker, K., and Egorov, A. V. (2009). Spontaneous bursting activity in the developing entorhinal cortex. J. Neurosci. 29, 12131–12144.
Sipila, S. T., Huttu, K., Yamada, J., Afzalov, R., Voipio, J., Blaesse, P., and Kaila, K. (2009). Compensatory enhancement of intrinsic spiking upon NKCC1 disruption in neonatal hippocampus. J. Neurosci. 29, 6982–6988.
Sipila, S. T., Schuchmann, S., Voipio, J., Yamada, J., and Kaila, K. (2006). The cation-chloride cotransporter NKCC1 promotes sharp waves in the neonatal rat hippocampus. J. Physiol. 573, 765–773.
Streit, J. (1993). Regular oscillations of synaptic activity in spinal networks in vitro. J. Neurophysiol. 70, 871–878.
Sudbury, J. R., and Avoli, M. (2007). Epileptiform synchronization in the rat insular and perirhinal cortices in vitro. Eur. J. Neurosci. 26, 3571–3582.
Titz, S., Hans, M., Kelsch, W., Lewen, A., Swandulla, D., and Misgeld, U. (2003). Hyperpolarizing inhibition develops without trophic support by GABA in cultured rat midbrain neurons. J. Physiol. 550, 719–730.
Uhlhaas, P. J., Haenschel, C., Nikolic, D., and Singer, W. (2008). The role of oscillations and synchrony in cortical networks and their putative relevance for the pathophysiology of schizophrenia. Schizophr. Bull. 34, 927–943.
Van Pelt, J., Corner, M. A., Wolters, P. S., Rutten, W. L., and Ramakers, G. J. (2004). Longterm stability and developmental changes in spontaneous network burst firing patterns in dissociated rat cerebral cortex cell cultures on multielectrode arrays. Neurosci. Lett. 361, 86–89.
Voigt, T., Opitz, T., and de Lima, A. D. (2001). Synchronous oscillatory activity in immature cortical network is driven by GABAergic preplate neurons. J. Neurosci. 21, 8895–8905.
Voigt, T., Opitz, T., and de Lima, A. D. (2005). Activation of early silent synapses by spontaneous synchronous network activity limits the range of neocortical connections. J. Neurosci. 25, 4605–4615.
Wagenaar, D. A., Pine, J., and Potter, S. M. (2006a). An extremely rich repertoire of bursting patterns during the development of cortical cultures. BMC Neurosci. 7, 11.
Wagenaar, D. A., Pine, J., and Potter, S. M. (2006b). Searching for plasticity in dissociated cortical cultures on multi-electrode arrays. J. Negat. Results Biomed. 5, 16.
Wojcik, S. M., Katsurabayashi, S., Guillemin, I., Friauf, E., Rosenmund, C., Brose, N., and Rhee, J. S. (2006). A shared vesicular carrier allows synaptic corelease of GABA and glycine. Neuron 50, 575–587.
Wonders, C. P., and Anderson, S. A. (2006). The origin and specification of cortical interneurons. Nat. Rev. Neurosci. 7, 687–696.
Yamada, J., Okabe, A., Toyoda, H., Kilb, W., Luhmann, H. J., and Fukuda, A. (2004). Cl− uptake promoting depolarizing GABA actions in immature rat neocortical neurones is mediated by NKCC1. J. Physiol. 557, 829–841.
Yang, J. W., Hanganu-Opatz, I. L., Sun, J. J., and Luhmann, H. J. (2009). Three patterns of oscillatory activity differentially synchronize developing neocortical networks in vivo. J. Neurosci. 29, 9011–9025.
Yuste, R., and Katz, L. C. (1991). Control of postsynaptic Ca2+ influx in developing neocortex by excitatory and inhibitory neurotransmitters. Neuron 6, 333–344.
Yvon, C., Czarnecki, A., and Streit, J. (2007). Riluzole-induced oscillations in spinal networks. J. Neurophysiol. 97, 3607–3620.
Keywords: MEA, gamma-aminobutyric acid, neocortex, cerebral cortex, oscillations, network activity, rat, cell culture
Citation: Baltz T, de Lima AD and Voigt T (2010) Contribution of GABAergic interneurons to the development of spontaneous activity patterns in cultured neocortical networks. Front. Cell. Neurosci. 4:15. doi: 10.3389/fncel.2010.00015
Received: 16 February 2010;
Paper pending published: 10 March 2010;
Accepted: 16 April 2010;
Published online: 21 June 2010
Edited by:
Yehezkel Ben-Ari, Institut National de la Santé et de la Recherche Médicale, FranceReviewed by:
Rustem Khazipov, Institut National de la Santé et de la Recherche Médicale, FranceYehezkel Ben-Ari, Institut National de la Santé et de la Recherche Médicale, France
Copyright: © 2010 Baltz, de Lima and Voigt. This is an open-access article subject to an exclusive license agreement between the authors and the Frontiers Research Foundation, which permits unrestricted use, distribution, and reproduction in any medium, provided the original authors and source are credited.
*Correspondence: Thomas Voigt, Institut für Physiologie, Medizinische Fakultät, Otto-von-Guericke-University, Leipziger Str. 44, D-39120 Magdeburg, Germany. e-mail: thomas.voigt@med.ovgu.de