


- Department of Neurobiology and Behavior, State University of New York Stony Brook, Stony Brook, NY, USA
Persistent reduction in sensory drive in early development results in multiple plastic changes of different cortical synapses. How these experience-dependent modifications affect the spatio-temporal dynamics of signal propagation in neocortical circuits is poorly understood. Here we demonstrate that brief visual deprivation significantly affects the propagation of electrical signals in the primary visual cortex. The spatio-temporal spread of circuit activation upon direct stimulation of its input layer (Layer 4) is reduced, as is the activation of L2/3 – the main recipient of the output from L4. Our data suggest that the decrease in spatio-temporal activation of L2/3 depends on reduced L4 output, and is not intrinsically generated within L2/3. The data shown here suggest that changes in the synaptic components of the visual cortical circuit result not only in alteration of local integration of excitatory and inhibitory inputs, but also in a significant decrease in overall circuit activation. Furthermore, our data indicate a differential effect of visual deprivation on L4 and L2/3, suggesting that while feedforward activation of L2/3 is reduced, its activation by long range, within layer inputs is unaltered. Thus, brief visual deprivation induces experience-dependent circuit re-organization by modulating not only circuit excitability, but also the spatio-temporal patterns of cortical activation within and between layers.
Introduction
Sensory experience sculpts the connectivity and function of neocortical circuits (Katz and Shatz, 1996; Finnerty et al., 1999; Cheetham et al., 2007; Feldman, 2009). Lack of environmental stimuli during sensitive windows for circuit development impairs sensory function permanently (Hubel and Wiesel, 1970; Goodman and Shatz, 1993). In visual cortex, brief unilateral visual deprivation (MD) silences the circuit driven by the deprived eye, resulting in reduced neuronal responsiveness to visual stimuli (Mower et al., 1982; Frenkel and Bear, 2004). Recent data show that, besides Hebbian synaptic plasticity (Kirkwood et al., 1996; Crozier et al., 2007; Maffei and Turrigiano, 2008; Yoon et al., 2009), additional plasticity mechanisms are induced by MD at different excitatory (Maffei et al., 2004; Crozier et al., 2007) and inhibitory synapses (Maffei et al., 2006).
Experimental approaches that isolate the circuit into its synaptic components have been extremely successful in identifying plastic modifications at different sites of the visual cortical network (Fagiolini et al., 2004; Maffei et al., 2006; Katagiri et al., 2007; Maffei and Fontanini, 2009). Sensory perception, however, is the result not only of neuron to neuron communication but also of microcircuits and network interactions. The degree to which plastic changes at synapses integrate to modulate circuit activity is poorly understood. Optical imaging in vivo provided significant insight about the functional organization of cortical maps (Crair et al., 1997; Trachtenberg et al., 2000; Chklovskii and Koulakov, 2004; Ohki et al., 2005; Palagina et al., 2009) and about experience-dependent changes of visual responsiveness (Farley et al., 2007; Mrsic-Flogel et al., 2007). Due to limited access to the deeper layers, however, these studies concentrated on the analysis of the circuits in L1 and L2/3.
Here we used voltage sensitive dye (VSD) imaging in acute visual cortical slices to investigate the effects of MD on the flow of electrical signals within and between layers in the monocular region of rodent primary visual cortex (V1m). Our data indicate that brief unilateral reduction of visual input decreases the spatio-temporal dynamics of the activation of L4 and L2/3 of the circuit driven by the deprived eye in a correlated fashion. Furthermore we show that the impaired activation of the superficial layers results in significantly reduced propagation of the signal to the deep layers. As direct activation of the recurrent circuit in L2/3 remains unaltered, our data suggest that early after the onset of visual deprivation feedforward activation of the intracortical circuit is decreased, while long range L2/3 horizontal activation is preserved. A correlated decrease in feedforward activation of the superficial layers of V1m is likely a network mechanism contributing to the experience-dependent loss of visual responsiveness of the circuit driven by the deprived eye.
Materials and Methods
Monocular Deprivation and Acute Slice Preparation
All experimental procedures were approved by the Stony Brook University Animal Use Committee and followed the guidelines of the National Institute of Health. Monocular eyelid suture [postnatal day 22 (p22) until p25 ± 1] was performed on Long Evans rats as previously described (Maffei et al., 2004, 2006, Maffei et al., 2010; Maffei and Turrigiano, 2008). At the end of the period of deprivation rats were sacrificed and acute coronal slices containing primary visual cortex were obtained from the hemisphere contralateral (Deprived) and ipsilateral (Control) to the deprived eye as described (Maffei et al., 2004, 2006; Maffei and Turrigiano, 2008). Each slice was placed on an Omnipore membrane filter and transferred to an interface chamber containing ACSF constantly bubbled with a gas mixture of 95% CO2–5% O2 to maintain oxygen concentration and humidity (Tominaga et al., 2000). Slices were incubated at 37°C for about 20 min and then allowed to adapt to room temperature for 45 min prior to processing.
Voltage Sensitive Dye Preparation and Staining Procedure
The dye preparation and staining procedures were modified from Tominaga et al. (2000). Di-4-ANEPPS (Invitrogen; absorption: 496 nm, emission: 705 nm) was dissolved in a 2:1 mixture of ethanol and 10% Cremophor-EL solution (v/v in ddH2O, Sigma) to a final concentration of 3.3 mg/ml. This stock solution was prepared ahead of time and stored at 4°C for as long as 2–3 months. Before staining, a small volume of the stock solution was dissolved in 1:1 fetal bovine serum (FBS, Sigma) and oxygenated ACSF to a final di-4-ANEPPS concentration of 0.2 mM (Tominaga et al., 2000).
Prior to recording a slice attached to its Omnipore filter was moved to a separate compartment of the interface chamber, covered with a droplet of staining solution (100 μl per slice) and incubated for 40 min at room temperature. The slice and its membrane filter were then transferred to a custom made recording chamber mounted on an upright microscope (Olympus, BX51WI), secured to the bottom of the chamber with a flattened platinum ring positioned on the filter and allowed to wash out the excess dye for about 10 min with constant flow of ACSF at 35°C, at a rate of 1.5 ml/min. This flow rate allowed the maintenance of proper levels of oxygenation as it allowed for a complete exchange of the bath solution 1.5 times/min. In our experimental conditions optical recording from each slice were stable for over 4 h, and less than 0.02% changes in percent ΔF/F were observed in baseline recordings lasting about 60 min, the time to run most of the tests described in the manuscript.
Recordings
Specimens were illuminated with a halogen lamp (150 W, TH 4-100, Olympus, Japan) controlled by an electronic shutter (Smart Shutter with Lambda 10B controller, Sutter Instruments, CA, USA). The light was passed through an excitation filter (λ 530 ± 10 nm) projected onto a dichroic mirror (λ = 565 nm) and reflected toward the objective lens to illuminate the slice. The fluorescence generated by the tissue was transmitted through an absorption filter (λ = 590 nm) to a CCD camera connected to a PC controlling illumination and optical data acquisition via an I/O interface (MiCAM 02, SciMedia, Brainvision, Tokyo, Japan). The area imaged was selected with a 4× objective with high numerical aperture (NA 0.28, Olympus). The magnification was further reduced with a 0.5× lens on the c-mount of the CCD camera. The image resolution was 60 × 88 active pixels with single pixel size of 20 μm, allowing the measurement of percent ΔF/F transitions over an area of 1.2 mm × 1.8 mm. For each stimulus a total of 256 frames were acquired every 2.5 ms (400 Hz) for a total of 640 ms. Each stimulus was repeated 16 times every 15 s and averaged across the 16 repetitions to increase the signal to noise ratio. To avoid changes of focus during the experiment, the level of the solution in the recording chamber was maintained constant by equalizing inflow and outer flow with a peristaltic pump (Watson-Marlow Sci 400). Electrophysiological recordings and extracellular stimulation were synchronized with the acquisition of the optical signals by connecting the I/O interface of the CCD camera to the Digital output of the EPC10-USB amplifier (HEKA, Germany). Extracellular stimuli were delivered via a stimulus isolation unit (Warner Instruments) controlled by the D/A board integrated in the EPC10-USB amplifier. Extracellular stimulation was delivered with a tungsten unipolar electrode covered with a glass pipette (0.1 MΩ Harvard Apparatus) and placed in the position of interest in monocular V1 – lower L4 (Figures 1–5 and 7–9) or L2/3 (Figure 6) depending on the experiment – with a micromanipulator (Sutter Instruments) under optical guidance. In both L4 and L2/3 the stimulating electrode was placed at the center of region visually identified as V1m. Local field potentials (LFP) in L2/3 were acquired with a recording electrode covered by a glass pipette with diameter 10 μm, filled with oxygenated ACSF and positioned in the area of interest under optical guidance. LFP were acquired in current clamp mode and digitized at 5 kHz. The minimal stimulation intensity for each slice was defined as the intensity at which a 50% failure–50% LFP response was observed. For each slice 0.2 ms pulses were delivered at intensities ranging from a minimal stimulation of 10 μA to a maximum of 80 μA, the intensity at which the amplitude of LFP signals reached a plateau. To allow for comparisons between different conditions optical signals were normalized to the initial background fluorescence measured in the first 50 ms before the delivery of each stimulus. The analysis of the LFP and of the VSDI signal was performed with procedures developed in Igor Pro (WaveMetrics), Image J and using Brainvision Analysis Software (SciMedia, Japan).
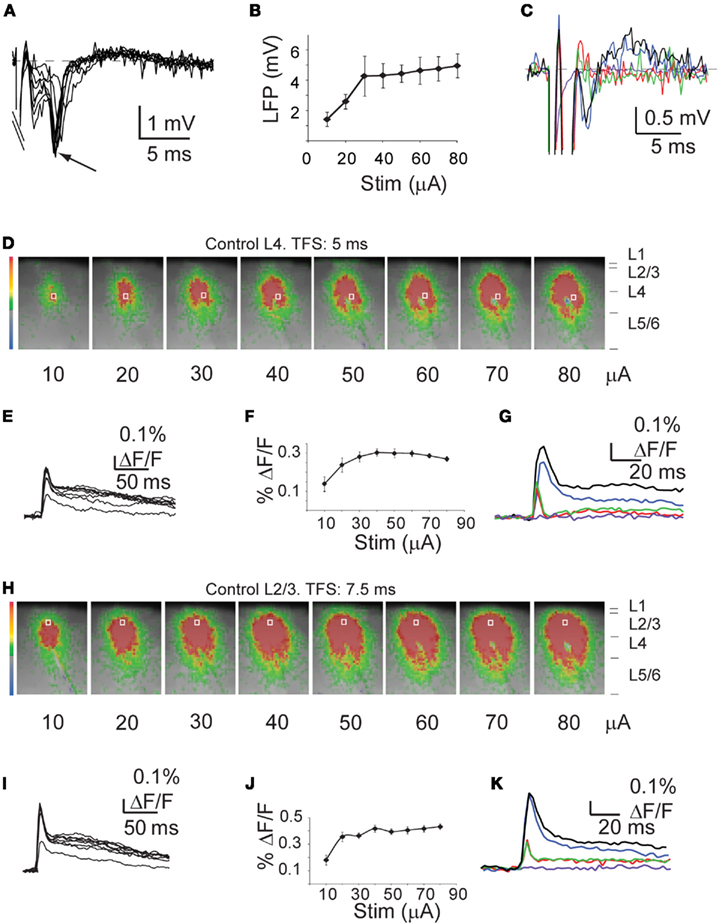
Figure 1. Similar input/output (I/O) curves for optical signals and LFP. (A) Sample LFP in L2/3. (B) Cumulative I/O plot of LFPs. (C) Pharmacological dissection of LFPs. Black: ACSF; Blue: ACSF + APV; Red: ACSF + APV + DNQX; Green: ACSF + APV + DNQX + Ptx; Purple: ACSF + APV + DNQX + Ptx + TTX. (D) Sample L4 circuit activation at increasing intensities of stimulation. Analysis was done on frames taken 5 ms after stimuli. White box: ROI in L4. (E) Sample time course of the optical signals in the ROI shown in (D). (F) Cumulative I/O plot of the peak optical signals in L4. (G) Pharmacological dissection of the L4 optical signal. Black: ACSF; Blue: ACSF + APV; Red: ACSF + APV + DNQX; Green: ACSF + APV + DNQX + Ptx; Purple: ACSF + APV + DNQX + Ptx + TTX. (H) Sample L2/3 circuit activation at increasing intensities of stimulation. Analysis was done on frames taken 7.5 ms after the stimulus. White box: ROI in Layer 2/3. (I) Sample time course of the optical signal recorded in the ROI in (H). (J) Cumulative I/O plot of the peak optical signal in L2/3. (K) Pharmacological dissection of the L2/3 optical signal. Black: ACSF; Blue: ACSF + APV; Red: ACSF + APV + DNQX; Green: ACSF + APV + DNQX + Ptx; Purple: ACSF + APV + DNQX + Ptx + TTX. The size of the images was cropped to better visualize the activated region (from 88 × 60 to 45 × 50 pixels of 20 μm each).
Whole Cell Patch Clamp
To measure the amplitude of inhibitory postsynaptic currents (IPSC) evoked onto star pyramidal neurons by extracellular stimulation in L4, whole cell voltage clamp recordings were performed. Slices were prepared as described (Maffei et al., 2006; Maffei and Turrigiano, 2008). A tungsten unipolar stimulating electrode was positioned in L4 under visual guidance and whole cell recordings were obtained from star pyramidal neurons in L4 using 3–5 MΩ pipettes pulled from borosilicate capillaries using a Flaming/Brown pipette puller (Sutter P-97). Before recording, slices were incubated with ACSF containing 50 μM APV and 20 μM DNQX to isolate fast inhibitory synaptic components. The stimulation intensity was chosen to elicit the minimal IPSCs. Forty repetitions of the stimulus repeated every 15 s were obtained for the number of neurons indicated. In our experimental conditions the reversal potential for chloride was −50 mV – due to the composition of the internal solution – and recordings were performed while holding neurons at −70 mV, therefore inhibitory currents appear inward.
Analysis and Statistics
The lateral radial spread of the optical signal was analyzed by fitting the distribution of percent ΔF/F for each slice with the one-dimensional Gaussian equation shown below using Igor Pro (WaveMetrics)
Y (x) = a exp −[(x − b)2/c2]
a is the amplitude of the curve, b is the position of the peak and c is the width. Data are presented as mean ± SEM for the number of slices indicated in the text. To determine statistical significance two-way ANOVAs were run for each data set. If significant, this was followed by two-tailed Student’s t tests and/or corrected for multiple comparisons using the Bonferroni method. p Values ≤0.05 were considered significant.
Solutions
Artificial cerebro-spinal fluid contained in mM: NaCl 126; KCl 3; MgSO4 2; NaHPO4 1; NaHCO3 25; CaCl2 2; Dextrose 25. The pH of the ACSF was adjusted to 7.2 by bubbling is with a gas mixture of 95% CO2–5% O2. The internal solution for whole cell recordings contained (in mM): KCl 20; K-Gluconate 100; HEPES 10; Biocytin 0.2%; Mg-ATP 4; Na-GTP 0.3; Na-Phosphocreatine 10. The pH was adjusted to 7.35 with KOH and the osmolarity was adjusted to 295 mOsm with sucrose.
Drugs
To dissect the contribution of glutamatergic and GABAergic receptors to the VSD and whole cell IPSC signal the following drugs were delivered – in additive sequence or cumulatively depending on the experiment – to regular ACSF: 50 μM APV (Tocris); 20 μM DNQX (Tocris). To further isolate the GABAA component of the signal 20 μM picrotoxin (Tocris) was added at the end of the experiment. ACSF with increasing concentration of picrotoxin (2, 5, 10 μM) was used to investigate the contribution of GABAA receptors to the L4 to L2/3 signal.
Results
To address how MD affects the spatio-temporal patterns of intra- and inter-laminar activation across the superficial layers of V1m, we performed simultaneous optical and electrophysiological recordings in acute slice preparations obtained from 24 rats that had been monocularly deprived starting at p22 for 2 or 4 days. Voltage signals were recorded measuring the transition in fluorescence (% ΔF/F) within regions of interest (ROI) of 2 × 2 pixels (see Materials and Methods). LFP were recorded with a glass electrode placed in L2/3. L4 and its feedforward circuit to L2/3 were activated using a tungsten stimulating electrode placed in the lower portion of L4. For each slice, intensity/response curves were constructed to verify that the amplitude of LFP and the VSD signals followed the intensity of the stimulus with a similar trend (see Materials and Methods; Control hemisphere Figures 1B,F,J and 2 for Control and Deprived hemispheres). In a subset of experiments we verified the synaptic nature of the electrophysiological and optical signals by perfusing, in additive sequence, synaptic blockers for AMPA, NMDA, and GABAA receptors (Figures 1C,G,K and 7). In slices from both hemispheres, the combination of all blockers eliminated the optical and electrophysiological signals leaving only a small component that was fully abolished by the sodium channel blocker tetrodotoxin (TTX) and corresponded to the fiber volley elicited by the electrical stimulation (Figures 1C,G,K, for control slices). The time to peak (TTP) of the TTX component in L4 was significantly shorter than in L2/3 (L4, Control-TTX TTP: 2.5 ± 0.5 ms; L2/3 Control-TTX TTP: 5.0 ± 0.3 ms; p < 0.03; n = 15), suggesting that the optical signal in L2/3 is unlikely due to the antidromic activation of L2/3 pyramidal neurons.
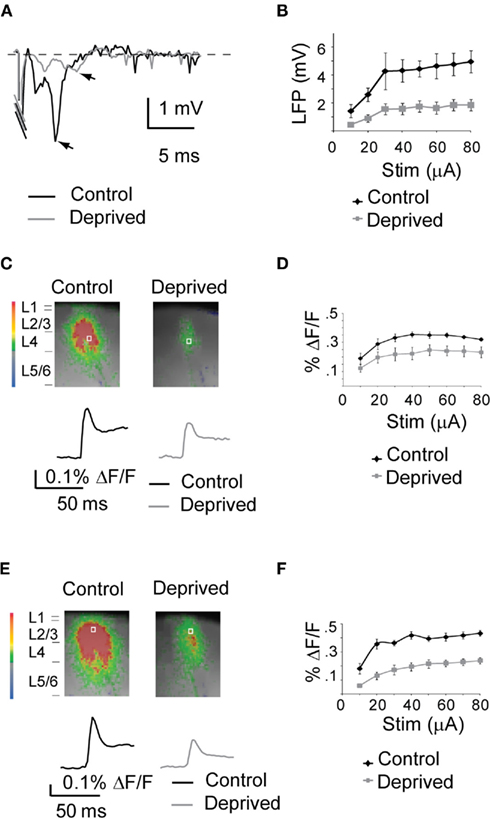
Figure 2. MD-dependent reduction in cortical activation. (A) Sample LFP at 50 μA in Control (black) and Deprived (gray) slices. The stimulation artifact was cut to better visualize the LFP signal. (B) Cumulative I/O plot of for LFP signals in Control (black) and Deprived (gray) slices. (C) Top: sample frames acquired 5 ms after a 50-μA stimulus in Control and Deprived slices. Bottom: time course of the optical signal in L4 for control (black) and deprived (gray) hemispheres. (D) Cumulative I/O plot of optical signals in control (black) and deprived (gray) hemispheres. (E) Top: sample frames acquired 7.5 ms after a 50-μA stimulus in Control and Deprived slices. Bottom: time course of the optical signal in L2/3 for Control (black) and Deprived (gray) hemispheres. (F) Cumulative I/O plot of the optical signals in control (black) and deprived (gray) hemispheres. The size of the images field was cropped to better visualize the activated region (from 88 × 60 to 45 × 50 pixels of 20 μm each).
Short MD Decreases Circuit Activation
We compared the intensity and patterns of circuit activation in slices from the hemispheres ipsilateral (Control) and contralateral (Deprived) to the deprived eye of rats that had been visually deprived for 2 or 4 days. As the results of 2 and 4 days MD were similar, the data are presented as a single experimental condition (Figure 2). Synchronized acquisition of optical signals and LFP was obtained for increasing intensities of stimulation, from the intensity at which minimal electrophysiological signals were detected, to the one at which the amplitude of the LFP signal plateaued (Figure 2B). The intensity/response curve of the LFP and VSD signals followed a similar trend in slices obtained from the hemisphere ipsilateral and contralateral to the deprived eye (ROI for L4 indicated by the white square in Figure 2C and for L2/3 in Figure 2E; input/output curves: Figures 2B,D,F). The amplitude of the LFP recorded in L2/3 was reduced in Deprived slices at all intensities of stimulation (Figure 2B; two-way ANOVA: p < 0.001; Control: n = 14; Deprived: n = 13). The deprived hemisphere also showed a significant decrease in the amplitude of the optical signal measured in L4 (Figures 2C,D) and in L2/3 (Figures 2E,F; Control: n = 14; Deprived: n = 13; two-way ANOVA: p < 0.001). At stimulation intensities in the plateau region of the activation curves (from stimulation intensities of 50 μA and above), there was a 29.4 ± 3.2% decrease in the peak VSD signal in L4 of the deprived hemisphere (Control: n = 14; Deprived: n = 13; p < 0.03; Figures 2C,D) and a 37.3 ± 2.5% reduction in peak percent ΔF/F in L2/3 (p < 0.001; Figures 2E,F).
This intensity produced signals in the plateau region of the I/O curve for both Control and Deprived slices. The analysis of VSD data for the rest of the manuscript will be focused to 50 μA intensity of stimulation unless indicated, because it allowed the comparison of different experimental conditions, while avoiding confounds that may have arisen from comparisons in the rising phase of the I/O curve. The delay of the VSD response from the time of stimulation (time from stimulus, TFS) was significantly longer in L2/3 in both Control and Deprived slices (Control L4: 2.6 ± 0.2 ms; Control L2/3: 4.6 ± 0.3 ms; p < 0.001; Deprived L4: 3.8 ± 0.6 ms; Deprived L2/3: 7.2 ± 0.6 ms; p < 0.01), and was consistent with the expected synaptic delay for synaptic connection measured intracellularly in L4 pyramidal neurons (TFS L4 Control: 1.9 ± 0.1 ms; Deprived: 2.0 ± 0.1 ms; p = 0.14; TTP L4: Control: 5.2 ± 0.1 ms; Deprived: 5.4 ± 0.04; p = 0.24) and in L2/3 (see Maffei and Turrigiano, 2008). The TFS of both L4 and L2/3 were not significantly different in Control and Deprived conditions (p = 0.15). The TTX sensitive component of the optical signal was similar in slices from the Control and Deprived hemispheres (L4, Control-TTX: 0.25 ± 0.02% ΔF/F; n = 15; Deprived-TTX: 0.23 ± 0.03% ΔF/F; n = 13; p = 0.3; L2/3, Control-TTX: 0.1 ± 0.01% ΔF/F; Deprived-TTX: 0.09 ± 0.01% ΔF/F; p = 0.5). These results indicate that the decreased activation of the circuit in V1 is not due to different recruitment of afferent axons.
Changes in Vertical and Horizontal Temporal Patterns of Circuit Activation Following Short MD
The reduction of the VSD signal in L4 and L2/3 described above could reflect either a reduced overall responsiveness to direct stimulation or changes in the dynamic of the spatio-temporal pattern of activation of the cortical circuit. To verify that reductions in fluorescence induced by MD were not due to differences in the time course of activation within ROIs we compared the average time course of the optical signal in ROIs of 2 × 2 pixels (40 μm × 40 μm) positioned in the region of maximal activation at a stimulation intensity of 50 μA. Figure 3B indicates that, although the amplitude of the optical signal was significantly reduced, MD did not significantly alter the kinetics of local circuit activation within L4 (top; see ROI in a indicated by the white square position in L4 in Figure 3A) and L2/3 (bottom; see ROI in a, white square in L2/3 in Figure 3A). The analysis of the kinetics of the optical signals was furthered to ROIs extending through the entire thickness of the cortical mantle, to quantify potential differences in the spatio-temporal patterns of activation across cortical layers and to control for possible non-specific activation of retrograde fibers of passage (1 pixel wide – 20 μm – and 50 pixels long – 1 mm; dotted line in Figure 3A). As shown in Figures 3A,C the depolarization of the cortical circuit started in L4 around the area of direct stimulation (see white arrow), as expected. At 2.5 ms from the stimulus the peak activation of L4 in the deprived hemisphere was reduced by 29.4 ± 3.4% (Control: n = 14; Deprived: n = 13; two-way ANOVA: p < 0.01). Analysis of the temporal sequences of activation showed that 5 ms after the delivery of the stimulus the optical signal was maximal in L4. L2/3 became maximally activated 10 ms after the stimulus (Figures 3A,C. While the overall temporal pattern of activation is similar in Control and Deprived slices (Figure 3), the intensities of the signal – quantified both as the maximum percent ΔF/F at each time point and as the average percent ΔF/F across the activated area – were significantly reduced in Deprived slices (Figures 3A,D; two-way ANOVA: p < 0.01).
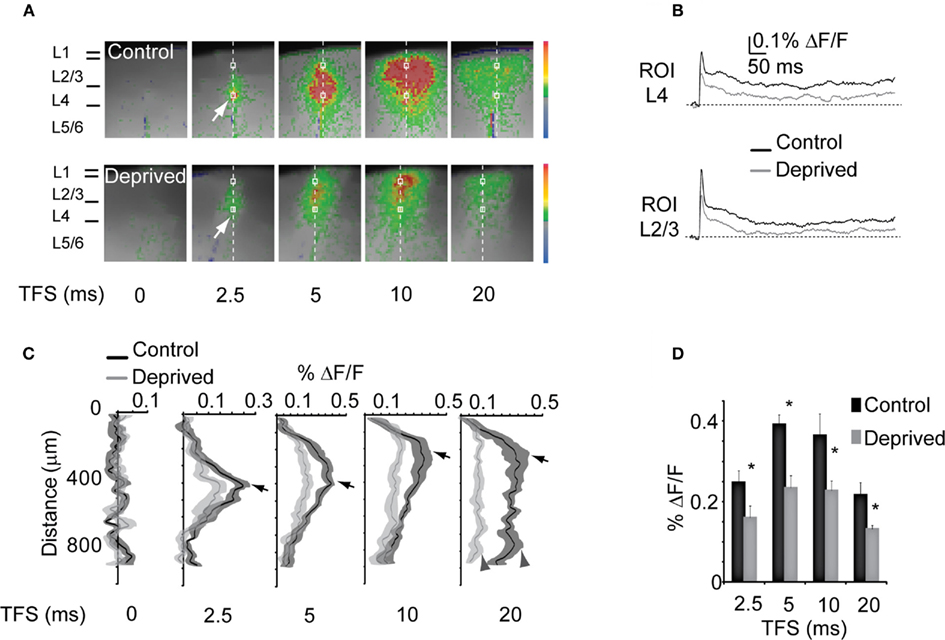
Figure 3. Reduced inter-laminar propagation of stimuli. (A) Temporal sequence of optical signals after L4 stimulation in Control (top) and Deprived (bottom) slices. The size of the images field was cropped to better visualize the activated region (from 88 × 60 to 45 × 50 pixels of 20 μm each). Vertical dotted line across the cortical mantle: ROI quantified in (C,D). White square: ROI of the optical signal in (B). The stimulus intensity was 50 μA. (B) Top: time course of optical signals measured in L4 [bottom white squares in (A)]. Black: Control; gray: Deprived. Bottom: Time course of the percent ΔF/F measured in L2/3 [top white squares in (A)] for Control (black) and Deprived (gray) slices. (C) Time course of the percent ΔF/F measured in the ROI indicated by the dotted line in (A). Black: Control; gray: Deprived. Shaded areas: SE for both conditions. Arrows indicate the peak intensity plotted in (D). Dark gray arrowheads indicate the peak activation of L5. (D) Peak percent ΔF/F at the different time points in Control (black) and Deprived (gray). Asterisks indicate significant changes.
No significant activation of the deep layers (5/6) was observed for any frame taken in the first 15 ms from the stimulus. However, at approximately 20 ms after the stimulus there was a significant activation of the deep layers (L5/6) in Control slices (see Figures 3A,C at 20 ms, arrowheads). The delayed activation of the deep layers indicates that neurons in L5/6 were not directly activated by the stimulus, but that their activation was due to the propagation of activity across the superficial layers. In slices from the deprived hemisphere L5/6 activation was significantly reduced as indicated by the percent ΔF/F of the pixels in the 600–900 μm range (Figure 3C; L5/6, Control: 0.21 ± 0.02% ΔF/F; Deprived: 0.11 ± 0.03% ΔF/F; two-way ANOVA: p < 0.05). Altogether, the time course of the VSD signals proved that the decreased activation described in Figure 3 resulted from an overall reduction in cortical activation, rather than from altered temporal dynamics.
Inputs onto cortical circuits do not only propagate vertically (Burkhalter, 1989), they also excite the highly recurrent circuits within each layer (Alonso, 2002) and spread horizontally (Laaris et al., 2000; Petersen and Sakmann, 2001). We quantified the horizontal spread of circuit activation in L4 and L2/3 using two independent methods. In the first method, we quantified the distance over which the transition in fluorescence for each pixel measured along a line parallel to the pial surface exceeded 50% of the peak percent ΔF/F (Figure 4A; Control: top image sequence; Deprived: bottom image sequence. For each image, top dotted line: line of interest for L2/3; bottom dotted line: line of interest for L4). On average, the half maximal width (HMW) of the signal was propagated across 885.7 ± 28.2 μm in L4 and 825.7 ± 41.3 μm in L2/3 of the control hemisphere. In slices from the deprived hemisphere, however, the HMW was significantly reduced in both L4 and L2/3 only spreading 665.6 ± 64.1μm and 665.8 ± 46.9 μm for L4 and L2/3 respectively (Figures 4B,D; two-way ANOVA: p < 0.01). The reduction was significant in both L4 and L2/3 at all time points (Figures 4C,E). To further confirm this result we fitted the percent ΔF/F distribution measured in the ROI in Figure 4A with a Gaussian equation (see Materials and Methods) for each slice and compared the width of the Gaussian curves (GW) in Control and Deprived slices. The GW for both L4 and L2/3 were significantly reduced in Deprived slices (L4 – Control: 308.4 ± 23.8 μm; Deprived: 84.5 ± 4.8 μm; p < 10−7; L2/3 – Control: 341.9 ± 14.2 μm; Deprived: 258.45 ± 9.8 μm; p < 10−4). Our results indicate that after short MD inputs with similar intensities activating L4 were less efficiently propagated within and between layers of the cortical network.
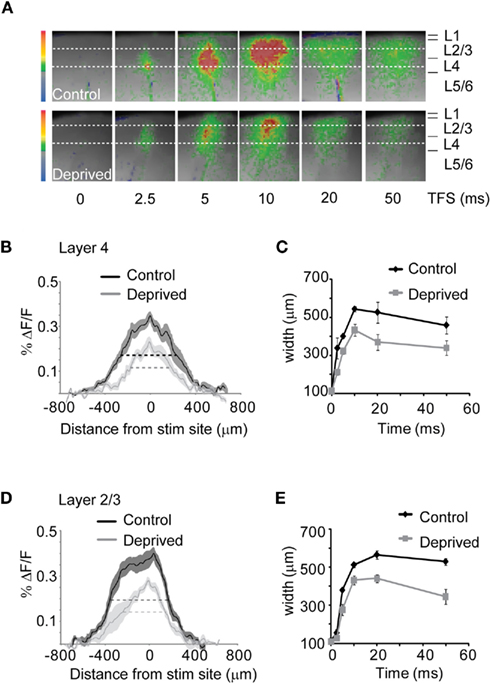
Figure 4. MD reduces the extent of intralaminar circuit activation. (A) Representative frames of the time course of optical signals following L4 stimulation in Control and Deprived slices. The size of the imaged field was cropped to visualize the activated region (from 88 × 60 to 45 × 50 pixels of 20 μm each). Dotted lines parallel to the pia: ROIs corresponding in L4 (lower dotted lines) and L2/3 (upper dotted lines). The stimulation intensity was 50 μA. (B) Distribution of the percent ΔF/F in L4 measured in the bottom ROI in (A). TFS: 10 ms. Black: Control; gray: Deprived. Shaded areas: SE for both conditions. (C) Average HMW plot in L4 at different TFS. Black: Control; gray: Deprived. (D) Distribution of the percent ΔF/F in L2/3 at a TFS of 10 ms [top ROI in (A)]. Black: Control; gray: Deprived. Shaded areas: SE. (E) Cumulative HMW plot in L2/3 at different TFS. Black: Control; gray: Deprived.
Decreased L2/3 Activation after Short MD is Secondary to Changes in L4
While in our experimental conditions L4 activation depended only on its level of excitability, L2/3 activation depended on both its excitability and the magnitude of its input from L4. The reduced activation of L2/3 might therefore be due to plastic changes intrinsic to the circuit in L2/3, to the decreased input from L4 or both. We addressed these possibilities by analyzing the activation of L2/3 relative to L4 in slices from the control and deprived hemispheres. The ratio of the peak percent ΔF/F of L4 and L2/3 in Control and Deprived slices was constant in Control and Deprived conditions, indicating that the MD-dependent reduction of activity in L2/3 was largely a consequence of the decrease in L4 output (Figure 5A, left bars; Control: 1.2 ± 0.1; n = 14; Deprived: 1.3 ± 0.3; n = 13; p = 0.7). A similar result was obtained by computing the ratio for the width of activation between L4 and L2/3 (Figure 5A, right bars). The peak and width percent ΔF/F from both layers showed a similar degree of correlation at every intensity of stimulation tested in Control and Deprived conditions (Figures 5B,C; Peak – Control: R2 = 0.33; Deprived: R2 = 0.29; Width – Control: R2 = 0.77; Deprived: R2 = 0.69). The analysis presented in Figure 5 suggested that the MD-induced decrease in L2/3 activation was secondary to the changes observed in L4. Depression of the state of excitability in the recurrent circuit in L2/3 would have instead resulted in a reduction of the ratio and in a significant change of correlation between activities in the two layers after MD.
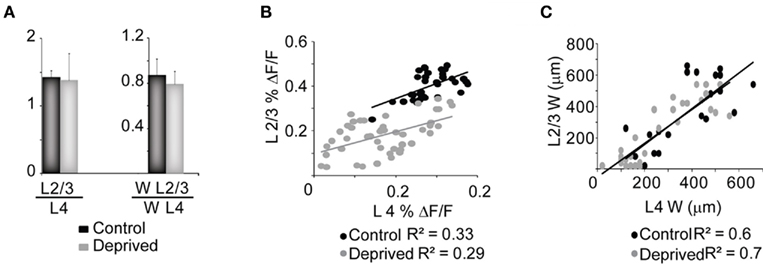
Figure 5. Changes in L4 and L2/3 activation are correlated. (A) Cumulative bar plot of the ratio between the peak percent ΔF/F (L2/3 versus L4) and width (WL2/3 versus WL4) of L2/3 and L4. Black: Control; gray: Deprived. (B) Distribution of the peak percent ΔF/F of L2/3 plotted against L4 for all intensities of stimulation tested and across all slices. Black: Control; gray: Deprived. (C) Distribution of the HMW in L2/3 and L4 measured at TFS of 2.5, 5 and 10 ms. The stimulation intensity was 50 μA. Black: Control; gray: Deprived. Lines in (B,C) indicate the linear fit of the data. R2 are the regression coefficients for Control and Deprived conditions.
MD Does Not Affect the Spatio-Temporal Patterns of Direct L2/3 Activation
To test for the contribution of potential changes specific to the circuit in L2/3 further, both stimulating and recording electrodes were placed in L2/3 and optical and electrophysiological signals were measured in Control and Deprived slices (Figure 6). As shown in Figure 6, the stimulation intensity used here activated a very limited portion of L2/3 in the region surrounding the tip of the stimulating electrode in the first few milliseconds after the stimulus. This indicates that there was no significant activation, antidromic or orthodromic, of regions other than the one close to the electrode. Thus, the extent of circuit activation that developed over the time course of the recording likely depended on the propagation of activity started from the site of direct stimulation in L2/3.
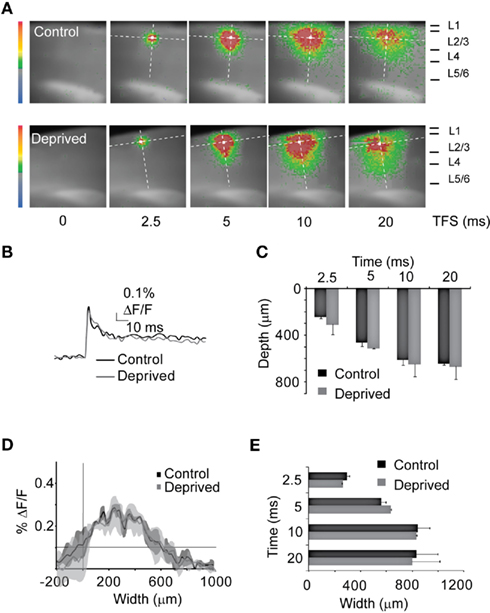
Figure 6. MD leaves direct L2/3 activation unaffected. (A) Sample frames of the temporal sequence of optical signals in response to direct stimulation of L2/3 in Control (top frames) and Deprived (bottom frames) conditions. Images show the full field of acquisition (88 × 60 pixels, 20 μm each). White squares: ROIs for optical signal shown in (B). Dotted lines across from the pia to the white matter indicate the ROI for the analysis in (C). Dotted lines parallel to the pia: ROIs for the analysis in (D,E). Stimulation intensity: 50 μA. (B) Time course of the optical signal from the white square ROIs in (A). Black: Control; gray: Deprived. (C) Average peak percent ΔF/F from the ROIs represented by the dotted line across the cortical mantle. Black: Control; gray: Deprived. (D) Distribution of percent ΔF/F from the ROI parallel to the pia. TFS: 10 ms. Black: Control; gray: Deprived. Shaded areas: SE. (E) Cumulative bar plot of the peak percent ΔF/F within L2/3 at different TFSs. Black: Control; gray: Deprived.
The peak percent ΔF/F in response to the direct stimulation of L2/3 was not significantly altered by MD (Figure 6A: ROI, white square; Figure 6B: time course of percent ΔF/F in the ROI shown in A; Control: 0.62 ± 0.01% ΔF/F; n = 4; Deprived: 0.59 ± 0.04% ΔF/F; n = 4; two-way ANOVA: p = 0.6). The time course of L2/3 activation was also unaffected (Figure 6B). Figure 6C shows the vertical spread of the activation following L2/3 stimulation measured along the ROI indicated by the dotted line perpendicular to the pia shown in Figure 6A (values plotted correspond to the depth at which the peak of activation was found). At each time point tested there was no significant difference in the distance of propagation, suggesting that the output of L2/3 is propagated effectively toward the deeper layers (Figure 6C; two-way ANOVA: p = 0.4). In addition, the distribution and the extent of the horizontal activation within L2/3 was similar in Control and Deprived slices (see Figures 6A,D,E; two-way ANOVA: p = 0.9). The absence of MD-dependent changes following direct L2/3 stimulation demonstrates that MD does not modify the overall ability of the circuit in L2/3 to respond to inputs reaching its circuit directly, but is less effectively activated by the feedforward pathway.
Reduced Circuit Activation after Short MD May Depend on Changes in Inhibitory Drive
The data emphasize the pivotal role of L4 in mediating the overall reduction in V1m responsiveness to direct electrical stimulation, and are consistent with previous data showing a MD-dependent decrease in L4 excitability (Maffei et al., 2006, 2010). Changes in the balance between excitatory and inhibitory synaptic drive (Maffei et al., 2006, 2010) might explain the decrease in spatio-temporal circuit activation described here. We took advantage of one of the features of extracellular stimulation – the ability to directly excite both excitatory and inhibitory axons traveling by the stimulating electrode – to determine what proportion of the VSD signal in L4 depended on the direct activation of glutamatergic and GABAergic axons. During the experiment we bath applied in additive sequence 50 μM APV, 20 μM DNQX, and 20 μM picrotoxin to quantify, via subtraction, the contribution of NMDA, AMPA, and GABAA receptors to the optical signal (Figure 7). Electrophysiological and optical signals as well as the slice background staining were stable (with less than 0.02% changes in percent ΔF/F; see Materials and Methods) as observed in baseline recordings with similar duration to the one described here. The stability of the signals allowed us to apply the blockers in additive sequence and estimate the portion of the LFP and optical signals driven by the different synaptic components.
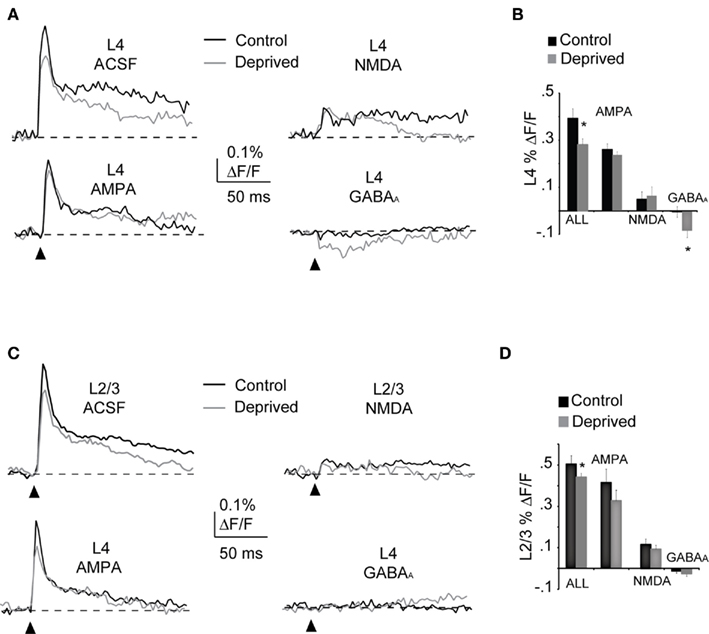
Figure 7. Potentiation of inhibition as a mechanism for the MD-induced decrease in circuit activation. (A) Synaptic components of the optical signal measured in ROIs of 2 × 2 pixels within L4 in control and deprived hemispheres. Top left: optical signal in ACSF; top right: NMDA components of the optical signal; bottom left: AMPA components and bottom right: GABAA components. Black: Control; Gray: Deprived. (B) Cumulative bar plot of the AMPA, NMDA, and GABAA components of the optical signals. Control (black) and Deprived (gray). (C) Synaptic components of the optical signal were quantified in ROIs of 2 × 2 pixels in L2/3 from control and deprived hemispheres. Top left: optical signal in ACSF; top right: NMDA components of the optical signal; bottom left: AMPA components and bottom right: GABAA components. Black: Control; Gray: Deprived. (D) Cumulative bar plot of the AMPA, NMDA and GABAA components of the optical signal. Control (black) and Deprived (gray). Stimulation intensity: 50 μA. Asterisk indicates significant changes.
The peak amplitude of the optical signal in L4 of the Deprived hemisphere was significantly smaller than in Control, while the absolute percent ΔF/F due to AMPA and NMDA receptors was not significantly different (Figures 7A,B; AMPA – Control: 0.26 ± 0.03%, n = 15; Deprived: 0.24 ± 0.04%, n = 13; p = 0.65; NMDA – Control: 0.55 ± 0.02%; Deprived: 0.65 ± 0.12; p = 0.6). The ratio between the peak of each of these excitatory components and the peak of optical signal measured in ACSF was not changed by short MD (AMPA – Control: 0.67 ± 0.08, n = 15; Deprived: 0.78 ± 0.12, n = 13; p = 0.4; NMDA – Control: 0.16 ± 0.06; Deprived: 0.23 ± 0.05; p = 0.4; Figures 7A,B). Thus changes in excitatory drive do not contribute significantly to the MD-dependent decrease in the optical signal, confirming previously reports (Maffei et al., 2006, 2010). On the contrary, the absolute amplitude of the optical signal mediated by GABAA receptors was significantly increased in the Deprived hemisphere (Figures 7A,B; Control: −0.02 ± 0.02%, n = 15; Deprived: −0.08 ± 0.03%, n = 13; p < 0.03). The ratio between the peak of the inhibitory component and the peak of the signal recorded in ACSF, was 0.3 ± 0.1 (versus 0.02 ± 0.06 in Control; p < 0.02, Control: n = 13; Deprived: n = 11; Figure 7B). In Control and Deprived hemispheres the peak amplitude of the TTX – sensitive component was similar in amplitude and duration (not shown), suggesting that the stimulation was recruiting axonal fibers similarly in both conditions. These results indicate that the decrease in the amplitude of the optical signal measured in L4 was not due to an inefficient stimulation of L4 in the deprived hemisphere and was not explained by a significant decrease in the excitatory components of the optical signal, but rather, and consistently with published data (Maffei et al., 2006, 2010), to an increase in GABAA – mediated inhibition (see also Figure 8). The waveform of the inhibitory component we isolated pharmacologically is similar to that reported in the ventral tegmental area (VTA; Watanabe et al., 2009) and in the cerebellar cortex (Rokni et al., 2007). The amplitude of the inhibitory component of the VSD signal reported in this manuscript is smaller than those in the VTA and cerebellum, because it was isolated in acute slices therefore only the local microcircuit is preserved. In addition, the inhibitory component of the optical signal was isolated only after the di- and poly-synaptic components of the signal were blocked by co-application of AMPA and NMDA receptors blockers. This experimental design allowed the quantification of inhibition elicited locally by the direct activation of a limited number of GABAergic axons that run by the tip of the stimulating electrode.
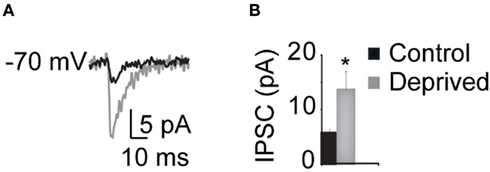
Figure 8. MD increases the GABAA synaptic component measured intracellularly. (A) Sample evoked IPSCs recorded in voltage clamp in response to extracellular stimulation in L4. Black: Control; gray: Deprived. (B) Cumulative bar plot of the average IPSC amplitude. Black: Control; gray: Deprived. Asterisk indicates significant changes.
The same analysis performed in L2/3 showed that the excitatory synaptic components of the optical signal in control and deprived hemispheres were not significantly different (Figures 7C,D; AMPA – Control: 0.41 ± 0.06%, n = 15; Deprived: 0.33 ± 0.04%, n = 13, p = 0.29; NMDA – Control: 0.12 ± 0.04%; Deprived: 0.09 ± 0.02%, p = 0.52). Differently from L4, in L2/3 the GABAA component of the optical signal was very weak and in several slices was below the threshold for detection (GABAA – Control: 0.02 ± 0.02%; Deprived: 0.04 ± 0.01%, p = 0.35; Figures 7C,D; 0.025% ΔF/F). The lack of detectable inhibition in L2/3 is expected as di- and poly-synaptic components of the circuit have been blocked by co-delivery of AMPA and NMDA receptors blockers and the stimulation is localized in L4. Thus the inhibitory component of the signal in L2/3, which is mostly driven by di- and poly-synaptic circuits, could not be directly measured. However previous studies indicate that brief visual deprivation like the one used here has no significant effects on inhibitory drive in L2/3 (Maffei and Turrigiano, 2008).
The Increase in Inhibitory Optical Signal Correlates with Changes in IPSC Amplitude
The specificity of the increase in inhibitory drive following MD was verified with whole cell patch clamp recordings from L4 pyramidal neurons. The evoked IPSC (eIPSC) was isolated by applying AMPA and NMDA receptors blockers directly in the bath. The eIPSCs was quantified following extracellular stimulation of L4. Two intensities of stimulation, 50 and 80 μA, were used for each slice during these experiments. These were the same intensities used to elicit optical signals in the plateau region of the I/O curve observed with VSDI. As IPSP amplitudes were not significantly different at both intensities within Control and Deprived hemispheres, data from both intensities were pooled and are presented as Control and Deprived cumulative data. The amplitude of the eIPSC was significantly increased in the deprived hemisphere (Control: 5.6 ± 0.7 pA, n = 10; Deprived: 13.6 ± 3.4 pA, n = 8; p < 0.05; Figure 8). Furthermore, in experiments in which the compound postsynaptic current (PSC) was elicited before perfusion of AMPA and NMDA receptor blockers, the relative contribution of the eIPSC to the compound PSC was significantly increased after short MD (IPSC/PSC – Control: 0.05 ± 0.01; Deprived: 0.1 ± 0.02; p < 0.02). The amplitude of the AMPA component of excitatory postsynaptic response was similar in control and deprived hemispheres (Control: 210.3 ± 19.9 pA, n = 11; Deprived: 164.2 ± 29.0 pA, n = 9; p < 0.2). These results support the data obtained with optical imaging and are consistent with previously published data (Maffei et al., 2006). The significant increase in inhibitory drive is likely one of the mechanisms leading to a significant reduction of L4 and L2/3 activation after short MD.
Acute Dowregulation of GABAA-Mediated Inhibition Rescues the Effect of MD in vitro
If the decreased amplitude of the optical signal in L4 of the deprived hemisphere depends on the increase in the GABAA-mediated portion of the signal, reducing inhibitory drive pharmacologically should be sufficient to restore the amplitude of VSD signals to Control levels. To investigate this possibility, ACSF containing increasing concentrations of picrotoxin (2, 5, and 10 μM) was delivered to the recording chamber after the acquisition of baseline optical signals. No epileptic activity was ever observed at the concentrations used. The lowest concentration of picrotoxin did not change the optical signal significantly in either Control or Deprived slices (2 μM, not shown). Five micromolar picrotoxin did not change significantly the peak optical signal in Control slices (L4 Control – ACSF: 0.32 ± 0.02% ΔF/F; L4 Control – 5 μM Ptx: 0.31 ± 0.03% ΔF/F, n = 5, p = 0.75; L2/3 Control – ACSF: 0.39 ± 0.02% ΔF/F; L2/3 Control – 5 μM Ptx: 0.41 ± 0.02% ΔF/F, n = 5, p = 0.73), but was sufficient to restore the peak of the optical signal in slices from the deprived hemisphere to Control levels both in L4 and in L2/3 (Figures 9B,D, see dotted line; L4 Deprived – ACSF: 0.25 ± 0.03% ΔF/F; L4 Deprived – 5 μM Ptx: 0.32 ± 0.03% ΔF/F, n = 5, p < 0.01; L2/3 Deprived – ACSF: 0.29 ± 0.01% ΔF/F; L2/3 Deprived – 5 μM Ptx: 0.40 ± 0.03% ΔF/F, n = 5; p < 0.001). The highest concentration tested, 10 μM, increased both the peak and the decay phase of the optical signal further, and to similar amplitudes in Control and Deprived slices (data not shown; L4 Control – 10 μM Ptx: 0.40 ± 0.02% ΔF/F, n = 5; L4 Deprived – 10 μM Ptx: 0.38 ± 0.05% ΔF/F, n = 5, p = 0.9; L2/3 Control – 10 μM Ptx: 0.43 ± 0.02% ΔF/F, n = 5; L2/3 Deprived – 10 μM Ptx: 0.50 ± 0.04% ΔF/F, n = 5; p = 0.2). Overall, our data demonstrate that 2–4 days MD decreases the activation of the superficial layer of V1m in a correlated fashion. This effect is mediated by a shift in the balance between excitation and inhibition toward inhibition within L4.
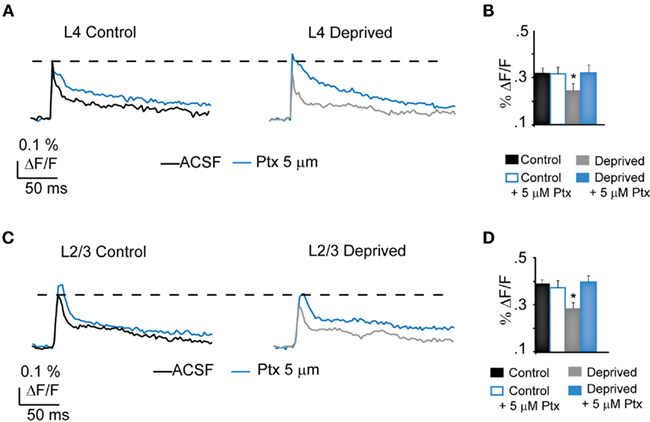
Figure 9. Partial blockade of GABAA-mediated inhibition rescues Deprived spatio-temporal patterns of activation. (A) Sample optical responses from L4 in Control and Deprived slices in the presence of increasing concentrations of Ptx. Control, Black: ACSF; Blue: 5 μm Ptx. Deprived, Gray: ACSF; Blue: 5 μm Ptx. The dotted line indicates the amplitude of the optical signal measured in ACSF in Control. (B) Cumulative bar plot of the average peak L4 optical signals in Control (black), Control in the presence of 5 μM Ptx (White/blue line), Deprived (gray) and Deprived in the presence of 5 μM Ptx (blue). (C) Sample optical responses from L2/3 in Control and Deprived slices. Control, Black: ACSF; Blue: 5 μM Ptx. Deprived, Gray: ACSF; Blue: 5 μm Ptx. Notice the full recovery of the signal in L2/3 after partial blockade of inhibition (dotted line). (D) Cumulative bar plot showing the average amplitude of L4 optical signals in Control (black), Control in the presence of 5 μM Ptx (White/blue line), Deprived (gray) and Deprived in the presence of 5 μM Ptx (blue). Asterisks indicate significant differences.
Discussion
We have shown that brief MD reduces the intra- and inter-laminar propagation of electrical signals in V1m. Furthermore, our data indicate that MD reduces the spatio-temporal patterns of circuit activation in a correlated fashion in both L4 and L2/3. What are the processes responsible for such changes? As the stimulating electrode was placed directly in L4, the changes in circuit activation might result either from altered ability to recruit axons within the stimulated area, or from plastic changes in the circuit that affect neuronal depolarization. During the first few days of MD, when the circuit is activated less efficiently in the deprived hemisphere, it is unlikely that the decreased activation depends on impaired efficiency of the stimulation: the amplitude of the tetrodotoxin-sensitive component of the optical and electrophysiological signals is similar in control and deprived hemispheres, indicating that the effectiveness of the stimulation is comparable in both experimental conditions. Furthermore the time course of L4 and L2/3 activation was not significantly different in the hemispheres ipsilateral and contralateral to the deprived eye. The hypothesis that the observed modifications in circuit activation depend on plastic changes induced by MD was examined further with a series of experiments. The changes in cortical activation observed after 2–4 days MD could result from an increase of inhibition, a decrease of excitation or a combination of different forms of plasticity. The data presented here are consistent with previously published work (Maffei et al., 2006, 2010) showing that, following short MD, the excitatory component of synaptic activation in L4 remained unchanged and hence it is unlikely to contribute significantly to the decrease in the percent ΔF/F reported here. The reduced amplitude of the optical signal appears to be mediated by a shift in the balance between excitation and inhibition toward inhibition, consistent with data obtained with whole cell patch clamp reported here and with previously published work (Maffei et al., 2006, 2010). Data obtained in acute pharmacological rescue experiments, in which partial blockade of GABAA receptors leads to the complete recovery of optical signals in slices from the deprived hemisphere, are also consistent with changes in inhibitory synaptic strength reported in the early stages following MD (Maffei et al., 2006, 2010). The small size of the inhibitory signal we report with optical recordings may depend on the difference between neuronal membrane potential and chloride reversal potential. Indeed, in V1m at the stage in development studied here, the reversal potential for GABAA synaptic responses in hyperpolarizing (Maffei et al., 2006), and the membrane potential of neurons in the slice is more depolarized (−65 ± 5 mV in our patch clamp recordings), although only of a few millivolts.
The data reported here demonstrate that visual deprivation does not only change the strength of local synapses, but affects the spatio-temporal propagation of activity with and between layers. We also show that potentiation of inhibition in L4 has consequences that extend beyond the local circuit within this layer. The rapid reduction of L 2/3 activation measured extracellularly (present work), intracellularly (Maffei and Turrigiano, 2008), as well as with optical recordings was traditionally considered to be generated within L 2/3 (Kirkwood et al., 1996; Crozier et al., 2007; Yoon et al., 2009). However, our results demonstrate that the MD-induced reduction of L2/3 activation is a consequence of reduced L4 activation. Indeed, after short MD the activity in L2/3 scaled proportionally with the reduction of L4. Perfusion of sub-optimal concentrations of picrotoxin effectively abolished the difference between control and deprived hemispheres in L4 and consequently in L2/3. The complete recovery of L2/3 activation following partial blockade of inhibition suggests that the short MD-dependent changes in the inhibitory component in L4 have a prominent role in controlling the flow of cortical excitation in the superficial layers in V1m.
Furthermore, direct evidence that short MD leaves L2/3 excitability unaffected comes also from local electrical stimulation (see Figure 6). L2/3 optical and LFP responses to stimuli in neighboring portions of L2/3 were identical, regardless of whether they were recorded in Control or Deprived slices. While the absence of modifications in L2/3 spatio-temporal dynamics induced by short MD might depend on the complete absence of plasticity, previously published results make this possibility unlikely (Finnerty et al., 1999; Maffei and Turrigiano, 2008; Maffei and Fontanini, 2009). Alternatively, the stability of direct L2/3 activation may depend on the induction of opposing forms of synaptic and intrinsic forms of plasticity (Maffei and Turrigiano, 2008), that may result in a compensated spatio-temporal pattern of L2/3 activation when analyzed with optical imaging. The analysis of synaptic and intrinsic MD-dependent changes point convincingly to the active induction of multiple forms of plasticity, some of which homeostatic (Goel and Lee, 2007; Maffei and Turrigiano, 2008; Gainey et al., 2009), that are involved in the regulation of L2/3 excitability (Haider et al., 2006; Maffei and Turrigiano, 2008).
Our data demonstrate for the first time a circuit wide homeostatic regulation of L2/3. At the functional level, these results are consistent with the reported preservation of visual responsiveness of monocular neurons in L2/3 (Mrsic-Flogel et al., 2007). When taken together with previously published work (Maffei and Turrigiano, 2008), the data reported here suggest that a shift toward inhibition of the balance between excitation and inhibition is determinant for the reduction in spatio-temporal patterns of cortical circuit activation. The initial effect of reduced sensory input may depend on the potentiation of the inhibitory synaptic drive that favors a correlated decrease in the spatio-temporal dynamics of the circuit in the superficial layers of V1m. MD thus may modulate V1m activation by potentiating inhibitory drive and by promoting the induction of different forms of plasticity in L2/3 that may determine the homeostatic regulation of L2/3 excitability.
At this point the obvious question emerges of why L2/3 may regulate its excitability homeostatically and L4 does not appear to change in a similar fashion. While direct data are not available to conclusively address this issue, multiple hypotheses can be made on the basis of the extant literature. The first difference between the two layers is related to the patterns of afferent signals. Visual deprivation results in a reduction of the thalamic input (Khibnik et al., 2010) which may affect more directly L4 and only later extend its influence to L2/3. In this view, L4 acts as a buffer allowing L2/3 to adapt to less dramatic and sudden changes in activity. Additionally L2/3 is the recipient of short and long-distance cortico-cortical (Harauzov et al., 2010) connections and is the site of homeostatic plasticity during the developmental window analyzed here. A combination of homeostatic plasticity and long range input could keep L2/3 “going” while the input from L4 is reduced. Equally possible, and not mutually exclusive, is the possibility that L2/3 might be intrinsically more plastic and hence compensate better than L4. The ability of L2/3 to remain plastic into adulthood (Petersen and Sakmann, 2001; Yashiro et al., 2005; Goel and Lee, 2007; Tsanov and Manahan-Vaughan, 2007) and to be the site of homeostatic plasticity during the critical period has been widely reported (Desai et al., 2002; Goel and Lee, 2007; Maffei and Turrigiano, 2008).
Regardless of the specific mechanisms underlying the differential susceptibility of L4 and L2/3 to visual deprivation, what is clear from our data is that brief MD decreases the vertical and horizontal propagation of feedforward afferent signals. The potentiation of inhibition induced in the input layer of V1m rapidly after MD appears to control cortical activation in a complex manner. It does not only control the level of excitability of the circuit, but it also gates the access of incoming sensory inputs to the cortical circuit. The combination of plasticity of inhibition in L4 and homeostatic regulation of L2/3 excitability is likely determinant to produce the functional changes in visual responsiveness observed after long periods of MD and may have fundamental consequences for the competition for space of visual projections (Adesnik and Scanziani, 2010). Similar changes may also occur during different psychological (Gandolfo et al., 2000) or emotional states (Fontanini and Katz, 2008), and may modulate sensory processing (Chisum and Fitzpatrick, 2004) by sharpening or widening the portion of cortical circuit that is activated by sensory inputs.
Conflict of Interest Statement
The authors declare that the research was conducted in the absence of any commercial or financial relationships that could be construed as a potential conflict of interest.
Acknowledgment
We thank Dr. Paul Adams, Dr. Dirk Bucher, Dr. Craig Evinger, Dr. Lorna Role, Dr. Gina Turrigiano, Trevor Griffen, Michelle Kloc, and Martha Stone for useful comments on the manuscript. Support: NIH/R01 EY019885 to Arianna Maffei and The Esther A. and Joseph Klingenstein Fund to Alfredo Fontanini.
References
Adesnik, H., and Scanziani, M. (2010). Lateral competition for cortical space by layer-specific horizontal circuits. Nature 464, 1155–1160.
Alonso, J. (2002). Neural connections and receptive field properties in the primary visual cortex. Neuroscientist 8, 443–456.
Burkhalter, A. (1989). Intrinsic connections of rat primary visual cortex: laminar organization of axonal projections. J. Comp. Neurol. 279, 171–186.
Cheetham, C., Hammond, M., Edwards, C., and Finnerty, G. (2007). Sensory experience alters cortical connectivity and synaptic function site specifically. J. Neurosci. 27, 3456–3465.
Chisum, H., and Fitzpatrick, D. (2004). The contribution of vertical and horizontal connections to the receptive field center and surround in V1. Neural Netw. 17, 681–693.
Chklovskii, D., and Koulakov, A. (2004). Maps in the brain: what can we learn from them? Annu. Rev. Neurosci. 27, 369–392.
Crair, M., Ruthazer, E., Gillespie, D., and Stryker, M. (1997). Relationship between the ocular dominance and orientation maps in visual cortex of monocularly deprived cats. Neuron 19, 307–318.
Crozier, R., Wang, Y., Liu, C., and Bear, M. (2007). Deprivation-induced synaptic depression by distinct mechanisms in different layers of mouse visual cortex. Proc. Natl. Acad. Sci. U.S.A. 104, 1383–1388.
Desai, N., Cudmore, R., Nelson, S., and Turrigiano, G. (2002). Critical periods for experience-dependent synaptic scaling in visual cortex. Nat. Neurosci. 5, 783–789.
Fagiolini, M., Fritschy, J., Löw, K., Möhler, H., Rudolph, U., and Hensch, T. (2004). Specific GABAA circuits for visual cortical plasticity. Science 303, 1681–1683.
Farley, B., Yu, H., Jin, D., and Sur, M. (2007). Alteration of visual input results in a coordinated reorganization of multiple visual cortex maps. J. Neurosci. 27, 10299–10310.
Feldman, D. (2009). Synaptic mechanisms for plasticity in neocortex. Annu. Rev. Neurosci. 32, 33–55.
Finnerty, G., Roberts, L., and Connors, B. (1999). Sensory experience modifies the short-term dynamics of neocortical synapses. Nature 400, 367–371.
Fontanini, A., and Katz, D. (2008). Behavioral states, network states, and sensory response variability. J. Neurophysiol. 100, 1160–1168.
Frenkel, M., and Bear, M. (2004). How monocular deprivation shifts ocular dominance in visual cortex of young mice. Neuron 44, 917–923.
Gainey, M., Hurvitz-Wolff, J., Lambo, M., and Turrigiano, G. (2009). Synaptic scaling requires the GluR2 subunit of the AMPA receptor. J. Neurosci. 29, 6479–6489.
Gandolfo, F., Li, C., Benda, B., Schioppa, C., and Bizzi, E. (2000). Cortical correlates of learning in monkeys adapting to a new dynamical environment. Proc. Natl. Acad. Sci. U.S.A. 97, 2259–2263.
Goel, A., and Lee, H. (2007). Persistence of experience-induced homeostatic synaptic plasticity through adulthood in superficial layers of mouse visual cortex. J. Neurosci. 27, 6692–6700.
Goodman, C., and Shatz, C. J. (1993). Developmental mechanisms that generate precise patterns of neuronal connectivity. Cell 72, 77–98.
Haider, B., Duque, A., Hasenstaub, A., and McCormick, D. (2006). Neocortical network activity in vivo is generated through a dynamic balance of excitation and inhibition. J. Neurosci. 26, 4535–4545.
Harauzov, A., Spolidoro, M., DiCristo, G., De Pasquale, R., Cancedda, L., Pizzorusso, T., Viegi, A., Berardi, N., and Maffei, L. (2010). Reducing intracortical inhibition in the adult visual cortex promotes ocular dominance plasticity. J. Neurosci. 30, 361–371.
Hubel, D. H., and Wiesel, T. N. (1970). The period of susceptibility to the physiological effects of unilateral eye closure in kittens. J. Physiol. 206, 419–436.
Katagiri, H., Fagiolini, M., and Hensch, T. (2007). Optimization of somatic inhibition at critical period onset in mouse visual cortex. Neuron 53, 805–812.
Katz, L. C., and Shatz, C. J. (1996). Synaptic activity and the construction of cortical circuits. Science 274, 1133–1138.
Khibnik, L., Cho, K., and Bear, M. (2010). Relative contribution of feedforward excitatory connections to expression of ocular dominance plasticity in layer 4 of visual cortex. Neuron 66, 493–500.
Kirkwood, A., Rioult, M., and Bear, M. (1996). Experience-dependent modification of synaptic plasticity in visual cortex. Nature 381, 526–528.
Laaris, N., Carlson, G., and Keller, A. (2000). Thalamic-evoked synaptic interactions in barrel cortex revealed by optical imaging. J. Neurosci. 20, 1529–1537.
Maffei, A., and Fontanini, A. (2009). Network homeostasis: a matter of coordination. Curr. Opin. Neurobiol. 19, 168–173.
Maffei, A., Lambo, M., and Turrigiano, G. (2010). Critical period for inhibitory plasticity in rodent binocular V1. J. Neurosci. 30, 3304–3309.
Maffei, A., Nataraj, K., Nelson, S., and Turrigiano, G. (2006). Potentiation of cortical inhibition by visual deprivation. Nature 443, 81–84.
Maffei, A., Nelson, S., and Turrigiano, G. (2004). Selective reconfiguration of layer 4 visual cortical circuitry by visual deprivation. Nat. Neurosci. 7, 1353–1359.
Maffei, A., and Turrigiano, G. (2008). Multiple modes of network homeostasis in visual cortical layer 2/3. J. Neurosci. 28, 4377–4384.
Mower, G., Burchfiel, J., and Duffy, F. (1982). Animal models of strabismic amblyopia: physiological studies of visual cortex and the lateral geniculate nucleus. Brain Res. 281, 311–327.
Mrsic-Flogel, T., Hofer, S., Ohki, K., Reid, R., Bonhoeffer, T., and Hübener, M. (2007). Homeostatic regulation of eye-specific responses in visual cortex during ocular dominance plasticity. Neuron 54, 961–972.
Ohki, K., Chung, S., Ch’ng, Y., Kara, P., and Reid, R. (2005). Functional imaging with cellular resolution reveals precise micro-architecture in visual cortex. Nature 433, 597–603.
Palagina, G., Eysel, U., and Jancke, D. (2009). Strengthening of lateral activation in adult rat visual cortex after retinal lesions captured with voltage-sensitive dye imaging in vivo. Proc. Natl. Acad. Sci. U.S.A. 106, 8743–8747.
Petersen, C., and Sakmann, B. (2001). Functionally independent columns of rat somatosensory barrel cortex revealed with voltage-sensitive dye imaging. J. Neurosci. 21, 8435–8446.
Rokni, D., Llinas, R., and Yarom, Y. (2007). Stars and stripes in the cerebellar cortex: a voltage sensitive dye study. Front. Syst. Neurosci. 1:1. doi: 10.3389/neuro.06/001.2007
Tominaga, T., Tominaga, Y., Yamada, H., Matsumoto, G., and Ichikawa, M. (2000). Quantification of optical signals with electrophysiological signals in neural activities of Di-4-ANEPPS stained rat hippocampal slices. J. Neurosci. Methods 102, 11–23.
Trachtenberg, J., Trepel, C., and Stryker, M. (2000). Rapid extragranular plasticity in the absence of thalamocortical plasticity in the developing primary visual cortex. Science 287, 2029–2032.
Tsanov, M., and Manahan-Vaughan, D. (2007). Intrinsic, light-independent and visual activity-dependent mechanisms cooperate in the shaping of the field response in rat visual cortex. J. Neurosci. 27, 8422–8429.
Watanabe, Y., Kajiwara, R., and Takashima, I. (2009). Optical imaging of rat prefrontal neuronal activity evoked by stimulation of the ventral tegmental area. Neuroreport 20, 875–880.
Yashiro, K., Corlew, R., and Philpot, B. (2005). Visual deprivation modifies both presynaptic glutamate release and the composition of perisynaptic/extrasynaptic NMDA receptors in adult visual cortex. J. Neurosci. 25, 11684–11692.
Keywords: visual cortex, synaptic plasticity, GABA, visual deprivation, microcircuitry, signal propagation
Citation: Wang L, Fontanini A and Maffei A (2011) Visual experience modulates spatio-temporal dynamics of circuit activation. Front. Cell. Neurosci. 5:12. doi: 10.3389/fncel.2011.00012
Received: 06 May 2011; Accepted: 14 June 2011;
Published online: 28 June 2011.
Edited by:
Andreas Frick, INSERM, FranceReviewed by:
Dirk Feldmeyer, RWTH Aachen University, GermanyThomas Eichenberg Krahe, Virginia Commonwealth University, USA
Copyright: © 2011 Wang, Fontanini and Maffei. This is an open-access article subject to a non-exclusive license between the authors and Frontiers Media SA, which permits use, distribution and reproduction in other forums, provided the original authors and source are credited and other Frontiers conditions are complied with.
*Correspondence: Alfredo Fontanini, Department of Neurobiology and Behavior, Life Science Building Room 545, State University of New York Stony Brook, Stony Brook, NY 11794, USA. e-mail:YWxmcmVkby5mb250YW5pbmlAc3Rvbnlicm9vay5lZHU=;
Arianna Maffei, Department of Neurobiology and Behavior, Life Science Building Room 546, State University of New York Stony Brook, Stony Brook, NY 11794, USA. e-mail:YXJpYW5uYS5tYWZmZWlAc3Rvbnlicm9vay5lZHU=