Alteration of sensory-evoked metabolic and oscillatory activities in the olfactory bulb of GLAST-deficient mice
- 1 Laboratoire Imagerie et Modélisation en Neurobiologie et Cancérologie, UMR 8165, Université Paris-Sud, CNRS, Orsay, France
- 2 Institute of Biomedical Imaging, Molecular Imaging Research Center, CNRS CEA URA 2210, Fontenay-aux-Roses, France
Astrocytes are key cellular elements in both the tripartite synapse and the neurovascular unit. To fulfill this dual role in synaptic activity and metabolism, they express a panel of receptors and transporters that sense glutamate. Among them, the GLT-1 and GLAST transporters are known to regulate extracellular glutamate concentrations at excitatory synapses and consequently modulate glutamate receptor signaling. These major uptake systems are also involved in energy supply to neurons. However, the functional role of GLAST in concurrent regulation of metabolic and neuronal activity is currently unknown. We took advantage of the attractive structural and functional features of the main olfactory bulb to explore the impact of GLAST on sensory information processing while probing both glutamate uptake and neuronal activity in glomeruli and deeper cellular layers, respectively. Using odor-evoked 2-deoxyglucose imaging and local field potential recordings in GLAST knockout mice, we show in vivo that deletion of GLAST alters both glucose uptake and neuronal oscillations in olfactory bulb networks.
Introduction
Astrocytes are structurally positioned to regulate synaptic transmission and neurovascular coupling: they extend perisynaptic processes that cover thousands of synapses and endfeet that are apposed to the blood vessel wall (Haydon and Carmignoto, 2006). An increasing number of studies have established their role in the regulation of energy metabolism (Pellerin, 2008), blood flow (Gordon et al., 2008), and synaptic activity (Fellin, 2009). To fulfill this triple role, astrocytes express a repertoire of transporters and receptors to mediate an active molecular crosstalk with neurons. Among them, glutamate transporters (GluTs) GLAST (for GLutamate–ASpartate Transporter, EAAT-1) and GLT-1 (for GLutamate Transporter, EAAT-2) are exclusively expressed by astrocytes and are present at high densities near excitatory synapses (Danbolt, 2001). These transporters prevent excessive accumulation of glutamate and tightly regulate glutamate receptor occupancy and signaling (Huang and Bergles, 2004; Attwell and Gibb, 2005). GLAST is the major transporter expressed during development, but little is known of its functional roles in adult tissues in vivo. GLT-1 accounts for the majority of glutamate uptake in the adult forebrain (Rothstein et al., 1994; Ullensvang et al., 1997), but GLAST might be an important contributor in specific pathways.
An advantageous model to study possible roles of GLAST in both metabolic and neuronal activity is the main olfactory bulb (OB), where this transporter is highly expressed in the adult OB (Utsumi et al., 2001). Olfactory glomeruli support the initial stage of odor processing. These discrete spherical structures contain synapses between the olfactory receptor neurons (ORN) and the mitral/tufted cells (M/TCs) and receive convergent inputs from ORNs expressing the same odorant receptor (Mombaerts et al., 1996). In deeper layers, M/TCs are modulated by interneurons (granule cells, GCs) through reciprocal dendrodendritic synapses contained in the external plexiform layer (EPL; Rall and Shepherd, 1968). Astrocytes are not homogeneously distributed in the OB, the highest density of GFAP immunoreactivity is found in the glomerular layer (GL) followed by the EPL (Bailey and Shipley, 1993). Therefore, both GL and EPL represent key functional units for in vivo studies of the role of neuron-astrocyte interactions in the OB network.
In these two sets of synapses, both spatial and temporal activities that accompany odor processing have been identified. Spatially, odors elicit distributed maps of activated glomeruli (Kauer and White, 2001), first identified using radiolabeled [14C]-2-deoxyglucose (2DG; Johnson et al., 2002). Temporally, neuronal oscillations are prominent in the local field potential (LFP) recorded in the OB (Kay et al., 2009). Since oscillatory rhythms reflect relevant synchronous activities between elements of neural assemblies, they are a good sensor of the functional state of a network (Singer, 1993; Uhlhaas et al., 2009). Information regarding the role of astrocytic GluTs in these two types of activity is still lacking. In the present study we therefore asked whether GLAST activity could alter spatial maps and neuronal oscillations in the OB. Using adult GLAST knockout mice, we measured in vivo glucose uptake in olfactory glomeruli and neuronal network activity in the deeper layers and found that the absence of GLAST significantly alters both types of functional olfactory responses.
Materials and Methods
Animals
Animals were adult mice (2-8 months) obtained from C57BL/6 GLAST+/- heterozygote breeder pairs. Individuals genotypes were determined by PCR as previously described (Watase et al., 1998). For the experiments performed here, GLAST knockout (GLAST-/-) mice were compared with GLAST+/+ genotype littermates. Mice were fed ad libitum and maintained under standard conditions (12/12 h light-darkness. cycle, 22°C). All protocols were carried out in accordance with European recommendations for the care and use of laboratory animals (86/609/EEC).
Immunoblotting
Fresh samples of OB were obtained from GLAST+/+ (n = 5) and GLAST-/- (n = 5) mice and were homogenized in 30 μl of lysis buffer [50 mM Tris-HCl, pH 7.4,100 mM NaCl, 1% SDS, protease inhibitor cocktail (1:200; Roche, Basel, Switzerland)]. Total protein content was determined with the BCA Protein Assay Reagent (Thermo Scientific, Waltham, MA, USA), according to the manufacturer’s instructions, and 20 μg of total homogenate protein was subjected to SDS-PAGE (4% stacking and 12% running gels) and transferred onto nitrocellulose membranes. Membranes were blocked by incubation for 1 h with 5% non-fat milk powder in 25 mM Tris, pH 7.4, 150 mM NaCl, and 0.1% Tween-20 (TBST buffer). Membranes were incubated overnight at 4°C with GLT-1, GLAST (rabbit; 1:5,000, Frontier Sciences, Ishikari, Hokkaido, Japan) and actin (mouse; 1:5,000; Sigma-Aldrich, St Louis, MO, USA) primary antibodies. Membranes were washed and incubated with peroxidase-conjugated secondary antibody (1:5,000) for 1 h. Chemiluminescence reactions were carried out (ECL kit, GE Healthcare, Uppsala, Sweden) and revealed using CCD imaging system Fusion Fx7.
Immunofluorescence
Following an overdose of sodium pentobarbital, one GLAST+/+ mice was perfused transcardially with 4% paraformaldehyde in PB 0.1 M. The brain was postfixed by incubation in the same solution overnight and then cryoprotected by incubation in a 30% sucrose solution (48 h). Coronal sections of the OB (40 μm) were obtained using a freezing microtome and washed in 0.1 M PBS. Sections were blocked and incubated overnight at 4°C with a solution containing the GLAST primary antibody (1:5,000; Frontiers Institute, Japan) in 10% normal goat serum (NGS) in 0.1 M PBS. They were then incubated for 1 h at room temperature with an anti-rabbit AlexaFluor 488 secondary antibody (1:500, Invitrogen, France). The sections were mounted in FluorSave reagent (Calbiochem, Merck, Darmstadt, Germany), covered with a coverslip and analyzed with confocal microscopy (LSM 510, Zeiss, Le Pecq, France).
2DG Uptake
Experiments were always conducted by pairing one GLAST-/- and one GLAST+/+ mouse in parallel. They were carried out on awake restrained mice, which had been previously habituated to the recording apparatus for 3 days. On the day of the experiment, mice were anesthetized with isoflurane and a catheter was inserted intraperitoneally Mice then were allowed to recover from the anesthesia for about 1 h. Body temperature was monitored rectally throughout and the experiment started when it was stable at 37°C
To ensure that mice received a reproducible amount of odorant, they were constrained during odor presentation and their nose was inserted into a custom-made odor mask. Twenty microliters of a solution of 2% benzaldehyde (Sigma-Aldrich) diluted with mineral oil (Sigma-Aldrich) was loaded on a filter paper and presented to the animals. Air flow through the filter ensured the delivery of odorized air. The same odor flow was delivered for the two mice of each pair, so that they received the same amount of odor. Mice were engaged in a classical 2DG autoradiography paradigm based on the seminal work of Sokoloff et al. (1977) and first applied on the OB by Stewart et al. (1979). For 2DG imaging of the OB, odor stimulation started 3 min before 2DG injection (16.5 μCi/100 g body weight) and was further maintained for 45 min. Odor pulses lasted for 2-4 s and were delivered every 90 s. After 45 min, when the maximum accumulation of the tracer in tissues was reached, animals were injected with a lethal dose of sodium pentobarbital. Brains were then rapidly removed and frozen in isopentane at –40°C. Coronal sections (20 μm) of the OB were obtained using a cryomicrotome, mounted on superfrost slides, quickly dried and exposed onto autoradiographic films (Kodak BioMax MR) for 10 days with calibrated standards (146C; American Radiochemical Company, St Louis, MO, USA). Autoradiograms were digitized and analyzed using a computer based image analysis system (MCID Analysis, St Catharines, ON, Canada). Optical densities determined from the autoradiograms were calibrated using the co-exposed densitometric microscales and converted to nCi/g of tissue. Alternative sections were collected for histological examination after Nissl staining to precisely localize foci of 2DG uptake. Statistical differences were assessed using the Mann-Whitney test.
Quantification of Layer Volume in the OB
Volume quantifications were done using mapping software (Mercator Pro; Explora Nova, La Rochelle, France) associated with a Zeiss microscope (Carl Zeiss, Oberkochen, Germany). Three distinct areas of the OB (1) granular area (including mitral, internal plexiform, and GC layers), (2) EPL, and (3) GL were delimited on nine sections (20 μm thick, 160 μm intervals between two sampled sections) of five GLAST-/- and five GLAST+/+ mice: The volume of each region was then calculated according to a method based on the Cavalieri’s principle (Coggeshall, 1992; Veyrac et al., 2005) using the areas of each section, distance between traced sections, and number of sections. Values between GLAST-/- and GLAST+/+ were compared using Student’s t-tests.
Electrophysiology
Electrode Implantation
Recordings were conducted on freely breathing anesthetized mice (ketamine and medetomidine 75 and 0.85 mg/kg i.p., respectively). Animals were placed in a stereotaxic frame. The skull was exposed and small holes drilled for electrode placement. Recording electrodes (diameter 125 μm, stainless steel, Plastic One) were positioned stereotaxically in the OB. Recordings were performed at the vicinity of the ventral M/TCs layer (4.2 mm anterior to Bregma, 0.8 mm lateral). Stimulating bipolar electrodes (80 μm diameter, stainless steel) were positioned in the lateral olfactory tract (LOT; 2.5 mm anterior to Bregma, 1.6 mm lateral, depth -2.5 mm). A reference electrode was connected to a skull screw located above the posterior portion of the contralateral cortical hemisphere. The electrode depth was adjusted individually using electrophysiological guidance. Both electrodes were lowered while stimulating the LOT and monitoring the evoked potential in the OB (for further details see Stripling and Patneau, 1999). Electrical stimulation consisted of 120 μs monophasic current pulses delivered to one of the two leads. Amplitude was adjusted for each preparation at 250 μA. Neural data were amplified ( × 1000; P511 AC amplifier Grass Technologies, West Warwick, RI, USA), filtered (0.3–300 Hz), digitized at 2 kHz using a CED Power1401 converter (Cambridge Electronic Design, Cambridge, UK), and stored for off-line analysis.
Odor Stimulation
We used two odorants with different vapor pressures for stimulation: benzaldehyde and hexanal (Sigma-Aldrich; theoretical VP at 25°C 0.975 and 10.9 for benzaldehyde and hexanal, respectively, indicating that hexanal is more volatile than benzaldehyde; Lowry and Kay, 2007). Pure molecular compounds were diluted in mineral oil. Filter papers were loaded with 20 μl of diluted solutions and placed into a modified perfusion system (Valvebank AutoMate Scientific, Berkeley, USA) that ensured the delivery of a constant rate of odorized air in front of the animal’s nose. The protocol for odor stimulation consisted in sets of 10 trials of 5 s odor delivery separated by 1 min intervals during which a constant airflow was delivered.
Local Field Potential Analysis
Data were inspected individually to discard trials containing artifacts. Signal analysis was performed off-line with Spike 2 software (Cambridge Electronic Design, Cambridge, UK) and OpenElectrophy software (http://neuralensemble.org/trac/OpenElectrophy; Garcia and Fourcaud-Trocmé, 2009).
Two distinct temporal periods were determined for analysis. During the odor stimulation period (5 s duration), only peaks ranging from 1 to 5 s after the odor onset marker were considered for the analysis, to prevent variability related to odor presentation and/or sniffing behavior of the animal. The pre-odor period started 8 s prior to odor onset and lasted for 4 s (from –8 to –4 s). Spontaneous activity was analyzed for 5 s before onset of the odor period (from –8 to –3 s). Power spectra were estimated in Spike 2 software using a Fast Fourier transform of LFPs with a Hanning window of 2048 points, which led to a frequency resolution of 0.9766 Hz at the sampling frequency of 2000 Hz.
For time–frequency analysis, a wavelet transform was applied to each trial using a family of complex Morlet wavelets, resulting in an estimate of oscillatory power at each time sample and at each frequency between 1 and 160 Hz. This transformation leads (for each trial) to a time–frequency matrix where each point represents the level of energy for a given instant and a given frequency, with hot color spots representing transitory oscillations. The detection of non-stationary oscillations in LFPs by OpenElectrophy is based on a method described by Roux et al. (2007) and previously applied to signals recorded in the olfactory system by Chapuis et al. (2009). It uses the scalogram to extract individual oscillations with a ridge extraction method. This method is useful when signals have oscillations in different frequency bands, when oscillation frequencies shift as a function of time or when there is no a priori knowledge of the signal.
Spontaneous Activity in the Gamma Frequency Range (60–160 Hz)
For each trial, a power threshold (mean + 2 STD) was calculated in the time–frequency window ranging from –8 to –3 s and between 60 and 160 Hz. Wavelet ridge extraction makes possible the detection of bursts of oscillation above this threshold and gives their maximal power, the temporal position and instantaneous frequency of the maximal energy peak (features exported in a MySQL database). Only bursts presenting at least four oscillatory cycles were considered as relevant and kept.
For each single trial, maximal power values were averaged on all the peaks detected during the time–frequency window, so that we obtained one value per trial. Mean values were then normalized relative to the mean power of the time–frequency window corresponding to the same time range and spanning the frequency spectrum between 1 and 160 Hz.
Odor Related Activity in the Gamma (60–160 Hz) and Beta (15–35 Hz) Ranges
The same analysis as for spontaneous activity was performed in the gamma range, but in both pre-odor (–8 to –4 s) and odor (1–5 s) periods. In addition, mean power of the time– frequency windows used for peak extraction was compared (before and after odor onset). For analysis of beta activity, the power threshold (mean + 3 STD) was calculated between 15 and 35 Hz during the baseline period ranging from –8 to –4 s before odor onset. Burst detection was performed above this threshold, to determine their energy, precise temporal position, and instantaneous frequency. Only bursts presenting at least three oscillatory cycles were considered as relevant and kept for analysis.
For each single trial, maximal power values were averaged on all the peaks detected during the odor period to obtain one value per trial. Mean values were then normalized relative to the mean power of the time–frequency window corresponding to the same time range and spanning the frequency spectrum between 1 and 160 Hz.
In Section “Results,” oscillatory activity was expressed in power units relative to baseline (relative power). Statistical analyses were conducted using single or repeated measures ANOVA tests.
Analysis of Electrical Stimulations
Averaged evoked potentials were analyzed off-line using Spike 2 software. Blocks of 20 traces were averaged per condition, and amplitude, latency, and duration of the peaks and troughs were measured. Significant differences in values were assessed using Student’s t-tests.
Results
GLAST Expression in the Olfactory Bulb in Adult Mice
Consistently with previous published data (Utsumi et al., 2001), GLAST immunofluorescence was observed throughout the OB, with relatively stronger expression in the GL followed by the M/TCs layer and EPL (Figure 1A).
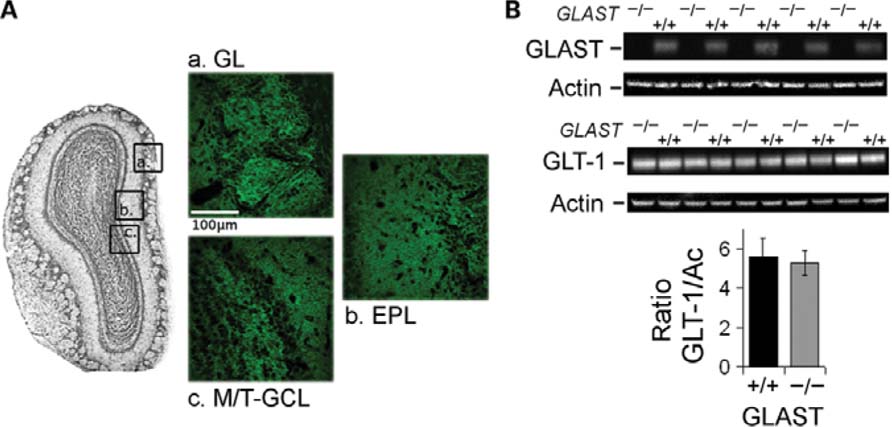
FIGURE 1. Expression of GLAST transporter in the olfactory bulb. (A) Representative section of the adult main olfactory bulb (OB) showing immunolabeling of GLAST in (a) glomerular layer (GL), (b) external plexiform layer (EPL), and (c) mitral/tufted cells and granule cells layers (M/T-GCL). (B) No over expression of GLT-1 transporter in the OB of GLAST-/- mice. Immunoblots for GLAST (top) and GLT-1 (bottom) in the OB of GLAST+/+ and GLAST-/- mice. As seen on the bar graph, the averaged relative level of expression of GLT-1 is not different between GLAST-/- (n = 5) and GLAST+/+ (n = 5) mice.
No Overexpression of GLT-1 in the olfactory Bulb of GLAST-/- Adult Mice
The relative level of expression of GLAST and GLT-1 was measured by immunoblotting of isolated OBs from paired GLAST+/+ and GLAST-/- mice (n = 5 for each; Figure 1B). GluTs antibodies detected distinct proteins in tissue homogenates with molecular weights of ~66 kDa for both GLAST and GLT-1. To ensure comparable protein levels each blot was probed for actin and results normalized against actin. The absence of immunoreactive bands for GLAST confirmed the phenotype of GLAST-/- mice. Semiquantitative evaluation of the relative levels of GLT-1 expression confirmed the absence of overexpression of this GluT in GLAST-/- mice.
No Broad Anatomical Changes in GLAST-KO Mice
GLAST is present on radial glial cells, which guide migrating neurons in the rostral migratory stream to bring new cells into the glomerular and GC layers of the OB (Hartfuss et al., 2001). Impairing GLAST expression could prevent OB neurogenesis and induce structural defects. To check for any structural abnormalities in the anatomy of the OB (Díaz et al., 2011), the volumes of the granular area, EPL, and GL were determined from Nissl-stained sections from GLAST-/- (n = 5) and GLAST+/+ (n = 5) mice. Data were sampled over the same portion of the OB, spanning 1.44 mm length (nine slices separated by 160 μm) in the antero-posterior axis. No significant differences were found for the three regions of interest between GLAST+/+ and GLAST-/- animals (volumes in mm3: granular area 2.4 ± 0.2 vs. 2.6 ± 0.2,p = 0.14; EPL 1.9 ± 0.1 vs. 2.1 ± 0.1, p = 0.109; GL 1.7 ± 0.1 vs. 1.8 ± 0.1, p = 0.265; GLAST+/+ and GLAST-/-, respectively), and for the sum of the three areas (6.0 ± 0.4 vs. 6.5 ± 0.5, p = 0.114; GLAST+/+ and GLAST-/-, respectively).
Reduced Metabolic Response to Odor Stimulation in the Olfactory Glomeruli of GLAST-/- Mice
[14 C]-2-deoxyglucose studies were performed simultaneously on paired adult GLAST+/+ and GLAST-/- littermates (n = 11 each). Odorant stimulation resulted in a significant increase in 2DG uptake in focal and specific regions of the GL (Figure 2A) as previously shown by numerous studies in the OB (Johnson et al., 2002; see also http://gara.bio.uci.edu/). A region was considered activated when the increase in 2DG uptake spanned the size of a glomerulus (120-160 μm, corresponding to six to eight consecutive coronal sections). We observed that GLAST+/+ and GLAST-/- mice displayed similar spatial olfactory maps after a 2% benzaldehyde stimulation. Activated glomeruli were located in the caudal half of the OB, and on the lateral and medial parts of the structure. Activation on the lateral border of the OB was very reproducible across individuals, so we focused on this region for quantitative analyses (Figure 2A). To compare the specific 2DG uptake between the two strains of mice, we calculated for each section the normalized odor specific activations as the value of 2DG uptake in the region of interest (glomerular region) divided by the basal 2DG uptake measured in the whole section. We compared this odor specific glomerular activation ratio between the two strains of mice and found that the intensity of metabolic activation was significantly decreased by 10.5% in GLAST-/- mice compared to GLAST+/+ mice (activation ratio: 2.09 ± 0.36 vs. 1.87 ± 0.33 nCi/g GLAST+/+ and GLAST-/-, respectively; p < 0.0001, Mann-Whitney’s test; Figure 2B). To ensure that this effect was not the consequence of an increased excitability of mutant animals that would occlude any evoked metabolic response, we compared basal 2DG uptake between GLAST+/+ and GLAST-/- mice. No significant difference was found in basal 2DG uptake measured in the whole sections between control and mutant animals (uptake values: 197 ± 37 vs. 194 ± 46 nCi/g, GLAST+/+ and GLAST-/- , respectively; p = 0.1749, Mann-Whitney’s test).
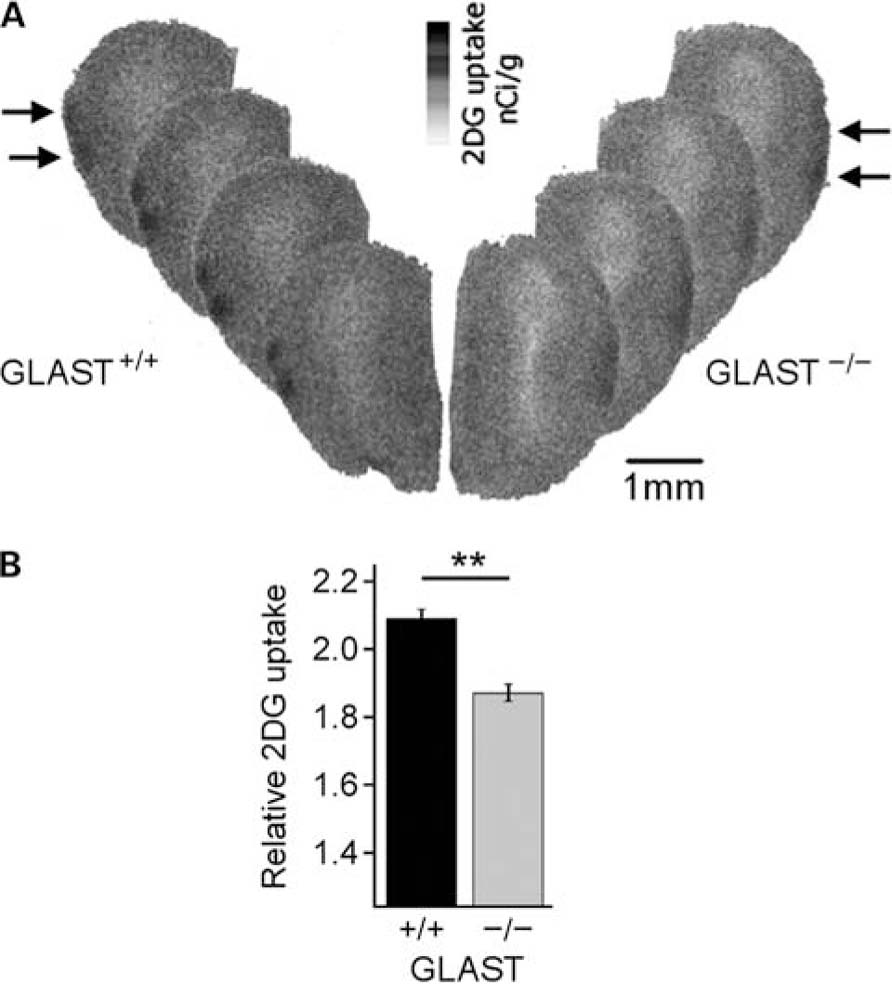
FIGURE 2. Odor-induced 2DG uptake in olfactory glomeruli. (A) [14C]-2-deoxyglucose local uptake in the glomerular region of the OB under odor stimulation (benzaldehyde 2%) is weaker in GLAST-/- mice compared to control animals. In the representative digitized autoradiograms, gray scale illustrates the level of 2DG uptake for one animal of each genotype (left: GLAST+/+; right: GLAST-/-) and for four consecutive slices of 20 μm thickness. Activated glomerular regions are the black areas at the periphery of the structure (arrows). (B) Relative 2DG uptake averaged for all the animals [GLAST+/+ (n = 11); GLAST-/- (n = 11)] shows that odor-evoked increase in 2DG uptake was significantly reduced in GLAST-/- mice.
Neuronal Oscillations are Modified in GLAST-/- Mice During Spontaneous Activity
We first compared electrophysiological activity in the absence of odor stimulation in the OB of GLAST-/-(n = 6) vs. GLAST+/+ (n = 6) mice. Observation of oscillatory activity showed that under ketamine/medetomidine anesthesia, spontaneous activity was dominated by slow deflections of high amplitude oscillations locked on the respiratory rhythm (Figure 3A). High frequency oscillatory bursts (60-160 Hz) were superimposed on each deflection, at the transition between inspiration and expiration. These high frequency bursts will be referred to as gamma oscillations. The frequency of the slow rhythm associated with the respiratory rhythm was the same in GLAST+/+ and GLAST-/- mice, ranging between 2 and 3 Hz (data not shown). In addition, odor-evoked oscillations occur at the inhalation/exhalation transition in both types of mice, indicating that OB activity remains normally locked to the respiration in GLAST-/- mice (Figure 3A).
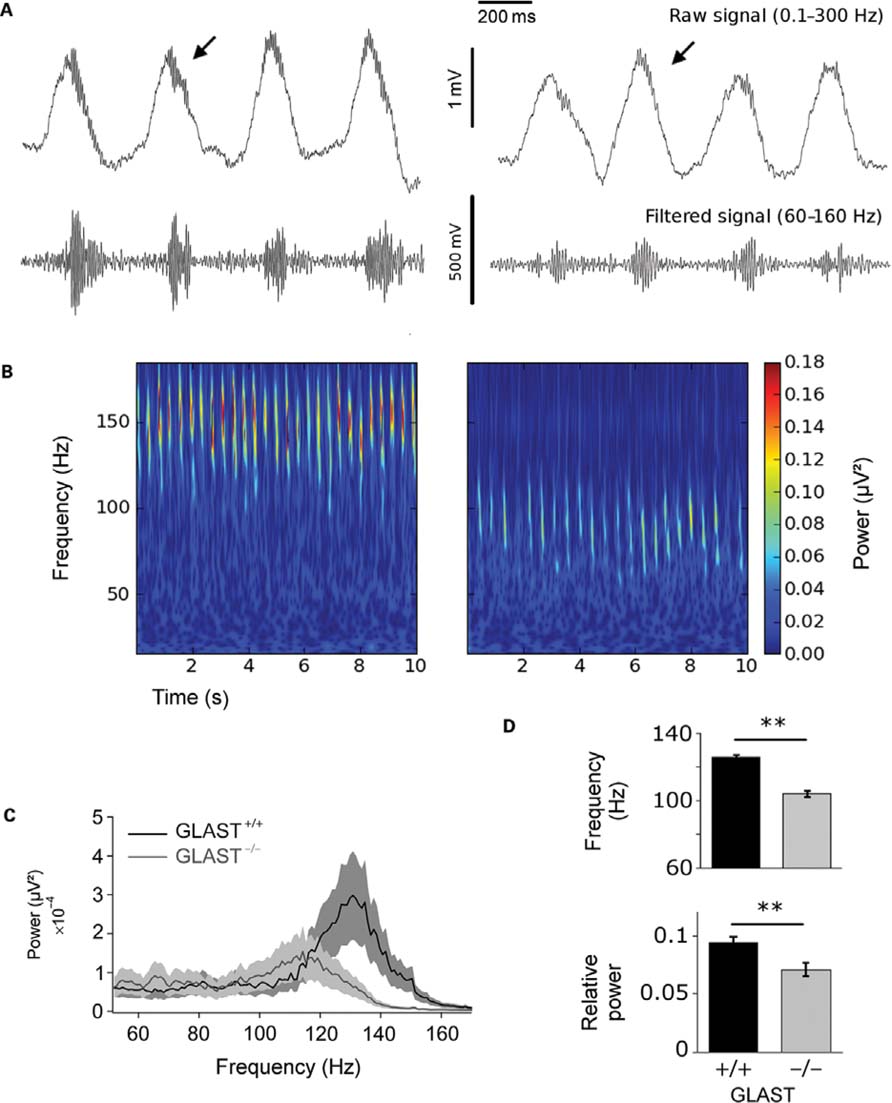
FIGURE 3. Gamma activity recorded during spontaneous activity in the olfactory bulb of GLAST+/+ and GLAST-/- mice. (A) Gamma bursts are present on each respiratory cycle, both in a GLAST+/+ mouse (left) and a GLAST-/- mouse (right) as displayed on representative local field potential recording examples. Top: raw signals 0.3–300 Hz; bottom: filtered signals 60–160 Hz. (B) Shift of gamma bursts frequency in GLAST-/- mice. The signal is represented as a time (x-axis)–frequency (y-axis) decomposition between 10 and 160 Hz. The color scale represents signal power (μV2). (C). Normalized average power spectra (60–160 Hz) during spontaneous activity in GLAST+/+ (n = 6) and GLAST-/- (n = 6) mice. Frequency and power of gamma oscillations are significantly reduced in GLAST-/- compared to controls. (D) Peaks values averaged for the population [GLAST+/+ (n = 6); GLAST-/- (n = 6)] confirm the frequency shift and power decrease in GLAST-/- animals. **p < 0.001.
Local field potential analysis revealed that gamma bursts nested onto each respiratory cycle showed profound differences between GLAST-/- and GLAST+/+ mice (Figure 3B). Mean power spectra between 60 and 160 Hz (Figure 3C) were lower and broader in frequency for GLAST-/- mice, and did not reveal a clear peak in the gamma range as was seen for GLAST+/+ animals. Gamma bursts were detected as significant for every respiratory cycle in both control and KO mice (2.84 peaks/s and 2.83 peaks/s on average for GLAST+/+ and GLAST-/-, respectively). The average of the maximal power of individual bursts was significantly lower in GLAST-/- mice [power ratio: GLAST-/- 3.75, GLAST+/+ 4.20, ANOVA F(1,135) = 5.872, p < 0.05] and decreased by nearly 20 Hz [GLAST-/- 104 Hz, GLAST+/+ 126 Hz, ANOVA F(1,135) = 176.671, p < 0.0001). Therefore, the characteristics of spontaneous gamma bursts were altered in GLAST-/- both with regards to their power and frequency. Next, we analyzed whether modifications also occurred in these mice during odor stimulation.
Gamma-Beta Shift During Odor Stimulation is Changed in GLAST-/- Mice
Odor stimulation was carried out using two chemically distinct odorants, with either a low (benzaldehyde: 0.975) or a high vapor pressure (hexanal: 10.9). Odor presentation had two opposite effects on the LFP signal: (1) a decrease in gamma frequency range, (2) an appearance of bursts in a lower frequency range (15-35 Hz) that will be referred to as beta band bursts (Figures 4A,B). In GLAST+/+ mice, odor onset triggered an increase in beta oscillations bursts at around 15 Hz, concurrent with the suppression of ongoing high gamma activity for the duration of the stimulation (Figure 4B). Some lower frequency gamma bursts (80-100 Hz) remained during odor stimulation. This clear frequency balance between gamma and beta oscillations was not present in GLAST-/- mice during odor stimulation.
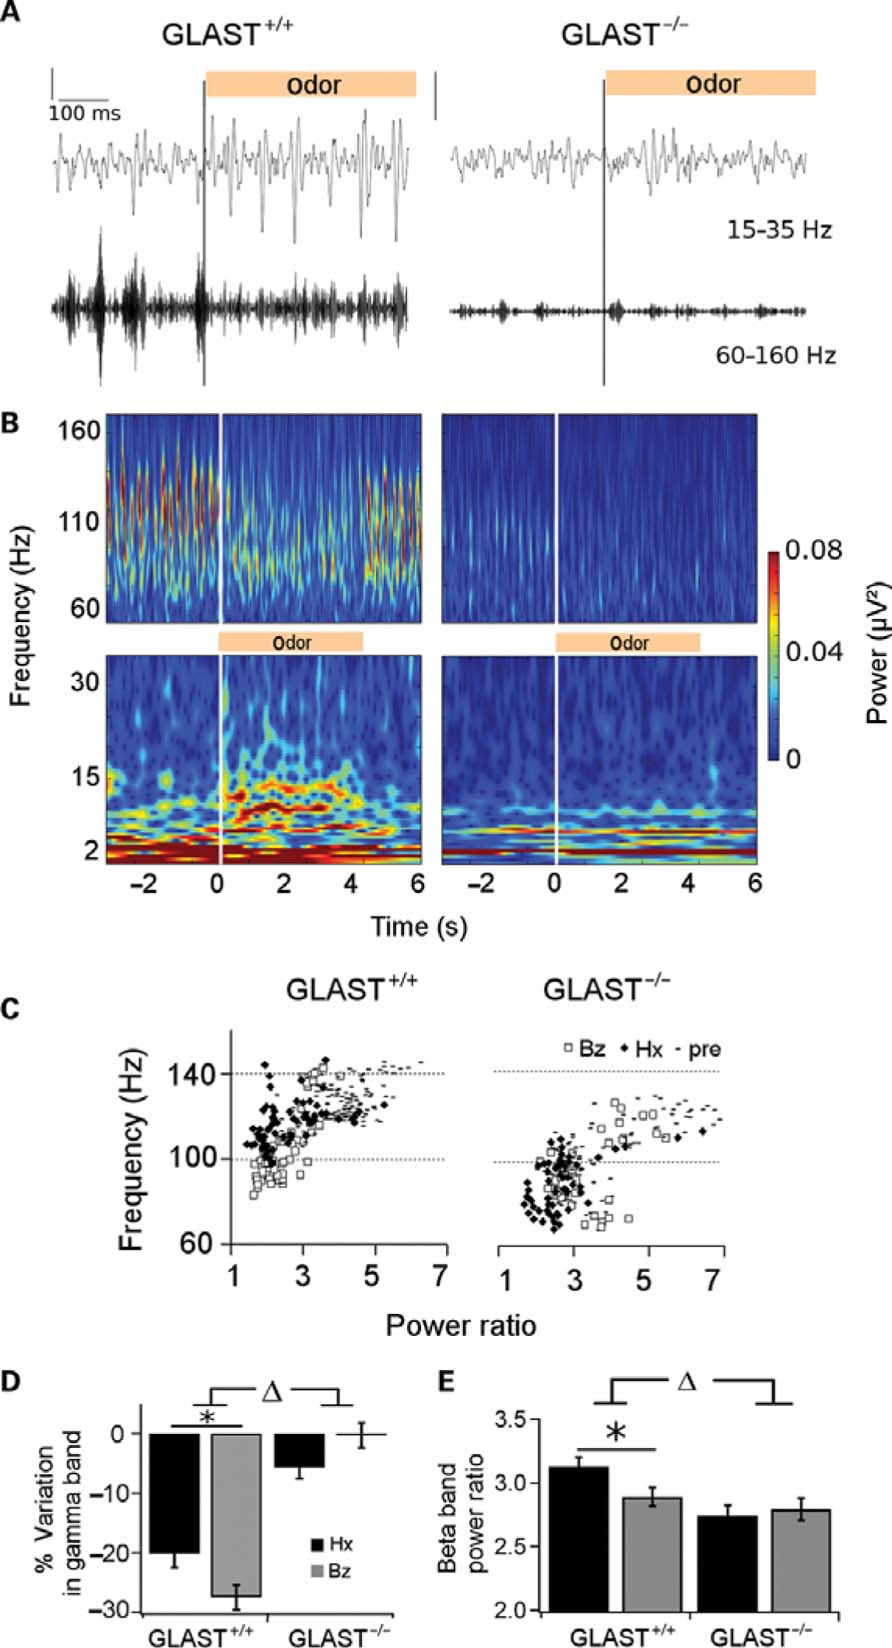
FIGURE 4. Effects of odor stimulation on beta (15–35 Hz) and gamma (60–160 Hz) oscillations in GLAST+/+ and GLAST-/- mice. (A) Representative single trial showing the switch of oscillations during odor presentation (vertical bar, hexanal 2%) in a GLAST+/+ (left column) and GLAST-/- (right column) mice. Top traces: beta (15–35 Hz) filtered; bottom traces: gamma (60–160 Hz) filtered LFPs. (B) Signal represented for one mouse from each group as a time (x-axis)–frequency (y-axis) decomposition between 2 and 35 Hz (beta band, bottom) and 60–160 Hz (gamma band, top) after processing of raw signals shown in (A). The four plots are set to the same scale for power (color bar). White vertical lines indicate odor onset. (C) Individual peaks extracted in the gamma band (60–160 Hz) during pre-odor (from –8 to –4 s; hyphen) and odor period (from 1 to 5 s) under benzaldehyde (diamonds) or hexanal (empty squares) are plotted as function of their power (x-axis) and frequency (y-axis). The frequency shift is clear for both genotypes during odor sampling even though frequency is slower in GLAST-/- mice. Peaks have a lower frequency under benzaldehyde than under hexanal in GLAST+/+, no difference in repartition is observed for GLAST-/- mice. (D) Decrease in high gamma band (60–160 Hz) power illustrated as the variation (in %) of the average power value comparing the two time–frequency plots (pre-odor from –8 to –4 s) and odor periods (1–5 s) for hexanal 2% (black bars) and benzaldehyde 2% (gray bars). No gamma decrease is observed in GLAST-/-(n = 4) compared to GLAST+/+ (n = 4) mice. (E) Values of beta peaks power for both odors (hexanal 2% in black and benzaldehyde 2% in gray bars) in GLAST+/+ and GLAST-/-. Power of the peaks is significantly lower in GLAST-/- mice.
We further estimated the overall power variation of gamma oscillations in a 60-160 Hz frequency band. We compared the average value of time-frequency plots corresponding to the odor stimulation period (from 1 to 5 s after odor onset) with the pre-odor period [from 8 to 4 s prior to odor onset; GLAST-/- (n = 4); GLAST+/+ (n = 4)]. As displayed on Figure 4D, we found that gamma power decreased in control mice by 20.2% for hexanal and 27.5% for benzaldehyde. In contrast, no significant decrease was observed in GLAST-/- mice (0.2 and 5.7% for benzaldehyde and hexanal, respectively [GLAST+/+ vs. GLAST-/- , F(1,217) = 90.996,p < 0.001].
We next extracted individual significant peaks of power between 60 and 160 Hz, during the pre-odor and odor stimulation periods, and plotted them as a function of their maximal frequency and normalized power (Figure 4C). Frequency shifts at odor onset were different between GLAST+/+ and GLAST-/- mice [interaction frequency × genotype F(1,216) = 5.578, p < 0.05]. In GLAST+/+ mice (Figure 4C, left panel), frequency decreased from 125 to 105 Hz for benzaldehyde and from 127 to 117 Hz for hexanal [odor effect F(1,124) = 13.861,p < 0.001]. In GLAST-/- mice (Figure 4C, right panel) frequency decrease was weaker but still present (from 104 to 99 Hz), with no difference between the two odorants [F(1,92) = 0.025, p = 0.87]. As expected from the overall decrease of gamma power (Figure 4D), GLAST+/+ mice displayed a stronger decrease of peaks power than GLAST-/-[interaction power × strain F(1,216) = 28.492, p < 0.0001], and showed a significant difference between odors [odor effect F(1,92) = 14.378, p < 0.001]. Both effects are abolished in GLAST-/- mice.
To summarize: (1) odor stimulation caused a gamma power decrease in GLAST+/+ mice that is almost abolished in GLAST-/-animals, (2) the odor specificity of the oscillatory peaks seen for GLAST+/+ mice during stimulation was lost in GLAST-/- animals.
In contrast to the effects on gamma activity, beta oscillatory activity was low during spontaneous conditions, and only emerged clearly during odor stimulation. We thus extracted significant peaks of beta activity during odor stimulation and compared the values between the two odorants and the two genotypes. During benzaldehyde stimulation, significant peaks were detected in 76% of all trials in GLAST+/+ but only in 64% for GLAST-/- mice. However, hexanal stimulation did not lead to such a difference as significant peaks were detected in 87% of trials for both genotypes.
Normalized power of beta peaks was slightly higher in GLAST+/+ compared to GLAST-/- mice [F(1,173) = 7.864, p < 0.01; Figure 4E]. Mean power was higher for hexanal in GLAST+/+ mice [F(1,101) = 4.964, p < 0.05] but the odorant-related difference was abolished in GLAST-/- mice [F(1,72) = 0.164,p = 0.69]. In addition, peak beta frequencies were slightly higher in GLAST-/- [21.21 vs. 19.62 Hz; F(1,173) = 5.746, p < 0.05] but not significantly different between the two odorants. Thus in contrast to wild-type mice, beta activity evoked in GLAST-/- mice was lower in intensity, higher in frequency, and did not show specificity to odor.
Evoked Potentials by LOT Stimulation
Because oscillations emerge from M/TCs to GCs interactions and were affected by the absence of GLAST, we next examined the state of synaptic transmission at the reciprocal synapses between these cells. Evoked LFPs were recorded in the OB following LOT stimulation. These LFPs have been extensively analyzed in the literature (Rall and Shepherd, 1968; Stripling and Patneau, 1999). Recordings from GC layer showed three phases in the signal: a small brief negative component representing antidromic signal of M/TCs, followed by a large positive component indicative of dendrodendritic excitation of GCs by M/TCs, and finally a late negative wave that represents inhibition on M/TCs (Nicoll, 1969). Evoked potentials recorded from control (n = 5) and GLAST-/- (n = 5) mice followed a different time course (Figure 5A). Signal recorded in GLAST-/- mice showed a significant increase in the latency of the second trough (GLAST+/+: 9.95 ms; GLAST-/- : 12.83 ms, p < 0.0001, t-test) while the relative amplitudes of both components were not significantly altered (GLAST+/+: 4.16 ms; GLAST-/- : 4.30ms, p = 0.03, t -test; Figure 5B).
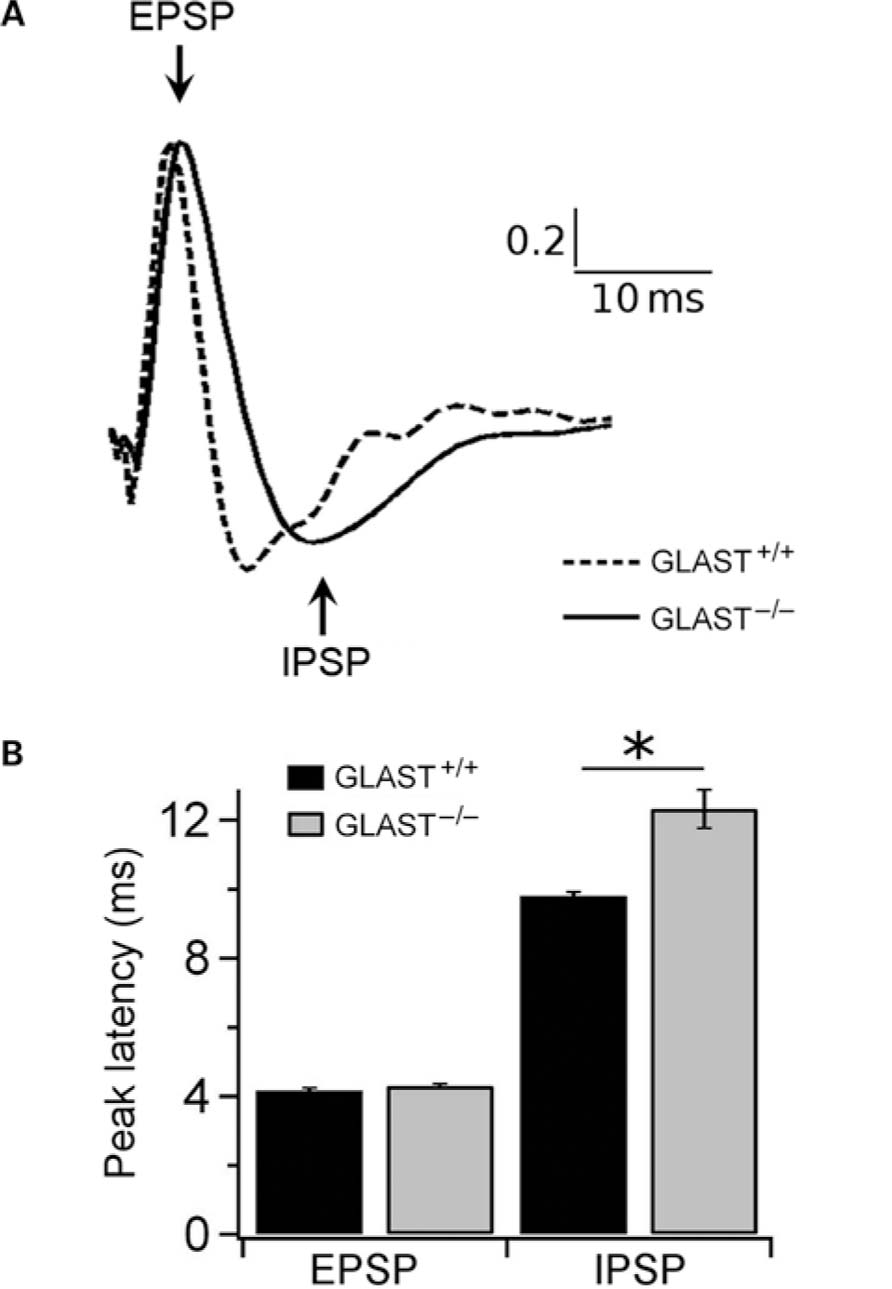
FIGURE 5. Local field potential recorded in the olfactory bulb under lateral olfactory tract stimulation. (A) Normalized LFP evoked in the granule cell layer under stimulation of the LOT in GLAST+/+ (dotted line) and GLAST-/- mice (solid line). (B) The negative component latency of the evoked potential is delayed in GLAST-/- mice (gray bar) compared to the GLAST+/+ mice (black bar) indicating enhanced duration of inhibition. *p < 0.0001, t -test.
Discussion
In this work, we studied the contribution of GLAST to olfactory processing in vivo in adult animals. Since astrocytes express GLAST in both glomerular and EP layers, we functionally evaluated the two layers by recording the spatial distribution of metabolic activity in superficial layers and synchronized electrical activity in deeper layers. We found that in GLAST-/- mice both functions of the OB network are impaired. A schematic summarizing our hypothesis for both metabolic and neuronal impairment in the absence of GLAST is shown in Figure 6.
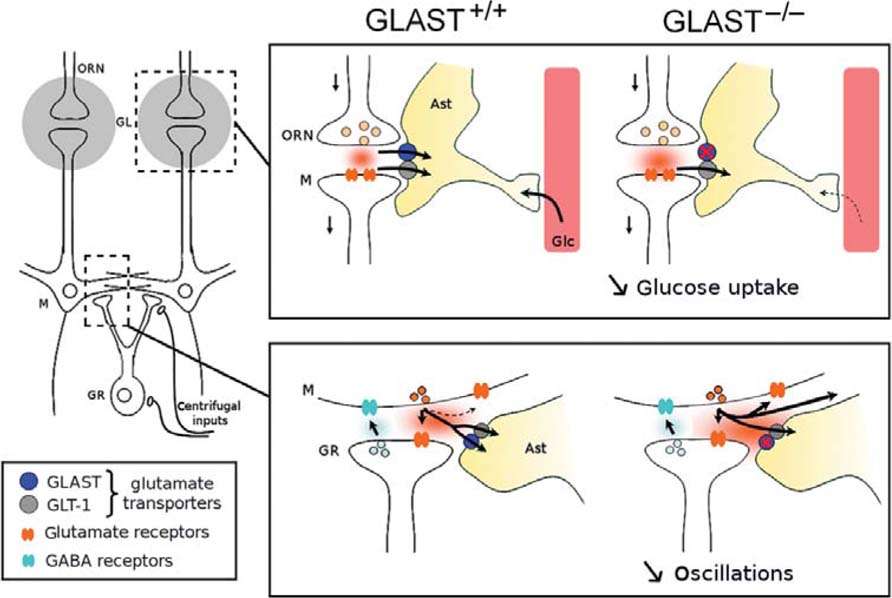
FIGURE 6. Schematic diagram of the impact of GLAST transporter on olfactory bulb networks. In the GL (upper box), the lack of astrocytic (Ast) glutamate transporter GLAST decreases the uptake of circulating glucose (Glc) during mitral cells (M) activation by glutamate release from the olfactory receptor neurons (ORN). Impairment of glutamate uptake at the level of the granule (GR)–mitral (M) reciprocal synapse (lower box) could lead to an increase of glutamate spillover, provoking the frequency decrease, and power depression of oscillatory activities within the OB circuit in GLAST-/-mice.
No Apparent Defect in Olfactory Bulb Organization in GLAST-/- Mice
The regulation of glutamate concentrations is critical during development. Silencing glutamate uptake inGLAST/GLT-1 double knockout mice causes multiple brain defects, including cortical, hippocampal and OB disorganization with perinatal mortality (Matsugami et al., 2006). GLT-1-/- mice show neuronal damage due to excitotoxicity and undergo premature death because of severe epilepsy (Tanaka et al., 1997). However, previous work has shown that GLAST-/- mice do not exhibit such major deficits (Watase et al., 1998) and consistent with this conclusion, our present results show intact OB layers organization and size in this strain. In line with these results, few behavioral deficits have been observed in these animals. GLAST-/- mice are impaired for motor coordination only when they are confronted to the challenging task of a fast rotating rod (Watase et al., 1998). In addition, they are more active in a novel environment and have poor performances in pairwise discrimination learning based on visual cues. In a very simple task of buried food, GLAST-/- mice do not seem to show obvious olfactory defects (Karlsson et al., 2009).
It is noteworthy that GLAST is expressed in the rostral migratory stream by radial glial cells (Hartfuss et al., 2001). These cells guide new cells into the glomerular and GC layers of the OB to renew these interneuronal populations during adult neurogenesis. However in GLAST-/- mice, we found that the volume of both glomerular and GC layers was identical to those in control mice, which would suggest that neurogenesis is not significantly altered when GLAST is absent. In addition, we did not observe upregulation of GLT-1 expression in the OB of GLAST-/- mice, consistently with previous results obtained in the cerebellum (Watase et al., 1998) and the somatosensory barrel cortex (Voutsinos-Porche et al., 2003a). These observations cannot discard the fact that in the GLAST-/- model, newborn neurons could have been affected directly by GLAST deletion at a very fine cellular scale.
Role of GLAST in Sensory-Evoked Metabolic Regulation in the Olfactory Bulb
The identification of precise astrocytic mechanisms involved in supply of glucose to active neuronal networks has received much attention for the past couple of decades (Pellerin and Magistretti, 1994; Bonvento et al., 2002; Figley and Stroman, 2011). The olfactory glomerulus offers a remarkable model to address this issue in the context of sensory-evoked activities, in part because of its unique organization of spherical module with astrocytes positioned at the circumference. We found that the spatial map of olfactory responses to benzaldehyde in the glomeruli identified by radiolabeled 2DG uptake was not different in GLAST-/- mice, which indicates that spatial olfactory coding for this odorant was preserved in these animals. However, the intensity of odor-induced 2DG uptake was reduced in the absence of GLAST. These results are consistent with the decrease in 2DG uptake observed in response to whisker stimulation in the somatosensory cortex of adults rats after local transient downregulation of GLAST using an antisense strategy (Cholet et al., 2001). Since the metabolic response was only partially reduced in GLAST-/- mice, our results do not exclude a possible role of GLT-1 in odor-evoked neurometabolic coupling as was previously reported in the somatosensory cortex (Voutsinos-Porche et al., 2003b) and in the superior colliculus (Herard et al., 2005). Our results indicate that GLAST participates to the glomerular glucose metabolism in vivo (cf. schematic on Figure 6, upper box).
Role of GLAST in Odor-Evoked Oscillations in the Olfactory Bulb
Neuronal oscillations are good sensors of the functional state of a network (Singer, 1993; Engel et al., 2001). The two rhythms we focused on (beta: 15–35 Hz and gamma: 60–160 Hz), are classically observed in the OB and have been related to odor processing (Martin et al., 2004; Beshel et al., 2007; Cenier et al., 2008; Aylwin et al., 2009). Cellular basis of gamma activity have been clearly described and rely on the accuracy of GC excitation by M/TC glutamate release, which in turn inhibits M/TC activity via GABA release (Rall and Shepherd, 1968; Neville and Haberly, 2003; Lagier et al., 2007).
We find that in mice deleted for the GluTs GLAST, oscillations of the LFP are altered. Gamma bursts, usually prominent in the OB during ongoing activity, exhibits both frequency and power decrease. Odor stimulation leads to a very weak response that has lost its odorant specificity compared to control animals. Together these data suggests a loss of synchrony within the OB circuit, which could be explained by impairment at the level of the reciprocal synapse between M/TCs and GCs. How can the disruption of glutamate uptake into astrocytes specifically impact neuronal network synchrony?
Both experimental and theoretical approaches have demonstrated that synaptic time constants were crucial for the oscillation frequency, and increasing the rise time of inhibition received by M/TCs reduced the frequency of gamma oscillations (Brunel and Wang, 2003; Bathellier et al., 2005; Lagier et al., 2007; Kay et al., 2009). One functional consequence of GLAST expression in astrocytes would be the shaping of extracellular glutamate concentration that synaptic receptors are exposed to (Rothstein et al., 1994; Isaacson, 1999), thus the regulation of synaptic spillover mechanism that could impact both pre- and postsynaptic function at the M/TC–GC reciprocal synapse. In the OB, glutamate released from M/TCs can lead to autoexcitation mediated by NMDA and AMPA autoreceptors in addition to the activation of postsynaptic ionotropic receptors (Nicoll and Jahr, 1982; Isaacson, 1999; Salin et al., 2001; Christie and Westbrook, 2006). Thus, regulation of glutamate spillover in the synaptic cleft by GluT may tune the timing of its action on glutamate autoreceptors and may also lead to a change in excitatory input driven by NMDA receptors on GCs (Schoppa et al., 1998) following glutamate release by M/TCs (see Figure 6, lower box, for an illustration). Accordingly, in the hippocampus (Asztely et al., 1997; Arnth-Jensen et al., 2002) and cerebellum (Marcaggi et al., 2003), a decrease in glutamate uptake was also shown to affect the activity of NMDA receptors in neighboring synapses.
The recording that we conducted following LOT stimulation strongly supports our expectation that reciprocal synapses have lost their temporal sharpness. Indeed we observed a significantly longer inhibition in GLAST-/- animals suggesting that under electrical stimulation the activation of postsynaptic elements is scattered over time instead of being precisely synchronized. The higher time delay we observed is in accordance with prior observations in the cerebellum, where EPSCs evoked in vitro in Purkinje cells by parallel fiber stimulation are 18% longer in GLAST-/- than in wild-type mice (Marcaggi et al., 2003).
Taken all together, these results suggest that overwhelming glutamate spillover on M/TC–GC synapses could lead to an alteration of the normal neuronal synchrony which is needed to maintain the accuracy of oscillatory activities in the OB.
Changes in Cellular and Metabolic Activity in Olfactory Bulb Networks of GLAST-/-
In the OB, astrocytic GluTs were shown to play a key role at the neurovascular unit (Petzold et al., 2008) regulating odor-evoked blood flow changes and intrinsic optical signals (Gurden et al., 2006). Our findings show that knocking out one of these transporters, GLAST, induces an impairment in the odor-evoked glucose uptake as well as in the fine tuning of odor-evoked oscillatory activities in the OB network. In conclusion, we postulate that GLAST participates to the signaling pathways responsible for the dual function of astrocytes in both energy and neuronal information processing in the OB.
Conflict of Interest Statement
The authors declare that the research was conducted in the absence of any commercial or financial relationships that could be construed as a potential conflict of interest.
Acknowledgments
This work was supported by a grant from “Agence Nationale de la Recherche” ANR-06-NEURO-004-01. We thank Alexandra Veyrac (Centre des Neurosciences de Paris-Sud, CNRS UMR 8195, Orsay) for her help with the confocal microscope and advice on layer volume quantification, Samuel Garcia and Nicolas Fourcaud-Trocmé for their support with OpenElectrophy, Kohichi Tanaka for GLAST KO mice, Carole Malgorn for help with immunoblotting, and C. William Shuttleworth for thoroughly reading the manuscript. We also thank the reviewers for their insightful comments.
References
Arnth-Jensen, N., Jabaudon, D., and Scanziani, M. (2002). Cooperation between independent hippocampal synapses is controlled by glutamate uptake. Nat. Neurosci. 5, 325–331.
Asztely, F., Erdemli, G., and Kullmann, D. M. (1997). Extrasynaptic glutamate spillover in the hippocampus: dependence on temperature and the role of active glutamate uptake. Neuron 18, 281–293.
Attwell, D., and Gibb, A. (2005). Neuroenergetics and the kinetic design of excitatory synapses. Nat. Rev. Neurosci. 6, 841–849.
Aylwin, M., Aguilar, G., Flores, F., and Maldonado, P. (2009). Odorant modulation of neuronal activity and local field potential in sensory-deprived olfactory bulb. Neuroscience 162, 1265–1278.
Bailey, M., and Shipley, M. (1993). Astrocyte subtypes in the rat olfactory bulb: morphological heterogeneity and differential laminar distribution. J. Comp. Neurol. 328, 501–526.
Bathellier, B., Lagier, S., Faure, P., and Lledo, P. M. (2005). Circuit properties generating gamma oscillations in a network model of the olfactory bulb. J. Neurophysiol. 95, 2678–2691.
Beshel, J., Kopell, N., and Kay, L. (2007). Olfactory bulb gamma oscillations are enhanced with task demands. J. Neurosci. 27, 8358–8365.
Bonvento, G., Sibson, N., and Pellerin, L. (2002). Does glutamate image your thoughts? Trends Neurosci. 25, 359–364.
Brunel, N., and Wang, X. J. (2003). What determines the frequency of fast network oscillations with irregular neural discharges? I. Synaptic dynamics and excitation-inhibition balance. J. Neurophysiol. 90, 415–430.
Cenier, T., Amat, C., Litaudon, P., Garcia, S., Lafaye De Micheaux, P., Liquet, B., Roux, S., and Buonviso, N. (2008). Odor vapor pressure and quality modulate local field potential oscillatory patterns in the olfactory bulb of the anesthetized rat. Eur. J. Neurosci. 27, 1432–1440.
Chapuis, J., Garcia, S., Messaoudi, B., Thevenet, M., Ferreira, G., Gervais, R., and Ravel, N. (2009). The way an odor is experienced during aversive conditioning determines the extent of the network recruited during retrieval: a multisite electrophysiological study in rats. J. Neurosci. 29, 10287–10298.
Cholet, N., Pellerin, L., Welker, E., Lacombe, P., Seylaz, J., Magistretti, P., and Bonvento, G. (2001). Local injection of antisense oligonucleotides targeted to the glial glutamate transporter GLAST decreases the metabolic response to somatosensory activation. J. Cereb. Blood Flow Metab. 21, 404–412.
Christie, J. M., and Westbrook, G. L. (2006). Lateral excitation within the olfactory bulb. J. Neurosci. 26, 2269–2277.
Díaz, D., Recio, J. S., Baltanás, F. C., Gómez, C., Weruaga, E., and Alonso, J. R. (2011). Long-lasting changes in the anatomy of the olfactory bulb after ionizing irradiation and bone marrow transplantation. Neuroscience 173, 190–205.
Engel, A. K., Fries, P., and Singer, W. (2001). Dynamic predictions: oscillations and synchrony in top-down processing. Nat. Rev. Neurosci. 2, 704–716.
Fellin, T. (2009). Communication between neurons and astrocytes: relevance to the modulation of synaptic and network activity. J. Neurochem. 108, 533–544.
Figley, C. R., and Stroman, P. W. (2011). The role(s) of astrocytes and astrocyte activity in neurometabolism, neurovascular coupling, and the production of functional neuroimaging signals. Eur. J. Neurosci. 33, 577–588.
Garcia, S., and Fourcaud-Trocmé, N. (2009). OpenElectrophy: an electrophysiological data- and analysis-sharing framework. Front. Neuroinform. 3:14. doi: 10.3389/neuro.11. 014.2009
Gordon, G. R., Choi, H. B., Rungta, R. L., Ellis-Davies, G. C., and Macvicar, B. A. (2008). Brain metabolism dictates the polarity of astrocyte control over arterioles. Nature 456, 745–749.
Gurden, H., Uchida, N., and Mainen, Z. (2006). Sensory-evoked intrinsic optical signals in the olfactory bulb are coupled to glutamate release and uptake. Neuron 52, 335–345.
Hartfuss, E., Galli, R., Heins, N., and Götz, M. (2001). Characterization of CNS precursor subtypes and radial glia. Dev. Biol. 229, 15–30.
Haydon, P. G., and Carmignoto, G. (2006). Astrocyte control of synaptic transmission and neurovascular coupling. Physiol. Rev. 86, 1009–1031.
Herard, A., Dubois, A., Escartin, C., Tanaka, K., Delzescaux, T., Hantraye, P., and Bonvento, G. (2005). Decreased metabolic response to visual stimulation in the superior colliculus of mice lacking the glial glutamate transporter GLT-1. Eur. J. Neurosci. 22, 1807–1811.
Huang, Y., and Bergles, D. (2004). Glutamate transporters bring competition to the synapse. Curr. Opin. Neurobiol. 14, 346–352.
Isaacson, J. (1999). Glutamate spillover mediates excitatory transmission in the rat olfactory bulb. Neuron 23, 377–384.
Johnson, B., Ho, S., Xu, Z., Yihan, J., Yip, S., Hingco, E., and Leon, M. (2002). Functional mapping of the rat olfactory bulb using diverse odorants reveals modular responses to functional groups and hydrocarbon structural features. J. Comp. Neurol. 449, 180–194.
Karlsson, R. M., Tanaka, K., Saksida, L. M., Bussey, T. J., Heilig, M., and Holmes, A. (2009). Assessment of glutamate transporter GLAST (EAAT1)-deficient mice for phenotypes relevant to the negative and executive/cognitive symptoms of schizophrenia. Neuropsychopharmacology 34, 1578–1589.
Kauer, J., and White, J. (2001). Imaging and coding in the olfactory system. Annu. Rev. Neurosci. 24, 963–979.
Kay, L., Beshel, J., Brea, J., Martin, C., Rojas-Líbano, D., and Kopell, N. (2009). Olfactory oscillations: the what, how and what for. Trends Neurosci. 32, 207–214.
Lagier, S., Panzanelli, P., Russo, R. E., Nissant, A., Bathellier, B., Sassoe-Pognetto, M., Fritschy, J.-M., and Lledo, P.-M. (2007). GABAergic inhibition at dendrodendritic synapses tunes gamma oscillations in the olfactory bulb. Proc. Natl. Acad. Sci. U.S.A. 104, 7259–7264.
Lowry, C., and Kay, L. (2007). Chemical factors determine olfactory system beta oscillations in waking rats. J. Neurophysiol. 98, 394–404.
Marcaggi, P., Billups, D., and Attwell, D. (2003). The role of glial glutamate transporters in maintaining the independent operation of juvenile mouse cerebellar parallel fibre synapses. J. Physiol. 552, 89–107.
Martin, C., Gervais, R., Hugues, E., Messaoudi, B., and Ravel, N. (2004). Learning modulation of odor-induced oscillatory responses in the rat olfactory bulb: a correlate of odor recognition? J. Neurosci. 24, 389–397.
Matsugami, T., Tanemura, K., Mieda, M., Nakatomi, R., Yamada, K., Kondo, T., Ogawa, M., Obata, K., Watanabe, M., Hashikawa, T., and Tanaka, K. (2006). From the Cover: indispensability of the glutamate transporters GLAST and GLT1 to brain development. Proc. Natl. Acad. Sci. U.S.A. 103, 12161–12166.
Mombaerts, P., Wang, F., Dulac, C., Chao, S. K., Nemes, A., Mendelsohn, M., Edmondson, J., and Axel, R. (1996). Visualizing an olfactory sensory map. Cell 87, 675–686.
Neville, K. R., and Haberly, L. B. (2003). Beta and gamma oscillations in the olfactory system of the urethane-anesthetized rat. J. Neurophysiol. 90, 3921–3930.
Nicoll, R. A. (1969). Inhibitory mechanisms in the rabbit olfactory bulb: dendrodendritic mechanisms. Brain Res. 14, 157–172.
Nicoll, R. A., and Jahr, C. E. (1982). Self-excitation of olfactory bulb neurones. Nature 296, 441–444.
Pellerin, L. (2008). Brain energetics (thought needs food). Curr. Opin. Clin. Nutr. Metab. Care 11, 701–705.
Pellerin, L., and Magistretti, P. (1994). Glutamate uptake into astrocytes stimulates aerobic glycolysis: a mechanism coupling neuronal activity to glucose utilization. Proc. Natl. Acad. Sci. U.S.A. 91, 10625–10629.
Petzold, G., Albeanu, D., Sato, T., and Murthy, V. (2008). Coupling of neural activity to blood flow in olfactory glomeruli is mediated by astrocytic pathways. Neuron 58, 897–910.
Rall, W., and Shepherd, G. (1968). Theoretical reconstruction of field potentials and dendrodendritic synaptic interactions in olfactory bulb. J. Neurophysiol. 31, 884–915.
Rothstein, J. D., Martin, L., Levey, A. I., Dykes-Hoberg, M., Jin, L., Wu, D., Nash, N., and Kuncl, R. W. (1994). Localization of neuronal and glial glutamate transporters. Neuron 13, 713–725.
Roux, S., Cenier, T., Garcia, S., Litaudon, P., and Buonviso, N. (2007). A wavelet-based method for local phase extraction from a multi-frequency oscillatory signal. J. Neurosci. Methods 160, 135–143.
Salin, P. A., Lledo, P. M., Vincent, J. D., and Charpak, S. (2001). Dendritic glutamate autoreceptors modulate signal processing in rat mitral cells. J. Neurophysiol. 85, 1275–1282.
Schoppa, N., Kinzie, J., Sahara, Y., Segerson, T., and Westbrook, G. (1998). Dendrodendritic inhibition in the olfactory bulb is driven by NMDA receptors. J. Neurosci. 18, 6790–6802.
Singer, W. (1993). Synchronization of cortical activity and its putative role in information processing and learning. Annu. Rev. Physiol. 55, 349–374.
Sokoloff, L., Reivich, M., Kennedy, C., Des Rosiers, M., Patlak, C., Pettigrew, K., Sakurada, O., and Shinohara, M. (1977). The [14C]deoxyglucose method for the measurement of local cerebral glucose utilization: theory, procedure, and normal values in the conscious and anesthetized albino rat. J. Neurochem. 28, 897–916.
Stewart, W. B., Kauer, J. S., and Shepherd, G. M. (1979). Functional organization of rat olfactory bulb analysed by the 2-deoxyglucose method. J. Comp. Neurol. 185, 715–734.
Stripling, J., and Patneau, D. (1999). Potentiation of late components in olfactory bulb and piriform cortex requires activation of cortical association fibers. Brain Res. 841, 27–42.
Tanaka, K., Watase, K., Manabe, T., Yamada, K., Watanabe, M., Takahashi, K., Iwama, H., Nishikawa, T., Ichihara, N., Kikuchi, T., Okuyama, S., Kawashima, N., Hori, S., Takimoto, M., and Wada, K. (1997). Epilepsy and exacerbation of brain injury in mice lacking the glutamate transporter GLT-1. Science 276, 1699–1702.
Uhlhaas, P., Pipa, G., Lima, B., Melloni, L., Neuenschwander, S., Nikolic, D., and Singer, W. (2009). Neural synchrony in cortical networks: history, concept and current status. Front. Integr. Neurosci. 3:17. doi: 10.3389/neuro.07.017.2009
Ullensvang, K., Lehre, K. P., Storm-Mathisen, J., and Danbolt, N. C. (1997). Differential developmental expression of the two rat brain glutamate transporter proteins GLAST and GLT. Eur. J. Neurosci. 9, 1646–1655.
Utsumi, M., Ohno, K., Onchi, H., Sato, K., and Tohyama, M. (2001). Differential expression patterns of three glutamate transporters (GLAST, GLT1 and EAAC1) in the rat main olfactory bulb. Brain Res. Mol. Brain Res. 92, 1–11.
Veyrac, A., Didier, A., Colpaert, F., Jourdan, F., and Marien, M. (2005). Activation of noradrenergic transmission by alpha2-adrenoceptor antagonists counteracts deafferentation-induced neuronal death and cell proliferation in the adult mouse olfactory bulb. Exp. Neurol. 194, 444–456.
Voutsinos-Porche, B., Bonvento, G., Tanaka, K., Steiner, P., Welker, E., Chatton, J., Magistretti, P., and Pellerin, L. (2003a). Glial glutamate transporters mediate a functional metabolic crosstalk between neurons and astrocytes in the mouse developing cortex. Neuron 37, 275–286.
Voutsinos-Porche, B., Knott, G., Tanaka, K., Quairiaux, C., Welker, E., and Bonvento, G. (2003b). Glial glutamate transporters and maturation of the mouse somatosensory cortex. Cereb. Cortex 13, 1110–1121.
Watase, K., Hashimoto, K., Kano, M., Yamada, K., Watanabe, M., Inoue, Y., Okuyama, S., Sakagawa, T., Ogawa, S., Kawashima, N., Hori, S., Takimoto, M., Wada, K., and Tanaka, K. (1998). Motor discoordination and increased susceptibility to cerebellar injury in GLAST mutant mice. Eur. J. Neurosci. 10, 976–988.
Keywords: glutamate transporters, olfactory bulb, astrocytes, metabolic activity, neuronal oscillations
Citation: Martin C, Houitte D, Guillermier M, Petit F, Bonvento G and Gurden H (2012) Alteration of sensory-evoked metabolic and oscillatory activities in the olfactory bulb of GLAST-deficient mice. Front. Neural Circuits. 6:1. doi: 10.3389/fncir.2012. 00001
Received: 20 October 2011; Accepted: 02 January 2012;
Published online: 25 January 2012.
Edited by:
Gordon M. Shepherd, Yale University School of Medicine, USAReviewed by:
Tommaso Fellin, Fondazione Istituto Italiano di Tecnologia, ItalyFahmeed Hyder, Yale University, USA
Copyright: © 2012 Martin, Houitte, Guillermier, Petit, Bonvento and Gurden. This is an open-access article distributed under the terms of the Creative Commons Attribution Non Commercial License, which permits non-commercial use, distribution, and reproduction in other forums, provided the original authors and source are credited.
*Correspondence: Hirac Gurden, Laboratoire Imagerie et Modélisation en Neurobiologie et Cancérologie, UMR 8165, Université Paris-Sud, CNRS, Bâtiment 440, 91405 Orsay, France. e-mail: gurden@imnc.in2p3.fr
Abbreviations: AMPA, alpha-amino-3-hydroxy-5-methyl-4-isoxazolepropionic acid; BAC, bacterial artificial chromosome; 2DG, [14C]-2-deoxyglucose; EPL, external plexiform layer; GABA, gamma-aminobutyric acid; GL, glomerular layer; GLAST, glutamate aspartate transporter; GLT-1, glutamate transporter 1; GluT, glutamate transporters; GCs, granule cells; LOT, lateral olfactory tract; LFP, local field potential; OB, main olfactory bulb; M/TCs, mitral/tufted cells; NMDA, N-methyl-D-aspartate; PGCs, periglomerular cells.