Locomotion-Related Population Cortical Ca2+ Transients in Freely Behaving Mice
 Quanchao Zhang1†
  Jiwei Yao2†
  Yu Guang3† Shanshan Liang1 Jiangheng Guan1
  Han Qin1
  Xiang Liao1 Wenjun Jin1 Jianxiong Zhang1 Junxia Pan1 Hongbo Jia4 Junan Yan2 Zhengzhi Feng3* Weibing Li2,5*
  Xiaowei Chen1,6*
- 1Brain Research Center, Third Military Medical University, Chongqing, China
- 2Institute of Urinary Surgery, Southwest Hospital, Third Military Medical University, Chongqing, China
- 3Department of Psychology, Third Military Medical University, Chongqing, China
- 4Brain Research Instrument Innovation Center, Suzhou Institute of Biomedical Engineering and Technology, Chinese Academy of Sciences, Suzhou, China
- 5Clinical Center for Urological Disease, The Third Affiliated Hospital, Chongqing Medical University, Chongqing, China
- 6CAS Center for Excellence in Brain Science and Intelligence Technology, Shanghai Institutes for Biological Sciences, Chinese Academy of Sciences, Shanghai, China
Locomotion involves complex neural activity throughout different cortical and subcortical networks. The primary motor cortex (M1) receives a variety of projections from different brain regions and is responsible for executing movements. The primary visual cortex (V1) receives external visual stimuli and plays an important role in guiding locomotion. Understanding how exactly the M1 and the V1 are involved in locomotion requires recording the neural activities in these areas in freely moving animals. Here, we used an optical fiber-based method for the real-time monitoring of neuronal population activities in freely moving mice. We combined the bulk loading of a synthetic Ca2+ indicator and the optical fiber-based Ca2+ recordings of neuronal activities. An optical fiber 200 μm in diameter can detect the coherent activity of a subpopulation of neurons. In layer 5 of the M1 and V1, we showed that population Ca2+ transients reliably occurred preceding the impending locomotion. Interestingly, the M1 Ca2+ transients started ~100 ms earlier than that in V1. Furthermore, the population Ca2+ transients were robustly correlated with head movements. Thus, our work provides a simple but efficient approach for monitoring the cortical Ca2+ activity of a local cluster of neurons during locomotion in freely moving animals.
Introduction
Population neural activity in cell groups is thought to contribute to a variety of brain functions, such as sensory information processing (Bullock, 1997; Engel et al., 2001; Griffin et al., 2015), nervous system development (Grosse et al., 2000; Komuro and Kumada, 2005), learning and memory (Engel et al., 2001; Pesaran et al., 2002; Steriade and Timofeev, 2003; Landsness et al., 2009; Rolls et al., 2011), and motor behavior (Churchland et al., 2006, 2010; Shenoy et al., 2013; Erisken et al., 2014). There is now a general consensus that recording Ca2+ activity is an effective approach for uncovering the properties and functions of such aggregate neural activity in vivo in both neurons, where Ca2+ signals allow the inference of spiking activity, and astrocytes, where Ca2+ signals mainly indicate activation (Mao et al., 2001; Stosiek et al., 2003). The major advancement in measuring Ca2+ signals was the invention and the application of two-photon microscopy in the nervous system (Denk et al., 1990; Yuste and Denk, 1995). Over many years, particularly with the help of the continuous development of Ca2+ indicators, two-photon Ca2+ imaging has become widely used for detecting neural activities on multiple scales ranging from networks to single synapses in both anesthetized and behaving animals (Stosiek et al., 2003; Chen et al., 2011, 2013; Nadella et al., 2016; Szalay et al., 2016). Another commonly used approach for in vivo brain Ca2+ imaging is based on the use of charged coupled detector/complementary metal-oxide-semiconductor-based cameras, which are particularly useful for recording large-field Ca2+ dynamics in the superficial cortical layers (Berger et al., 2007).
Complementary to two-photon imaging and camera-based large-field imaging, the rapidly developing techniques for recording population Ca2+ signals in the deep brain tissues of freely behaving animals include microendoscopic approaches. These require the implementation of optical fibers, fiber-like GRIN lenses or miniaturized head-mounted imaging devices (Grienberger et al., 2012). Along with the current application of cell type-specific labeling of genetically encoded calcium indicators (Hires et al., 2008; Mank and Griesbeck, 2008), these approaches are strongly facilitating our understanding of the contributions of specific neuronal circuits to animal behaviors (Jung et al., 2004; Lütcke et al., 2010; Keller et al., 2012; Ayaz et al., 2013; Ziv et al., 2013; Adelsberger et al., 2014; Jennings et al., 2015; Flash and Bizzi, 2016; Pakan et al., 2016). A particularly simple but efficient method for deep tissue measurements in freely moving animals is the optical fiber-based Ca2+ recording approach, also termed fiber photometry (Gunaydin et al., 2014; Guo et al., 2015). This approach has been frequently applied to population recordings of cell bodies, axon terminals and dendrites in neurons (Murayama et al., 2007; Chen et al., 2013; Gunaydin et al., 2014) as well as astrocyte population activity (Schulz et al., 2012; Paukert et al., 2014).
Locomotion is a basic behavior of animals that involves neural activity in many cortical and subcortical networks (Rathelot and Strick, 2009; Levine et al., 2014; Flash and Bizzi, 2016). Among these, the motor and visual cortices have received much attention. The motor cortex has long been shown to play a key role in the planning and execution of voluntary movements (Wise, 1985; Marigold and Drew, 2011; Shenoy et al., 2013). The visual cortex is extensively connected to the motor areas and plays an important role in guiding locomotion (Marigold, 2008). In addition, the firing activity of visual cortex neurons can be altered by locomotion (Niell and Stryker, 2010; Keller et al., 2012; Ayaz et al., 2013). Here, we used the optical fiber-based Ca2+ recording approach to monitor population Ca2+ signals from layer 5 of primary motor and visual cortices (M1 and V1) during locomotion in freely behaving mice. We reliably observed Ca2+ signals preceding locomotion in both regions. Interestingly, M1 signals occurred earlier than the V1 signals. Finally, we found that these population Ca2+ signals were highly correlated with head movements.
Materials and Methods
Animals
Adult male C57/BL6J mice aged 3–4 months were used for the experiments. The mice were housed in groups, except those mice with implanted optical fibers. The animals had free access to food and water and lived under a 12-h light/day cycle (lights on at 7:00 am). All experimental procedures were performed according to institutional animal welfare guidelines and were approved by the Third Military Medical University Animal Care and Use Committee.
Optical Fiber Setup
A custom-built fiber setup was used for the neuronal Ca2+ signal measurements (model “FiberOptoMeter v1.0,” Suzhou Institute of Biomedical Engineering and Technology; Figure 1A). The Ca2+ indicator Oregon green 488 BAPTA-1 (OGB-1) was excited at 488 nm by a solid-state laser. The light intensity was approximately 0.22 mW/mm2 at the tip of the fiber. The fluorescence emission was detected with an avalanche photodiode (Si APD, S2382, Hamamatsu Photonics K.K., Japan). The specialized optic setup was designed to accommodate the simultaneous recording of Ca2+ signals. The laser light on/off control and the data acquisition were managed using self-customized software on the LabVIEW platform (National Instruments, Austin, TX, USA).
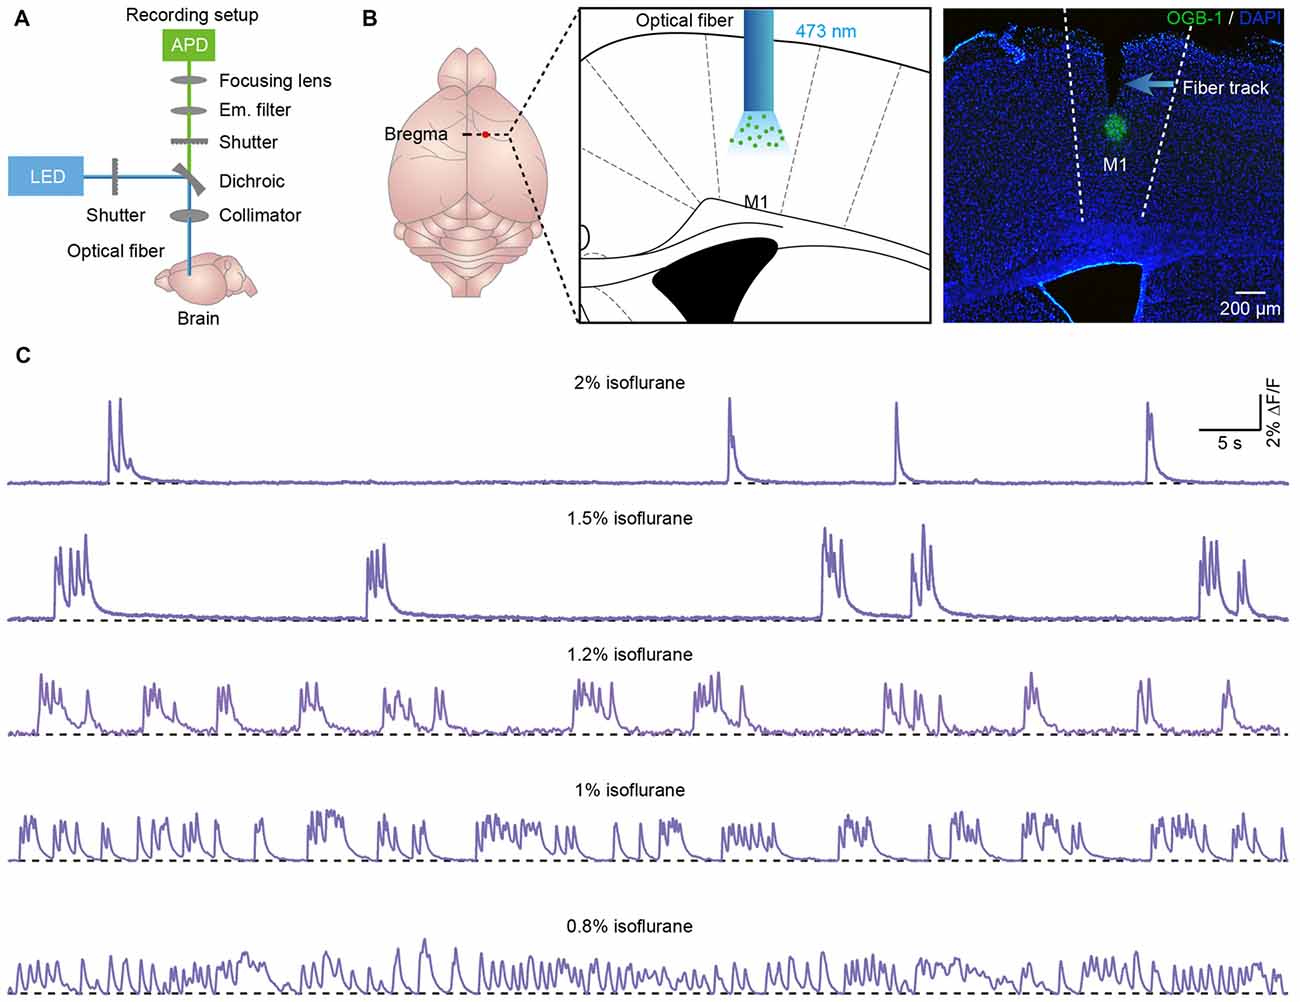
Figure 1. Population cortical Ca2+ transients in anesthetized mice. (A) Scheme of the optical fiber recording setup. (B) Left panel, schematic showing the tip of the optical fiber (diameter: 200 μm) implanted in layer 5 of the primary motor cortex (M1) stained with OGB-1AM. Right panel, post hoc fluorescence image of a coronal brain slice stained with OGB-1AM in layer 5 of the M1. (C) Examples showing the population Ca2+ transients in the M1 at different levels of anesthesia. The concentrations of isoflurane are indicated above each trace.
Fluorescent Ca2+ Indicator Staining
The animals were anesthetized with 1.5% isoflurane in pure O2 and then placed in a stereotactic head frame on a heating pad, where the animals were anesthetized with isoflurane until the surgery ended. The eyes were protected by ophthalmic ointment to prevent drying. A small craniotomy (0.5 × 0.5 mm) was made above the cortical area after removing the hair and skin. The coordinates of the craniotomy were as follows: for the M1 (from bregma): AP 0 mm, ML 1 mm (relative to midline); for the V1: AP 3 mm, ML 2.5 mm. A glass micropipette with a tip diameter of approximately 10 μm was placed directly above the skull and filled with OGB-1AM solution. Approximately 80–100 nl of solution was injected into the tissue at a depth of 600 μm (from the cortical surface). Following each injection, the pipette was kept in place for an additional 5 min before being slowly withdrawn.
Optical Fiber Recordings in Anesthetized Mice
Approximately 30 min after dye application, a 200-μm-diameter optical fiber with a numerical aperture of 0.48 (Doric Lenses, Quebec City, QC, Canada) was inserted into the stained region with a micromanipulator. The fiber was glued into a short cannula (ID 0.51 mm, OD 0.82 mm) to maintain stability. To provide maximal fluorescence intensity, the fiber was advanced typically up to 550 μm below the cortical surface. At the beginning, the anesthesia level was adjusted to 2%. After the animals had adapted for 20 min and their respiration rates remained stable, the recording experiments began. After continuous recording for approximately 10 min, anesthesia was adjusted to a lower level. We then recorded again for another 10 min as described above. Recordings were obtained from each mouse under 2–3 anesthesia levels.
Optical Fiber Recordings in Freely Moving Mice
After obtaining recordings from mice under anesthesia, the cannula and skull were fixed together using dental cement. After 20 min of solidification, the mice were moved back to their original house. Following recovering for approximately 2 h, the mice were placed into a white rectangular box (29 × 17 cm) in which they could move freely. A camera was placed just above the box and recorded the movements of the mice. Neuronal Ca2+ signals and locomotion were recorded simultaneously while the animals were freely moving. Every mouse was continuously recorded from approximately 40 min to 1 h. The Ca2+ transients were sampled at 2000 Hz with customized acquisition software based on the LabVIEW platform (National Instruments, Austin, TX, USA). The videos were recorded at 30 Hz at a spatial resolution of 1280 × 720 pixels (Aigo AHD-X9, China). This frame rate may lead to a maximal system error of 33 ms when we calculated the response latency. All the Ca2+ transients and behavior videos were synchronized offline using event marks.
Histology and Fluorescence Imaging
To document the OGB-1 staining and confirm the relative position of the optical fiber, all recorded mice were perfused transcardially with 4% paraformaldehyde in phosphate-buffered saline (PBS) after the experiments. Brain samples were dehydrated with 15% sucrose in PBS for 24 h. Then, the brain samples were sectioned into 30-μm-thick slices, and 4′,6-diamidino-2-phenylindole was used to stain nuclei. Images were acquired using a fluorescence microscope and a 4× objective with a numerical aperture of 0.13.
Data Analysis and Statistics
Ca2+ transients were acquired at a sampling rate of 2000 Hz after being converting into electrical signals through the Si APD. The data were low-pass filtered with a Savitzky-Golay finite-impulse response smoothing filter with 50 side points and a polynomial order of 3. Then, ΔF/F = (f − fbaseline)/fbaseline, relative fluorescence changes, were calculated as Ca2+ transients, where the fbaseline was the baseline level of fluorescence determined during the current recording period of the test. Ca2+ transients were automatically detected with a template-matching algorithm, taking into account the properties of rise and decay times of the Ca2+ signals. A Ca2+ transient was accepted as a signal when its amplitude was greater than three times the standard deviation of the noise band.
The mouse movement was calculated by the change in video clip image relative to its body size. Image frames from the video clip were converted into binary format to get the mouse shape according to its image intensities. A logical “OR” operation was performed between two consecutive frames to get the pixel size of absolute change of the mice. The ratio of such image change relative to the mouse body size, which was calculated beforehand, was defined as the mouse movement. This scoring procedure cannot differentiate the head movement from the general movement. Therefore, the head movements in the last figure were identified by eyes.
Statistical analysis was conducted in MATLAB (The MathWorks, Inc., Natick, MA, USA). For all statistical tests, significance was measured against an alpha of 0.05. The level of p < 0.05 was considered significant.
Results
Population Cortical Ca2+ Transients in Anesthetized Mice
We applied the optical fiber-based approach to record population Ca2+ activity in cortical neurons stained with the synthetic Ca2+ indicator OGB-1AM. We used a previously described fiber recording device (Adelsberger et al., 2005; Grienberger et al., 2012) that allows the excitation of OGB-1AM and the collection of emitted light (Figure 1A). We used the multicell bolus loading procedure to stain neurons located in layer 5 with OGB-1AM (Stosiek et al., 2003).
Approximately 10 min after dye injection, we implanted an optical fiber with a diameter of 200 μm above the stained cortical area (Figure 1B). Similar to the previous work (Stroh et al., 2013), we detected slow oscillation-associated population Ca2+ transients under isoflurane anesthesia. Figure 1C shows examples of Ca2+ transients recorded in the M1 at different isoflurane levels (ranging from 0.8% to 2%). The quantitative analysis indicated that the population Ca2+ activity was strongly dependent on the level of anesthesia. In M1, the frequency increased from 0.04 ± 0.01 Hz to 0.45 ± 0.03 Hz with a decrease in the isoflurane concentration (Figure 2A). However, the amplitude (ΔF/F) was reduced from 5.21 ± 0.11 ΔF/F to 1.6 ± 0.08 ΔF/F when the isoflurane level was reduced from 2% to 0.8% (Figures 2B,C). In contrast, the rise time of the Ca2+ transients remained stable and was not affected by changes in the anesthesia level (Figure 2D; p = 0.32, n = 7 mice, Kruskal-Wallis test). In addition, the recordings of population activity in V1 revealed that no difference was found between M1 and V1 in frequency, amplitude and rise time of the Ca2+ transients at the same anesthesia level (Figures 2A,C,D; p > 0.05 for all the three parameters, n = 7 mice for V1).
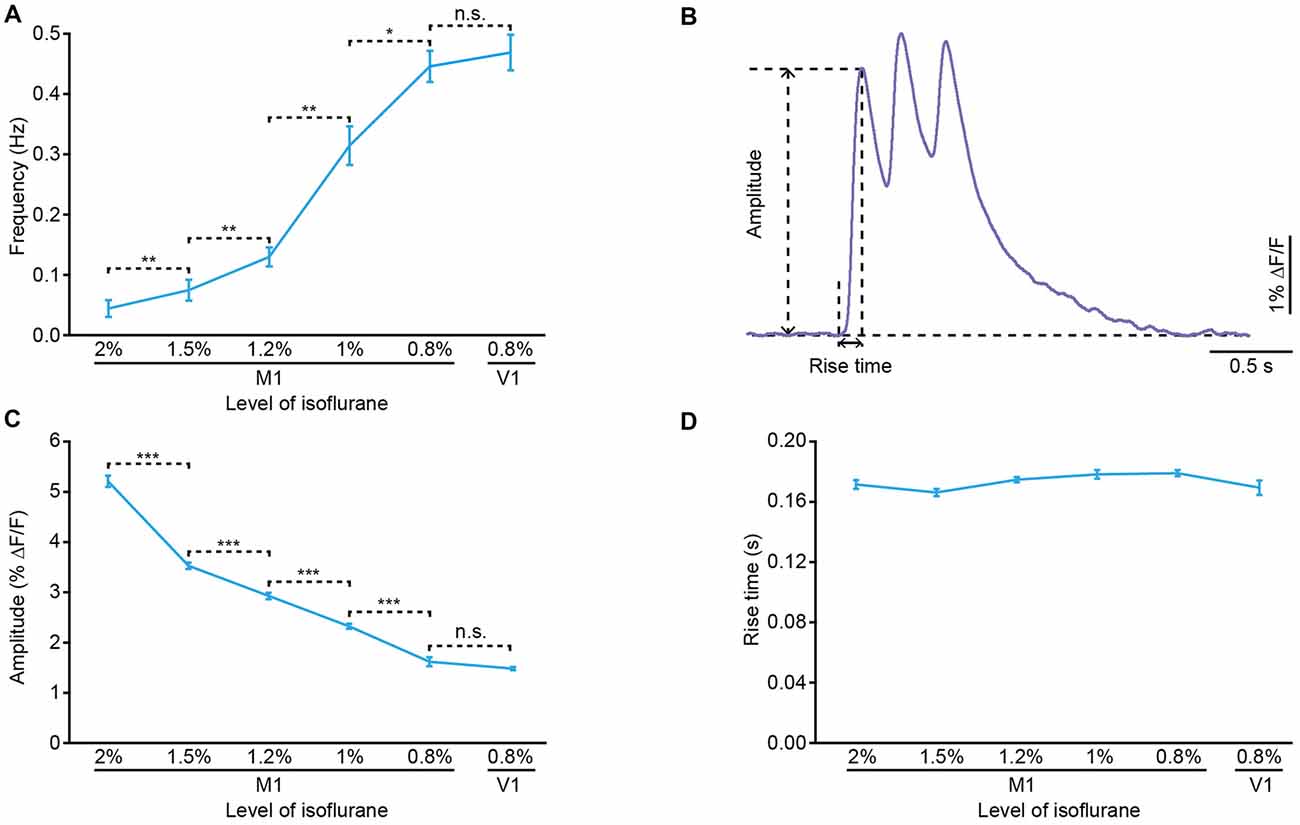
Figure 2. Properties of the population cortical Ca2+ transients in anesthetized mice. (A) Frequency of the population Ca2+ transients at different anesthesia levels in M1 and primary visual cortex (V1) (n = 7 and 7 mice, respectively; Wilcoxon rank-sum test, 2% vs. 1.5%, **p = 0.006; 1.5% vs. 1.2%, **p = 0.006; 1.2% vs. 1%, **p = 0.001; 1% vs. 0.8%, *p = 0.03; 0.8% (M1) vs. 0.8% (V1), p = 0.51). (B) Example of a Ca2+ transient for amplitude and rise time analysis. (C) Amplitude of the population Ca2+ transients at different anesthesia levels in M1 and V1 (n = 7 and 7 mice, respectively; Wilcoxon rank-sum test, 2% vs. 1.5%, ***p < 0.001; 1.5% vs. 1.2%, ***p < 0.001; 1.2% vs. 1%, ***p < 0.001; 1% vs. 0.8%, ***p < 0.001; 0.8% (M1) vs. 0.8% (V1), p = 0.88). (D) Rise time of the population Ca2+ transients at different anesthesia levels in M1 and V1 (n = 7 and 7 mice, respectively; Kruskal-Wallis test, χ2 = 5.86, p = 0.32). Values are the mean ± SEM.
Population Ca2+ Transients in the M1 of Freely Moving Mice
To investigate the correlation between the population Ca2+ transients and the body movements, we recorded Ca2+ activities in layer 5 neurons of the M1 in freely behaving mice in a white, opaque, rectangular chamber (Figure 3A). Mouse behavior was recorded with a camera that was placed above the recording chamber. The recordings were performed at least 2 h after anesthesia was ended. Figure 3B shows a representative recording of Ca2+ transients obtained from one mouse in both freely moving (upper) and resting (quiescent, but not sleeping; lower) states. In this example, when the mouse was moving freely, Ca2+ transients were observed with a high frequency, while almost no transients were observed in the resting states. On average, both the frequency (Figure 3C; moving: 0.32 ± 0.04 Hz vs. resting: 0.08 ± 0.01 Hz; p < 0.001, n = 8 mice, Wilcoxon signed-rank test) and amplitude (Figure 3D; moving: 1.51% ± 0.06% ΔF/F vs. resting: 0.24% ± 0.02% ΔF/F; p < 0.001, n = 8 mice, Wilcoxon signed-rank test) of the Ca2+ transients in the moving states were significantly higher than those in resting states. As a control, these signals were not seen in the mice whose layer 5 neurons expressed green fluorescent protein (GFP; Figures 3E,F).
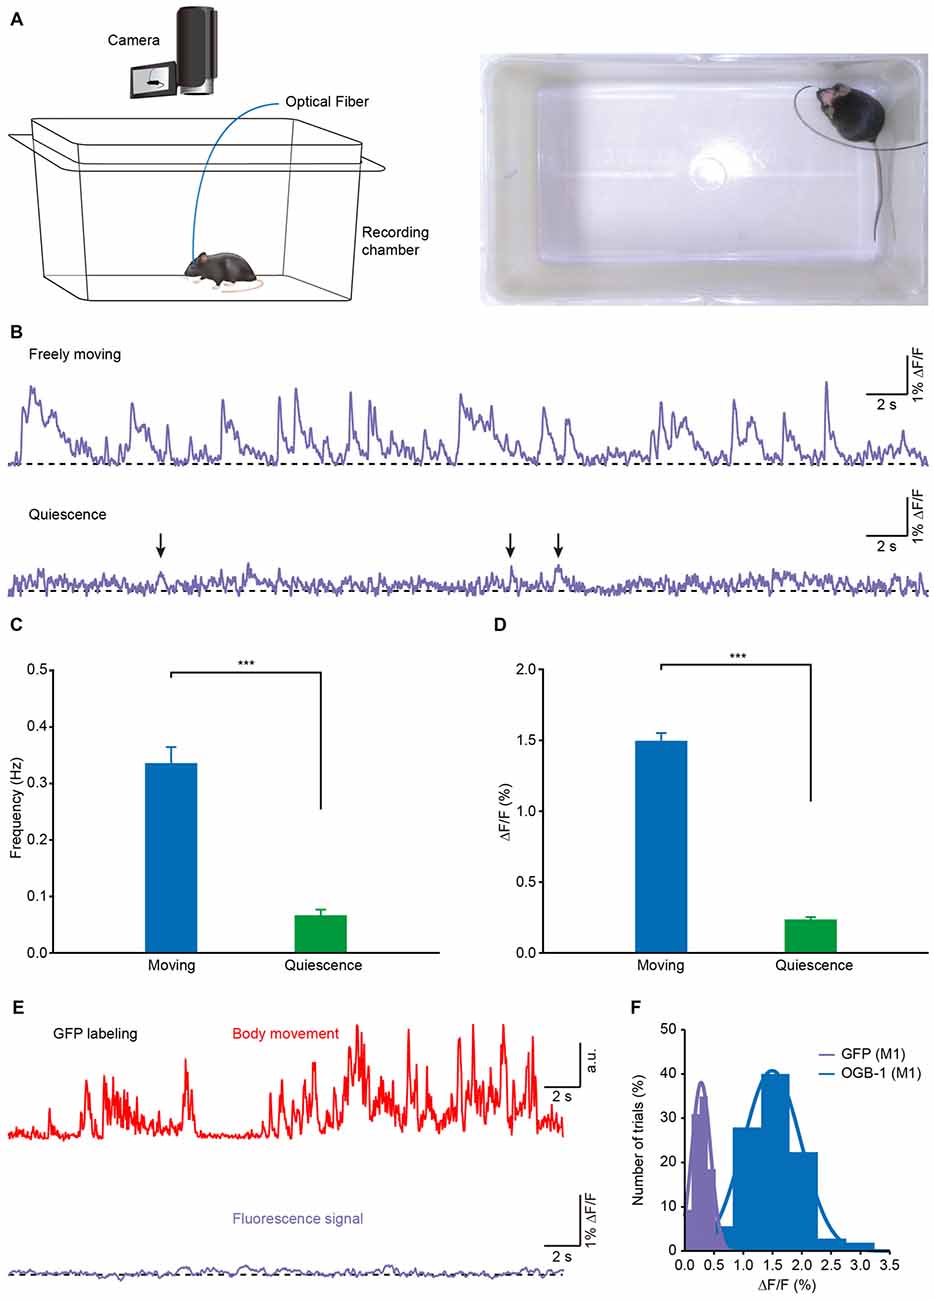
Figure 3. Population Ca2+ transients of the M1 in freely moving and resting (quiescent but not sleeping) states. (A) Left panel, scheme of the recording setup where Ca2+ transients and behavior were recorded simultaneously. Right panel, the actual recording condition. (B) Ca2+ transients of the M1 in freely moving and resting (but not sleeping) states. (C) Comparison of population Ca2+ transient frequencies in the M1 in freely moving and resting states in the first min after the mice were placed in the box (n = 8 mice; Wilcoxon signed-rank test, ***p < 0.001). (D) Comparison of population Ca2+ transient amplitudes in the M1 in freely moving and resting states (n = 8 mice; Wilcoxon signed-rank test, ***p < 0.001). (E) Example showing body movements (red) and simultaneously-recorded fluorescence (purple) from a green fluorescent protein (GFP) transgenic mouse during freely moving state. (F) Distribution of the amplitudes of OGB-1 and GFP fluorescence. Both fit Gaussian distributions and the mean values were 0.3% ΔF/F and 1.5% ΔF/F, respectively. Values are the mean ± SEM.
Next, we analyzed the correlation between body movement and the Ca2+ transients. We found that body movement (Figure 4A, upper) was always associated with Ca2+ transients in layer 5 neurons of the M1 (Figure 4A, lower). A closer analysis indicates that the Ca2+ transients preceded the onset of movement and were maintained throughout the entire process of each movement (see two examples in Figure 4B and the superimposition of 16 trials in Figure 4C). Across all the recordings (8 mice), the latency of the Ca2+ transients to the onset of movement fit a Gaussian distribution, and the median value was approximately −136 ms (Figure 4D).
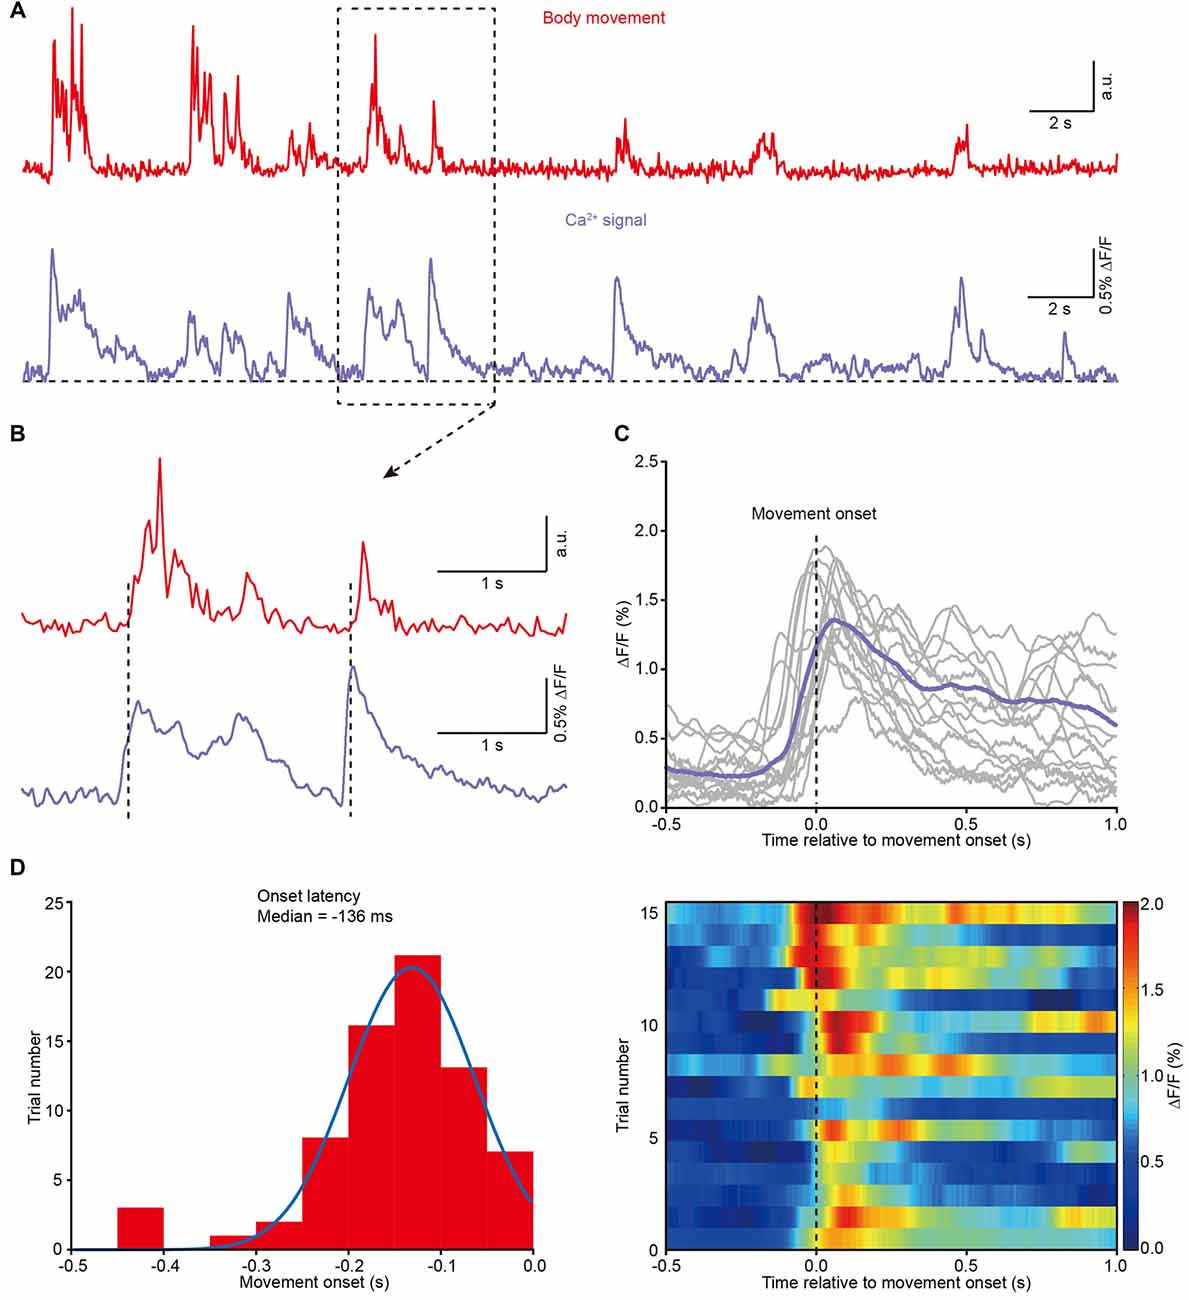
Figure 4. Population Ca2+ transients in the M1 precede the onset of body movement. (A) Example showing the body movements (red) and the related Ca2+ transients (purple) from a freely moving mouse. (B) Higher magnification of the dashed line box from panel (A). (C) Top panel, 16 trials from eight different mice and their average (purple) showing the relationship between movement onset and Ca2+ transients. Bottom panel, color-coded intensity of Ca2+ transients from different trials. (D) Distribution of onset latencies between body movements and Ca2+ transients.
Population Ca2+ Transients in the V1 Precede the Onset of Body Movement
It is well known that animals generally need to receive visual stimuli to guide and orient themselves during locomotion (Marigold, 2008). Recent studies have also reported that the activities of neurons in the visual cortex can be regulated by locomotion (Niell and Stryker, 2010; Keller et al., 2012; Ayaz et al., 2013). Thus, we wondered whether there were movement-related Ca2+ signals in the V1 of mouse during movement. Using the same approach, we recorded Ca2+ activities in layer 5 in the V1 in freely moving and resting states (Figure 5A). As expected, we found reliable movement-related population Ca2+ transients in layer 5 of the V1 (Figure 5B). Similar to the results observed in the M1, the onset of the Ca2+ transients slightly preceded the onset of impending movements and then persisted throughout the entire duration of the subsequent movement (see one example in Figure 5C and the superimposition of 14 trials in Figure 5D). Interestingly, the latency of the Ca2+ transients to the onset of movement was approximately −50 ms, which was later than the movement-related population Ca2+ transients in the M1 (Figures 5E,F; M1: 149.7 ± 10.3 ms vs. V1: 50.0 ± 4.7 ms, n = 8 and 7 mice, respectively; Wilcoxon rank-sum test). In addition, when we compared the amplitude of the population Ca2+ transients in the M1 and V1, there was no significant difference (Figure 5H; p = 0.085, n = 8 and 7 mice, respectively; Wilcoxon rank-sum test). Furthermore, we found that, compared to that under light conditions, in the dark both the amplitude and the correlation of movements and Ca2+ signals significantly decreased (Figures 5B,G,H).
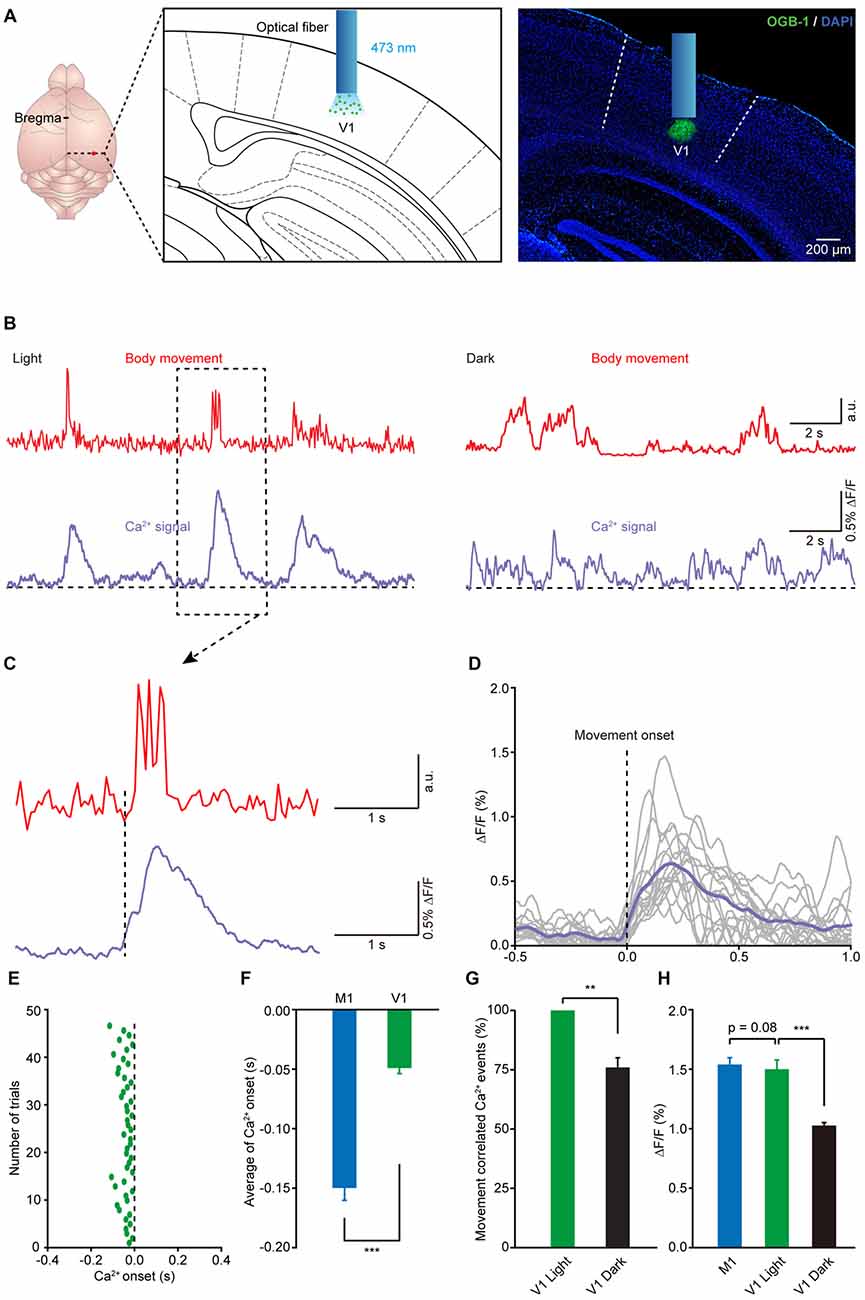
Figure 5. Population Ca2+ transients in the V1 precede the onset of body movement. (A) Left panel, schematic showing the optical fiber tip implanted above the layer 5 of the V1 stained with OGB-1. Right panel, post hoc fluorescence image of a coronal brain slice labeled with OGB-1 in layer 5 (green) of the V1. A blue bar indicates the position of an optical fiber. (B) Example showing the body movements (red) and the related Ca2+ transients (purple) in the V1 under both light (left) and dark (right) conditions. (C) Higher magnification of a dashed line box from (B). (D) Sixteen single trials and their average (purple) showing the relationship between movement onset and Ca2+ transients in the V1. (E) Distribution of onset latency from 48 trials in eight mice. (F) Comparison of onset latencies of population Ca2+ transients in the M1 and V1 (n = 8 and 7 mice, respectively; Wilcoxon rank-sum test, ***p < 0.001). (G) Comparison of the movement-correlated Ca2+ events between light and dark conditions in V1 (n = 7 and 6 mice, respectively; Wilcoxon rank-sum test, **p < 0.01). (H) Comparison of population Ca2+ transient amplitude in M1, V1 (light) and V1 (dark) (n = 8 and 7 mice, respectively; Wilcoxon rank-sum test, M1 vs. V1 (light), p = 0.0854; n = 7 and 6 mice, respectively; Wilcoxon rank-sum test, V1 (light) vs. V1 (dark), ***p < 0.001). Values are the mean ± SEM.
Population Ca2+ Transients of the M1 and V1 were Highly Correlated with Head Movement during Locomotion
To accurately generate goal-directed movements, one must acquire essential information about position and orientation. Visual and non-visual sources of information together contribute crucially to orientation. During the process of generating body movements, head movement is a critical factor in the perception of orientation (Frissen et al., 2011; Yoder and Taube, 2014). As a self-motion cue, head movement can be used accurately to update the perceived orientation (Sun et al., 2004a,b; Siegle et al., 2009). Thus, we hypothesized that head movement may be closely associated with neuronal activity in both M1 and V1. Figures 6A,B display two examples of population Ca2+ transients related to head movements, which were obtained in layer 5 neurons of the M1 (Figure 6A) and V1 (Figure 6B), respectively. Here, we analyzed three kinds of head movements: raising, rotation and withdrawal. The correlated Ca2+ events were detected in a time window of 500 ms before the onset of movement. When the signal peak was higher above three times of standard deviation of the baseline, it was defined as a movement-correlated Ca2+event. We observed that the occurrence of each kind of head movement was always associated with population Ca2+ transients in both the M1 and V1. Across all recordings, the population Ca2+ transients were 100% correlated with head movements (Figures 6C,E). Next, we determined whether there were differences among the Ca2+ transient amplitudes of these three head movements. We found no significant differences in the M1 (Figure 6D; raising: 1.65 ± 0.07% ΔF/F, rotation: 1.65 ± 0.08% ΔF/F, withdrawal; 1.55 ± 0.07% ΔF/F; p = 0.066, n = 8 mice, Kruskal-Wallis test) or the V1 (Figure 6F; raising: 1.59 ± 0.08% ΔF/F, rotation: 1.63 ± 0.08% ΔF/F, withdrawal: 1.68 ± 0.13% ΔF/F; p = 0.181, n = 7 mice, Kruskal-Wallis test). In contrast, almost no Ca2+ transients were observed during resting (quiescent) states (Figures 6D,F).
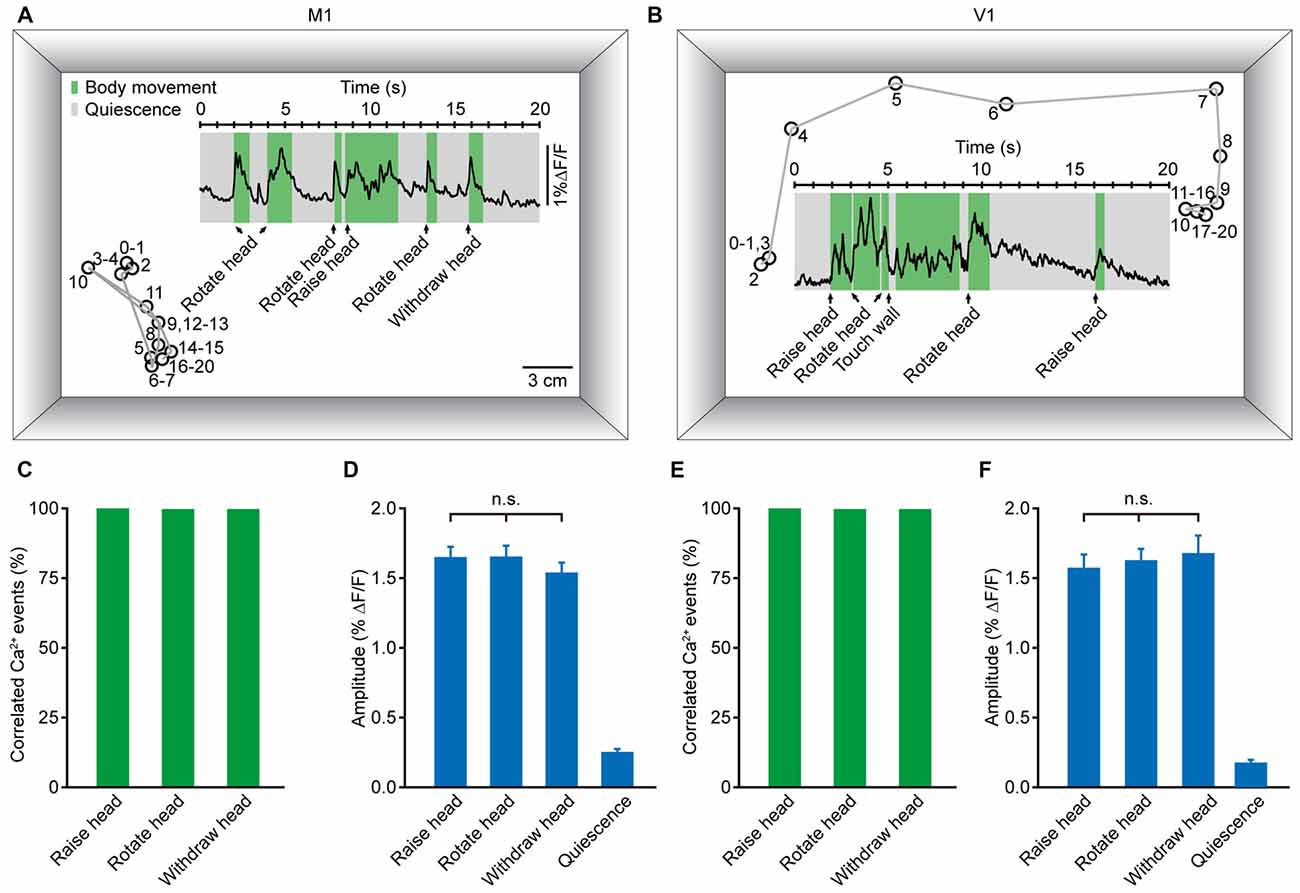
Figure 6. Population Ca2+ transients in the M1 and V1 were highly correlated with head movements in freely moving mice. (A,B) Examples showing the trial-by-trial correlation between head movements and population Ca2+ transients in the M1 (A) and V1 (B) in two different mice. Circles and gray lines indicate the position (head) and trajectory of the mouse, respectively; the large rectangular box indicates the recording chamber. (C,E) Ca2+ transients correlated with three different head movements: head raising, rotation and withdrawal in the M1 (C) and V1 (E). (D,F) Comparison of population Ca2+ transient amplitudes of the three head movements in the M1 (D) and V1 (F) (M1: n = 8 mice, Kruskal-Wallis test, χ2 = 5.421, p = 0.066; V1: n = 7 mice, Kruskal-Wallis test, χ2 = 3.423, p = 0.181).
Discussion
In this study, we applied an optical fiber-based Ca2+ recording approach to monitor local population Ca2+ activity in layer 5 neurons in the M1 and V1 of freely moving mice. In layer 5 neurons of the M1, we found population Ca2+ transients frequently occurring in both anesthetized and freely moving states. However, we observed only a very small number of signals when mice were still (resting but not sleeping). During locomotion, we found that Ca2+ transients reliably occurred approximately 100 ms before the onset of movement and then persisted throughout the whole process of each movement. This activity was similar to a previously defined activity in the monkey motor cortex, referred to as perimovement activity (Churchland et al., 2006, 2010; Kemere et al., 2008; Zimnik et al., 2015). Perimovement activity is defined as neuronal activity occurring approximately 100 ms before, during and just after the movement and was initially found using electrophysiological recordings. This neuronal activity was highly correlated with body movement in our recordings (Figure 6D). Moreover, we did not observe “preparatory activity,” which occurs much earlier than perimovement activity, approximately 900 ms before the onset of movement. Preparatory activity was thought to be related to motor planning (Churchland et al., 2010; Erisken et al., 2014; Flash and Bizzi, 2016) and was recently described in the mouse premotor cortex (anterior lateral motor cortex) but not in the M1.
Similar to the results in the M1, we found that population Ca2+ transients preceding impending movement also occurred in the layer 5 neurons of the V1. Interestingly, such activity in the V1 started ~100 ms later than that in M1. Previous studies have reported this preceding activity in upper layers as well as in deep layers using electrophysiological recordings in the V1 (Ayaz et al., 2013; Erisken et al., 2014; Vinck et al., 2015). Recent work has suggested that similar activity can originate from inhibitory interneurons (Polack et al., 2013; Reimer et al., 2014; Pakan et al., 2016), especially parvalbumin-positive interneurons (Polack et al., 2013; Pakan et al., 2016). In addition, this activity is probably the result of a combination of visual- and motor-related inputs (Ayaz et al., 2013; Erisken et al., 2014), which may reflect the interaction between animal locomotion and its environment. Therefore, this signal processing in the visual cortex may be essential for estimating and correcting information relevant for goal-directed navigation (Keller et al., 2012; Ayaz et al., 2013). Future work is needed to investigate the specific role of V1 signals in the generation of locomotion.
Population activity plays an important role in many brain functions, such as information processing, learning, memory and behavior. For example, extensive studies have focused on slow oscillations, i.e., slow population activity at a frequency less than 1 Hz mainly occurring during sleep and anesthesia (Steriade et al., 1993a,b,c; Brustein et al., 2003). Other types of population activity, such as theta and gamma waves, have also been described in different brain regions and thought to be relevant for brain functions (Seager et al., 2002; Nokia et al., 2008; Carr et al., 2012), such as attention (Ayaz et al., 2013; Başar et al., 2013; Clayton et al., 2015). The methods used to study this population activity were mainly dependent on electrophysiological recordings, such as local field potential recordings with a high temporal resolution. Here, we recorded the population activity from a spatially clustered group of neurons using an optical fiber-based approach. By locally injecting a small amount of Ca2+ dyes, we could achieve a recording of activity in a highly restricted area approximately 300–500 μm in diameter. In many other studies (Lütcke et al., 2010; Marshall et al., 2016), the use of genetically encoded Ca2+ or voltage sensors allowed the activity of cell type-specific neural populations to be recorded during free behavior. Using this simple but efficient approach, we studied locomotion-related population signals of neurons in deep layers of both the M1 and V1. In the near future, the application of endoscope-based imaging techniques with cellular resolution (Jung et al., 2004; Flusberg et al., 2005; Ziv et al., 2013) will provide more detailed information about the properties and sources of these locomotion-related signals.
In summary, our results illustrate that the optical fiber-based approach is an efficient method for monitoring cortical Ca2+ activity in freely behaving animals. Using this method, we provide insights into body movement-related population neuronal activity in both the M1 and V1, which could be the first step toward understanding cortical information processing during locomotion.
Author Contributions
QZ, JYao, YG, HJ, JYan, ZF, WL and XC contributed to the design of the study and interpretation of the data. QZ, JYao, YG, HQ, JZ, JP and HJ performed the experiments and acquired the data. QZ, SL, JG, XL, WJ and HQ processed and analyzed the data. QZ, ZF, WL and XC wrote the manuscript with help from all the other authors.
Conflict of Interest Statement
The authors declare that the research was conducted in the absence of any commercial or financial relationships that could be construed as a potential conflict of interest.
Acknowledgments
We thank JL for assisting in composing the figures. This work was supported by grants from the 1000 Talents Program for Young Scholars, the Nature Science Foundation of China (Nos. 81671106, 31400933, 31572350) and the National Basic Research Program of China (“973 Program”: 2015CB759500). XC is a junior fellow of the CAS Center for Excellence in Brain Science and Intelligence Technology.
References
Adelsberger, H., Garaschuk, O., and Konnerth, A. (2005). Cortical calcium waves in resting newborn mice. Nat. Neurosci. 8, 988–990. doi: 10.1038/nn1502
Adelsberger, H., Zainos, A., Alvarez, M., Romo, R., and Konnerth, A. (2014). Local domains of motor cortical activity revealed by fiber-optic calcium recordings in behaving nonhuman primates. Proc. Natl. Acad. Sci. U S A 111, 463–468. doi: 10.1073/pnas.1321612111
Ayaz, A., Saleem, A. B., Schölvinck, M. L., and Carandini, M. (2013). Locomotion controls spatial integration in mouse visual cortex. Curr. Biol. 23, 890–894. doi: 10.1016/j.cub.2013.04.012
Başar, E., Başar-Eroğlu, C., Güntekin, B., and Yener, G. G. (2013). Brain’s alpha, beta, gamma, delta, and theta oscillations in neuropsychiatric diseases: proposal for biomarker strategies. Suppl. Clin. Neurophysiol. 62, 19–54. doi: 10.1016/b978-0-7020-5307-8.00002-8
Berger, T., Borgdorff, A., Crochet, S., Neubauer, F. B., Lefort, S., Fauvet, B., et al. (2007). Combined voltage and calcium epifluorescence imaging in vitro and in vivo reveals subthreshold and suprathreshold dynamics of mouse barrel cortex. J. Neurophysiol. 97, 3751–3762. doi: 10.1152/jn.01178.2006
Brustein, E., Marandi, N., Kovalchuk, Y., Drapeau, P., and Konnerth, A. (2003). “in vivo” monitoring of neuronal network activity in zebrafish by two-photon Ca2+ imaging. Pflugers. Arch. 446, 766–773. doi: 10.1007/s00424-003-1138-4
Bullock, T. H. (1997). Signals and signs in the nervous system: the dynamic anatomy of electrical activity is probably information-rich. Proc. Natl. Acad. Sci. U S A 94, 1–6. doi: 10.1073/pnas.94.1.1
Carr, M. F., Karlsson, M. P., and Frank, L. M. (2012). Transient slow gamma synchrony underlies hippocampal memory replay. Neuron 75, 700–713. doi: 10.1016/j.neuron.2012.06.014
Chen, X., Leischner, U., Rochefort, N. L., Nelken, I., and Konnerth, A. (2011). Functional mapping of single spines in cortical neurons in vivo. Nature 475, 501–505. doi: 10.1038/nature10193
Chen, T. W., Wardill, T. J., Sun, Y., Pulver, S. R., Renninger, S. L., Baohan, A., et al. (2013). Ultrasensitive fluorescent proteins for imaging neuronal activity. Nature 499, 295–300. doi: 10.1038/nature12354
Churchland, M. M., Cunningham, J. P., Kaufman, M. T., Ryu, S. I., and Shenoy, K. V. (2010). Cortical preparatory activity: representation of movement or first cog in a dynamical machine? Neuron 68, 387–400. doi: 10.1016/j.neuron.2010.09.015
Churchland, M. M., Santhanam, G., and Shenoy, K. V. (2006). Preparatory activity in premotor and motor cortex reflects the speed of the upcoming reach. J. Neurophysiol. 96, 3130–3146. doi: 10.1152/jn.00307.2006
Clayton, M. S., Yeung, N., and Cohen Kadosh, R. (2015). The roles of cortical oscillations in sustained attention. Trends. Cogn. Sci. 19, 188–195. doi: 10.1016/j.tics.2015.02.004
Denk, W., Strickler, J. H., and Webb, W. W. (1990). Two-photon laser scanning fluorescence microscopy. Science 248, 73–76. doi: 10.1126/science.2321027
Engel, A. K., Fries, P., and Singer, W. (2001). Dynamic predictions: oscillations and synchrony in top-down processing. Nat. Rev. Neurosci. 2, 704–716. doi: 10.1038/35094565
Erisken, S., Vaiceliunaite, A., Jurjut, O., Fiorini, M., Katzner, S., and Busse, L. (2014). Effects of locomotion extend throughout the mouse early visual system. Curr. Biol. 24, 2899–2907. doi: 10.1016/j.cub.2014.10.045
Flash, T., and Bizzi, E. (2016). Cortical circuits and modules in movement generation: experiments and theories. Curr. Opin. Neurobiol. 41, 174–178. doi: 10.1016/j.conb.2016.09.013
Flusberg, B. A., Cocker, E. D., Piyawattanametha, W., Jung, J. C., Cheung, E. L., and Schnitzer, M. J. (2005). Fiber-optic fluorescence imaging. Nat. Methods 2, 941–950. doi: 10.1038/nmeth820
Frissen, I., Campos, J. L., Souman, J. L., and Ernst, M. O. (2011). Integration of vestibular and proprioceptive signals for spatial updating. Exp. Brain Res. 212, 163–176. doi: 10.1007/s00221-011-2717-9
Grienberger, C., Adelsberger, H., Stroh, A., Milos, R. I., Garaschuk, O., Schierloh, A., et al. (2012). Sound-evoked network calcium transients in mouse auditory cortex in vivo. J. Physiol. 590, 899–918. doi: 10.1113/jphysiol.2011.222513
Griffin, D. M., Hoffman, D. S., and Strick, P. L. (2015). Corticomotoneuronal cells are “functionally tuned”. Science 350, 667–670. doi: 10.1126/science.aaa8035
Grosse, G., Draguhn, A., Hohne, L., Tapp, R., Veh, R. W., and Ahnert-Hilger, G. (2000). Expression of Kv1 potassium channels in mouse hippocampal primary cultures: development and activity-dependent regulation. J. Neurosci. 20, 1869–1882.
Gunaydin, L. A., Grosenick, L., Finkelstein, J. C., Kauvar, I. V., Fenno, L. E., Adhikari, A., et al. (2014). Natural neural projection dynamics underlying social behavior. Cell 157, 1535–1551. doi: 10.1016/j.cell.2014.05.017
Guo, Q., Zhou, J., Feng, Q., Lin, R., Gong, H., Luo, Q., et al. (2015). Multi-channel fiber photometry for population neuronal activity recording. Biomed. Opt. Express 6, 3919–3931. doi: 10.1364/BOE.6.003919
Hires, S. A., Tian, L., and Looger, L. L. (2008). Reporting neural activity with genetically encoded calcium indicators. Brain Cell Biol. 36, 69–86. doi: 10.1007/s11068-008-9029-4
Jennings, J. H., Ung, R. L., Resendez, S. L., Stamatakis, A. M., Taylor, J. G., Huang, J., et al. (2015). Visualizing hypothalamic network dynamics for appetitive and consummatory behaviors. Cell 160, 516–527. doi: 10.1016/j.cell.2014.12.026
Jung, J. C., Mehta, A. D., Aksay, E., Stepnoski, R., and Schnitzer, M. J. (2004). in vivo mammalian brain imaging using one- and two-photon fluorescence microendoscopy. J. Neurophysiol. 92, 3121–3133. doi: 10.1152/jn.00234.2004
Keller, G. B., Bonhoeffer, T., and Hübener, M. (2012). Sensorimotor mismatch signals in primary visual cortex of the behaving mouse. Neuron 74, 809–815. doi: 10.1016/j.neuron.2012.03.040
Kemere, C., Santhanam, G., Yu, B. M., Afshar, A., Ryu, S. I., Meng, T. H., et al. (2008). Detecting neural-state transitions using hidden markov models for motor cortical prostheses. J. Neurophysiol. 100, 2441–2452. doi: 10.1152/jn.00924.2007
Komuro, H., and Kumada, T. (2005). Ca2+ transients control CNS neuronal migration. Cell Calcium 37, 387–393. doi: 10.1016/j.ceca.2005.01.006
Landsness, E. C., Crupi, D., Hulse, B. K., Peterson, M. J., Huber, R., Ansari, H., et al. (2009). Sleep-dependent improvement in visuomotor learning: a causal role for slow waves. Sleep 32, 1273–1284.
Levine, A. J., Hinckley, C. A., Hilde, K. L., Driscoll, S. P., Poon, T. H., Montgomery, J. M., et al. (2014). Identification of a cellular node for motor control pathways. Nat. Neurosci. 17, 586–593. doi: 10.1038/nn.3675
Lütcke, H., Murayama, M., Hahn, T., Margolis, D. J., Astori, S., Zum Alten Borgloh, S. M., et al. (2010). Optical recording of neuronal activity with a genetically-encoded calcium indicator in anesthetized and freely moving mice. Front. Neural Circuits 4:9. doi: 10.3389/fncir.2010.00009
Mank, M., and Griesbeck, O. (2008). Genetically encoded calcium indicators. Chem. Rev. 108, 1550–1564. doi: 10.1021/cr078213v
Mao, B. Q., Hamzei-Sichani, F., Aronov, D., Froemke, R. C., and Yuste, R. (2001). Dynamics of spontaneous activity in neocortical slices. Neuron 32, 883–898. doi: 10.1016/s0896-6273(01)00518-9
Marigold, D. S. (2008). Role of peripheral visual cues in online visual guidance of locomotion. Exerc. Sport Sci. Rev. 36, 145–151. doi: 10.1097/JES.0b013e31817bff72
Marigold, D. S., and Drew, T. (2011). Contribution of cells in the posterior parietal cortex to the planning of visually guided locomotion in the cat: effects of temporary visual interruption. J. Neurophysiol. 105, 2457–2470. doi: 10.1152/jn.00992.2010
Marshall, J. D., Li, J. Z., Zhang, Y., Gong, Y., St-Pierre, F., Lin, M. Z., et al. (2016). Cell-type-specific optical recording of membrane voltage dynamics in freely moving mice. Cell 167, 1650.e15–1662.e15. doi: 10.1016/j.cell.2016.11.021
Murayama, M., Pérez-Garci, E., Lüscher, H. R., and Larkum, M. E. (2007). Fiberoptic system for recording dendritic calcium signals in layer 5 neocortical pyramidal cells in freely moving rats. J. Neurophysiol. 98, 1791–1805. doi: 10.1152/jn.00082.2007
Nadella, K. M., Roš, H., Baragli, C., Griffiths, V. A., Konstantinou, G., Koimtzis, T., et al. (2016). Random-access scanning microscopy for 3D imaging in awake behaving animals. Nat. Methods 13, 1001–1004. doi: 10.1038/nmeth.4033
Niell, C. M., and Stryker, M. P. (2010). Modulation of visual responses by behavioral state in mouse visual cortex. Neuron 65, 472–479. doi: 10.1016/j.neuron.2010.01.033
Nokia, M. S., Penttonen, M., Korhonen, T., and Wikgren, J. (2008). Hippocampal theta (3–8 Hz) activity during classical eyeblink conditioning in rabbits. Neurobiol. Learn. Mem. 90, 62–70. doi: 10.1016/j.nlm.2008.01.005
Pakan, J. M., Lowe, S. C., Dylda, E., Keemink, S. W., Currie, S. P., Coutts, C. A., et al. (2016). Behavioral-state modulation of inhibition is context-dependent and cell type specific in mouse visual cortex. Elife 5:e14985. doi: 10.7554/eLife.14985
Paukert, M., Agarwal, A., Cha, J., Doze, V. A., Kang, J. U., and Bergles, D. E. (2014). Norepinephrine controls astroglial responsiveness to local circuit activity. Neuron 82, 1263–1270. doi: 10.1016/j.neuron.2014.04.038
Pesaran, B., Pezaris, J. S., Sahani, M., Mitra, P. P., and Andersen, R. A. (2002). Temporal structure in neuronal activity during working memory in macaque parietal cortex. Nat. Neurosci. 5, 805–811. doi: 10.1038/nn890
Polack, P. O., Friedman, J., and Golshani, P. (2013). Cellular mechanisms of brain state-dependent gain modulation in visual cortex. Nat. Neurosci. 16, 1331–1339. doi: 10.1038/nn.3464
Rathelot, J. A., and Strick, P. L. (2009). Subdivisions of primary motor cortex based on cortico-motoneuronal cells. Proc. Natl. Acad. Sci. U S A 106, 918–923. doi: 10.1073/pnas.0808362106
Reimer, J., Froudarakis, E., Cadwell, C. R., Yatsenko, D., Denfield, G. H., and Tolias, A. S. (2014). Pupil fluctuations track fast switching of cortical states during quiet wakefulness. Neuron 84, 355–362. doi: 10.1016/j.neuron.2014.09.033
Rolls, A., Colas, D., Adamantidis, A., Carter, M., Lanre-Amos, T., Heller, H. C., et al. (2011). Optogenetic disruption of sleep continuity impairs memory consolidation. Proc. Natl. Acad. Sci. U S A 108, 13305–13310. doi: 10.1073/pnas.1015633108
Schulz, K., Sydekum, E., Krueppel, R., Engelbrecht, C. J., Schlegel, F., Schroter, A., et al. (2012). Simultaneous BOLD fMRI and fiber-optic calcium recording in rat neocortex. Nat. Methods 9, 597–602. doi: 10.1038/nmeth.2013
Seager, M. A., Johnson, L. D., Chabot, E. S., Asaka, Y., and Berry, S. D. (2002). Oscillatory brain states and learning: impact of hippocampal theta-contingent training. Proc. Natl. Acad. Sci. U S A 99, 1616–1620. doi: 10.1073/pnas.032662099
Shenoy, K. V., Sahani, M., and Churchland, M. M. (2013). Cortical control of arm movements: a dynamical systems perspective. Annu. Rev. Neurosci. 36, 337–359. doi: 10.1146/annurev-neuro-062111-150509
Siegle, J. H., Campos, J. L., Mohler, B. J., Loomis, J. M., and Bulthoff, H. H. (2009). Measurement of instantaneous perceived self-motion using continuous pointing. Exp. Brain Res. 195, 429–444. doi: 10.1007/s00221-009-1805-6
Steriade, M., Contreras, D., Curró Dossi, R., and Nuñez, A. (1993a). The slow (<1 Hz) oscillation in reticular thalamic and thalamocortical neurons: scenario of sleep rhythm generation in interacting thalamic and neocortical networks. J. Neurosci. 13, 3284–3299.
Steriade, M., Nunez, A., and Amzica, F. (1993b). A novel slow (<1 Hz) oscillation of neocortical neurons in vivo: depolarizing and hyperpolarizing components. J. Neurosci. 13, 3252–3265.
Steriade, M., Nuñez, A., and Amzica, F. (1993c). Intracellular analysis of relations between the slow (<1 Hz) neocortical oscillation and other sleep rhythms of the electroencephalogram. J. Neurosci. 13, 3266–3283.
Steriade, M., and Timofeev, I. (2003). Neuronal plasticity in thalamocortical networks during sleep and waking oscillations. Neuron 37, 563–576. doi: 10.1016/s0896-6273(03)00065-5
Stosiek, C., Garaschuk, O., Holthoff, K., and Konnerth, A. (2003). In vivo two-photon calcium imaging of neuronal networks. Proc. Natl. Acad. Sci. U S A 100, 7319–7324. doi: 10.1073/pnas.1232232100
Stroh, A., Adelsberger, H., Groh, A., Rühlmann, C., Fischer, S., Schierloh, A., et al. (2013). Making Waves: initiation and propagation of corticothalamic Ca2+ waves in vivo. Neuron 77, 1136–1150. doi: 10.1016/j.neuron.2013.01.031
Sun, H. J., Campos, J. L., and Chan, G. S. (2004a). Multisensory integration in the estimation of relative path length. Exp. Brain Res. 154, 246–254. doi: 10.1007/s00221-003-1652-9
Sun, H. J., Campos, J. L., Young, M., Chan, G. S., and Ellard, C. G. (2004b). The contributions of static visual cues, nonvisual cues, and optic flow in distance estimation. Perception 33, 49–65. doi: 10.1068/p5145
Szalay, G., Judák, L., Katona, G., Ócsai, K., Juhász, G., Veress, M., et al. (2016). Fast 3D imaging of spine, dendritic, and neuronal assemblies in behaving animals. Neuron 92, 723–738. doi: 10.1016/j.neuron.2016.10.002
Vinck, M., Batista-Brito, R., Knoblich, U., and Cardin, J. A. (2015). Arousal and locomotion make distinct contributions to cortical activity patterns and visual encoding. Neuron 86, 740–754. doi: 10.1016/j.neuron.2015.03.028
Wise, S. P. (1985). The primate premotor cortex: past, present, and preparatory. Annu. Rev. Neurosci. 8, 1–19. doi: 10.1146/annurev.ne.08.030185.000245
Yoder, R. M., and Taube, J. S. (2014). The vestibular contribution to the head direction signal and navigation. Front. Integr. Neurosci. 8:32. doi: 10.3389/fnint.2014.00032
Yuste, R., and Denk, W. (1995). Dendritic spines as basic functional units of neuronal integration. Nature 375, 682–684. doi: 10.1038/375682a0
Zimnik, A. J., Nora, G. J., Desmurget, M., and Turner, R. S. (2015). Movement-related discharge in the macaque globus pallidus during high-frequency stimulation of the subthalamic nucleus. J. Neurosci. 35, 3978–3989. doi: 10.1523/JNEUROSCI.4899-14.2015
Keywords: population Ca2+ transients, optical fiber, motor cortex, visual cortex, freely moving mouse
Citation: Zhang Q, Yao J, Guang Y, Liang S, Guan J, Qin H, Liao X, Jin W, Zhang J, Pan J, Jia H, Yan J, Feng Z, Li W and Chen X (2017) Locomotion-Related Population Cortical Ca2+ Transients in Freely Behaving Mice. Front. Neural Circuits 11:24. doi: 10.3389/fncir.2017.00024
Received: 05 February 2017; Accepted: 27 March 2017;
Published: 07 April 2017.
Edited by:
Minmin Luo, Tsinghua University, ChinaReviewed by:
Xiaohong Xu, Institute of Neuroscience (CAS), ChinaLiping Wang, Shenzhen Institutes of Advanced Technology (CAS), China
Helmuth Adelsberger, Technische Universität München, Germany
Copyright © 2017 Zhang, Yao, Guang, Liang, Guan, Qin, Liao, Jin, Zhang, Pan, Jia, Yan, Feng, Li and Chen. This is an open-access article distributed under the terms of the Creative Commons Attribution License (CC BY). The use, distribution or reproduction in other forums is permitted, provided the original author(s) or licensor are credited and that the original publication in this journal is cited, in accordance with accepted academic practice. No use, distribution or reproduction is permitted which does not comply with these terms.
*Correspondence: Zhengzhi Feng, fzz@tmmu.edu.cn
Weibing Li, liweibing1963@126.com
Xiaowei Chen, xiaowei_chen@tmmu.edu.cn
† These authors have contributed equally to this work.