Isotropic 25-Micron 3D Neuroimaging Using ex vivo Microstructural Manganese-Enhanced MRI (MEMRI)
 Chika Sato
 Kazuhiko Sawada
 David Wright4,5
  Ichio Aoki
- 1Department of Molecular Imaging and Theranostics, National Institute of Radiological Sciences, National Institutes for Quantum and Radiological Science and Technology (QST), Chiba, Japan
- 2Group of Quantum-State Controlled MRI, QST, Chiba, Japan
- 3Department of Nutrition, Faculty of Medical and Health Sciences, Tsukuba International University, Ibaraki, Japan
- 4Department of Neuroscience, Central Clinical School, Monash University, Melbourne, VIC, Australia
- 5Florey Institute of Neuroscience and Mental Health, Parkville, VIC, Australia
MRI observations following in vivo administration of Mn2+ [manganese (Mn)-enhanced MRI, MEMRI] have been used as an excellent morphological and functional MRI tool for in vivo preclinical studies. To detect brain three-dimensional (3D) microstructures, we improved the ex vivo MEMRI method for mouse brains after in vivo Mn administration and obtained high-resolution MRIs using a cryogenic radiofrequency (RF) coil. Male C57BL/6 mice (n = 8) were injected with 50 mM MnCl2 intravenously and MEMRIs of the brain were acquired in vivo after 24 h, followed by perfusion fixation with a 4% paraformaldehyde (PFA) solution. High-resolution 25-μm isotropic MRIs were successfully acquired from the extracted brain tissue and could identify the brain microstructures, especially in the hippocampus [the pyramidal cell layer through CA1–3 and the dentate gyrus (DG) granular layers (GLs)], cell layers of cerebellum, three sub-regions of the deep cerebellar nucleus, and white matter (WM) structures [e.g., the fasciculus retroflexus (fr) and optic tract in the thalamus]. The following technical conditions were also examined: (i) the longitudinal stability of Mn-enhanced ex vivo tissue after in vivo administration; and (ii) the effects of mixing glutaraldehyde (GA) with the fixative solution for the preservation of in vivo MEMRI contrast. Our results indicate that ex vivo MEMRI observations made shortly after fixation maintain the contrast observed in vivo. This research will be useful for non-destructive whole-brain pathological analysis.
Introduction
Evaluations of the individual whole-brain structure are important for the analysis of disease mechanisms and therapeutic efficacy assessments (Angenstein et al., 2007; Badea et al., 2007; Sawiak et al., 2009; Kumar et al., 2014; Scholz et al., 2015). Although optical microscopic observations of serial tissue sections are widely used and three-dimensional (3D) reconstructions of the brain have already been reported (Lein et al., 2007; Vandenberghe et al., 2016), sequential thin sectioning of the entire brain and its image acquisition are time-consuming procedures. In vivo MRI has the advantage of facilitating functional, metabolic and kinetic observational research. However, it is difficult to increase the spatial resolution because of the problems of involuntary movement in subjects, respiratory and cardiac motion, and limited scanning time because of anesthesia use. In recent animal studies, ex vivo micro-imaging techniques using high-field MRI with high-power gradients and sensitive radiofrequency (RF) coil systems have succeeded in obtaining high spatial resolution 3D imaging (3D micro-MRI) of tissue samples (Cleary et al., 2011; Kamsu et al., 2013), facilitating detailed visualization of morphological information (Johnson et al., 2012; Phillips et al., 2015).
Manganese (Mn) is a positive contrast agent and can also be used as a tissue immersion method in ex vivo brain samples (Norris et al., 2013; Wu and Zhang, 2016). Tissue immersion methods using Gd-chelate or Mn are helpful for rapid 3D micro-MRI measurements because of the shortening of longitudinal relaxation time (T1) and higher positive contrast. However, in ex vivo immersion methods, Gd-chelate or Mn are distributed throughout the brain and bind to cells/tissue in a non-specific manner, and as such, cannot reflect the “functional” information.
Mn2+ can mimic Ca2+ in many biological systems and accumulates in the living cell through Ca2+ channels (Lin and Koretsky, 1997). Thus, MR imaging following in vivo Mn administration (Mn-enhanced MRI, MEMRI) has been used for functional and microstructural imaging (Aoki et al., 2004; Yu et al., 2005; Silva et al., 2008; Watanabe et al., 2008; Chan et al., 2014). Although most MEMRI studies have been performed using in vivo administration and in vivo observation, ex vivo observation after in vivo Mn chloride (MnCl2) administration is also possible and offers improved spatial resolution without motion artifacts. In addition, ex vivo MEMRI may reflect not only the anatomical structures, but also the functional information in whole mice brains. However, there is a dearth of research on ex vivo microstructural MEMRI, and only a few ex vivo MEMRI studies have been reported (Bangasser et al., 2013; Liu et al., 2013). The Mn2+ stability in the fixed tissue may be short, and the perfusion fixation process or immersion to a fixative solution may attenuate the contrast (Huang et al., 2009; Norris et al., 2013). Liu et al. (2013) showed that perfusion fixing with a glutaraldehyde (GA) solution preserved the tissue enhancement of in vivo Mn2+, in the short term (<48 h); however, they did not assess its long-term stability.
To observe the single-layer 3D structure in ex vivo mice brains, we improve the spatial resolution of MRI to 25 μm isotropic using ex vivo MEMRI following in vivo Mn administration. Specifically, we: (i) optimized the longitudinal stability of ex vivo Mn enhancement after in vivo administration; and (ii) assessed whether the addition of GA to the fixative solution maintains ex vivo MEMRI contrast.
Materials and Methods
Animals
All animal experiments were approved by the Animal Welfare Committee of the National Institute of Radiological Sciences, Quantum and Radiological Science and Technology (QST), Chiba, Japan (No. 14-1007-5). Seventeen mice (Mus musculus, C57BL/6, male, 8−10 weeks old; CLEA Japan Inc., Tokyo, Japan) were housed under a 12-h light/dark cycle with access to food and water ad libitum. Room temperature was consistent at 23 ± 1°C.
Experimental Design
The mice were randomly assigned to one of five groups, having the following characteristics (Figure 1 and Table 1): No Mn administration (“NoMn”; intact mice; n = 5; body weight, 27.3 ± 1.0 g); ex vivo MEMRI was performed 2–3 h after fixation (“Mn0d”; Mn was infused in vivo and MRI measurements were conducted shortly after fixation; n = 5; 26.1 ± 0.7 g); and ex vivo MEMRI performed 7 days after fixation (“Mn7d”; Mn was infused in vivo and the extracted brain was immersed in 4% paraformaldehyde (PFA) solution for 7 days; n = 3; 27.9 g ± 0.7 g). The remaining group was divided into two subgroups: ex vivo MEMRI perfused by 4% PFA with 1% GA (PFA + 1% GA; n = 2; 27.6 ± 0.1 g), and ex vivo MEMRI perfused by 4% PFA with 2.5% GA (n = 2; 23.7 ± 0.1 g).
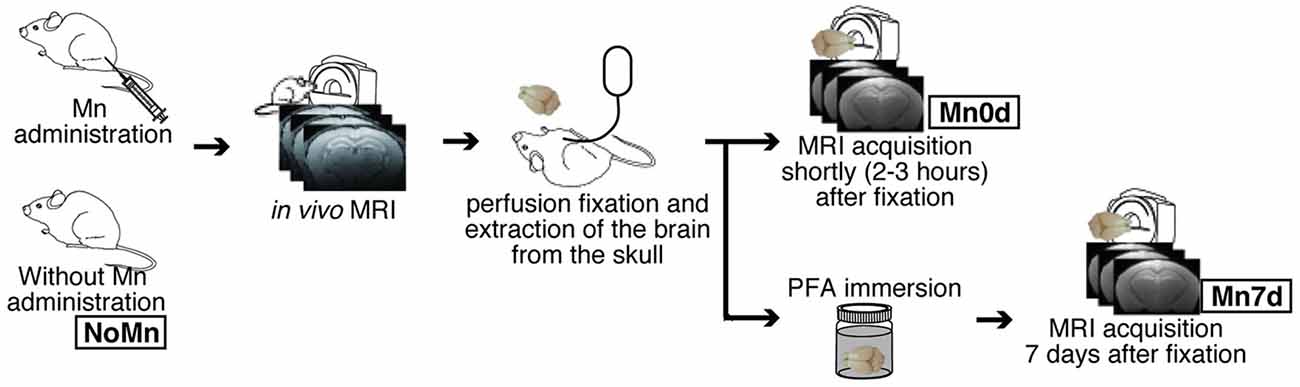
Figure 1. Overview of experimental procedures. Twelve mice were injected with manganese chloride (MnCl2) and scanned using a 7-T preclinical MRI 24 h and 7 days later (in vivo MRI).
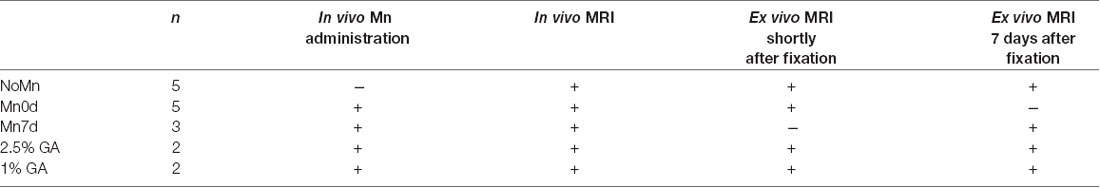
Table 1. Sample preparation and procedures for each group in Experiment 1.
To observe the Mn2+ preservation in the ex vivo brain tissue longitudinally, MnCl2 was administered in vivo to the mice. T1-weighted (T1W) MRIs were obtained in vivo 24 h after the MnCl2 administration (in vivo MEMRI), and the extracted brain tissue was then observed once again using MRI (ex vivo MEMRI). We tested two types of Mn-enhanced samples for the ex vivo MEMRI study, i.e., those obtained shortly (Mn0d group) or 7 days after fixation (Mn7d group), to examine the influence of the perfusion fixation and the stability of the Mn in the tissue. Moreover, to evaluate the effects of GA against accumulated Mn in brain tissue, we observed the Mn-enhanced sample using a fixative solution with 1% and 2.5% GA.
In vivo MEMRI
Of the 17 mice, 12 were administered MnCl2 (50 mM, osmotic pressure-controlled, 100-mg/kg body weight, 250 μl/h; Sigma-Aldrich, St. Louis, MO, USA) via their tail vein. The in vivo MEMRI of the mouse brains was performed using a 7.0 T preclinical MRI (Avance-III, 20-cm bore; Bruker Biospin, Billerica, MA, USA) with a cryogenically cooled RF coil 22 h after Mn administration. Thirteen mice were anesthetized using 2% isoflurane (Mylan Inc., Osaka, Japan) in O2 for induction and maintenance, and were fixed in a designated cradle by ear and bite bars. Their respiration and rectal temperatures were monitored during measurements. An in vivo T1W 3D image was obtained using the rapid acquisition with relaxation enhancement (RARE) sequence: repetition time (TR)/echo time (TE) = 400/8.65 ms (effective TE = 8.65 ms), RARE factor = 2, field of view (FOV) = 12 × 8 × 15 mm3, matrix = 160 × 108 × 100, voxel size = 75 × 75 × 150 μm3, number of averages (NA) = 1, and total scan time = 36 min. A RARE sequence with variable repetition time was used for T1 and T2 mapping with the following settings: TR = 200, 400, 800, 1,500, 3,000 and 5,000 ms; TE = 11, 33, 55, 77 and 99 ms; FOV = 19.2 × 19.2 mm2; acquisition matrix = 256 × 256; and total scan time = 17 min 26 s.
Perfusion Fixation and Tissue Preparation
After the in vivo MEMRI, the mice were deeply anesthetized using sodium pentobarbital (50 mg/kg body weight, i.p., Somnopentyl, Kyoritsu Seiyaku Corporation, Tokyo, Japan) following 2% isoflurane and transcardial perfusion fixation using saline and fixative solutions. The types of fixative solutions were 4% PFA in 0.1 M phosphate buffered saline (PBS, pH 7.4; Wako Pure Chemical Industries Ltd., Osaka, Japan), and 1% and 2.5% GA (Wako Pure Chemical Industries) in 4% PFA/PBS for the PFA + 1% or 2.5% GA group. The perfusion fixation was initiated 24 h after Mn administration. The mouse brains were carefully removed from the skull and immersed in a fluorine compound (Fomblin, CF3O[-CF(CF3)CF2O-]x(-CF2O-)yCF3; Solvay Solexis, NJ, USA) for ex vivo MEMRI. For longitudinal observation, the extracted brains using PFA were kept in the fixative solution for 7 days at 4°C and immersed in a fluorine compound. For the experiments of GA addition to the fixative solution, the fluorine compound was gently washed out from the brain samples perfused by PFA/GA using PBS after ex vivo MEMRI shortly after fixation. The extracted brains were kept in the PFA/GA fixative solution for 7 days at 4°C, and re-immersed in a fluorine compound for longitudinal observation.
Ex vivo MEMRI
The ex vivo images were obtained using the same 7.0-T MRI scanner and coil as for the in vivo study. Ex vivo T1W 3D images were obtained using RARE and a fast low-angle shot (FLASH) sequence. The parameters of the RARE, T1 and T2 map sequences were identical to those listed in subsection 2.2.1. The FLASH sequence parameters were TR/TE = 200/9 ms, flip angle = 60°, FOV = 7.5 × 10 × 7.5 mm3, matrix = 300 × 400 × 300, voxel size = 25 × 25 × 25 μm3, and NA = 2. The total scan time was 14 h. The image acquisition was performed in the following order: T1 and T2 mapping, RARE, and FLASH. The entire scanning time was 14 h 53 min.
Data Analysis
In vivo and ex vivo MRI data were reconstructed using ParaVision (Version 5.1, Bruker-Biospin, Billerica, MA, USA), imported into Fiji/ImageJ software (Version 1.0, National Institutes of Health), and the contrast was optimized. Signal intensities of T1W images for the longitudinal ex vivo MRI were adjusted based on the background signal level. Quantitative T1 and T2 maps were calculated using ParaVision. R1 and R2 values were calculated for a number of regions of interest (ROIs) including the retrosplenial agranular and granular cortices, association cortex, somatosensory cortex and auditory cortex (Bregma −1.82 mm). ROIs were delineated according to the Paxinos mouse brain atlas (Paxinos and Franklin, 2013). The brain volumes were measured using the OsiriX image viewer (Pixmeo, Switzerland). The raw data supporting the conclusions of this manuscript will be made available by the authors, without undue reservation, to any qualified researcher.
Statistical Analysis
For the statistical analysis, one-way analysis of variance (ANOVA) with the Tukey–Kramer method was implemented for all cases using the “anovan” and “multcompare” functions in MATLAB (R2016b, Mathworks, Natick, MA, USA). The MRI signal intensity profiles were computed using ImageJ software and the Z-scores of the profiles were calculated using a MATLAB software function, “z-score,” calculated as follows:
where v is the signal intensity in a single voxel, vave is the mean value, and SDprofile is the standard deviation of the pixel intensity on the profile line. For the R1 and R2 calculations of sample solutions of the contrast agents, linear regression fittings were performed for different concentrations and slope differences were compared statistically using Prism 6 (Version 6.0b, GraphPad Software Inc., La Jolla, CA, USA).
Results
In vivo and ex vivo MEMRI After in vivo Mn Administration
The stability of Mn accumulation following fixation (in vivo vs. ex vivo) was compared using 75-μm in-plane resolution (Figure 2). Shortly after the perfusion fixation, the extracted Mn-enhanced brain tissue (Figure 2M, MN0d group, ex vivo MEMRI) showed a contrast similar to that for the in vivo MEMRI (Figure 2I) while attenuating the signal intensity and contrast slightly. The hippocampal laminar structure in the extracted tissue (ex vivo MEMRI) exhibited positive signal enhancement (Figure 2N), similar to that for the in vivo MEMRI (Figure 2J). In the cerebellum, the ex vivo MEMRI showed positive enhancement strongly in the granular cell layer (GCL) and moderately positive enhancement in the molecular layer (Figure 2O), also similar to that for the in vivo cases (Figure 2K).
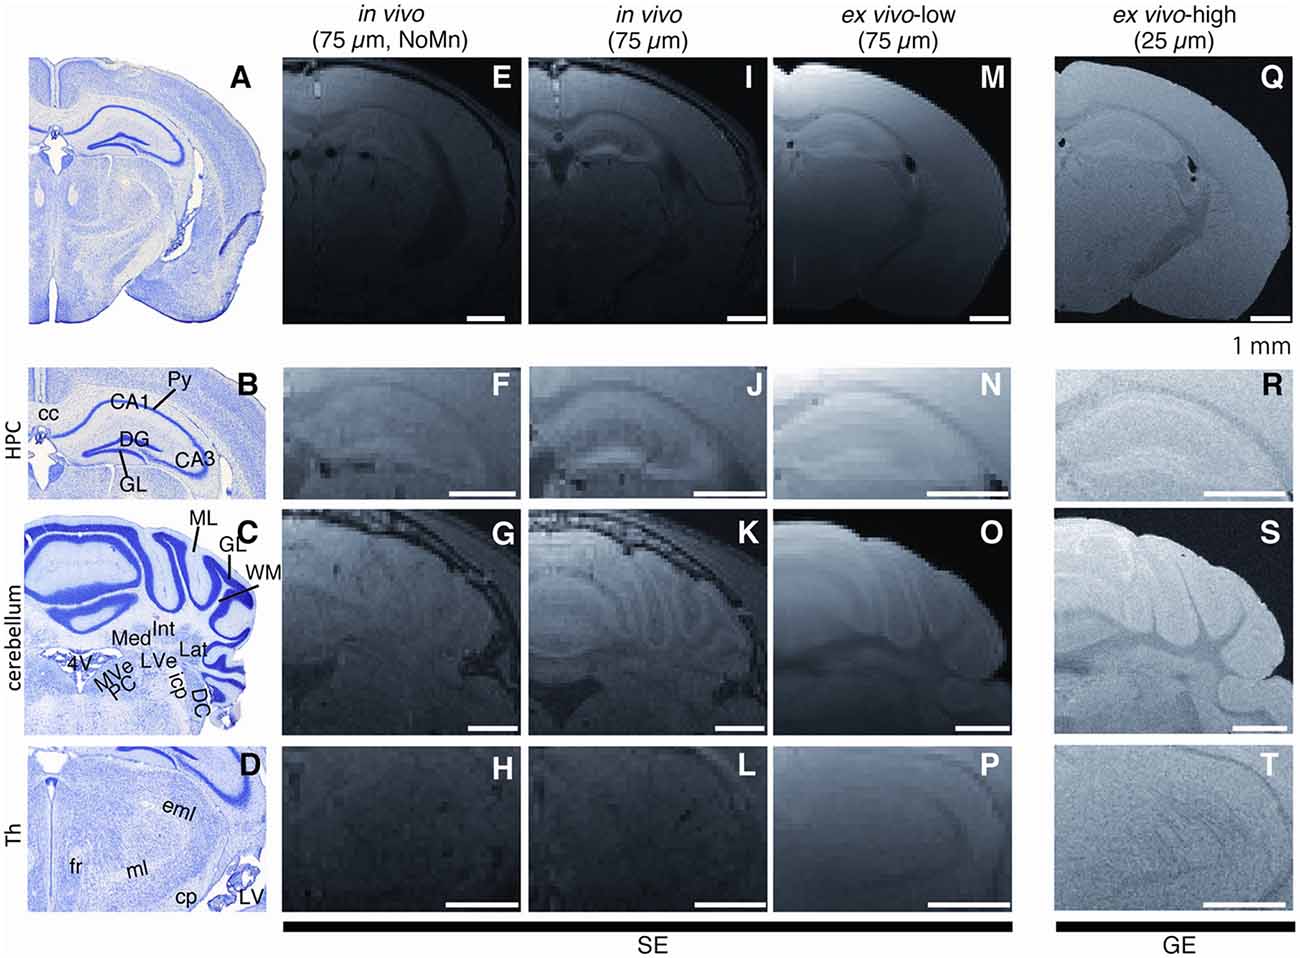
Figure 2. Observable differences between in vivo and ex vivo Mn-enhanced MRI (MEMRI). (A,E,I,M,Q) Typical examples of T1-weighted (T1W) images of in vivo and ex vivo MEMRI for Mn0d group. (Left to right) Histological from Paxinos and Franklin (2013), in vivo without Mn administration (75 μm), in vivo with Mn (75 μm), ex vivo low resolution (75 μm), ex vivo high resolution (25 μm) images. We used 4% paraformaldehyde (PFA) following saline for perfusion fixation. Scale bar: 1 mm. Magnified images in the hippocampus (B,F,J,N,R; HPC, Bregma −2.18 mm), cerebellum (C,G,K,O,S; Bregma −6.00 mm), and thalamus (D,H,L,P,T; Th, Bregma −2.46 mm). Single-averaging data were presented for (Q–T) due to the artifact. cc, corpus callosum; CA1, Ammon’s horn 1; CA3, Ammon’s horn 3; DG, dentate gyrus; Py, pyramidal cell layer; GCL, granular cell layer; ML, molecular cell layer; WM, white matter; Med, medial cerebellar nucleus; Int, interposed cerebellar nucleus; Lat, lateral cerebellar nucleus; LVe, lateral vestibular nucleus; MVePC, medial vestibular nucleus, parvicellular part; Pr, prepostius nucleus; DC, dorsal cochlear nucleus; icp, inferior cerebellar peduncle; 4V, 4th ventricle; fr, fasciculus retroflexus; ml, medial lemniscus; eml, external medullary lamina; cp, cerebral peduncle; LV, lateral ventricle; SE, spin echo image; and GE, gradient echo image.
In the 25-μm high-spatial-resolution 3D measurement for the ex vivo MEMRI (Figure 2Q), we could observe the brain structures more clearly, especially in the cell layers of the hippocampus and cerebellum (Figures 2R,S), when compared to either the 75-μm spatial resolution ex vivo MRI or in vivo MRI. For the 25-μm 3D ex vivo MEMRI, the pyramidal cell layer through CA1 to CA3 and the dentate gyrus (DG) granular layers (GLs) in the hippocampus were more clearly defined than in the 75-μm 3D ex vivo MEMRI (Figure 2R). In the cerebellum, three subregions of the deep cerebellar nucleus, i.e., the medial, interposed and lateral nuclei, were distinctly observed by increasing the spatial resolution with respect to the surrounding white matter (WM; Figure 2S). The WM structures (e.g., the fasciculus retroflexus (fr) and optic tract in the thalamus; Figure 2T) were also delineated more clearly compared to the in vivo and 75-μm 3D ex vivo MEMRI. Thus, the ex vivo MEMRI method allowed microstructure brain imaging with a contrast similar to that for in vivo MEMRI.
To assess the Mn stability in the ex vivo tissue quantitatively, the R1 and R2 in the cerebral cortex were compared among administration groups (Mn0d and NoMn) and MRI procedures (in vivo and ex vivo). In both in vivo and ex vivo MRI measurements, Mn0d groups exhibited significantly higher R1 in comparison to NoMn administration groups (Figure 3A, F(3,8) = 121.6, P = 0.0002). These results suggest that Mn accumulated in the brain and enhanced R1 in the same manner as reported in a previous in vivo study (Silva et al., 2004). In both Mn0d and NoMn groups, the ex vivo groups exhibited significantly higher R1 than that of the in vivo groups (Figure 3A; Mn0d, P < 0.0001, NoMn; P < 0.0001). Interestingly, the R2 of the ex vivo Mn0d was significantly higher than that of the ex vivo NoMn group (Figure 3B; F(3,8) = 49.55, P < 0.0001), while there was no significant difference in the R2 between NoMn and Mn0d in vivo (P = 0.7452). To evaluate the Mn contrasts in the brain structures, we plotted the normalized signal profile (z-score) in the T1W image and compared the in vivo and ex vivo cases (Figure 3C). The profile analysis indicated that the contrast of the cortical layer structures in ex vivo MRI was maintained in comparison to that of in vivo MRI, although the ex vivo MRI showed a slightly broader distribution (Figure 3C). Based on those results, we speculate that the Mn in the ex vivo sample was bound to the brain tissue and induced R1 and R2 enhancement through the effect of crosslinking of the PFA fixation. The large R2 enhancement ex vivo will induce signal reduction in the Mn-enhanced tissue, such as WM, in high-field MRI systems.
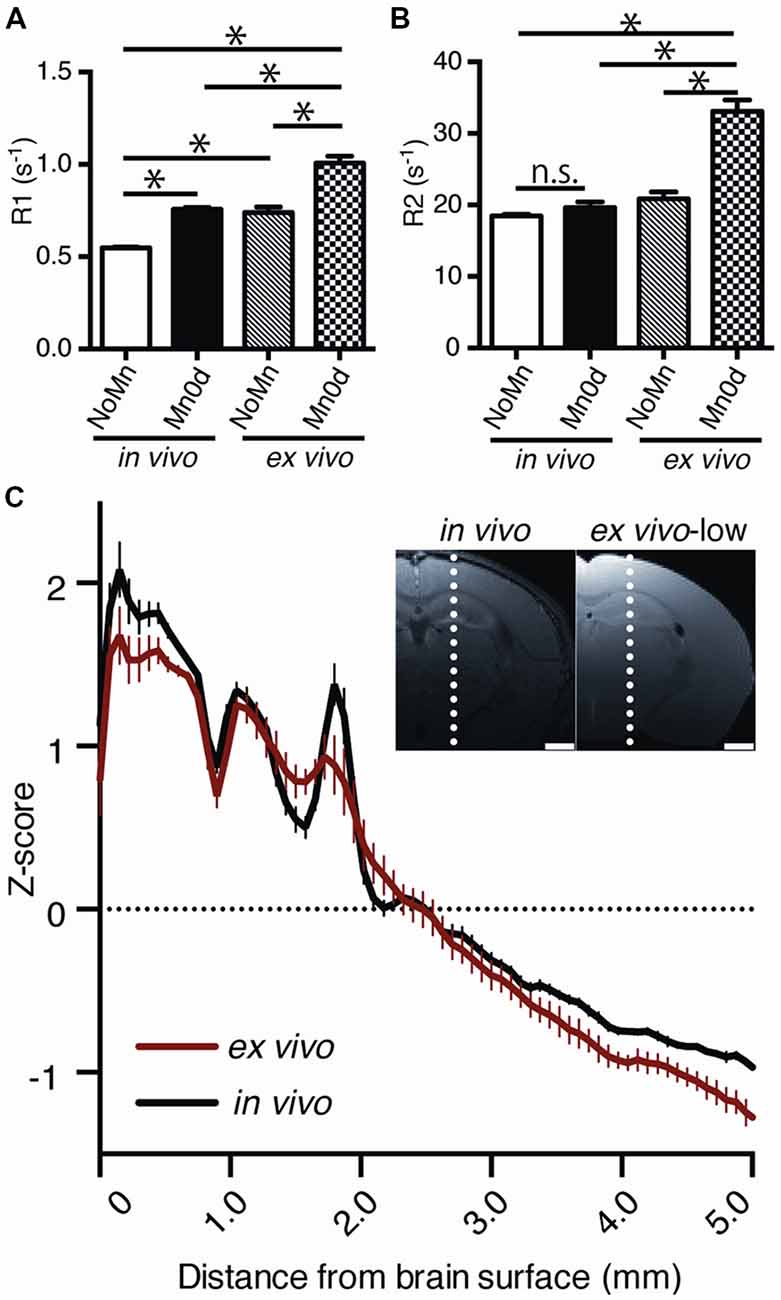
Figure 3. Comparison of relaxation rate (R1, R2) and contrast between in vivo and ex vivo MEMRI. R1 (A) and R2 (B) at the cerebral cortex between in vivo and ex vivo (NoMn: n = 5; Mn0d; n = 5). R1 and R2 were calculated as a mean value of the cortex between the right and left hemispheres. The z-scores of signal profile of the brain (C), which are indicated by the broken lines in the inset image, were calculated from the T1-weighted (T1W) image; the averages of z-scores for the in vivo (black, n = 5) and ex vivo (red, n = 5) cases are presented. NoMn, No Mn administration; Mn0d, Mn administered 0 d after fixation. The error bar shows the standard error of the mean (SEM). *P < 0.05.
Longitudinal ex vivo Tissue Observation of Mn Preservation After Fixation
To examine the longitudinal stability of the Mn in the tissue, we compared ex vivo Mn-enhanced brain samples for Mn0d and Mn7d specimens (Figure 4). For the Mn7d group (Figures 4G–I; 7 days after the fixation), the signal intensity and contrast of both the cerebral cortex and hippocampus were attenuated in comparison to the Mn0d group (Figures 4D–F; shortly after the fixation), especially throughout the cerebral cortex (Figures 4E,H). These results indicate that the accumulated Mn in the brain tissue gradually leaked into the PFA fixative solution after fixation. Interestingly, the contrast in the hippocampal laminar structure (pyramidal cell layer in Ammon’s horn and GCL in the DG) was preserved well in the Mn7d sample (Figure 4I). This result indicates that most of the accumulated Mn in ex vivo brain-tissue samples disappeared within 7 days due to the 4% PFA immersion, and remained in a part of the hippocampal structure. In summary, although the in vivo administered Mn-enhanced tissue gradually lost contrast after fixation, the contrast of laminar structures was maintained for at least 15 h (acquisition time for high resolution 3D imaging) after PFA fixation.
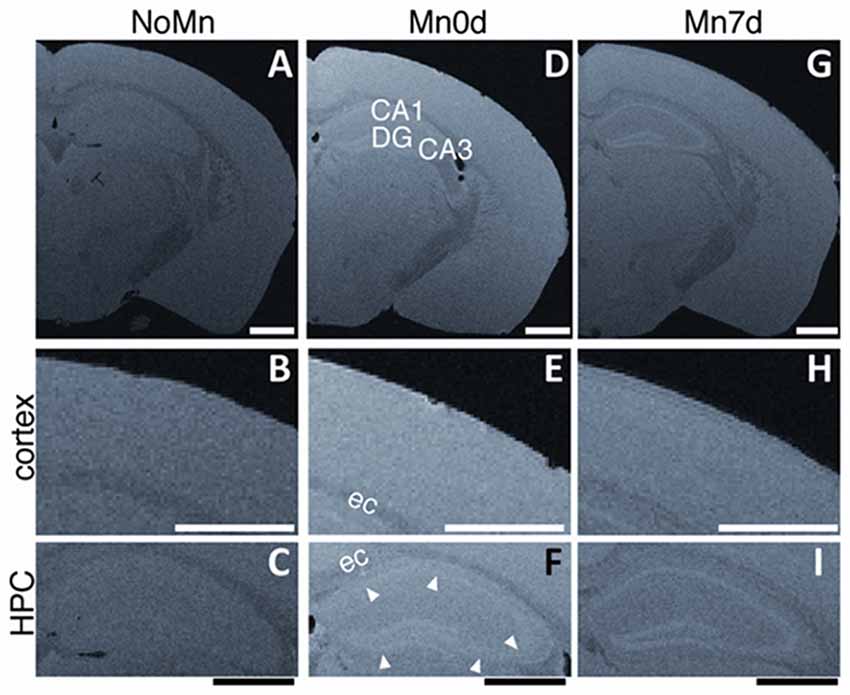
Figure 4. Contrast alterations of ex vivo MEMRI after fixation. Differences between Mn-enhanced samples scanned shortly (Mn0d, D–F, as same as Figure 2) and 7 days (Mn7d, G–I) after perfusion fixation, and an example of ex vivo MEMRI without Mn administration (NoMn, shortly after perfusion fixation, A–C). Magnified images of the cortex (B,E,F) and hippocampus (HPC, C,F,I). The white arrowheads in (F) show the GCL in the DG and the pyramidal cell layer of the Ammon’s horn. CA1, Ammon’s horn 1; CA3, Ammon’s horn 3; DG, dentate gyrus; cc, corpus callosum. Scale bar: 1 mm.
It has been reported that perfusion fixation with PFA and GA can preserve the Mn in the extracted brain tissue after in vivo administration (Liu et al., 2013). Thus, we examined the perfusion fixation method using GA and PFA for its preservation capability of Mn in the ex vivo tissue and its deformation. The results showed that there was no difference in the tissue contrast between the samples with and without GA, both shortly (Figure 5A) and 7 days after the fixation (Supplementary Figure S1). Moreover, the tissue samples that were fixed with GA showed volume reduction in the brain tissue (Figure 5B). Therefore, we found that the 4% PFA without GA can maintain the intact brain morphology with the Mn enhancement.
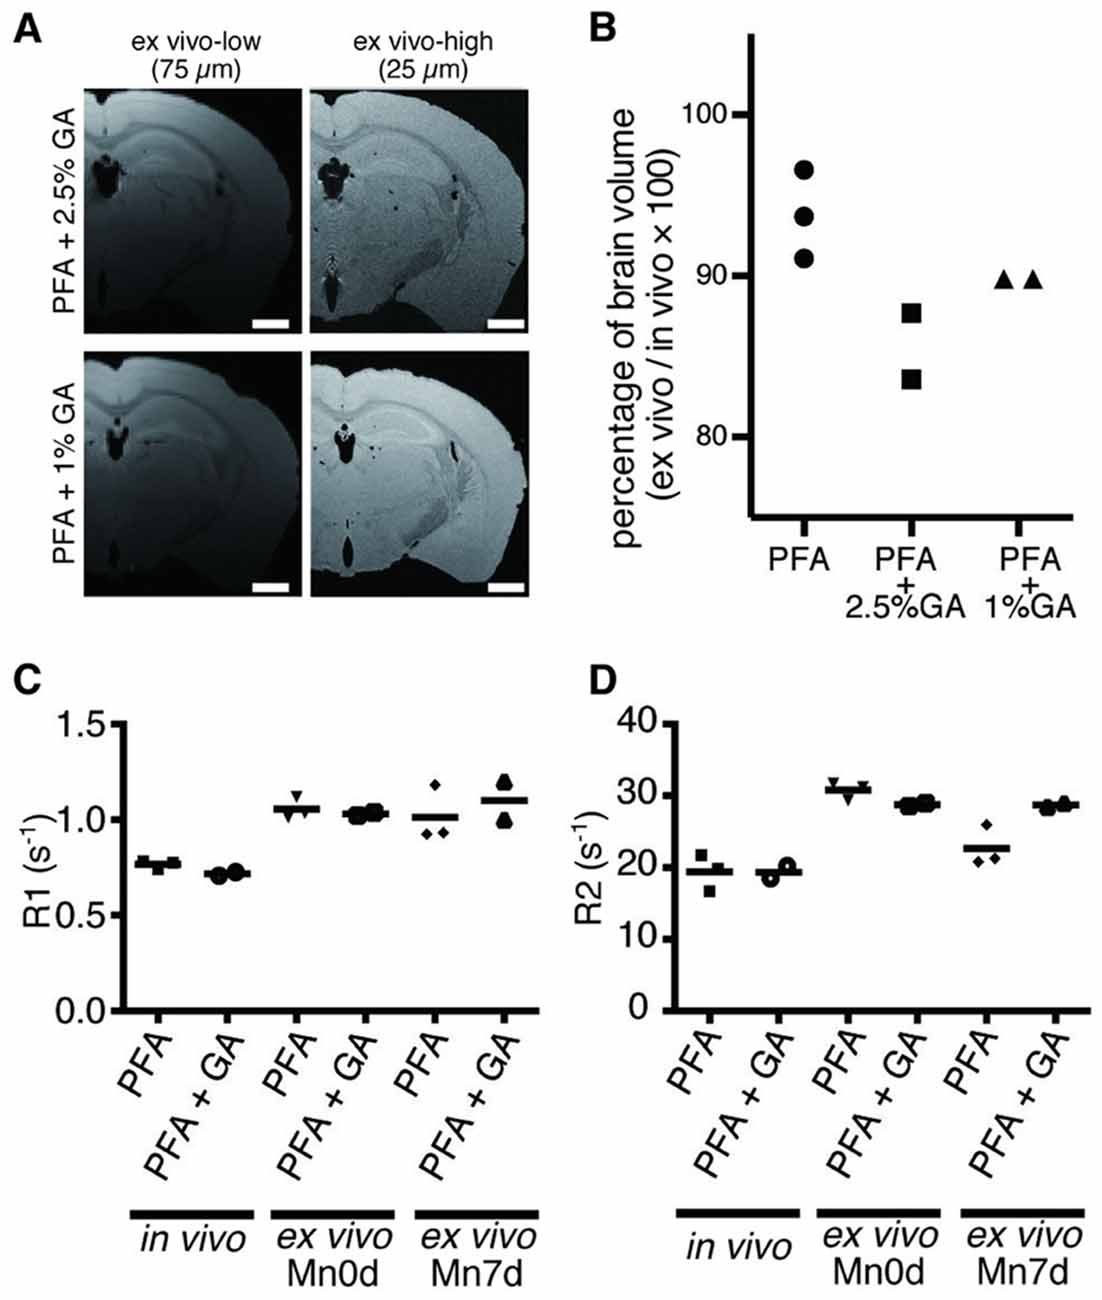
Figure 5. Effects of GA fixation. (A) The T1W images obtained through ex vivo MEMRI are shown. (Left to right) Low spatial resolution (75 μm) and high spatial resolution (25 μm) shortly after fixation. The ex vivo samples were fixated using 2.5% GA in PFA (top), and 1% GA in PFA (bottom). Scale bar: 1 mm. (B) The graph shows the ratio of brain volumes of ex vivo and in vivo samples. (C,D) Longitudinal comparison of R1 (C) and (D) R2 between samples prepared using 4% PFA alone and 1% GA in PFA. PFA, paraformaldehyde; GA, glutaraldehyde.
Discussion
Ex vivo Tissue Observation Using MRI for Neuroscience
Numerous studies have reported the morphological phenotypes of whole-brain structures in animal models, such as transgenic mice or in mice following treatment (Angenstein et al., 2007; Badea et al., 2007; Sawiak et al., 2009; Kumar et al., 2014; Scholz et al., 2015). Histological observations using an optical or electron microscope are the standard methods for assessing tissue at the cellular level in both clinical tests and preclinical studies. Recently, technology for 3D reconstruction using sequential tissue sections has been established, providing whole-brain 3D data sets (Lein et al., 2007; Vandenberghe et al., 2016). However, the preparation of sequential tissue sections for each individual animal remains a challenging task because of the longer preparation time, difficult sectioning, and morphology distortion. Recently, the SNR for MRI has been improved using a high magnetic field, low-noise cryogenic coil, and rapid 3D acquisition for signal averaging. In comparison to in vivo animal observation, the measurement of an ex vivo tissue sample can permit longer acquisition times leading to higher SNR and facilitating higher spatial resolution 3D images. Although ex vivo MRI has lower spatial resolution in comparison to the optical microscope, a 3D microstructure at a spatial resolution of 20–50 μm can be easily acquired in a nondestructive manner with negligible morphological distortion (Cleary et al., 2011; Johnson et al., 2012). We attempted to establish an ex vivo microstructural MRI technique using high-field MRI, a high-SNR cryogenically cooled coil and “MRI staining” with contrast agents. Our results showed that the Mn contrast agent, together with 25-μm isotropic 3D spatial resolution, clearly distinguished some laminar structures such as CA1, CA3 and DG in the hippocampus ex vivo samples (Figures 2, 4). Contrast-enhanced microstructural ex vivo MRI, such as that demonstrated in the present study, will contribute to the assessment of cell-layer level alteration for some diseases, such as the visualization of small amyloid plaques in Alzheimer’s disease (Dhenain et al., 2006; Vandenberghe et al., 2016).
Stability and Preservation of Mn Inside Tissue
Although the systemic intravenous administration of MnCl2 provides an excellent layer contrast in the central nervous system in vivo (Aoki et al., 2004; Silva et al., 2008; Watanabe et al., 2008), the longitudinal stability of the Mn-enhanced contrast after fixation has not been well investigated. In the present study, the Mn accumulation in the brain after in vivo Mn administration was well preserved in the cortical layer after perfusion fixation using 4% PFA (Figure 2) and the observed contrast on ex vivo MEMRI is consistent with results from previous in vivo studies (Aoki et al., 2004; Silva et al., 2008). The preservation of Mn in ex vivo tissue using GA with PFA fixative has been attempted previously (Liu et al., 2013). Considering the previous report and our experiments using PFA with 1 or 2.5% GA fixation (Figure 5), GA with PFA fixation cannot preserve Mn for a long duration and has the risk of morphological distortion. Our finding that after PFA fixation the preserved Mn gradually leaked from the tissue in a time-dependent manner indicates that the contrast for ex vivo MEMRI is unstable (Figure 4). Therefore, fixation using 4% PFA with rapid acquisition within 1 day after extraction is an effective method for preserving the accumulated Mn without brain volume alteration for ex vivo tissue MRI. A pioneering study reported that ex vivo MEMRI using 4% PFA could detect differences in the neural response between acute novel stressors in vivo (Bangasser et al., 2013). Future work needs to develop a more precise and stable method to preserve the accumulated Mn without morphological alteration in ex vivo tissue.
Brain Tissue Contrast of ex vivo MEMRI
High isotropic spatial resolution (25 μm) MEMRI detected brain microstructures such as the WM structures, which, to our knowledge, have never been observed in previous MEMRI studies (Figure 2). MEMRI allows the acquisition of functional (Lin and Koretsky, 1997; Aoki et al., 2002; Yu et al., 2005; Chuang et al., 2009; Radecki et al., 2014), neural tract tracing (Pautler et al., 1998; Majid et al., 2014), or morphological (Aoki et al., 2004; Silva et al., 2008; Watanabe et al., 2008) imaging in vivo. Therefore, the combination of in vivo MEMRI and high-resolution 3D micro-MRI may enable us to analyze not only the brain microstructure, but also its relevant functions (Bangasser et al., 2013) at a cell-layer level. Note that there is a potential risk of artifacts when performing ex-vivo MEMRI with samples contained in fluorine oil. We observed truncation ringing artifacts in one sample that resembled the cortical layers and may be misinterpreted as such. It is not clear what caused this artifact although we suspect that it was possibly due to the susceptibility difference between the brain and fluorine oil. However, the images shown here were acquired in a subsequent sample using identical imaging parameters and was free of any artifact. Future studies are needed to more thoroughly investigate the source of these artifacts.
Surprisingly, the enhanced contrast of the hippocampal laminar structure (pyramidal and GCLs, predominantly) remained even 7 days after perfusion fixation with 4% PFA (Figure 4), despite the disappearance of Mn contrast in other brain regions. The finding suggests at least two possibilities. One is that the hippocampal pyramidal and granular cells passively reached a higher Mn concentration in comparison to the other brain regions. It has been reported that the hippocampal cell layers in a Mn-immersed brain sample (the brain was immersed in MnCl2 solution after fixation) exhibited positive contrast (Huang et al., 2009; Liu et al., 2013). In addition, the layers have a high density of Ca2+ binding sites on the cell membrane (Hinds et al., 2003). The other possibility is that the hippocampal pyramidal cell layer and GCL actively accumulate high Mn concentration in vivo.
Conclusion
A methodology for ex vivo MEMRI observation after in vivo Mn administration was investigated for high-resolution 3D brain observation. After in vivo Mn administration, the contrast in ex vivo MEMRI within 24 h of fixation was similar to the in vivo one and lost the Mn enhancement 7 days after fixation, except for pyramidal and GCLs in the hippocampus. The layer structures of particular regions of the mouse brains could be visualized in 3D isotropic 25-μm spatial resolution. Further, a 4% PFA solution with 2.5% or 1% GA could not completely retain the Mn in the fixed tissue for 7 days and altered the brain volume. To increase the spatial resolution and SNR of the functional MEMRI, an ex vivo approach with a method for improved Mn preservation in the fixed tissue is required. We expect that the methods developed in this work will help to improve morphological and functional 3D imaging of brain.
Author Contributions
IA and CS contributed to the conception and design of the study. CS and DW performed the imaging. CS and KS performed the data and statistical analysis. CS wrote the first draft of the manuscript. IA, KS, DW and TH wrote sections of the manuscript. All authors contributed to manuscript revision, read and approved the submitted version.
Funding
This research was partially supported by the Brain Mapping by Integrated Neurotechnologies for Disease Studies (Brain/MINDS) program (16dm0207007h) and the Fusion-Brain Program (17dm0107066h) from the Japan Agency for Medical Research and Development (AMED), Japan Society for the Promotion of Science (JSPS) KAKENHI (Grant Number 17H00860 and 18K18375), and Initiative for the Implementation of the Diversity Research Environment (MEXT).
Conflict of Interest Statement
The authors declare that the research was conducted in the absence of any commercial or financial relationships that could be construed as a potential conflict of interest.
The reviewer AI and handling editor declared their shared affiliation at time of review.
Acknowledgments
The authors thank Sayaka Shibata (QST) and Sayaka Hayashi (QST) for technical assistance with animal treatments, and Nobuhiro Nitta (QST) and Yoshikazu Ozawa (QST) for technical assistance with MR imaging experiments.
Supplementary Material
The Supplementary Material for this article can be found online at: https://www.frontiersin.org/articles/10.3389/fncir.2018.00110/full#supplementary-material
References
Angenstein, F., Niessen, H. G., Goldschmidt, J., Lison, H., Altrock, W. D., Gundelfinger, E. D., et al. (2007). Manganese-enhanced MRI reveals structural and functional changes in the cortex of Bassoon mutant mice. Cereb. Cortex 17, 28–36. doi: 10.1093/cercor/bhj121
Aoki, I., Tanaka, C., Takegami, T., Ebisu, T., Umeda, M., Fukunaga, M., et al. (2002). Dynamic activity-induced manganese-dependent contrast magnetic resonance imaging (DAIM MRI). Magn. Reson. Med. 48, 927–933. doi: 10.1002/mrm.10320
Aoki, I., Wu, Y. J., Silva, A. C., Lynch, R. M., and Koretsky, A. P. (2004). In vivo detection of neuroarchitecture in the rodent brain using manganese-enhanced MRI. Neuroimage 22, 1046–1059. doi: 10.1016/j.neuroimage.2004.03.031
Badea, A., Nicholls, P. J., Johnson, G. A., and Wetsel, W. C. (2007). Neuroanatomical phenotypes in the reeler mouse. Neuroimage 34, 1363–1374. doi: 10.1016/j.neuroimage.2006.09.053
Bangasser, D. A., Lee, C. S., Cook, P. A., Gee, J. C., Bhatnagar, S., and Valentino, R. J. (2013). Manganese-enhanced magnetic resonance imaging (MEMRI) reveals brain circuitry involved in responding to an acute novel stress in rats with a history of repeated social stress. Physiol. Behav. 122, 228–236. doi: 10.1016/j.physbeh.2013.04.008
Chan, K. C., Fan, S. J., Chan, R. W., Cheng, J. S., Zhou, I. Y., and Wu, E. X. (2014). In vivo visuotopic brain mapping with manganese-enhanced MRI and resting-state functional connectivity MRI. Neuroimage 90, 235–245. doi: 10.1016/j.neuroimage.2013.12.056
Chuang, K. H., Lee, J. H., Silva, A. C., Belluscio, L., and Koretsky, A. P. (2009). Manganese enhanced MRI reveals functional circuitry in response to odorant stimuli. Neuroimage 44, 363–372. doi: 10.1016/j.neuroimage.2008.08.046
Cleary, J. O., Wiseman, F. K., Norris, F. C., Price, A. N., Choy, M., Tybulewicz, V. L., et al. (2011). Structural correlates of active-staining following magnetic resonance microscopy in the mouse brain. Neuroimage 56, 974–983. doi: 10.1016/j.neuroimage.2011.01.082
Dhenain, M., Delatour, B., Walczak, C., and Volk, A. (2006). Passive staining: a novel ex vivo MRI protocol to detect amyloid deposits in mouse models of Alzheimer’s disease. Magn. Reson. Med. 55, 687–693. doi: 10.1002/mrm.20810
Hinds, H. L., Goussakov, I., Nakazawa, K., Tonegawa, S., and Bolshakov, V. Y. (2003). Essential function of α-calcium/calmodulin-dependent protein kinase II in neurotransmitter release at a glutamatergic central synapse. Proc. Natl. Acad. Sci. U S A 100, 4275–4280. doi: 10.1073/pnas.0530202100
Huang, S., Liu, C., Dai, G., Kim, Y. R., and Rosen, B. R. (2009). Manipulation of tissue contrast using contrast agents for enhanced MR microscopy in ex vivo mouse brain. Neuroimage 46, 589–599. doi: 10.1016/j.neuroimage.2009.02.027
Johnson, G. A., Calabrese, E., Badea, A., Paxinos, G., and Watson, C. (2012). A multidimensional magnetic resonance histology atlas of the Wistar rat brain. Neuroimage 62, 1848–1856. doi: 10.1016/j.neuroimage.2012.05.041
Kamsu, J. M., Constans, J. M., Lamberton, F., Courtheoux, P., Denise, P., Philoxene, B., et al. (2013). Structural layers of ex vivo rat hippocampus at 7T MRI. PLoS One 8:e76135. doi: 10.1371/journal.pone.0076135
Kumar, M., Duda, J. T., Hwang, W. T., Kenworthy, C., Ittyerah, R., Pickup, S., et al. (2014). High resolution magnetic resonance imaging for characterization of the neuroligin-3 knock-in mouse model associated with autism spectrum disorder. PLoS One 9:e109872. doi: 10.1371/journal.pone.0109872
Lein, E. S., Hawrylycz, M. J., Ao, N., Ayres, M., Bensinger, A., Bernard, A., et al. (2007). Genome-wide atlas of gene expression in the adult mouse brain. Nature 445, 168–176. doi: 10.1038/nature05453
Lin, Y. J., and Koretsky, A. P. (1997). Manganese ion enhances T1-weighted MRI during brain activation: an approach to direct imaging of brain function. Magn. Reson. Med. 38, 378–388. doi: 10.1002/mrm.1910380305
Liu, Y., Sajja, B. R., Gendelman, H. E., and Boska, M. D. (2013). Mouse brain fixation to preserve in vivo manganese enhancement for ex vivo manganese-enhanced MRI. J. Magn. Reson. Imaging 38, 482–487. doi: 10.1002/jmri.24005
Majid, T., Ali, Y. O., Venkitaramani, D. V., Jang, M. K., Lu, H. C., and Pautler, R. G. (2014). In vivo axonal transport deficits in a mouse model of fronto-temporal dementia. Neuroimage Clin. 4, 711–717. doi: 10.1016/j.nicl.2014.02.005
Norris, F. C., Betts-Henderson, J., Wells, J. A., Cleary, J. O., Siow, B. M., Walker-Samuel, S., et al. (2013). Enhanced tissue differentiation in the developing mouse brain using magnetic resonance micro-histology. Magn. Reson. Med. 70, 1380–1388. doi: 10.1002/mrm.24573
Pautler, R. G., Silva, A. C., and Koretsky, A. P. (1998). In vivo neuronal tract tracing using manganese-enhanced magnetic resonance imaging. Magn. Reson. Med. 40, 740–748. doi: 10.1002/mrm.1910400515
Paxinos, G., and Franklin, K. (2013). The Mouse Brain in Stereotaxic Coordinates. 4th Edn. San Diego, CA: Elsevier Academic Press.
Phillips, T. R., Wright, D. K., Gradie, P. E., Johnston, L. A., and Pask, A. J. (2015). A comprehensive atlas of the adult mouse penis. Sex. Dev. 9, 162–172. doi: 10.1159/000431010
Radecki, G., Nargeot, R., Jelescu, I. O., Le Bihan, D., and Ciobanu, L. (2014). Functional magnetic resonance microscopy at single-cell resolution in Aplysia californica. Proc. Natl. Acad. Sci. U S A 111, 8667–8672. doi: 10.1073/pnas.1403739111
Sawiak, S. J., Wood, N. I., Williams, G. B., Morton, A. J., and Carpenter, T. A. (2009). Use of magnetic resonance imaging for anatomical phenotyping of the R6/2 mouse model of Huntington’s disease. Neurobiol. Dis. 33, 12–19. doi: 10.1016/j.nbd.2008.09.017
Scholz, J., Niibori, Y., Frankland, P. W., and Lerch, J. P. (2015). Rotarod training in mice is associated with changes in brain structure observable with multimodal MRI. Neuroimage 107, 182–189. doi: 10.1016/j.neuroimage.2014.12.003
Silva, A. C., Lee, J. H., Aoki, I., and Koretsky, A. P. (2004). Manganese-enhanced magnetic resonance imaging (MEMRI): methodological and practical considerations. NMR Biomed. 17, 532–543. doi: 10.1002/nbm.945
Silva, A. C., Lee, J. H., Wu, C. W., Tucciarone, J., Pelled, G., Aoki, I., et al. (2008). Detection of cortical laminar architecture using manganese-enhanced MRI. J. Neurosci. Methods 167, 246–257. doi: 10.1016/j.jneumeth.2007.08.020
Vandenberghe, M. E., Herard, A. S., Souedet, N., Sadouni, E., Santin, M. D., Briet, D., et al. (2016). High-throughput 3D whole-brain quantitative histopathology in rodents. Sci. Rep. 6:20958. doi: 10.1038/srep20958
Watanabe, T., Frahm, J., and Michaelis, T. (2008). Manganese-enhanced MRI of the mouse auditory pathway. Magn. Reson. Med. 60, 210–212. doi: 10.1002/mrm.21645
Wu, D., and Zhang, J. (2016). Recent progress in magnetic resonance imaging of the embryonic and neonatal mouse brain. Front. Neuroanat. 10:18. doi: 10.3389/fnana.2016.00018
Keywords: manganese-enhanced MRI, MEMRI, microstructure, neuroimaging, ex vivo MEMRI
Citation: Sato C, Sawada K, Wright D, Higashi T and Aoki I (2018) Isotropic 25-Micron 3D Neuroimaging Using ex vivo Microstructural Manganese-Enhanced MRI (MEMRI). Front. Neural Circuits 12:110. doi: 10.3389/fncir.2018.00110
Received: 02 July 2018; Accepted: 23 November 2018;
Published: 06 December 2018.
Edited by:
Hirotaka Onoe, Kyoto University, JapanReviewed by:
Robert Turner, Max Planck Institute for Human Cognitive and Brain Sciences, GermanyAkio Inoue, Kyoto University, Japan
Copyright © 2018 Sato, Sawada, Wright, Higashi and Aoki. This is an open-access article distributed under the terms of the Creative Commons Attribution License (CC BY). The use, distribution or reproduction in other forums is permitted, provided the original author(s) and the copyright owner(s) are credited and that the original publication in this journal is cited, in accordance with accepted academic practice. No use, distribution or reproduction is permitted which does not comply with these terms.
*Correspondence: Ichio Aoki, iaoki.jp@gmail.com