

- Department of Neuroscience, Columbia University, New York, NY, USA
Flavoprotein fluorescence imaging (FFI) is a novel intrinsic optical signal that is steadily gaining ground as a valuable imaging tool in neuroscience research due to its closer relationship with local metabolism relative to the more commonly used hemodynamic signals. We have developed a technique for FFI imaging in the primary visual cortex (V1) of alert monkeys. Due to the nature of neurovascular coupling, hemodynamic signals are known to spread beyond the locus of metabolic activity. To determine whether FFI signals could provide a more focal measure of cortical activity in alert animals, we compared FFI and hemodynamic point spreads (i.e. responses to a minimal visual stimulus) and functional mapping signals over V1 in macaques performing simple fixation tasks. FFI responses were biphasic, with an early and focal fluorescence increase followed by a delayed and spatially broader fluorescence decrease. As expected, the early fluorescence increase, indicating increased local oxidative metabolism, was somewhat narrower than the simultaneously observed hemodynamic response. However, the later FFI decrease was broader than the hemodynamic response and started prior to the cessation of visual stimulation suggesting different mechanisms underlying the two phases of the fluorescence signal. FFI mapping signals were free of vascular artifacts and comparable in amplitude to hemodynamic mapping signals. These results indicate that the FFI response may be a more local and direct indicator of cortical metabolism than the hemodynamic response in alert animals.
Introduction
Flavoprotein fluorescence imaging (FFI) is a new method for visualizing cortical activity based on imaging changes in the redox state of mitochondrial flavoproteins, primarily flavin adenine dinucleotide (FAD). It utilizes the fact that the oxidized form of this enzyme, FAD+, is more fluorescent than the reduced form, FADH2 (Chance et al., 1979 ). In the brain, increases in neuronal activity and the associated local increase in oxidative metabolism are marked by increased FAD fluorescence (Shibuki et al., 2003 ; Reinert et al., 2004 ; Husson et al., 2007 ). Thus this fluorescence signal shows promise as a non-invasive, intrinsic measure of local neuronal activity, free of the complications associated with extrinsic activity markers such as voltage sensitive dyes or calcium indicators. Since the FFI signal derives from local mitochondria, it is likely to give a truer measure of local neural activity than available from the commonly used hemodynamics-based intrinsic-signal brain imaging, which are strongly influenced by non-local inputs (Hamel, 2006 ; Iadecola and Nedergaard, 2007 ; Bartels et al., 2008 ; Sirotin and Das, 2009 ). Because of their potentially tight link with local neural activity, understanding FFI signals is of tremendous importance for the imaging community. Due to the relative newness of this technique, however, there have been very few studies directly comparing FFI with more conventional hemodynamics-based imaging (Frostig et al., 1990 ; Vanzetta and Grinvald, 2008 ; Sirotin et al., 2009 ).
Several important issues must be addressed in considering FFI as an alternative tool to hemodynamics-based techniques. First, though studies have successfully used FFI imaging signals in anesthetized animals, there have been few comparisons made between the spatiotemporal properties of FFI and hemodynamics-based signals. One study in the primary visual cortex (V1) of cats has compared orientation maps generated with FFI to those generated using standard hemodynamics techniques (Husson et al., 2007 ). They found that FFI signals appeared to produce better maps of orientation with fewer vascular artifacts. However, the clarity of such maps depends on the difference signal between activation patterns to two orthogonal gratings and does not reflect directly the spatial properties of the overall fluorescence response. Recently, we showed that imaging the V1 point spread to a minimal visual stimulus provides valuable and direct spatiotemporal information about the imaging signal; we used this method to successfully compare stimulus-evoked hemoglobin concentration and oxygenation signals in V1 (Sirotin et al., 2009 ). A similar analysis comparing the hemodynamic response with FFI signals would determine whether FFI signals have a relative advantage over hemodynamics-based imaging techniques.
Next, much of what we know about the properties of FFI signals comes from only the first phase of the fluorescence response. However, in vitro work has shown that FFI signals have a complex timecourse with an early oxidation phase (fluorescence increase) followed by a prolonged reduction phase (fluorescence decrease) (Duchen, 1992 ; Kosterin et al., 2005 ). The two phases of the fluorescence signal are thought to be due to distinct cellular processes and are possibly not even localized within the same cells (Kasischke et al., 2004 ). Thus, interpretation of in vivo FFI signals would benefit from a firm understanding of the interaction between these two phases and how they shape the observed FFI response. However, imaging the full FFI signal in vivo has been difficult because of distortions by the hemodynamic response. Both the excitation wavelength (blue) and emission (green) for FAD fluorescence are strongly absorbed by hemoglobin. Thus any changes in the local tissue concentrations of hemoglobin – in particular, the large stimulus-evoked hemodynamic response in the same tissue – severely contaminate the FFI signal, sharply reducing and even reversing its amplitude and adding large vascular artifacts (Shibuki et al., 2003 ; Weber et al., 2004 ; Kitaura et al., 2007 ). Classical studies measuring in vivo cortical fluorescence have corrected for simultaneous changes in tissue absorption at the same wavelengths by measuring light reflected off the tissue (Rosenthal and Jobsis, 1971 ; O’Connor et al., 1972 ; Harbig et al., 1976 ; Kramer and Pearlstein, 1979 ). However, no such correction has yet been implemented for the imaging signals and thus their interpretation remains problematic.
The final issue in assessing the utility of FFI signals is that they have not yet been well characterized in the cerebral cortex of alert animals. Characterizing and understanding FFI signals in alert animals is crucial because many aspects of brain function, including the neural basis of behavior, can only be studied in alert animals. Developing this technique in the alert animal is thus a critical step towards proposing a broader use of FFI as a neuroimaging tool (e.g. Chen et al., 2009 ). However, FFI imaging in alert animals could involve its own unique problems, which could require approaches different from those used in the anesthetized preparation. The stimulus-evoked hemodynamic response is significantly larger in alert animals and may reach larger values faster, contaminating even early fluorescence signals (Shtoyerman et al., 2000 ; Berwick et al., 2002 ; Martin et al., 2002 ). In addition, we have recently demonstrated the existence of dramatic, stimulus-independent, task-linked fluctuations in cortical hemodynamic signals in V1 of alert monkeys performing simple fixation tasks (Sirotin and Das, 2009 ). These task-linked fluctuations can strongly modify or even dominate the reflectance signals used for conventional hemodynamics-based intrinsic optical imaging. The strong absorption of the FFI signal by hemoglobin makes it unclear whether FFI signals could be detected in alert animals amongst the large ongoing hemodynamic signals which may similarly contaminate any changes in fluorescence. This issue is especially important for mapping of cortical columns as these signals are significantly smaller than the full imaging signal (Frostig et al., 1990 ; Bonhoeffer and Grinvald, 1996 ; Vanzetta et al., 2004 ).
We have developed a dual-wavelength imaging technique that corrects the FFI signal for simultaneous brain hemodynamics, using a modification of the technique that we used earlier to image local cerebral blood volume concurrently with oxygenation in the alert macaque monkey V1 (Sirotin et al., 2009 ). We image the cortical surface at two wavelengths in rapid alternation synchronized with the frame rate of our camera. Here, one wavelength is an excitation wavelength for FAD, while the other is an isosbestic wavelength for hemoglobin, absorbed equally by oxy- and deoxyhemoglobin and thus measuring changes in total hemoglobin concentration in tissue, that is, local blood volume 1 . This latter ‘blood volume’ wavelength was selected to lie within the emission range for FAD fluorescence, and is also in the wavelength range used for monitoring FAD fluorescence; the ‘blood volume’ signal thus obtained is used to correct the FAD fluorescence signal for distortion by the brain hemodynamic response, revealing the true timecourse of FAD fluorescence. Using this technique, which is similar to the techniques previously employed in measurements of bulk cortical fluorescence (Rosenthal and Jobsis, 1971 ; O’Connor et al., 1972 ; Harbig et al., 1976 ; Kramer and Pearlstein, 1979 ), we found that significant FFI signals could be detected reliably in the alert macaque cortex. This enabled us to study both the early and late phases of the FFI response and compare their spatiotemporal properties with the simultaneously measured changes in cortical reflectance that we have previously characterized under similar conditions (Sirotin et al., 2009 ).
Materials and Methods
All experimental procedures were performed in accordance with the NIH Guide for the Care and Use of Laboratory Animals and were approved by the Institutional Animal Care and Use Committees (IACUC) of Columbia University and the New York State Psychiatric Institute.
Behavioral Task
We trained two macaque monkeys (‘T’ and ‘Y’) on a periodic fixation task similar to that used in recent publications from our lab (Sirotin and Das, 2009 ; Sirotin et al., 2009 ). The animal was required to maintain passive binocular fixation during ‘fixation on’ (cued by fixation point color) for juice reward (Fixation window: 0.5° radius, 20” Sony Trinitron monitor, 100 Hz refresh, distance: 133 cm; fix duration: 4 s). We tracked the monkeys’ eye position using an infra-red eye tracker and custom software (Matsuda et al., 2000 ) and aborted trials with premature eye movement. Stimuli were presented for 1 or 2 s during the fixation period. We set the inter-trial interval to 20 s to ensure that the long-lived stimulus-evoked hemodynamic signal decayed to baseline, and to minimize any bleaching of the flavoprotein fluorescence. The experiment continued until the monkey received enough juice and stopped working.
Visual Stimuli
Stimuli for measuring point spreads were short bars of light (measuring 0.25 × 0.04 degrees of visual angle) generated as bitmaps in MATLAB (Mathworks, Natick, MA, USA) flashed on for 2 s on a dark background at maximum contrast using the VSG2/5 graphics card (Cambridge Research Systems, UK). To measure and correct for stimulus-independent trial-related imaging signals (Sirotin and Das, 2009 ), some of the trials carried no stimulus, but were otherwise identical in their timing (‘blank trials’). For orientation mapping, we presented full-field drifting gratings at a spatial frequency of two cycles per degree and maximal contrast. Grating stimuli were presented for 1 s. The orientation of the gratings was randomly selected on each trial from the set: 0, 45, 90, and 135°.
Imaging Chambers
Surgery, recording chambers, artificial dura: After the monkeys were trained on visual fixation tasks, craniotomies were performed over the animals’ V1 and glass-windowed stainless steel recording chambers were implanted, under surgical anesthesia, using standard sterile procedures. The exposed dura was resected and replaced with a soft, clear silicone artificial dura. After the animals had recovered from the surgery, cortical activity from their V1 was optically imaged, routinely, while the animals engaged in relevant behavioral tasks. Recording chambers and artificial dura were fabricated in our lab using published methods (Shtoyerman et al., 2000 ).
Imaging: Optics
Images were acquired using a CCD camera (Dalsa 1M30, resolution 256 × 256 pixels, 15 frames/s) through an Optical PCI Bus Digital Frame Grabber (Coreco Imaging, Boston, MA, USA). Imaging software was developed in our lab based on a system by V. Kalatsky (Kalatsky and Stryker, 2003 ). The camera was coupled to a back-to-back lens combination macroscope (two 55 mm Nikon lenses; 1:1 magnification, numerical aperture = 0.4) and focused on the cortical surface.
Imaging: Illumination Wavelengths
The fluorescence of FAD was imaged simultaneously with changes in total tissue hemoglobin concentration (‘cerebral blood volume’: Sirotin et al., 2009 ) using a modification of the custom made dual-wavelength system previously used by us to simultaneously image cortical blood volume and oxygenation (Sirotin and Das, 2009 ; Sirotin et al., 2009 ). On alternate frames of the camera, the cortex was illuminated by either an excitation wavelength for FAD (blue) or an isosbestic wavelength for hemoglobin (green: absorbed equally by oxy- and deoxyhemoglobin). This gave the effective sampling rate of 7.5 Hz. Our fluorescence filter configuration is similar to the configuration previously used for imaging V1 of anesthetized cats (Husson et al., 2007 ). The light was provided by appropriate high power LEDs (LEDENGIN, 776 mW) passed through a 415–485 nm interference filter for blue (Chroma D455_70X) or 523–533 nm for green (Omega Optics 528BP10). Light was collected off the cortical surface after passing through a long-pass interference filter (Chroma HQ520LP; cutoff = 520 nm). Thus, using a single filter, we simultaneously measured changes in cortical reflectance using green light and any emitted fluorescence from the blue light. The fluorescence excitation/emission filter pair was selected to have minimal crosstalk with an OD = 6 (i.e. a 10−6 attenuation). The entire imaging assembly was covered by light proof baffles that blocked any stray illumination. To avoid photobleaching we turned off the blue LED for the duration of the inter-trial-interval. The LED was turned on one second prior to stimulus onset and kept on for 6 s to measure the evoked response.
Overall Signal Processing
The following steps were carried out separately for the blood volume and the FAD fluorescence signals: All images were first ‘shift-corrected’ to correct for any residual movement of the cortical surface that remained despite the specially designed camera mount, animal head post and overall structural framework (NOTE: most of the residual movements were due to the brain moving relative to the animal’s head, when the animal shifted body position, etc.). This ‘shift-correction’ consisted of aligning each image frame to the first frame of a given experimental session, using the imaged blood vessels as references. Each image frame was cross-correlated with the reference frame, and a gradient descent method used to maximize this correlation value as a function of lateral shifts in the image position, frame by frame. After shift correction, we computed stimulus-triggered average movies of the cortical response for both stimulus-driven and blank trials. To correct for any trial-related signals unrelated to visual stimulation, we divided the stimulus-driven responses by the responses observed on ‘blank’ trials (Sirotin et al., 2009 ) and subtracted the average pre-stimulus image (1–5 frames pre-stimulus). These shift-corrected and blank-corrected signals were then used in all subsequent analyses.
To correct the FAD fluorescence signals for distortions due to the stimulus-evoked blood volume changes we divided the observed fractional changes in fluorescence by the simultaneously measured blood volume signal scaled by an appropriate correction factor. The details of our correction method are described in detail in an upcoming paper from our lab. This corrected fluorescence signal was then compared with the imaged blood volume signal.
Measuring Timecourses
To measure the timecourse of the fluorescence and reflectance point spread signals, we drew regions of interest around the peak of the activation and subtracted any signals well outside the activated area. This served to attenuate or remove common signal fluctuations arising due to pulse and breathing. For measuring the mapping signal [i.e. the signal fraction that is tuned to a given functional property, e.g. orientation (Frostig et al., 1990 )], we computed ROIs around orthogonal orientation domains. Fluorescence maps averaged between 1 and 2 s after grating onset were mean subtracted and normalized by their standard deviation. A pair of complementary ROIs marking orthogonal orientation columns was selected as all domains falling one standard deviation below zero and those domains falling one standard deviation above zero. We used the same ROIs, identified from the FFI signal images, to measure the mapping signal for both the fluorescence and reflectance signals.
Results
Simultaneous Imaging of Flavoprotein Fluorescence and Hemodynamics
By using FFI we visualized stimulus-evoked cortical responses in V1 of alert behaving macaque monkeys (two animals, ‘T’ and ‘Y’). We then compared these FFI images with more conventional intrinsic-signal images of the same cortical responses as measured concurrently using the blood volume signal, that is, the cortical reflectance signal at a standard blood volume wavelength (see ‘Methods’). Specifically, we compared the spatiotemporal properties of cortical point spread responses to a minimal visual stimulus, a 0.25° bar flashed briefly while the animal held its gaze steady in a periodic fixation task (Sirotin et al., 2009 ). The reflectance signals were used, moreover, to correct the FFI image for any distortions due to changes in local blood volume.
We found that fluorescence signals were highly reproducible across trials and were readily observed on a trial-by-trial basis in our awake animals. Figure 1 shows the typical pattern of imaged fluorescence and blood volume responses.
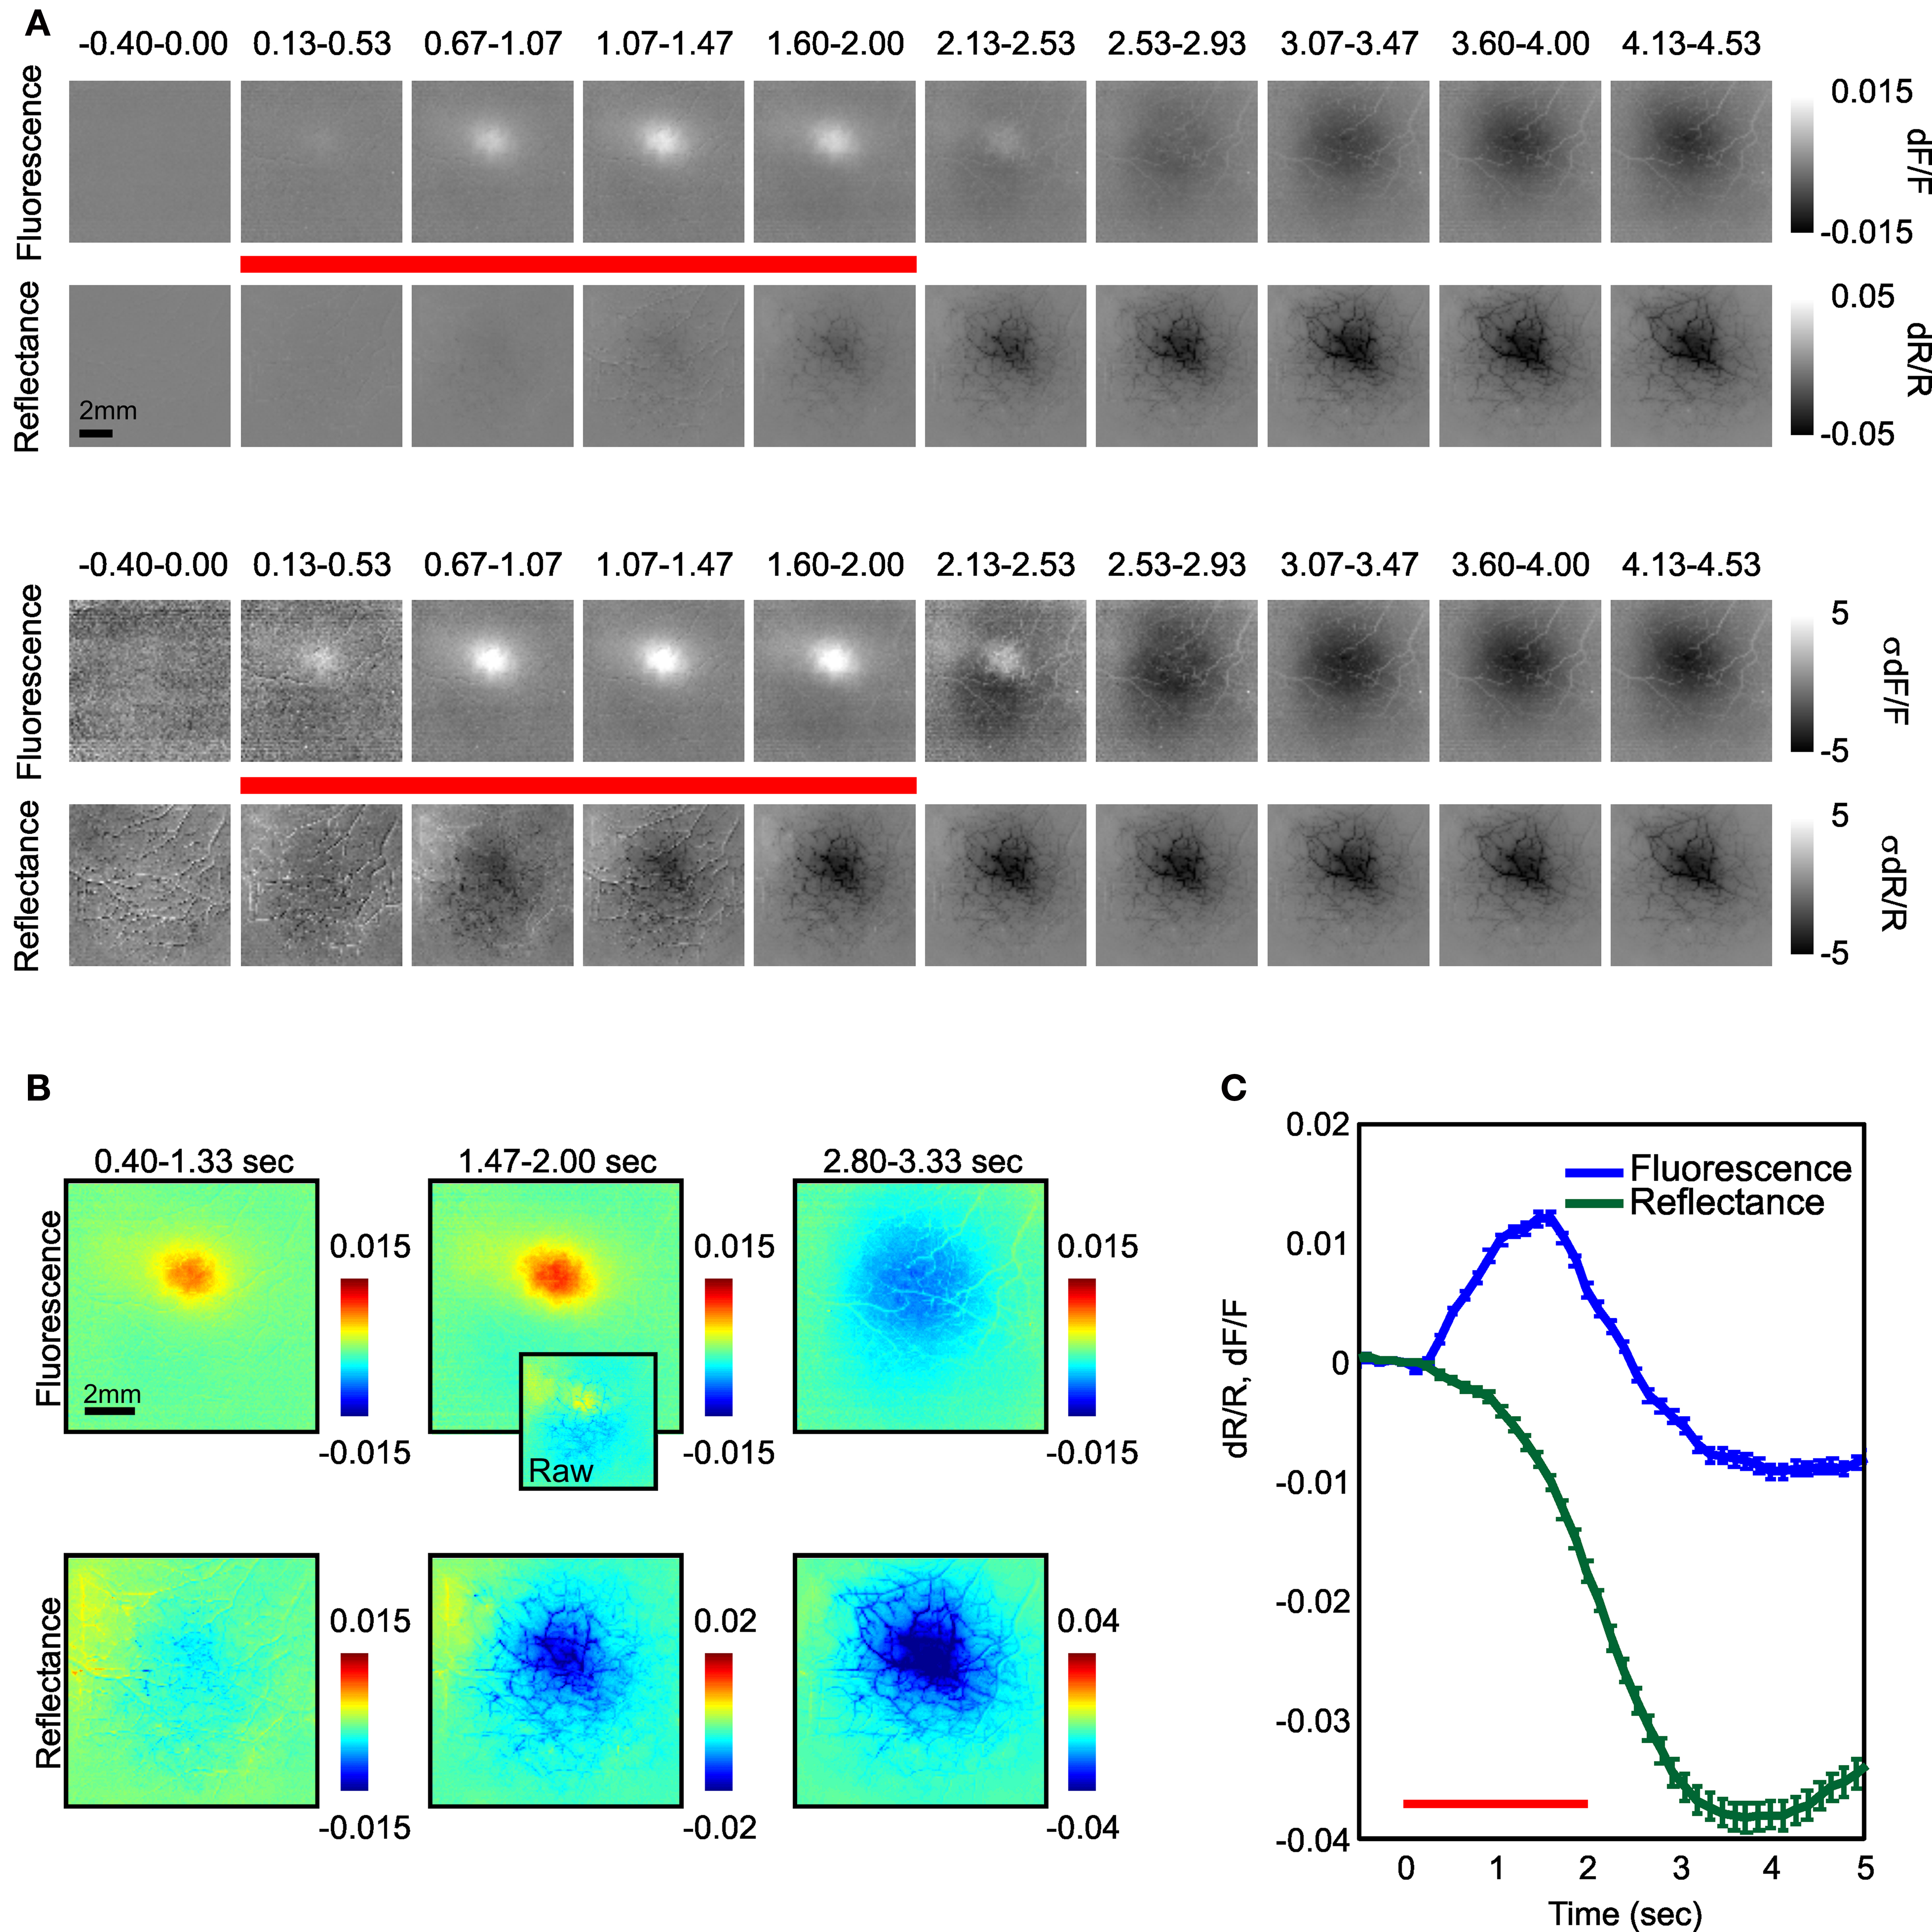
Figure 1. Timecourse of fluorescence and reflectance (‘blood volume’) changes following visual stimulation. (A) Top: Fluorescence and reflectance changes over V1 following presentation of a 0.25° bar with a fixed scale (see scale bar on right). Bottom: Same as top, but scaled by the standard deviation of the images to compare signal shapes. (B) Early, middle, and late fluorescence and reflectance images enlarged to show detail. Inset in middle column shows uncorrected fluorescence signals at this timepoint. Note the presence of significant vascular artifacts in uncorrected image. (C) The computed timecourse of fluorescence (blue) and reflectance (green) signals measured about the center of the response in (A). Red bar denotes stimulus presentation period. Note rapid onset of positive fluorescence signals followed by reversal starting prior to stimulus offset. Error bars are standard error of the mean (SEM). Note: All fluorescence signals shown in this paper have been corrected for absorption by hemoglobin. Figure depicts an average of 40 trials.
Spatiotemporal Properties of Blood Volume Signals
The V1 point spread images obtained with the blood volume signal (Figures 1 A,B) closely matched the images we had published earlier using the same method (Sirotin et al., 2009 ). The signal was monophasic with a latency of ∼600 ms, rising to a peak in about 3.5 s, and then decaying back to baseline by 15 s. Even though the signal amplitude varied by more than an order of magnitude over its timecourse, the signal profile changed relatively little during this time. To quantify the spatial spread of the signals, we fitted the profiles measured on each trial with Gaussian functions of the form: , where R is the radial distance from the response center (see Figure 3 A). The fitted σ values were on average 2.3 mm during the initial 1.6 s and 1.95 mm at 3–4 s post-stimulus onset. The difference between these values was not significant in any of the experiments in either animal. Thus, the blood volume signal remained largely invariant throughout its full duration.
Spatiotemporal Properties of Fluorescence Signals
The FFI signals were very different in their timecourse than the blood volume signal. These signals were biphasic with an early positive phase consisting of an increase in fluorescence and a delayed negative phase with decreased fluorescence (Figure 1 C). Neither phase showed any apparent vascular artifacts (Figure 1 B). As expected, fluorescence increases were faster than the simultaneously measured change in the blood volume signal (we defined the signal latency as the first significant inflection in the slope of the signal, post-stimulus onset (Sirotin et al., 2009 ); fluorescence: 267–400 ms; reflectance: 533–667 ms, Figure 2 ). However, fluorescence did not continue to increase throughout the stimulation period. Despite continued stimulation, fluorescence began decreasing ∼1.5 s after stimulus onset and then reversed polarity (Figure 1 ). We noticed that the early and late phase fluorescence changes appeared to have distinct spatial properties. We therefore examined separately the early positive and late negative fluorescence point spreads and compared them to the simultaneously measured changes in reflectance.
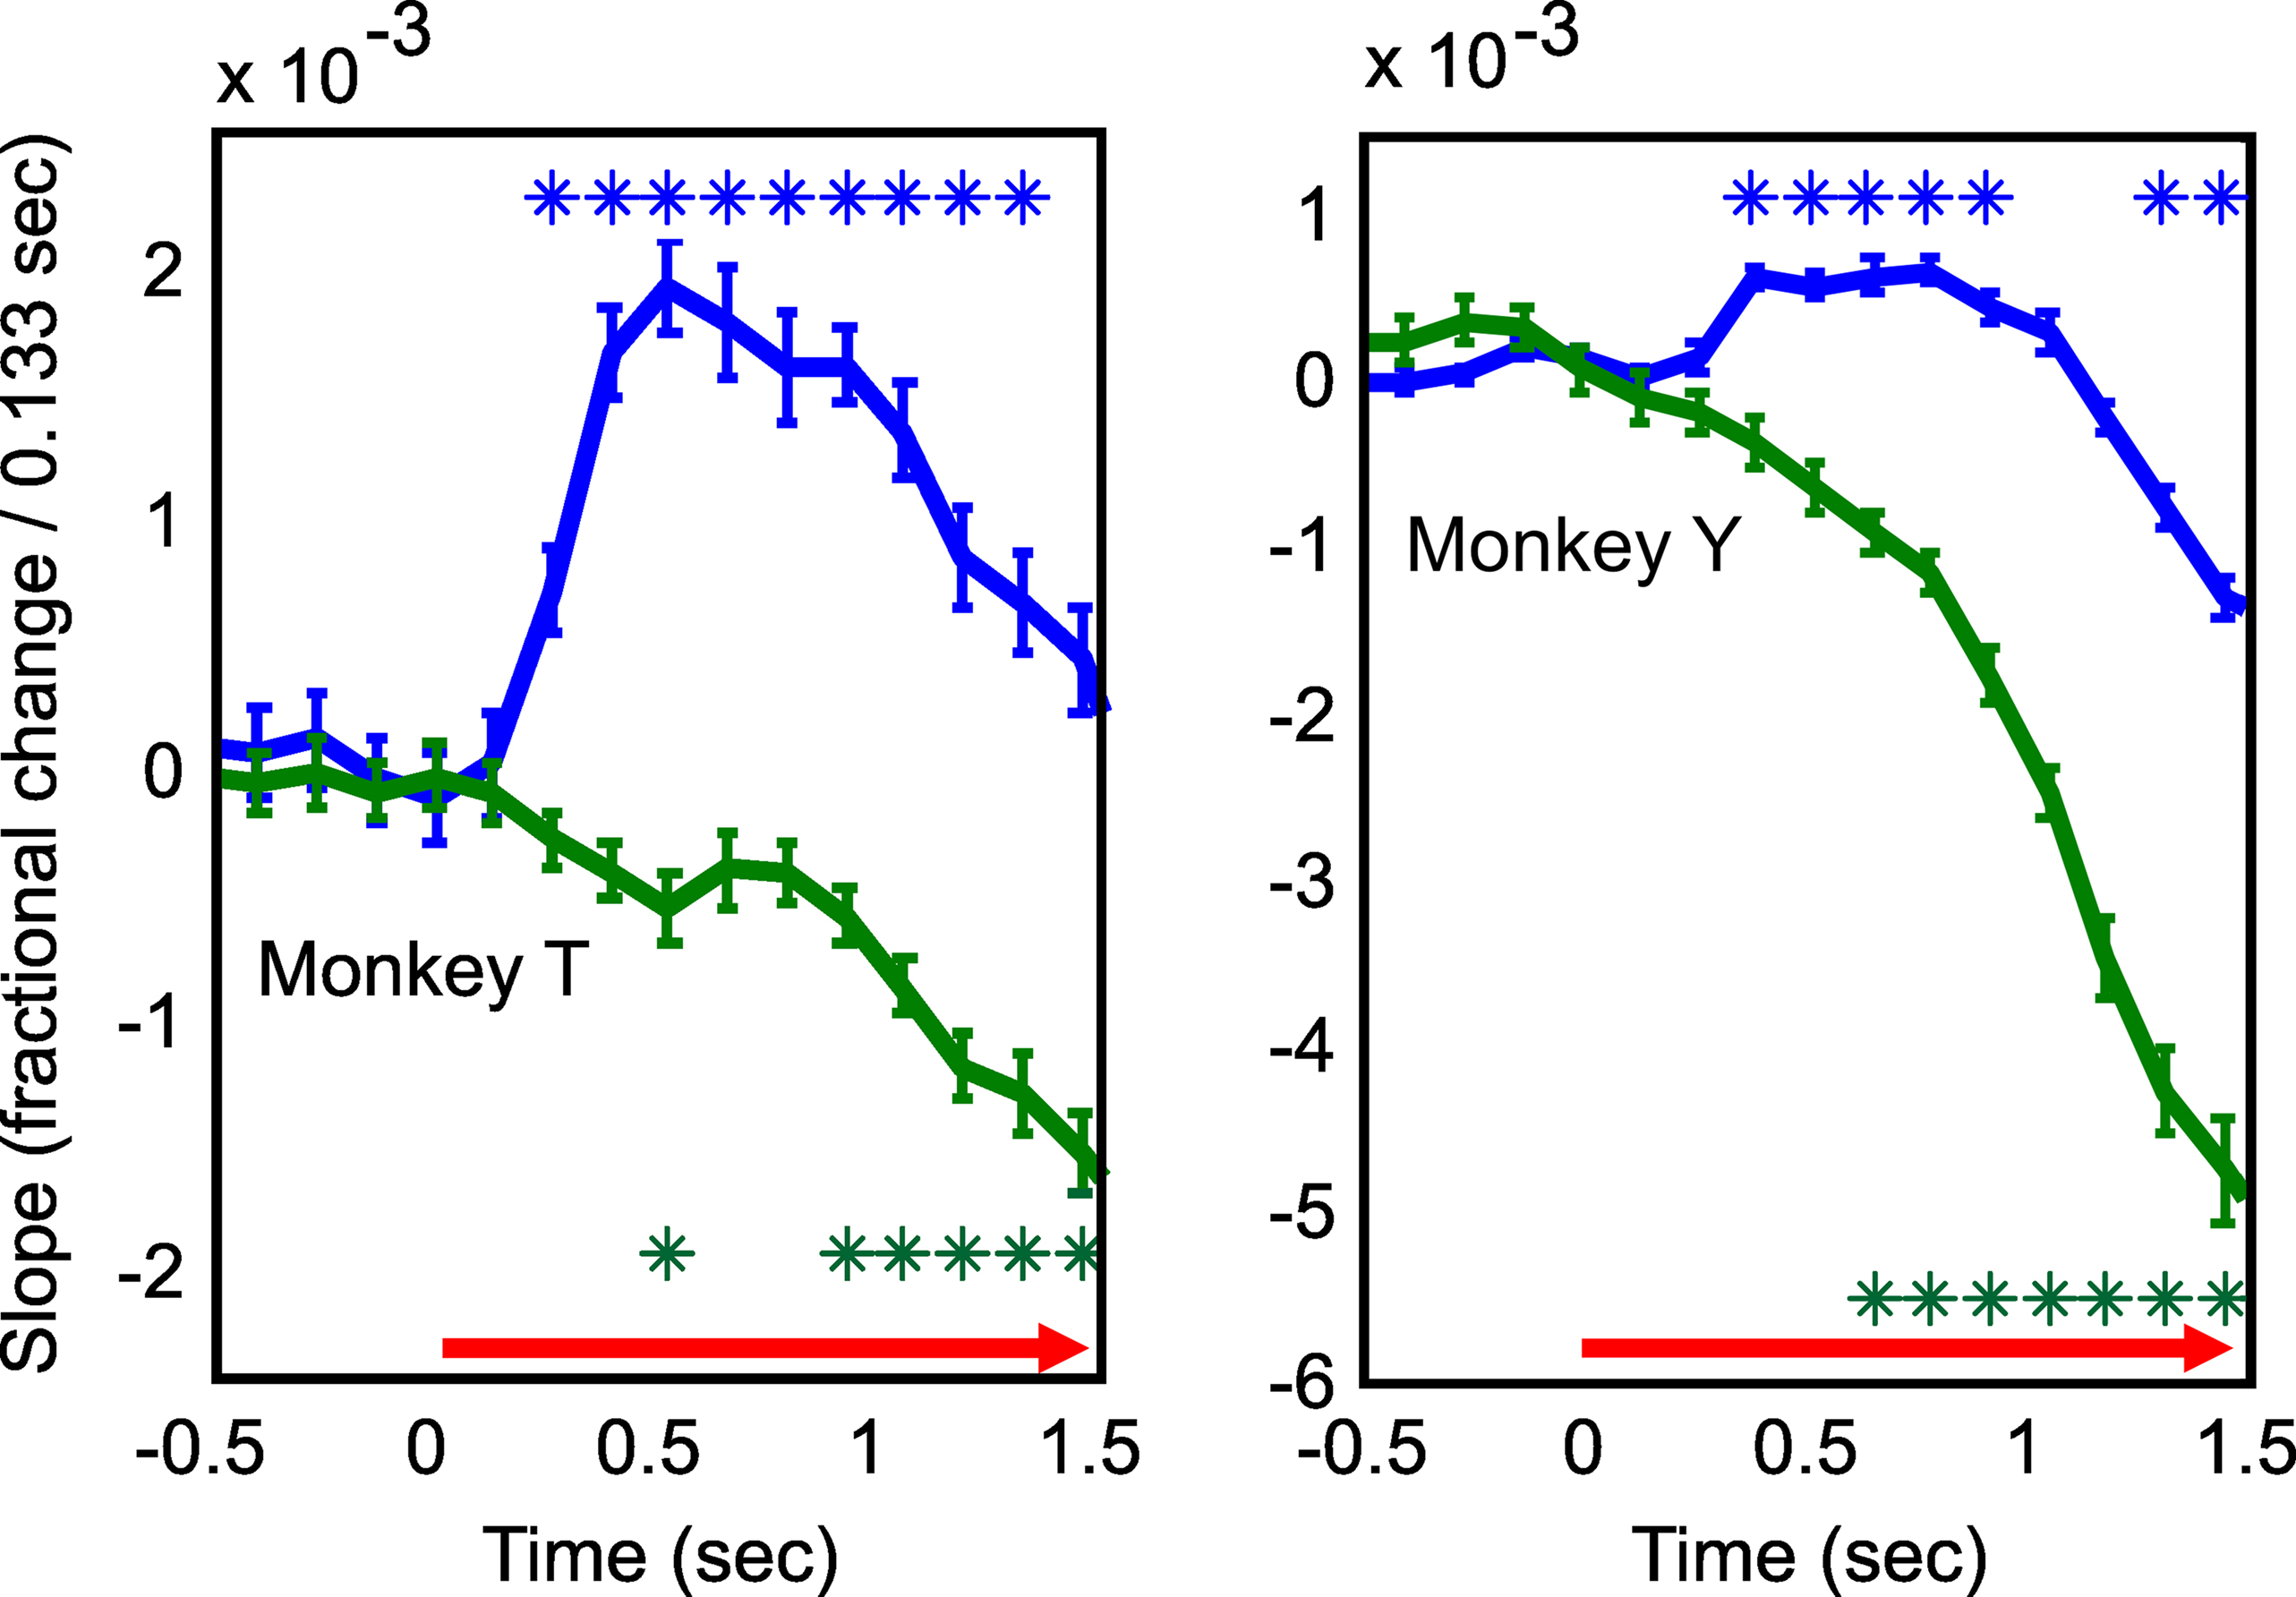
Figure 2. Fluorescence signals begin faster than simultaneously measured changes in reflectance. The slopes of fluorescence (blue) and reflectance (green) signals following stimulus onset. These slopes were calculated by taking trial-by-trial time derivatives of the dF/F and dR/R signals (Figure 1 B) and averaging them for the two animals separately. Asterisks denote significant changes in slope relative to baseline (p < 0.05; rank sum test corrected for multiple comparisons). Left and right show results for Monkey T and Monkey Y respectively. Note fluorescence signals reach significance earlier in both animals. Error bars are SEM. Figure depicts an average of 40 trials for monkey ‘T’ and 16 trials for monkey ‘Y’.
Early Positive Fluorescence Phase
We first examined the spatial spread of the early fluorescence and reflectance signals averaged between 0.67 and 1.60 s after stimulus onset. Figure 3 B shows the average spatial profile of the responses measured as a function of distance from the response center for monkey ‘T’. Consistent with prior work using anesthetized rodents (Weber et al., 2004 ), we found that the early fluorescence increases were spatially narrower than the simultaneously measured changes in reflectance suggesting that fluorescence increases may be tighter markers of neural activation than hemodynamics (Monkey ‘T’: fluorescence σ = 1.42 (0.07), reflectance σ = 2.20 (0.15), p < 0.05; Monkey ‘Y’: fluorescence σ = 1.90 (0.17), reflectance σ = 2.37 (0.30), n.s. p = 0.37; Figure 4 ).
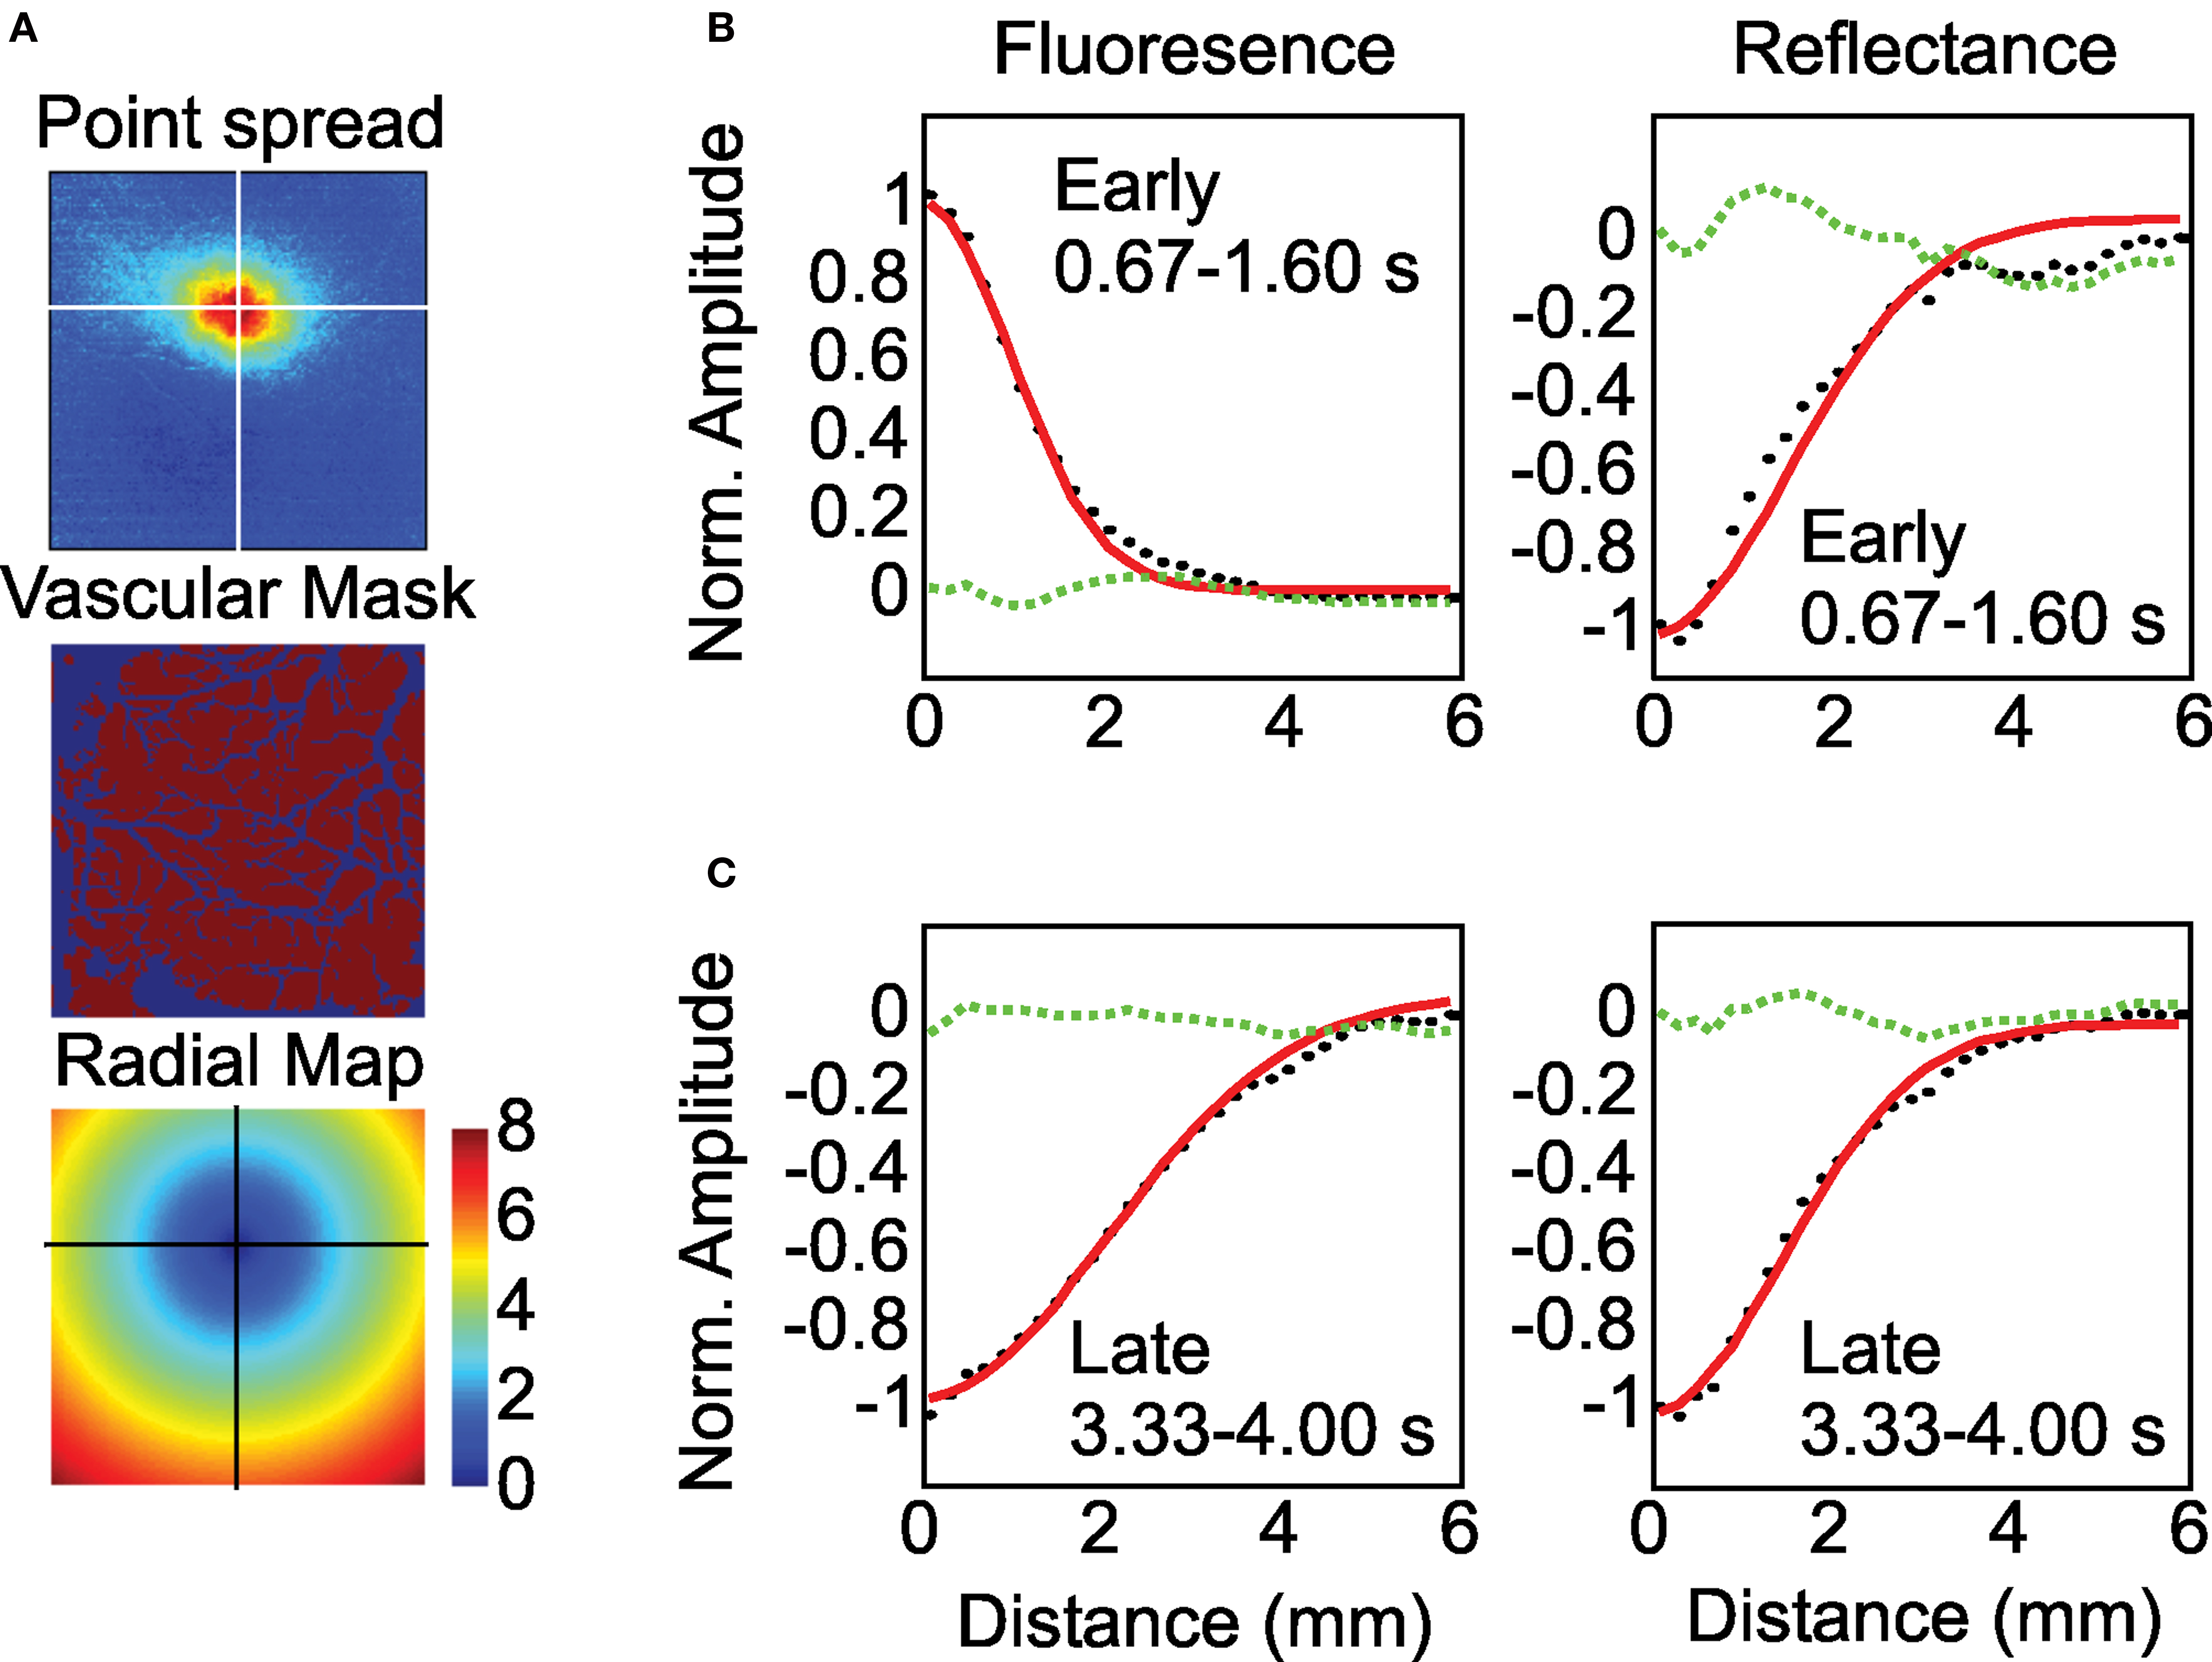
Figure 3. Early and late fluorescence signals have distinct point spreads. (A) Schematic of radial profile analysis. From top to bottom: activation center determined from the early fluorescence image; binary mask used to exclude fluorescence and reflectance changes near around large blood vessels; radial map of distance away from response center. Crosshairs mark the response center. Pixels with at the same distance were averaged together to create the radial profiles in (B) and (C). (B) Computed radial profiles during the early portion of the response (black dots) and the best fitting Gaussian function (red). Dotted green line is the residual of the fit. Note somewhat wider spread of reflectance relative to fluorescence signals. (C) Same as (B), but for late fluorescence and reflectance. Note broader late fluorescence signals relative to reflectance. Figure depicts an average of 40 trials.
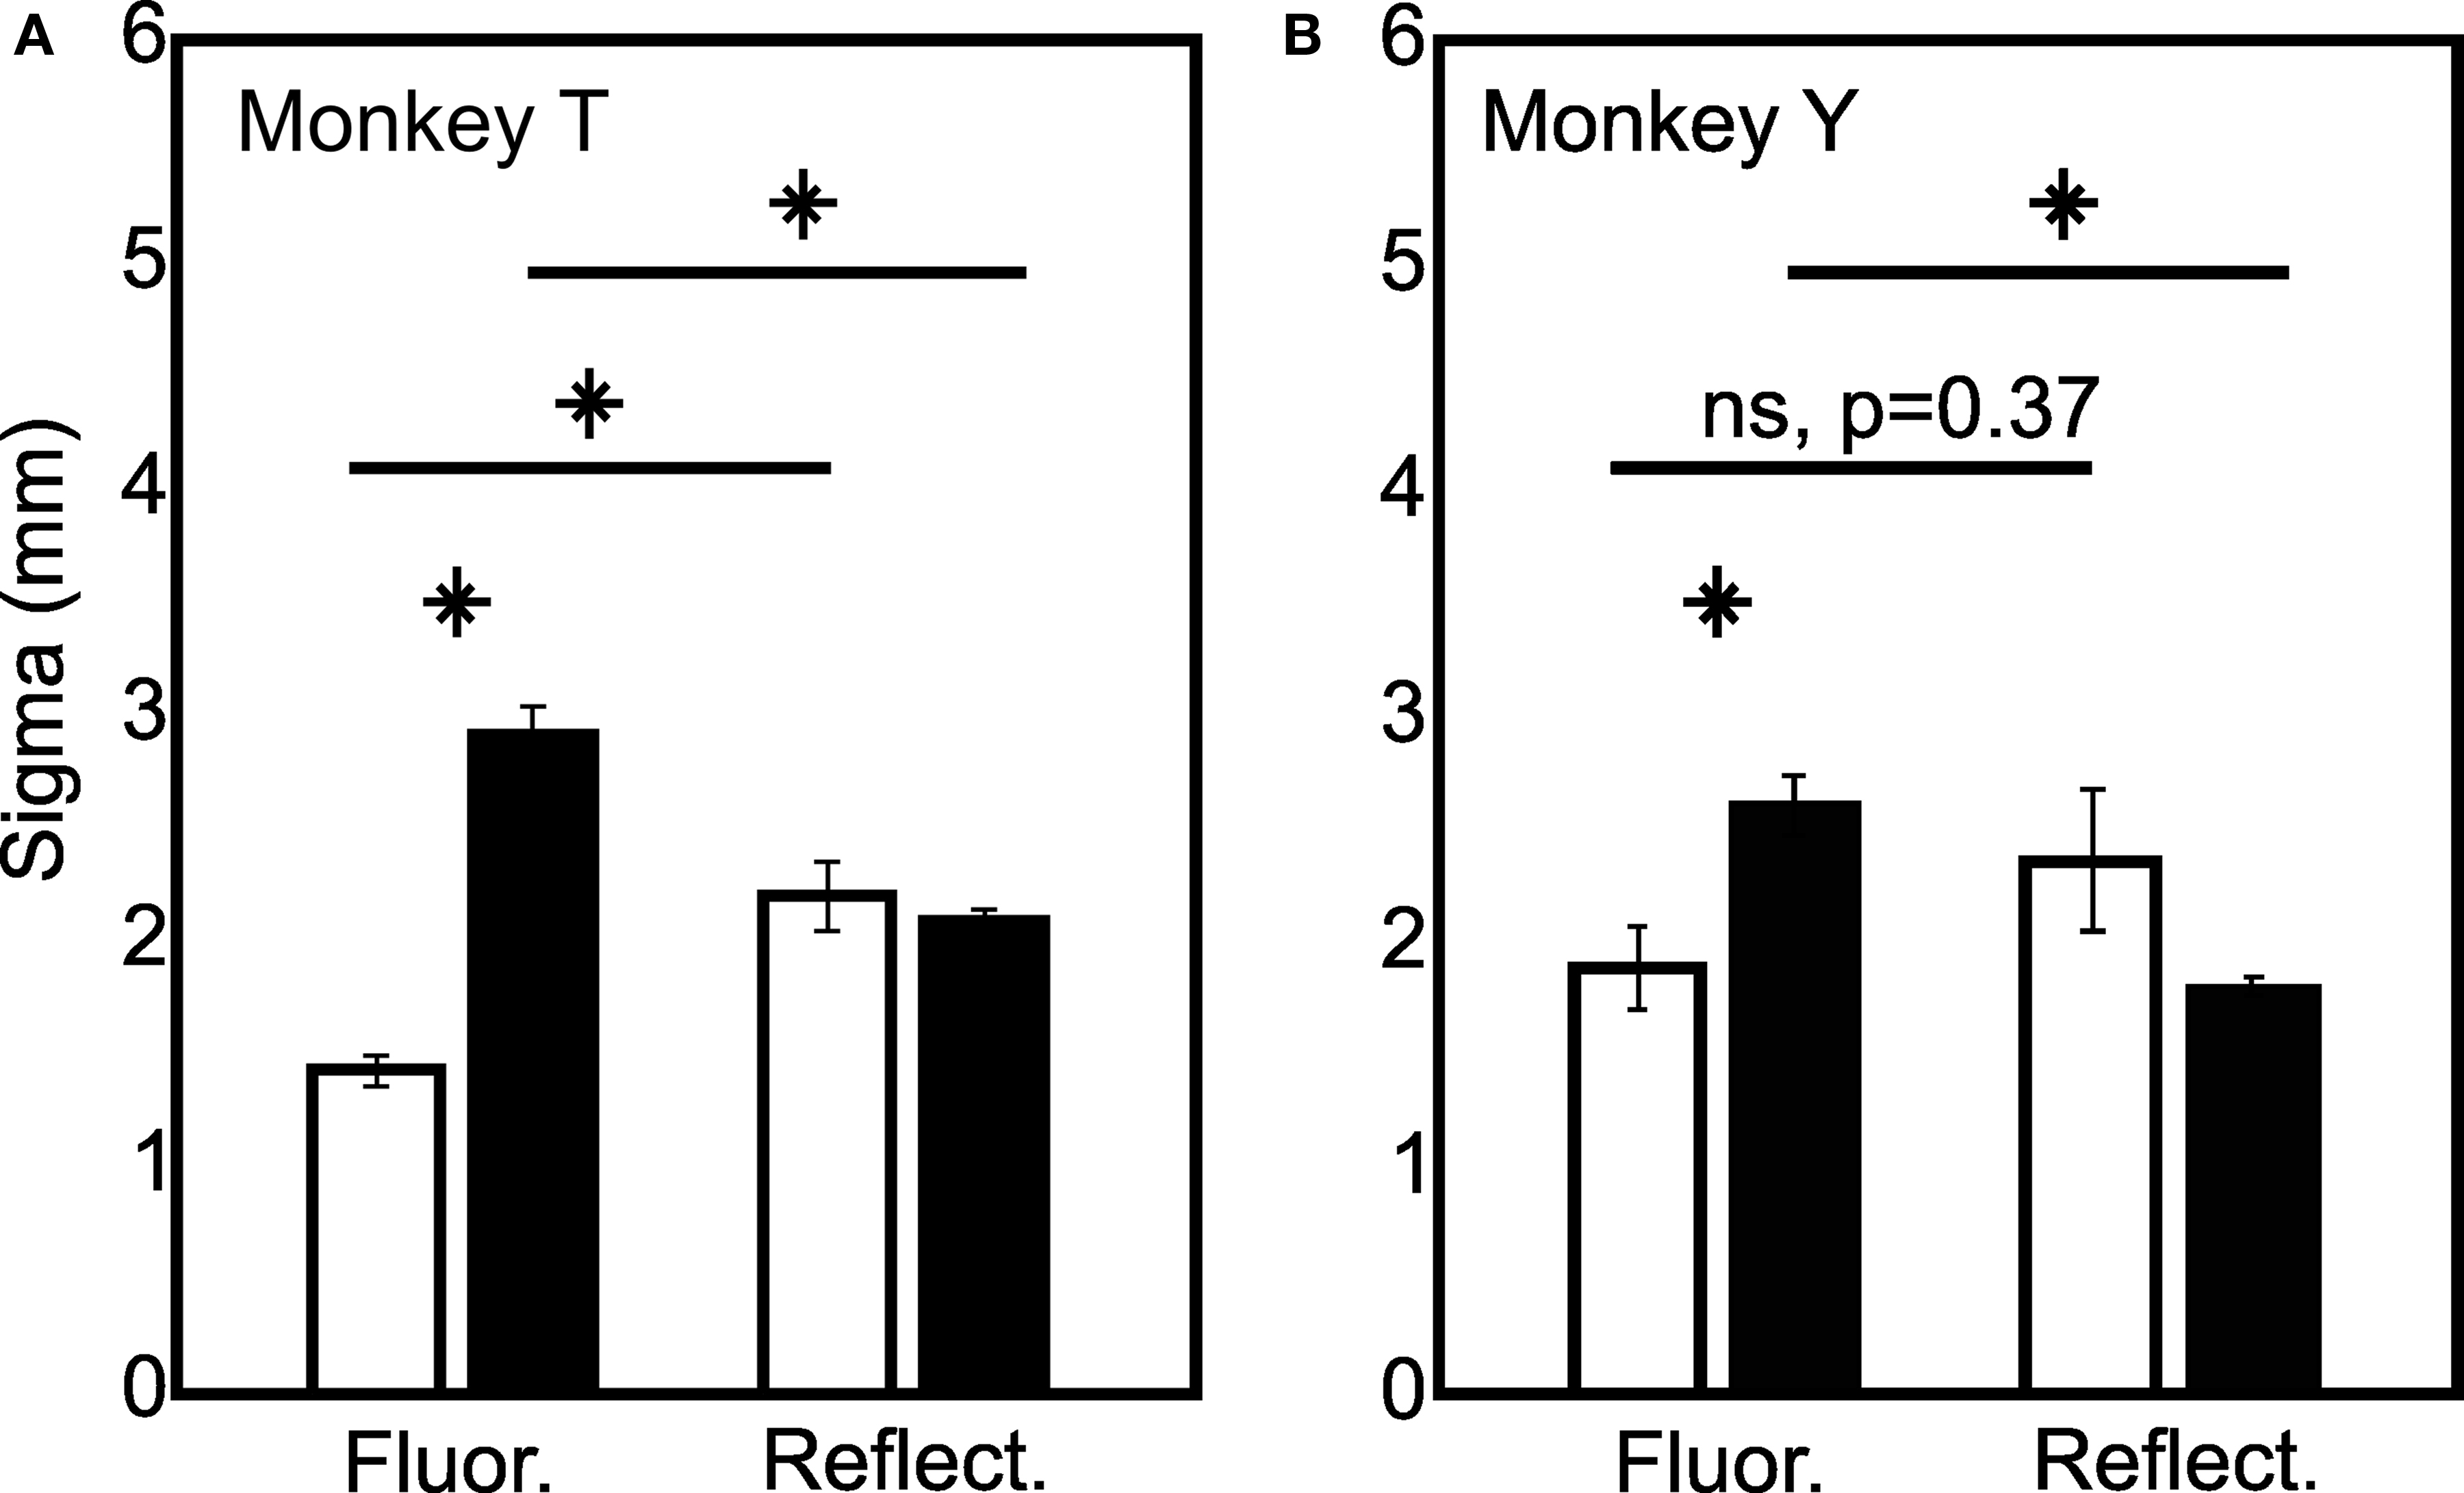
Figure 4. Quantification of the spatial spread of fluorescence and reflectance signals. Early (0.67–1.60 s, white bars) and late (3.33–4.00 s, black bars) response widths are plotted for fluorescence and reflectance signals. Asterisks denote significant differences between point spreads (rank sum test corrected for multiple comparisons). (A) and (B) show results from monkey T and monkey Y respectively. Error bars are SEM. Note no difference between reflectance point spreads early and late despite clear increases in the fluorescence point spread from early to late. N = 40 for monkey ‘T’ and N = 16 for monkey ‘Y’.
Late Negative Fluorescence Phase
We next examined the spatial spread of the late negative phase of the fluorescence signals (3.33–4.00 s) and compared them to the simultaneously measured changes in reflectance (Figure 3 C). These late fluorescence decreases were significantly wider in spatial spread compared with early positive fluorescence changes (Monkey ‘T’: σ = 2.92 (0.12); Monkey ‘Y’: σ = 2.62 (0.13); Figure 4 ). Indeed, these late fluorescence signals were also significantly wider than the simultaneously measured changes in blood volume (Monkey ‘T’: σ = 2.09 (0.05); Monkey ‘Y’: σ = 1.81 (0.05); Figure 4 ). We observed this dramatic difference (40–100%) between the early and late fluorescence signals even though we saw no significant changes in the spatial spread of the blood volume signal between these two timepoints in either monkey (Fig 4).
FFI Mapping Signals in Alert Animals
To determine whether FFI signals are useful for mapping in alert animals we performed orientation mapping in one animal with strong fluorescence responses (Figure 5 ; Monkey T). Figure 5 A shows the timecourse of FFI and volumetric mapping signals obtained by comparing responses to two orthogonal gratings. FFI orientation maps peaked by about 1 s after stimulus onset and then progressively weakened. By comparison, volumetric maps developed more slowly, reaching a steady level by 2 s after stimulus onset. We found that the spatial location of columns identified by FFI and volumetric signals were comparable (Figure 5 B), however, volumetric signals were more susceptible to vascular artifacts. To examine the temporal development of the maps, we quantified the mapping signal as the difference in activity between orthogonal orientation domains (Figure 5 C). Both FFI and volumetric signals appeared to initiate immediately after stimulus onset, however, fluorescence increased at a much faster rate. Consistent with the timecourse of the overall FFI signal, the FFI mapping signal began to decay prior to the end of visual stimulation. However, despite a large undershoot in the overall signal, the FFI mapping signal did not reverse into a negative phase, but remained elevated at a modest level for the full measured duration of the response, even after the end of visual stimulation (Figures 5 C,D).
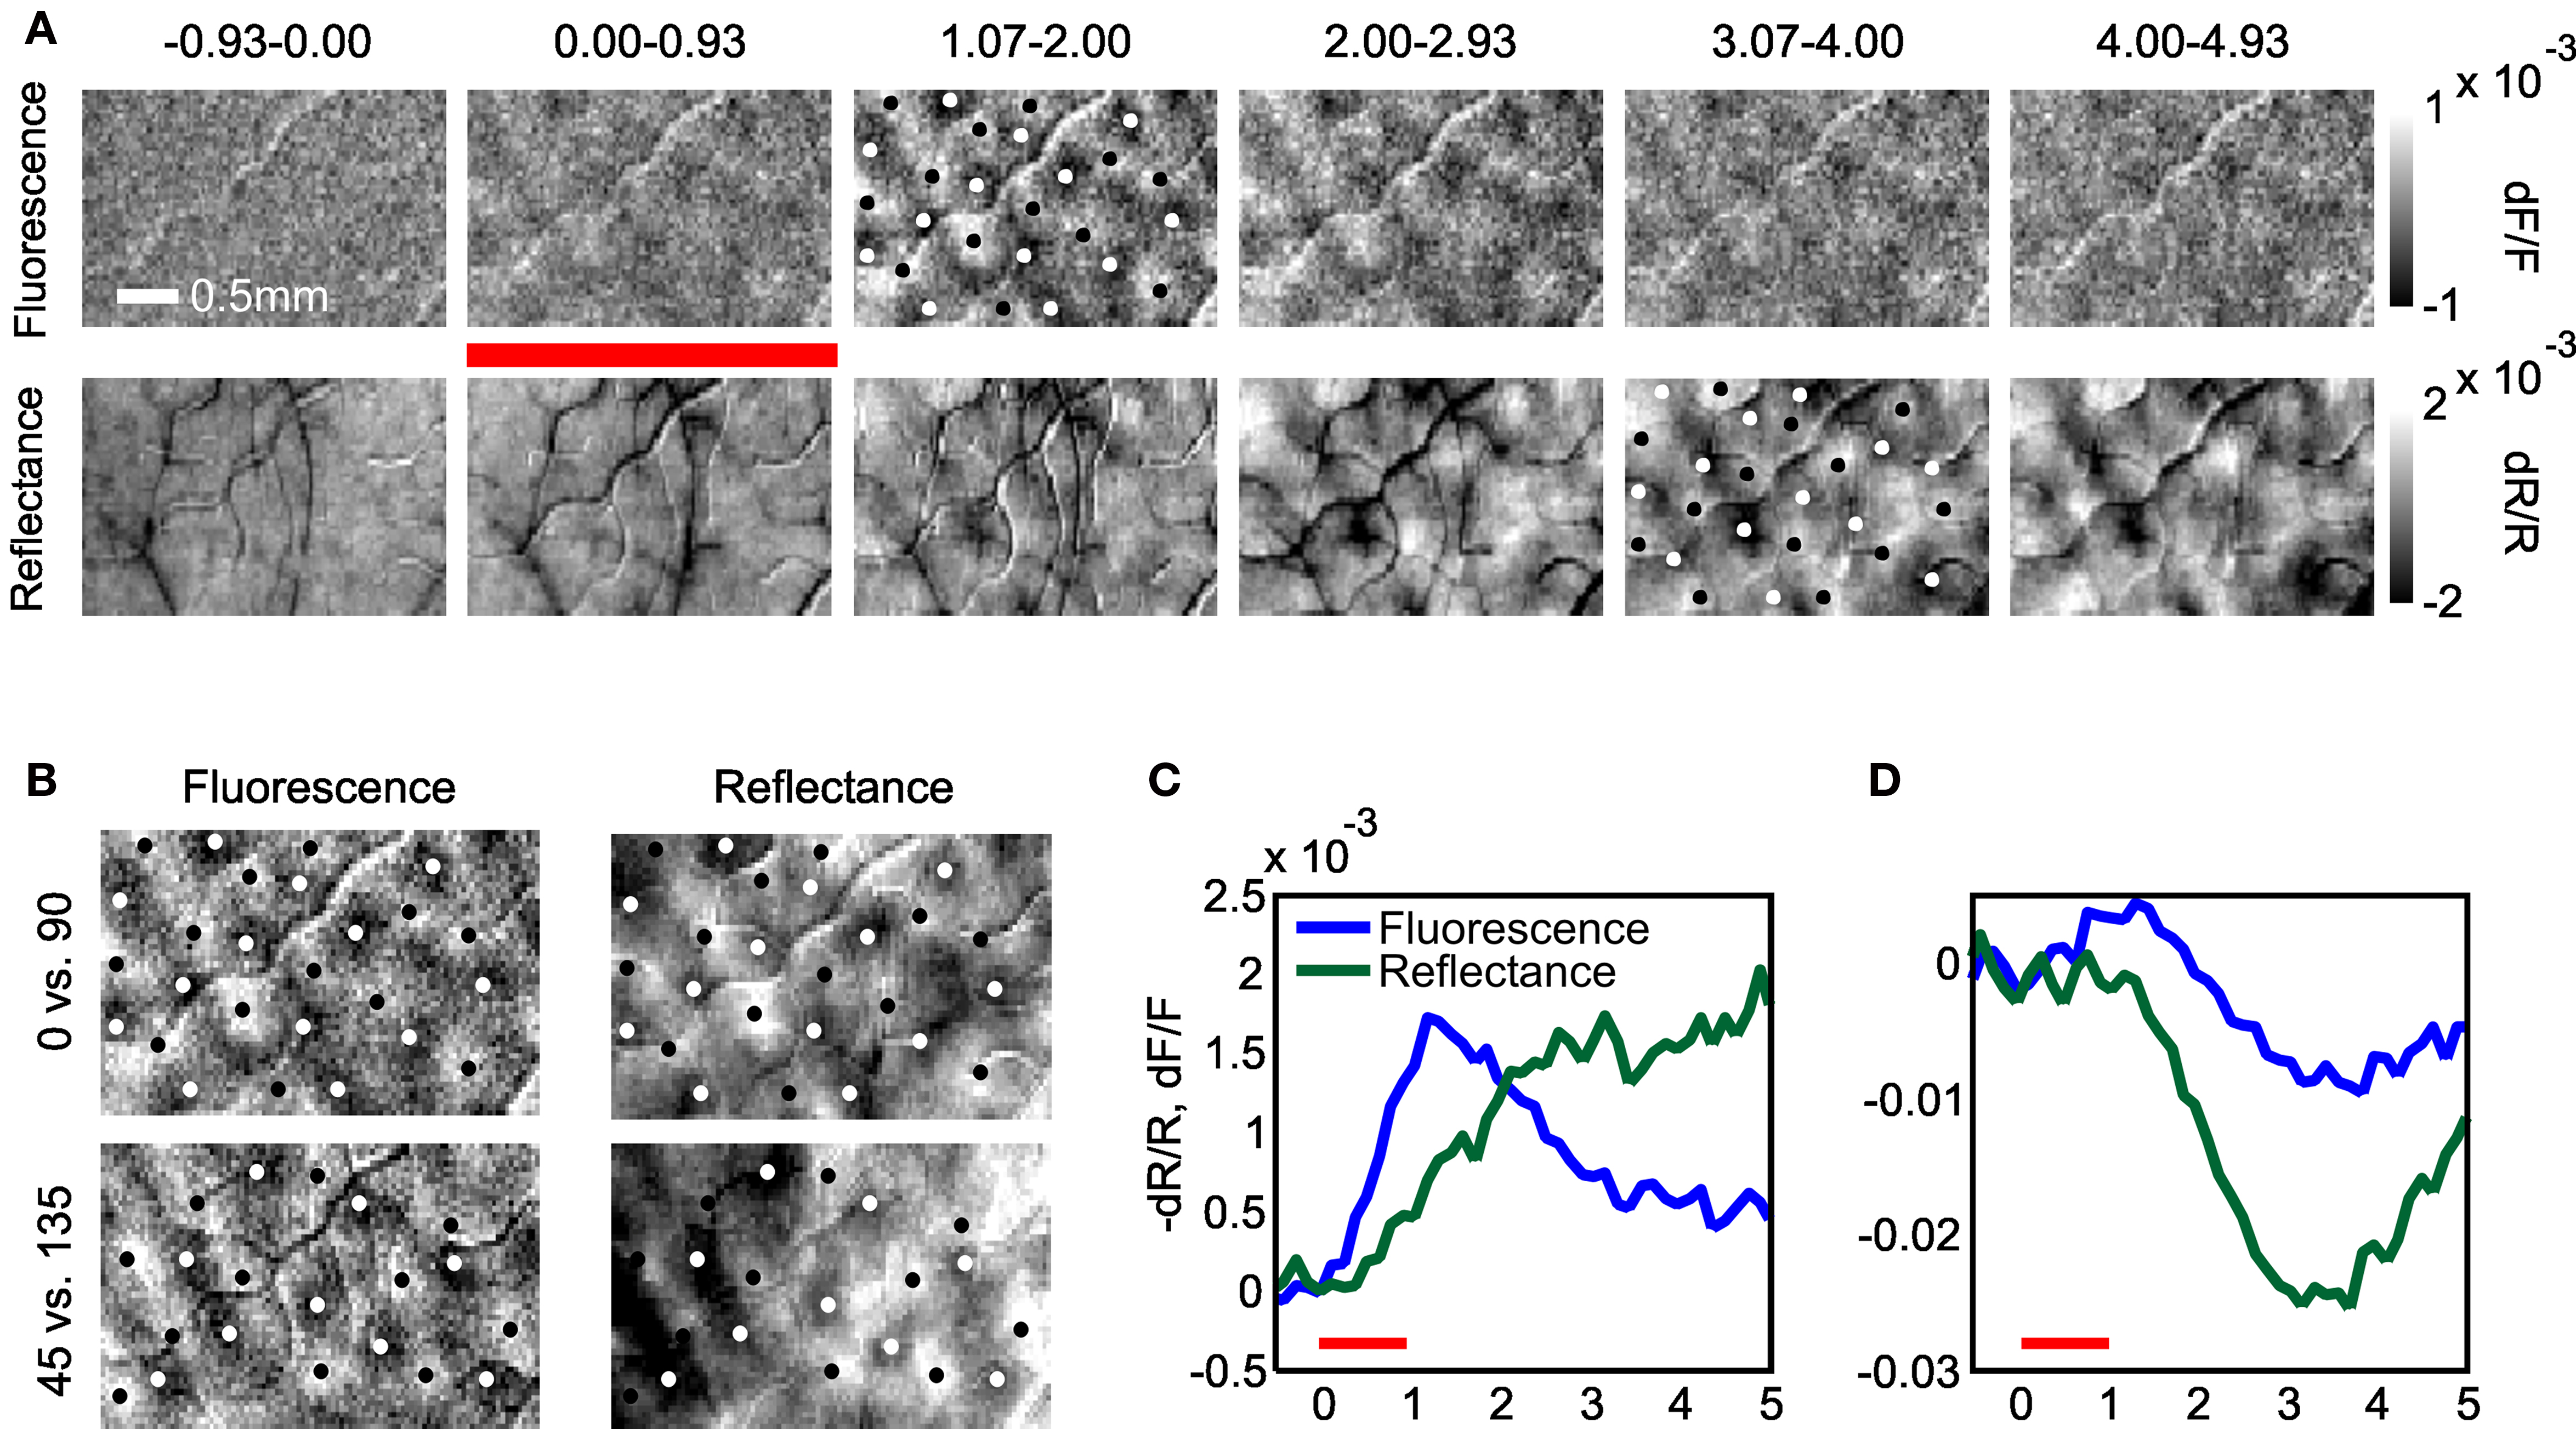
Figure 5. Fluorescence-based functional maps in alert monkeys peak earlier and have fewer vascular artifacts. (A) Development of the fluorescence and reflectance maps during response. Images show the difference in response to full-field drifting gratings of orthogonal orientations (0 vs. 90°). Red bar denotes stimulus presentation period. White and black column marker points show approximate centers of orientation domains. Note opposite sign of fluorescence and reflectance signals. Column markers on fluorescence and reflectance images are the same, but inverted in color for visibility. (B) Orientation maps obtained with fluorescence and reflectance signals show the same pattern of columnar activity for maps obtained with cardinal or oblique orientations. Note that the reflectance signals have been inverted for ease of comparison with the fluorescence signals. (C) The timecourse of fluorescence (blue) and reflectance (green) mapping signals measured as the difference in activity between orthogonal columns. Note earlier peak and similar amplitudes of fluorescence and reflectance mapping signals. The reflectance signal is flipped in sign for easier comparison with the fluorescence signal. (D) The timecourse of the global fluorescence and reflectance signals evoked by grating stimulation for comparison with (C). Note reversal of the net fluorescence signal is absent from the mapping signal in (C). Figure depicts average of 19 trials for each orientation.
Discussion
The ultimate goal of functional brain imaging should be not only to localize neural signals, but to provide a quantitative measure of the neural activity involved. From this standpoint, FFI imaging provides an exciting candidate signal and offers a number of advantages over the commonly used imaging signals based on cerebral hemodynamics. The hemodynamic signal is known to be influenced strongly by neuromodulatory inputs, for example, from subcortical nuclei such as locus coeruleus or the basal forebrain (reviewed by Hamel, 2006 ). Thus, hemodynamics-based imaging signals likely consist of a complex combination of components, with some that are driven by local neural activity and others reflecting distal neuromodulatory control. For example, we showed recently that the V1 hemodynamic signal recorded in alert monkeys performing a periodic visual task had a prominent component at trial period that was not predictable by concurrently recorded neural activity and was evident even in the absence of visual stimulation. By contrast, FFI signals are entirely local in origin and can be linked to specific cellular processes (Chance et al., 1979 ; Duchen, 1992 ; Shibuki et al., 2003 ; Reinert et al., 2004 ; Kosterin et al., 2005 ). Thus the FFI signal likely offers a reliable quantitative measure of local metabolic changes and hence local neural activity.
An additional advantage of FFI is that these signals are largely free of vascular artifacts (compare the fluorescence and reflectance signals in Figure 1 ). This is because the FFI signal depends on a chromophore (FAD/FADH2) that is local to neural tissue (bound to mitochondrial membranes) as opposed to the one (hemoglobin) contained in passing blood vessels. Even though hemodynamics-based signals are large and clearly indicate the overall locus of neural activity, they are strongly biased toward large pial vessels. It is noteworthy that the space constants observed in the early fluorescence and reflectance images are comparable (Figure 4 ); this is because both signals likely reflect the net point spread of neural activity across cortex (as imaged using voltage sensitive dyes; Grinvald et al., 1994 ; Chen et al., 2006 ). However, the vascular patterns observed in hemodynamics-based signals obscure the actual spatial profile of neural activity over cortex. Even though early hemodynamic signals are also free of large vascular patterns (Sheth et al., 2004 ; Sirotin et al., 2009 ), at such early timepoints they are typically of smaller amplitude than the peak FFI signals which remain free of vascular artifacts throughout their timecourse. Further, as previously demonstrated in anesthetized cats (Husson et al., 2007 ), FFI may also be more useful for mapping. We found that, despite a smaller global signal, the FFI mapping signal appears comparable to that observed using hemodynamics. Thus, a larger fraction of the FFI signal is tuned for the functional properties of the underlying neural activity. Taken together, these observations suggest that FFI is likely a better indicator of the exact spatial profile of neural activity than hemodynamics-based measures.
Despite these advantages, measuring fluorescence signals is more technically challenging than the more commonly used reflectance signals and it was unclear whether FFI signals would be reliably measurable in alert animals. Thus, for FFI signals to be useful for neuroimaging, the relative benefits of using these signals over hemodynamics-based signals must outweigh the additional experimental complexity. This requires a detailed understanding of the spatiotemporal properties of cortical FFI signals from alert animals.
Feasibility of FFI Imaging in Alert Animals
Here we have demonstrated that FFI point spreads and mapping signals can be routinely obtained from the primary visual cortex of monkeys performing simple visual tasks. Prior work showed that early FFI signals measured in cortex of anesthetized preparations appeared to be free of artifacts due to changes in cortical reflectance (Shibuki et al., 2003 ; Weber et al., 2004 ). However, these signals were quickly contaminated by the stimulus-evoked hemodynamic response. Because the hemodynamic response starts with latencies as short as 600 ms (Weber et al., 2004 ; Sirotin et al., 2009 ), it begins to contaminate the fluorescence signal even within the first second of the response. Additionally, we have previously found that reflectance signals in V1 of alert primates are modulated significantly by large trial-related hemodynamic signals unrelated to visual stimulation (Sirotin and Das, 2009 ). Such trial-related hemodynamic activity in alert animals contaminates all portions of the fluorescence response. To remove this confound, we corrected the raw FFI signals for changes in reflectance. Though, classical investigations measuring fluorescence in vivo have corrected their signals for simultaneously measured changes in reflectance (Rosenthal and Jobsis, 1971 ; O’Connor et al., 1972 ; Harbig et al., 1976 ; Kramer and Pearlstein, 1979 ), no such correction was performed in any of the imaging studies to date. Our corrected FFI signals were free of vascular artifacts for the full duration of the imaged response (e.g. compare our Figure 1 with Figure 5 in Shibuki et al., 2003 ) and we could therefore examine both the early and later phases of the FFI signal. We believe that such correction will be of general benefit for all future studies measuring cortical fluorescence responses.
The Biphasic Fluorescence Signal
The in vitro FFI response to stimulation is typically biphasic, with an early increase (oxidation phase) followed by a prolonged decrease (reduction phase) (Duchen, 1992 ; Kosterin et al., 2005 ). The onset of the reduction phase may start prior to the cessation of stimulation and different mechanisms have been proposed for the two phases of this metabolic response. The oxidation phase is due to fast Ca2+ and ADP evoked increases in the rate of FADH2 utilization in the electron transport chain. The reduction phase is thought to be due to a somewhat more delayed increase in tricarboxylic acid (TCA) cycle activity that replenishes FADH2 at a faster rate than it can be utilized by the electron transport chain (Turner et al., 2007 ).
We found that cortical FFI signals corrected for simultaneous changes in reflectance were largely consistent with the in vitro results (Duchen, 1992 ; Kosterin et al., 2005 ) and with in vivo signals measured in the cerebellum (Reinert et al., 2004 , 2007 ; Gao et al., 2006 ) which are largely uncontaminated by changes in reflectance. FFI signals were biphasic (Figures 1 C and 5 D), with a spatially narrow fluorescence increase, declining prior to the end of stimulation, and followed by a fluorescence decrease. Interestingly, we found that even as the net fluorescence signal reversed polarity, the functionally tuned FFI mapping signal remained positive (Figures 5 C,D). Taken together, these results suggest that the cortical FFI signal, rather than being an index of absolute cortical metabolism, is a difference signal reflecting the overall balance between tuned increases in FADH2 utilization in the electron transport chain and its replenishing by a possibly untuned increase in TCA cycle activity (Turner et al., 2007 ). Still, it is possible that the early increase in FFI signal may still be a linear indicator of neural activity (Tohmi et al., 2006 ). To clarify this point, future studies must therefore carefully explore the relationship between neural activity and the full timecourse of the FFI signal.
Relationship of Early Fluorescence Signals with Hemodynamics
In agreement with previous studies in cortex (Weber et al., 2004 ; Husson et al., 2007 ), we observed that early fluorescence increases are faster and somewhat narrower spatially than the simultaneously imaged reflectance changes. At our isosbestic imaging wavelength (528 nm), the reflectance signal is insensitive to blood oxygenation and, for small signal changes, is roughly proportional to changes in the concentration of hemoglobin (Kohl et al., 2000 ; Sheth et al., 2004 ; Prahl, 2008 ; Sirotin et al., 2009 ). We found that the spatial spread of FFI signals was 25–50% narrower that of the simultaneously measured hemodynamic response. This is comparable to the previously conducted comparison between laser speckle imaging signals and FFI in rodent barrel cortex (Weber et al., 2004 ). It is very likely that the difference between the FFI and hemodynamic signals at these early timepoints reflects a tighter coupling of the FFI signal with increases in cortical metabolism (driven primarily by local neural activity; Attwell and Laughlin, 2001 ; Attwell and Iadecola, 2002 ) than the coupling of the hemodynamic response to cortical metabolism. It is important to point out that, at these early timepoints (0.67–1.60 s), the hemodynamic signal is confined to small vessels (below our camera resolution of 36 μm; Figure 1 ) so the difference between the signals is unlikely to be due to vascular overspill into larger vessels (Sheth et al., 2004 , 2005 ).
As previously observed in anesthetized cats, we found that functional maps obtained using FFI peaked earlier and were relatively unaffected by vascular artifacts as compared to volumetric signals (Husson et al., 2007 ). The overall pattern of orientation columns was not different between FFI and hemodynamic signals. Further, the amplitude of the mapping signal was comparable between FFI and volumetric signals. Indeed, the relatively large amplitude of these signals is significantly better than mapping signal amplitudes observed at commonly used red imaging wavelengths (i.e. >605 nm; Husson et al., 2007 ), which are typically only half as large as the volumetric mapping signal (Vanzetta et al., 2004 ). Thus, FFI signals appear to be particularly useful for mapping fine-scale cortical architecture in alert behaving animals.
The Wide Point Spread of the Late Fluorescence Signals
To our knowledge, no study to date has examined the spatial profile of the late cortical fluorescence signal in vivo. Surprisingly, we found that the spatial extent of late fluorescence decreases were significantly wider than both the early fluorescence increases and the simultaneously measured hemodynamic signals (Figure 4 ). In the cerebellum, Gao et al. (2006) have shown that lateral inhibition between adjacent cortical regions can lead to negative fluorescence signals in vivo. Unlike the cerebellum, visual cortex has both excitatory and inhibitory lateral connections. Thus, it is possible that the exact spatiotemporal dynamics of FFI signals are shaped by the properties of lateral connectivity in cortex.
Future Directions in Developing the FFI Signal as an Imaging Tool in Alert Animals
Two issues must be addressed to further develop FFI as an imaging tool in alert animals. First, in order for FFI to be advantageous over the more easily measured hemodynamic signals, its spatiotemporal properties must be more readily interpretable in terms of neural activity. Future work must therefore investigate how the spatial spreads of the early and late FFI signals compare to the underlying spread of neural activity and whether FFI signals are indeed better measures of local neural activation than hemodynamics. Of special importance is whether FFI signals are temporally linear. The two phases of the FFI signal are likely driven by different underlying processes with different temporal properties (Duchen, 1992 ; Brennan et al., 2007 ). The FFI responses to extended stimulation may, therefore, not be linearly related to their responses to brief stimuli. Hence, a better understanding of the relationship between neural activity and the two phases of the fluorescence response would be fundamental for correctly interpreting FFI.
Second, though we were able to routinely image FFI signals, we did observe significant bleaching of fluorescence across our experimental session (Shibuki et al., 2003 ; Weber et al., 2004 ). We therefore minimized the cortical exposure to the excitation wavelength. Reflectance changes, on the other hand, can be measured continuously without any detrimental effects to the animal (Sirotin and Das, 2009 ). This technical limitation currently precludes the use FFI signals to investigate any slow fluctuations in cortical state which may have significant behavioral relevance (Aston-Jones and Cohen, 2005 ; Raichle and Snyder, 2007 ; Sirotin and Das, 2009 ). However, using more sensitive optics, together with lower intensities of excitation light and temporally sparse sampling may overcome this limitation in the future.
Conflict of Interest Statement
The authors declare that the research was conducted in the absence of any commercial or financial relationships that could be construed as a potential conflict of interest.
Acknowledgments
We thank: M.E. Goldberg for supporting a dedicated machine shop. B. Thomas for manufacturing the LED driving circuits. J. Caban for machining the optical hardware. M. Bucklin, E. Glushenkova, S. Levine, and J. Ordinario for excellent technical assistance. Mariana Cardoso for helpful scientific discussions. The work was supported by National Institutes of Health (NIH) Grants R01 EY013759 and R01 EY019500 (to Aniruddha Das), and R24 EY015634 (to Dr. M.E. Goldberg), as well as the Columbia Research Initiatives in Science and Engineering, the Gatsby Initiative in Brain Circuitry, The Dana Foundation Program in Brain and Immuno Imaging and the Esther and Joseph Klingenstein Foundation, Fellowship in the Neurosciences (to Aniruddha Das).
Footnote
- ^ Our measure of blood volume is largely equivalent to cerebral blood volume (CBV) as measured in fMRI for fixed hematocrit. Because CBV in MR studies often measures plasma volume (e.g. via a contrast agent) the two differ if the hematocrit changes.
References
Aston-Jones, G., and Cohen, J. D. (2005). An integrative theory of locus coeruleus-norepinephrine function: adaptive gain and optimal performance. Annu. Rev. Neurosci. 28, 403–450.
Attwell, D., and Iadecola, C. (2002). The neural basis of functional brain imaging signals. Trends Neurosci. 25, 621–625.
Attwell, D., and Laughlin, S. B. (2001). An energy budget for signaling in the grey matter of the brain. J. Cereb. Blood Flow Metab. 21, 1133–1145.
Bartels, A., Logothetis, N. K., and Moutoussis, K. (2008). fMRI and its interpretations: an illustration on directional selectivity in area V5/MT. Trends Neurosci. 31, 444–453.
Berwick, J., Martin, C., Martindale, J., Jones, M., Johnston, D., Zheng, Y., Redgrave, P., and Mayhew, J. (2002). Hemodynamic response in the unanesthetized rat: intrinsic optical imaging and spectroscopy of the barrel cortex. J. Cereb. Blood Flow Metab. 22, 670–679.
Bonhoeffer, T., and Grinvald, A. (1996). “Optical imaging base on intrinsic signals: the methodology,” in Brain Mapping. The Methods, eds A. W. Toga and J. C. Mazziota (San Diego: Academic Press), 55–87.
Brennan, A. M., Connor, J. A., and Shuttleworth, C. W. (2007). Modulation of the amplitude of NAD(P)H fluorescence transients after synaptic stimulation. J. Neurosci. Res. 85, 3233–3243.
Chance, B., Schoener, B., Oshino, R., Itshak, F., and Nakase, Y. (1979). Oxidation-reduction ratio studies of mitochondria in freeze-trapped samples. NADH and flavoprotein fluorescence signals. J. Biol. Chem. 254, 4764–4771.
Chen, G., Popa, L. S., Wang, X., Gao, W., Barnes, J., Hendrix, C. M., Hess, E. J., and Ebner, T. J. (2009). Low-frequency oscillations in the cerebellar cortex of the tottering mouse. J. Neurophysiol. 101, 234–245.
Chen, Y., Geisler, W. S., and Seidemann, E. (2006). Optimal decoding of correlated neural population responses in the primate visual cortex. Nat. Neurosci. 9, 1412–1420.
Duchen, M. R. (1992). Ca(2+)-dependent changes in the mitochondrial energetics in single dissociated mouse sensory neurons. Biochem. J. 283(Pt 1): 41–50.
Frostig, R. D., Lieke, E. E., Ts’o, D. Y., and Grinvald, A. (1990). Cortical functional architecture and local coupling between neuronal activity and the microcirculation revealed by in vivo high-resolution optical imaging of intrinsic signals. Proc. Natl. Acad. Sci. USA 87, 6082–6086.
Gao, W., Chen, G., Reinert, K. C., and Ebner, T. J. (2006). Cerebellar cortical molecular layer inhibition is organized in parasagittal zones. J. Neurosci. 26, 8377–8387.
Grinvald, A., Lieke, E. E., Frostig, R. D., and Hildesheim, R. (1994). Cortical point-spread function and long-range lateral interactions revealed by real-time optical imaging of macaque monkey primary visual cortex. J. Neurosci. 14, 2545–2568.
Hamel, E. (2006). Perivascular nerves and the regulation of cerebrovascular tone. J. Appl. Physiol. 100, 1059–1064.
Harbig, K., Chance, B., Kovach, A. G., and Reivich, M. (1976). In vivo measurement of pyridine nucleotide fluorescence from cat brain cortex. J. Appl. Physiol. 41, 480–488.
Husson, T. R., Mallik, A. K., Zhang, J. X., and Issa, N. P. (2007). Functional imaging of primary visual cortex using flavoprotein autofluorescence. J. Neurosci. 27, 8665–8675.
Iadecola, C., and Nedergaard, M. (2007). Glial regulation of the cerebral microvasculature. Nat. Neurosci. 10, 1369–1376.
Kalatsky, V. A., and Stryker, M. P. (2003). New paradigm for optical imaging: temporally encoded maps of intrinsic signal. Neuron 38, 529–545.
Kasischke, K. A., Vishwasrao, H. D., Fisher, P. J., Zipfel, W. R., and Webb, W. W. (2004). Neural activity triggers neuronal oxidative metabolism followed by astrocytic glycolysis. Science 305, 99–103.
Kitaura, H., Uozumi, N., Tohmi, M., Yamazaki, M., Sakimura, K., Kudoh, M., Shimizu, T., and Shibuki, K. (2007). Roles of nitric oxide as a vasodilator in neurovascular coupling of mouse somatosensory cortex. Neurosci. Res. 59, 160–171.
Kohl, M., Lindauer, U., Royl, G., Kuhl, M., Gold, L., Villringer, A., and Dirnagl, U. (2000). Physical model for the spectroscopic analysis of cortical intrinsic optical signals. Phys. Med. Biol. 45, 3749–3764.
Kosterin, P., Kim, G. H., Muschol, M., Obaid, A. L., and Salzberg, B. M. (2005). Changes in FAD and NADH fluorescence in neurosecretory terminals are triggered by calcium entry and by ADP production. J. Membr. Biol. 208, 113–124.
Kramer, R. S., and Pearlstein, R. D. (1979). Cerebral cortical microfluorometry at isosbestic wavelengths for correction of vascular artifact. Science 205, 693–696.
Martin, C., Berwick, J., Johnston, D., Zheng, Y., Martindale, J., Port, M., Redgrave, P., and Mayhew, J. (2002). Optical imaging spectroscopy in the unanaesthetised rat. J. Neurosci. Methods 120, 25–34.
Matsuda, K., Nagami, T., Kawano, K., and Yamane, S. (2000). A New System for Measuring Eye Position on a Personal Computer. Program No. 744.2 Neuroscience 2000 Abstracts. New Orlean, LA. Society for Neuroscience.
O’Connor, M. J., Herman, C. J., Rosenthal, M., and Jobsis, F. F. (1972). Intracellular redox changes preceding onset of epileptiform activity in intact cat hippocampus. J. Neurophysiol. 35, 471–483.
Prahl, S. (2008). Tabulated Molar Extinction Coefficient for Hemoglobin in Water. Available at: http://omlc.ogi.edu/spectra/hemoglobin/summary.html/
Raichle, M. E., and Snyder, A. Z. (2007). A default mode of brain function: a brief history of an evolving idea. Neuroimage 37, 1083–1090; discussion 1097–1089.
Reinert, K. C., Dunbar, R. L., Gao, W., Chen, G., and Ebner, T. J. (2004). Flavoprotein autofluorescence imaging of neuronal activation in the cerebellar cortex in vivo. J. Neurophysiol. 92, 199–211.
Reinert, K. C., Gao, W., Chen, G., and Ebner, T. J. (2007). Flavoprotein autofluorescence imaging in the cerebellar cortex in vivo. J. Neurosci. Res. 85, 3221–3232.
Rosenthal, M., and Jobsis, F. F. (1971). Intracellular redox changes in functioning cerebral cortex. II. Effects of direct cortical stimulation. J. Neurophysiol. 34, 750–762.
Sheth, S. A., Nemoto, M., Guiou, M., Walker, M., Pouratian, N., Hageman, N., and Toga, A. W. (2004). Columnar specificity of microvascular oxygenation and volume responses: implications for functional brain mapping. J. Neurosci. 24, 634–641.
Sheth, S. A., Nemoto, M., Guiou, M. W., Walker, M. A., and Toga, A. W. (2005). Spatiotemporal evolution of functional hemodynamic changes and their relationship to neuronal activity. J. Cereb. Blood Flow Metab. 25, 830–841.
Shibuki, K., Hishida, R., Murakami, H., Kudoh, M., Kawaguchi, T., Watanabe, M., Watanabe, S., Kouuchi, T., and Tanaka, R. (2003). Dynamic imaging of somatosensory cortical activity in the rat visualized by flavoprotein autofluorescence. J. Physiol. (Lond.) 549, 919–927.
Shtoyerman, E., Arieli, A., Slovin, H., Vanzetta, I., and Grinvald, A. (2000). Long-term optical imaging and spectroscopy reveal mechanisms underlying the intrinsic signal and stability of cortical maps in V1 of behaving monkeys. J. Neurosci. 20, 8111–8121.
Sirotin, Y. B., and Das, A. (2009). Anticipatory haemodynamic signals in sensory cortex not predicted by local neuronal activity. Nature 457, 475–479.
Sirotin, Y. B., Hillman, E. M., Bordier, C., and Das, A. (2009). Spatiotemporal precision and hemodynamic mechanism of optical point spreads in alert primates. Proc. Natl. Acad. Sci. USA 106, 18390–18395.
Tohmi, M., Kitaura, H., Komagata, S., Kudoh, M., and Shibuki, K. (2006). Enduring critical period plasticity visualized by transcranial flavoprotein imaging in mouse primary visual cortex. J. Neurosci. 26, 11775–11785.
Turner, D. A., Foster, K. A., Galeffi, F., and Somjen, G. G. (2007). Differences in O2 availability resolve the apparent discrepancies in metabolic intrinsic optical signals in vivo and in vitro. Trends Neurosci. 30, 390–398.
Vanzetta, I., and Grinvald, A. (2008). Coupling between neuronal activity and microcirculation: implications for functional brain imaging. HFSP J. 2, 79–98.
Vanzetta, I., Slovin, H., Omer, D. B., and Grinvald, A. (2004). Columnar resolution of blood volume and oximetry functional maps in the behaving monkey; implications for FMRI. Neuron 42, 843–854.
Keywords: flavoprotein, visual cortex, monkeys, imaging, fluorescence, hemodynamics
Citation: Sirotin YB and Das A (2010) Spatial relationship between flavoprotein fluorescence and the hemodynamic response in the primary visual cortex of alert macaque monkeys. Front. Neuroenerg. 2:6. doi: 10.3389/fnene.2010.00006
Received:04 March 2010;
Paper pending published: 04 April 2010;
Accepted: 10 May 2010;
Published online: 03 June 2010
Edited by:
Anna Devor, University of California San Diego, USAReviewed by:
Anna W. Roe, Vanderbilt University, USATimothy J. Ebner, University of Minnesota, USA
Copyright: © 2010 Sirotin and Das. This is an open-access article subject to an exclusive license agreement between the authors and the Frontiers Research Foundation, which permits unrestricted use, distribution, and reproduction in any medium, provided the original authors and source are credited.
*Correspondence: Yevgeniy Sirotin, Department of Neuroscience, Columbia University, 1051 Riverside Drive, New York, NY, 10027, USA. e-mail:eWJzMjEwMUBjb2x1bWJpYS5lZHU=