Energetics based spike generation of a single neuron: simulation results and analysis
- 1 WAran Research FoundaTion, Chennai, India
- 2 Charaka Group – Computational Neuroscience, WAran Research FoundaTion, Chennai, India
Existing current based models that capture spike activity, though useful in studying information processing capabilities of neurons, fail to throw light on their internal functioning. It is imperative to develop a model that captures the spike train of a neuron as a function of its intracellular parameters for non-invasive diagnosis of diseased neurons. This is the first ever article to present such an integrated model that quantifies the inter-dependency between spike activity and intracellular energetics. The generated spike trains from our integrated model will throw greater light on the intracellular energetics than existing current models. Now, an abnormality in the spike of a diseased neuron can be linked and hence effectively analyzed at the energetics level. The spectral analysis of the generated spike trains in a time–frequency domain will help identify abnormalities in the internals of a neuron. As a case study, the parameters of our model are tuned for Alzheimer’s disease and its resultant spike trains are studied and presented. This massive initiative ultimately aims to encompass the entire molecular signaling pathways of the neuronal bioenergetics linking it to the voltage spike initiation and propagation; due to the lack of experimental data quantifying the inter dependencies among the parameters, the model at this stage adopts a particular level of functionality and is shown as an approach to study and perform disease modeling at the spike train and the mitochondrial bioenergetics level.
Introduction
Over the past decades, neuroscience research has witnessed myriad deterministic (Hodgkin and Huxley, 1952; Fitzhugh, 1955; Oja, 1982; Buchholtz et al., 1992), stochastic (Fienberg, 1974; Harrison et al., 2005), electrical (Rall, 1957, 1959, 1960) models, which have delved into the functional aspects of spatio-temporal characteristics of a network of ion channels (Babinec and Babincov, 2002), dendritic arborization (van Pelt et al., 2001), the dynamics of a single synapse (Reutimann, 1999; Attwell and Gibb, 2005), and calcium wave oscillations (Volman et al., 2007) in response to neurotransmitter release. These models abstract the characteristics of either a specific function of a single neuron or deal with the fundamental characteristics of the neuron on a dynamic scale which is furnished in the concomitant voltage spike response.
On the other hand, with the advent of advanced experimentation techniques, metabolic pathways which co-exist within the cell characterizing the intracellular energetics of the cell organelles, have been identified and studied extensively (Duchen, 2000; Green and Green, 2005; Shulman and Rothman, 2005). This research into the deeper aspects of intracellular interactions has paved the way for elaborate models which describe the chemical kinetics of the intracellular reactions of the mitochondria (Krebs cycle, electron transport chain, B-Oxidation) and other organelles (Baker et al., 2002; Mogilevskaya et al., 2006), through deterministic differential equations, predominantly the Michaelis–Menten kinetics (Beard and Qian, 2008).
However, a common feature of these models has been the lack of improvisation to connect and establish the missing link between the spike generation of the neuron to its underlying biophysical and the biochemical processes in its intracellular compartments. An unmistakable gap exists between the spike generation activities and energetics of a single neuron. Alzheimer’s, Huntington’s, Parkinson’s, and other degenerative terminal brain diseases are characterized by a cascade of affirmative changes at the energetics level of the cell (Hirai et al., 2001; Zeviani and Di Donato, 2004; Mattson et al., 2008) which is expressed in the voltage spike activity of the neuron. This research work presented here is an attempt at bridging that lacuna, probing into the unknown, and establishing the connect between electrical, biophysical, and biochemical pathways of a single neuron thus providing a better and a comprehensive working platform toward disease modeling and drug testing.
The pivotal role of the mitochondria during the degenerate mode of a single neuron in times of Alzheimer’s cannot be ignored (Hirai et al., 2001; Zeviani and Di Donato, 2004; Mattson et al., 2008). It thus becomes indispensable that the dynamics of the mitochondrial behavior needs to be captured through a mathematical model and linked to the spike generation of the neuron. The resulting time–frequency analysis of the voltage spike presented in the following section reflect the fine changes in the mitochondrial energetics leading to a better understanding and comprehension of the disease and its intracellular potency.
The model, with respect to energetics is restricted to the mitochondria and does not deal with the entire set of parameters involved in the Alzheimer’s disease but still gives a fair understanding (Hardy and Selkoe, 2002). Limitations and further extensions have been discussed in the final section.
A major limiting factor during the simulation phase of the model has been the non-availability of realistic values for certain intracellular parameters for specific types of neurons. In fact, this model makes use of a few intracellular parameters obtained from the mitochondria belonging to hepatocytes (Mogilevskaya et al., 2006). A generic, ubiquitous model has thus been proposed which can be fine-tuned to work for a particular type of neuron depending upon the level of experimentation available.
The concept that, the dynamics of the mitochondrial energetics is captured in the voltage spike of the neuron adds a powerful dimension to disease modeling. The non-invasive technique is strengthened by the fact that intracellular pathways can be analyzed comprehensively through the spike response of the neuron. It narrows down the field of experimentation and calls for establishing greater synergy between computational and clinical neuroscientists – working toward disease modeling and drug discovery, and ultimately yielding better results.
The integrated voltage spike – energetics model along with the mathematical concepts and simulation framework has been presented at the International Neuroinformatics Conference, 2010 at Kobe, Japan (Mohan et al., 2010a,b). However, this is the first time that the simulation results of the integrated model are presented, discussed, and analyzed.
Results
The simulated voltage spike (Figure 1A) was analyzed under varying concentrations and frequencies of neurotransmitter input and intracellular parameters corresponding to a pyramidal neuron. Alternate methods (discussed further) were adopted to determine values of a few intracellular parameters which were unavailable. Preliminary Disease Modeling was performed by identifying the parameters that are responsible for Alzheimer’s (Figures 2, 3, 4, and 5B). These parameters and associated constants 38 were then altered to match the abnormalities found in a diseased neuron. The simulation was then repeated to get the spike train of the diseased neuron. The variations of all parameters were tracked using the simulator. The rate and quantity of injected neurotransmitters to the neuron was spread over four bands, i.e., constant rate and quantity, varying quantity, varying rate, and null input conditions. The Krebs Cycle Activity is represented as the micromoles of pyruvate used per timestamp. ATP concentration represents the total intracellular ATP concentration in micromoles.
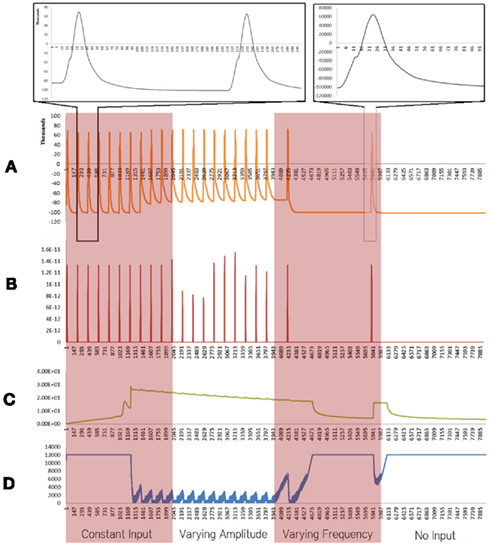
Figure 1. Simulation results using the energetics based single neuron simulator, for a pyramidal neuron over four stages of input under healthy conditions. (A) Difference in ionic concentration across the membrane (voltage spike; μM) vs timestamp. (B) Input neurotransmitters to the neuron (μM) vs timestamp corresponding to various input bands. (C) Krebs cycle activity (pyruvate consumed in μM per timestamp) vs timestamp. (D) Total intracellular ATP concentration (μM) vs timestamp.
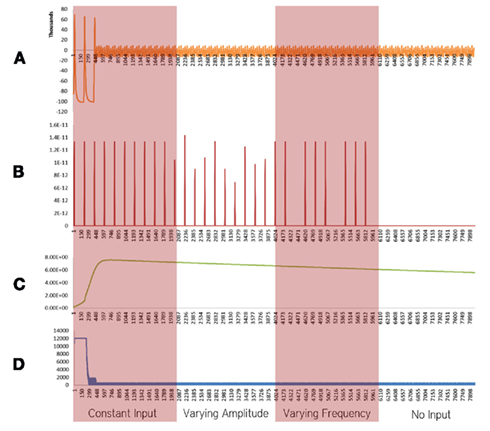
Figure 2. Simulation results using the energetics based single neuron simulator, for a pyramidal neuron over four stages of input affected by Alzheimer’s disease. (A) Ionic concentration across the membrane (Voltage Spike; μM) vs timestamp. (B) Input neurotransmitters to the neuron (μM) vs Timestamp corresponding to various input bands. (C) Krebs cycle activity (NADH produced in μM/timestamp) vs timestamp. (D) Total intracellular ATP concentration (μM) vs timestamp.
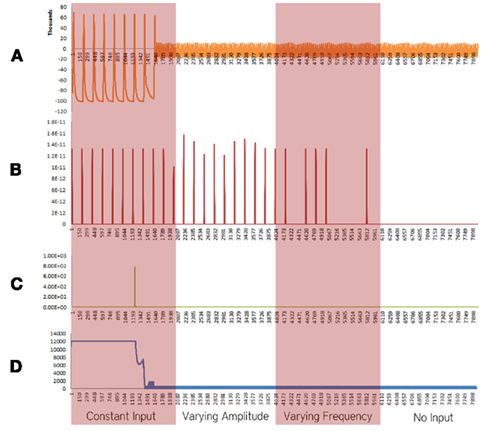
Figure 3. Simulation results using the energetics based single neuron simulator, for a pyramidal neuron over four stages of input affected by a decrease in the rate of the electron transport chain. (A) Ionic concentration across the membrane (voltage spike; μM) vs timestamp. (B) Input neurotransmitters to the neuron (μM) vs timestamp corresponding to various input bands. (C) Krebs cycle activity (NADH produced in μM/timestamp) vs timestamp. (D) Total intracellular ATP concentration (μM) vs timestamp.
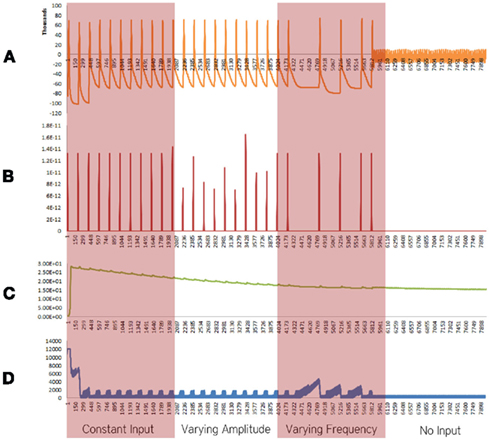
Figure 4. Simulation results using the energetics based single neuron simulator, for a pyramidal neuron over four stages of input affected by an increased formation of oxide ions. (A) Ionic concentration across the membrane (voltage spike; μM) vs timestamp. (B) Input neurotransmitters to the neuron (μM) vs timestamp corresponding to various input bands. (C) Krebs cycle activity (NADH produced in μM/timestamp) vs timestamp. (D) Total intracellular ATP concentration (μM) vs timestamp.
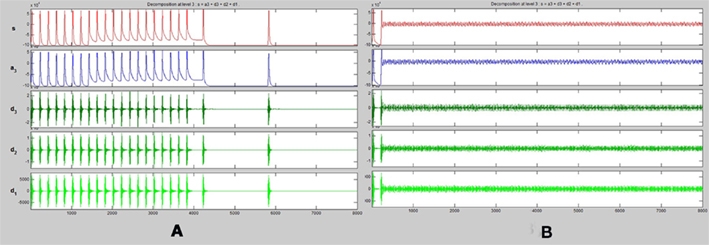
Figure 5. One dimensional wavelet transform (up to three frequency levels) of spike trains obtained from (A) energetics based simulation of a healthy pyramidal neuron. (B) Energetics based simulation of a pyramidal neuron affected by Alzheimer’s disease.
Healthy Neuron
For a constant neurotransmitter input to the simulator (Figure 1, Constant Input Band), it was found that the voltage spike had a constant frequency and small variation in amplitude (Figure 1A). The Krebs Cycle Activity (Figure 1C) increased with deviation of ionic concentration of Na+ and K+ from equilibrium state; a gradual decrease in Krebs cycle activity is observed thereafter. Further, activation of the Krebs cycle correlated with a decrease in the ATP concentration (Figure 1D). When the amplitude of neurotransmitter input was varied (Figure 1, Varying Amplitude Band), all the above phenomena were observed, with a constant amplitude of the spike train, which resulted in similar graphs for Krebs Cycle Activity (Figure 1C) and ATP concentration (Figure 1D). A fixed concentration of neurotransmitter input with varied frequency (Figure 1, Varying Frequency Band) caused a variation in the frequency of spikes (Figure 1A) and similar variations in the frequency of Krebs Cycle Activity (Figure 1C). Also, when the frequency of neurotransmitter input decreases, Krebs cycle activity is observed to decrease, correlating with increased ATP concentration. Finally, when the neurotransmitter input was removed (Figure 1, No Input Band); the ionic concentration was restored to its equilibrium and ATP concentration became constant.
Alzheimer’s Affected Neuron
Neurons affected by Alzheimer’s disease were modeled as a combination of two important factors, decreased activity of the Electron Transport Chain (Mattson et al., 2008) and an increased formation of Oxide ions (O2−; Mattson et al., 2008). These factors and their implications are discussed in the Section “Discussion.” In our simulations of a defective neuron (Figure 2), it was found that the Krebs Cycle Activity (Figure 2C) increased. However, a corresponding drop in ATP concentration (Figure 2D) was observed. Spiking activity was prevalent for the initial 200 time stamps, followed by a breakdown of ionic concentration gradients (Figures 2A–D). These results are discussed in the Section “Discussion.”
Decreased Activity of Electron Transport Chain
When the decrease in the activity of the Electron Transport Chain was considered in isolation, excluding the effect of increased rate of formation of Oxide ions (O2−), breakdown of ionic concentration gradient was observed, however, it took a longer time when compared with the results obtained from the Alzheimer’s neuron affected by the combination of both the parameters – decreased activity of ETC and increased superoxide production (Figure 3).
Increased Rate of Formation of Oxide Ions
When the increase in rate the formation of superoxide anion radicals was considered in isolation, excluding the effect of decrease in the activity of ETC, breakdown of ionic concentration gradient was observed, however, it took a longer time when compared with the results obtained from the Alzheimer’s neuron affected by the combination of both the parameters – decreased activity of ETC and increased superoxide production and shorter time than results obtained from the decreased activity of ETC (Figure 4).
Wavelet Analysis
The Fourier transform has been traditionally used for various signal analysis, but it only gives the frequency–amplitude relationship of the given signal. It throws no light on the time–frequency variations present in the signal.
This Achilles’ heel is overcome with the use of Wavelet transforms (Tsodyks et al., 2000; Sklar, 2001), by using a varying scale window function, we are able to obtain a time–frequency analysis of the signal. Here the high frequency components are analyzed with a high time resolution and a low frequency resolution while the low frequency components are analyzed with a low time resolution and high frequency resolution.
A one dimensional wavelet transform resolved to three frequency levels is applied to the spike train of both the healthy and diseased simulated neurons. We compare the results of this transformation (Figures 5A,B)
It can be observed that across all input conditions, the wavelet transformation of the diseased neuron (Figure 5B) indicates a complete lack of activity as compared to that of the healthy neuron (Figure 5A). The reasons and implications of this observation are discussed in detail in Section “Discussion.”
Materials and Methods
A Petri-net based environment was adopted to model the various biophysical processes using applied stochastic differential equations. The places represent the concentration of reactants and products, while the transitions capture the kinetics of the biophysical and biochemical reactions. A single neuron Petri-net model realizes biological concepts such as the Krebs Cycle Activity, Electron Transport Chain, and Oxidative Phosphorylation, etc.
We shall now go on to describe the various biochemical pathways considered in the model. We leave out housekeeping activities of the neuron since these processes are highly dependent on the DNA and DNA transcription rates. As we do not have a model for this at the present, we shall be implementing these models in the future.
ATP Consuming Pathways
Restoration of ionic gradients in the post-synapse
When neurotransmitters from the cleft dock on AMPA receptors present on the post-synapse, the receptors open up and allow Na+ ions to move in. As the voltage increases (caused by this increased Na+ gradient), the Mg2+ ions which block NMDA channels get released leading to increased calcium ions influx.
CaMKII present in the synapse is activated by the calcium ions. CaMKII, when activated increase the number of AMPA receptors and also increase their open time by phosphorylating them. This helps bring about Long-Term Potentiation.
When the synapse is activated for a continuous period of time, the G-Proteins are also activated. The G-Protein upon activation activates both the IP3 and the DAG. Activated IP3 leads to the release of calcium stored in the endoplasmic reticulum. DAG activates PKC, which then attaches itself to the AMPA receptors and decreases the number of AMPA receptors by internalizing them. This helps bring about Long-Term Depression (Hayashi et al., 2000; Attwell and Laughlin, 2001; Linden, 2001; Yu et al., 2001; Weber et al., 2003; Steinberg et al., 2004; Remy and Spruston, 2007).
Due to the influx of sodium and calcium ions, the gradient has been lost and must be restored. This is an energy consuming process. These activities of the synapse have been modeled by us. The mathematical model formed to represent these pathways will be detailed later in this section.
Restoration of ionic gradients in the soma
This inflow of sodium and calcium ions will lead to a Voltage Spike if the voltage generated exceeds a threshold level. This threshold will lead to the opening up of the voltage gated sodium and potassium ion channels which cause spike propagation (Kandel et al., 1991). Restoration of these ionic gradients in the soma is also an ATP consuming process.
Packaging of neurotransmitters inside vesicles by golgi apparatus and pumping the vesicles with H+ ions
The packaging of the neurotransmitters inside vesicles by Golgi apparatus is an energy consuming process. The vesicles have to be pumped with H+ ions in order to create a gradient so that the neurotransmitters in the pre-synaptic site leave the neuron with a particular force. This enables them to make it across the synaptic cleft and hence dock onto the receptors on the post-synaptic neuron (Südhof, 2004).
Absorption of neurotransmitters from the synaptic cleft by the glial cells
The neurotransmitters are active at the post-synaptic site only for a short interval. After this the neurotransmitters are absorbed by the glial cells. The glial cell absorbs them based on the sodium concentration difference present between the extracellular and intracellular part of the glial cell. The greater concentration of sodium outside the glial cell pushes the neurotransmitters into the glial cells where they are recycled and sent back to the neuron. In order to restore the sodium gradient ATP is required.
Over the years there has been a drastic change in the view of what role glial cells play in the central nervous system. Once thought of as just passive members of the CNS providing a supporting framework to a network of neurons, new evidence suggests that the glial cells are involved in higher level activities such as plasticity regulation of synapses and recycling of the neurotransmitter glutamate released by the synapse. This glutamate absorbed by the glial cells gets converted to glutamite. This glutamite is released back to the neuron, which is then reconverted to glutamate. Thus glial cells have been known to be suppliers of neurotransmitter glutamate to the neuron. As scientific estimates show that glial cells account for only maximum 20% of total neuronal glutamate, we decided to exclude the recycling of neurotransmitters from the pilot simulation. Thus the glial cells play a minimal role in our model. Their only main function is to absorb the glutamate released into the cleft. The recycling process has not yet been modeled. However even though it accounts for only a maximum of 20% of neurotransmitters the neuron–glial interactions cannot be ignored and will be incorporated along with their role in plasticity regulation and calcium waves (Tsodyks et al., 2000; Schulman and Rothman, 2004; Sherwood et al., 2006; Volman et al., 2007; Cloutier et al., 2009).
Mitochondrial Respiration Pathways
Calcium exchange between endoplasmic reticulum and mitochondria
When the IP3 molecules dock on the endoplasmic reticulum (ER) due to repeated synaptic activity, the calcium reserves of the ER are released, which is then absorbed by the mitochondria. Absorption of calcium by the mitochondria increases its rate of respiration by depolarization of the mitochondrial membrane. This is one way in which the mitochondria are able to sense the increase in activity of the neuron (Yu et al., 2001; Weber et al., 2003; Steinberg et al., 2004; Remy and Spruston, 2007).
Adenosine mono-phosphate activated protein kinase enzyme
The AMPK is known as the master switch or the master regulator. AMPK has been identified as a key metabolic regulator in the neuron. It senses the difference between the ATP and AMP concentration levels. The AMPK has two binding sites. When the ATP concentration is very high (i.e., the cell is inactive) both the binding sites are occupied by ATP which renders the AMPK inactive. However during periods of high frequency neuronal firing/activity, the ADP formed does not recycle back to ATP quick enough. In this case, ADP molecules begin reacting with each other. Two ADP molecules combine together, leading to the formation of one molecule each of AMP and ATP. This process is favored only under high stress. This is because it is almost impossible to recycle the AMP back to ATP. However, this process is faster than the normal Krebs cycle.

Thus as the AMP concentration increases, the AMPK gets activated as both the docking sites are now occupied by AMP. Upon activation, the AMPK simultaneously increase the rate of Beta Oxidation and increases the number of glucose transporters available. The Beta Oxidation of the fatty acids increases the hydrogen ion gradient. Beta oxidation is not a major process in the brain but it does exist. And we believe if we are going to model the energetics of the single neuron it is a good idea to include these processes even if it has a negligible effect as long as they exist, and we can get data about them. To take this into consideration the Beta oxidation process in our simulations was not anyway a major producer of ATP and compared to the actual Krebs cycle it was much smaller. Moreover due to the increase in the glucose transporters more glucose is transported to the neuron, thus it can produce more ATP (Hayashi et al., 2000; Zong et al., 2002; Jäger et al., 2007).
Uncoupling protein
The UCP is a mitochondrial transport protein present in the inner membrane of the mitochondria (Rousset et al., 2004). It is activated by high superoxide concentration. Superoxides are formed by complexes I and III in the respiratory chain through a non-enzymatic process. These superoxides are highly reactive and can lead to cell death (Turrens, 1997). To prevent the toxic effects of the superoxide anion radical ion, Manganese Superoxide dismutase catalyze the dismutation of superoxides into oxygen and hydrogen peroxide. The hydrogen peroxide, formed as a result of the redox reaction is further reduced to water by glutathione peroxidase. As the Krebs cycle rate increases, so does the superoxide formation. At some point the rate of superoxide formation increases beyond the rate at which MnSOD and glutathione peroxidase can detoxify them to water. This is when the UCP comes into play. It is activated by the Superoxides and opens up. H+ ions will now flow through the opening created by the UCP (Echtay et al., 2002). This leads to the short-circuiting of the ATPase enzyme. Activation of the UCP and its functioning as a proton carrier results in a thermogenic process where the oxidation energy is dissipated as heat, enhancing, and stimulating respiration (Turrens, 1997; Rousset et al., 2004).
Petri Nets Based Modeling
We shall now view the mathematical Petri nets based model that is used to represent these various biochemical pathways. Figures 6, 8, and 9 represent the Petri net system divided into various sections. As explained earlier, the places represent parameter concentrations, activation levels, and rate depending on the context. The transitions represent the various equations used to model the relations. To maintain the brevity of this paper, the transition equations and Initial Ionic Concentrations are not mentioned here. However, the equations and Initial state conditions (concentrations) used may be viewed online at http://www.warftindia.org/equations.pdf.
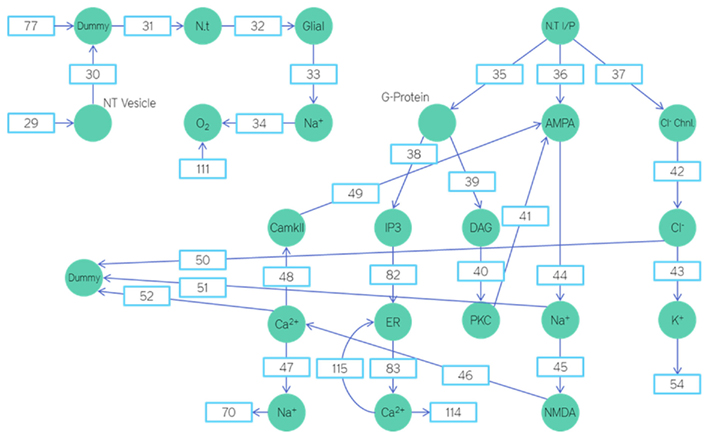
Figure 6. Petri nets based energetics model depicting the post-synapse and glial cells.
Synaptic cleft and post-synaptic dynamics
The input to the neuron is through the place titled neurotransmitter input. Neurons have excitatory synapses in their apical dendrites and inhibitory synapses on their basal dendrites. For a given neurotransmitter input the ratio of excitatory synapses activated to inhibitory synapses activated is 7:2. A 10th of the neurotransmitter input is used to activate the G-Proteins (Figure 6).
The AMPA receptors upon activation give rise to an influx of Na+ ions. This influx was modeled using a transition probability matrix. In Figure 7, the matrix on the left is the transition probability matrix and the one in the middle is the conditional probability matrix. The matrix to the extreme right is the dwell time matrix.
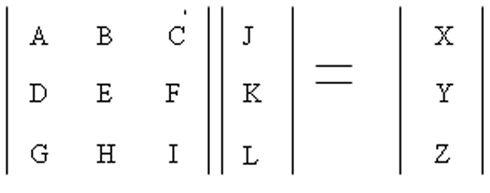
Figure 7. Transition probability matrix.
The elements in the first row of this matrix represent the probability of making a transition from a given state (This is determined by the element number. For example the letter C represents the third state of conduction) of ion channel conduction to the first state namely the closed state.
The elements of the second and third row represent the same thing except it is for their respective states namely the half open (second state) and the fully open (third state).
The matrix in the middle has elements which represent the conditional probability. Its values represent the probability of being in that particular state. Thus the product of these two matrices gives rise to the dwell matrix. It represents the probability of finding the ion channel in a given conducting state in the next instant of time. Multiplication of each state probability with its conductance gives rise to total conductance of the channel in the next instance of time (Keizer, 2002; Beard and Qian, 2008). Similarly, the AMPA and Chlorine channels were modeled this way.
The G-protein upon release diffuses into the cell fluid and docks on the IP3 and DAG proteins activating them. IP3 upon activation sits on the endoplasmic reticulum and releases the internal calcium reserves. The released calcium ions activate the CaMKII. The CaMKII then phosphorylate the AMPA receptors, increasing the time they spend in the open state and their numbers.
Similarly the DAG upon activation diffuses into the cell fluid and docks on the PKC activating it. Upon activation the PKC attaches itself to the AMPA receptors and internalizes them.
Each of these transitions has been modeled such that the new product formed is equal to the amount of substrate released.
The chlorine ions that enter the neuron from the synaptic cleft are transported out with the help of the potassium gradient. This fall in potassium gradient is then restored by the ATPase pump. Similarly the Sodium–Calcium exchanger pushes the calcium out and the sodium in. This sodium is then pushed back out using the ATPase pump. The restoration of the Sodium–Potassium gradient consumes ATP. The equation to govern this ATP consumption will be explained subsequently.
In our model the plasticity effects on the AMPA receptors are brought about by the CaMKII. As the calcium concentration inside the cell increases so does the number of activated CaMKII.
Based on the amount of activated CaMKII the time in each element of the array for the AMPA channels was changed. As the CaMKII concentration increased the time spent in the open state of the AMPA channel was increased and that in the closed state was correspondingly decreased.
Similarly based on the amount of activated PKC the time in each element of the array for the AMPA channels was changed. As the PKC concentration increased the time spent in the open state of the AMPA channel was decreased and that in the closed state was correspondingly increased.
This was how we brought in the plasticity variation of synapses.
The equation used is like an AND function. Only if there are three or more sodium ions and two or more potassium ions, will the equation return true. And whenever it does, an ATP is consumed and three sodium ions are transported outside and two potassium ions are transported inside. The time dependency of this process has not yet been studied by us. Hence we have assumed it to be a time independent or instantaneous process. However it will be improved in the future.
The endoplasmic reticulum releases calcium. The endoplasmic reticulum is where the ribosomes are attached. The ribosomes are the organelles where the various proteins in the body are manufactured. The ribosomes attach themselves to the rough endoplasmic reticulum. The endoplasmic reticulum consists of two parts, the rough endoplasmic reticulum and the smooth endoplasmic reticulum. The smooth endoplasmic reticulum is a store house of calcium ions.
The endoplasmic reticulum is known to play a role in the regulation of synaptic plasticity. When the IP3 protein is activated it will sit on the receptors on the surface of the smooth endoplasmic reticulum. When this happens the channels connected to the receptors open up and calcium ions are released. These calcium ions are crucial in the strengthening of synapses.
The endoplasmic reticulum also plays an important role in increasing the Krebs cycle rate in response to activity. Under physical duress when the ATP demand is high, the mitochondrial respiration should be increased. One of the ways to increase mitochondrial respiration rate is through the endoplasmic reticulum. When the endoplasmic reticulum releases calcium it is absorbed by the mitochondria. The calcium absorbed by the mitochondria depolarizes its membrane, leading to increased ETC activity (Jouaville et al., 1999; Arnaudeau et al., 2001; Parekh, 2003).
The mitochondria and endoplasmic reticulum interact through calcium ion exchange. The calcium released by the endoplasmic reticulum is absorbed by the mitochondria. This calcium is then again released by the mitochondria. This will then be re-absorbed by the endoplasmic reticulum. In this fashion gradually reducing calcium waves are set up between the two organelles.
The NMDA receptors are blocked by magnesium ions. They can start conduction only if this magnesium block is relieved by heavy sodium influx.
Mitochondrial regulation
The ATP is consumed when the ATPase pumps try to restore the ionic gradients. They are also consumed while pumping the neurotransmitter vesicles with hydrogen ions, in order to package the neurotransmitters. This is why there is a transition from the Golgi apparatus to the ATP (Shulman and Rothman, 2005). Simultaneously the number of ADP produced is also increased (Figure 8).
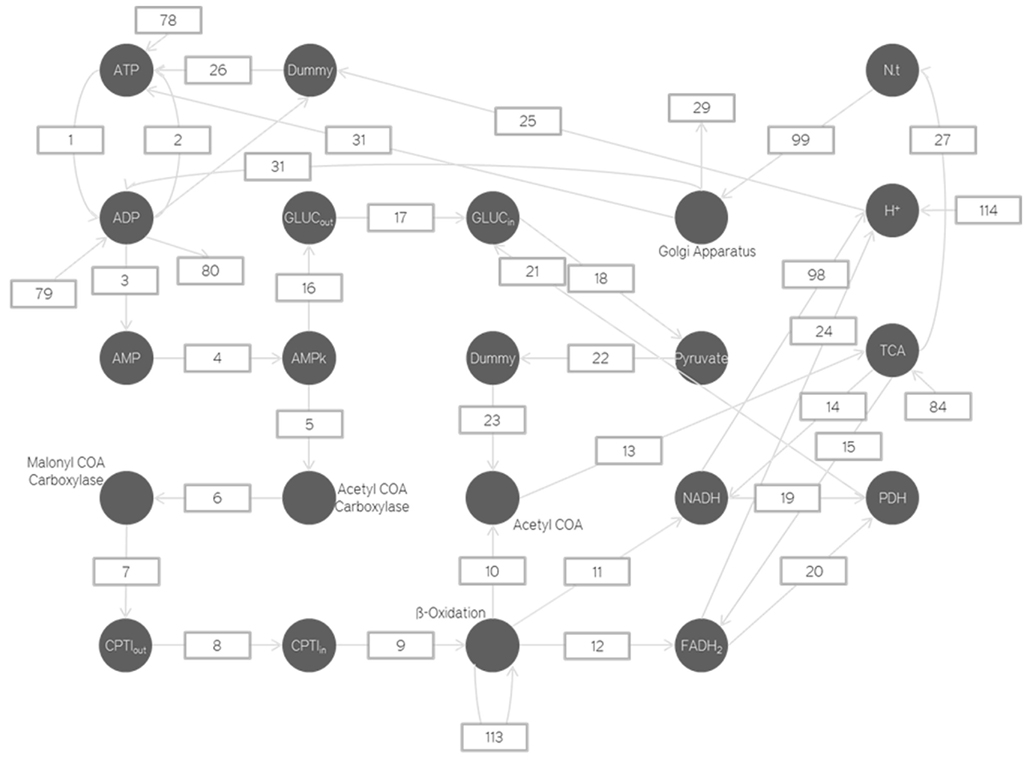
Figure 8. Petri nets based energetics model depicting the mitochondria.
Thus the only change here is that as the Golgi activation increases so does the number of ADP.
The number of Golgi apparatus activated depends on the number of neurotransmitters produced by the Krebs cycle at a particular instant. It represents how the Golgi apparatus activity changes per neurotransmitter packaged. For the time being due to a lack of experimental evidence we are assuming such processes to be linear time variant. As we garner more information through experiments our models will also improve to incorporate this new information.
The neurotransmitters are produced from the alpha-ketoglutarate in the Krebs cycle. This is a chemical reaction and the proportionality constant is calculated from the Gibbs free energy value.
The ATP is produced by the ATPase enzyme using the ADP and the H+ ions. Only if the H+ ions have a high enough concentration can enough energy be provided to the ATPase enzyme to produce the required ATP. Thus as the H+ and Ca2+gradient increases the amount of ATP produced also increases.
Consider the equation,

The Gibbs free energy for ADP + ADP is calculated and using this, the rate reaction constant is obtained. The amount of ATP produced will be equal to amount of AMP produced. This AMP is used to activate the AMPK (metabolic switch). This process is also modeled using a linear differential equation. This AMPK activation leads to the phosphorylation and hence inhibition of acetyl CoA carboxylase.
The inhibition of acetyl CoA carboxylase leads to the inhibition of malanoyl CoA carboxylase production. Inhibition of malanoyl CoA carboxylase leads to an increase in the number of CPTI enzymes which move across the mitochondrial membrane and increase the transport of fatty acids into the mitochondria. These fatty acids are then broken down by Beta Oxidation to increase the number of NADH and FADH2.
The above modeled reactions are all part of the Beta Oxidation process and will be modeled in greater depth in the future. As of now a more simplistic approach has been adopted due to the lack of knowledge on the precise dynamics and all the contributing factors (Jäger et al., 2007).
Adenosine mono-phosphate activated protein kinase also increases the number of glutamate transporters and hence increases the amount of glucose transported into the neuron.
The increase in the amount of glucose transporter production will definitely involve an increase in the transcription rate of the DNA. As our nucleus model is still in the development phase there is no way of incorporating the chemical pathway which eventually increases the rate of glucose transporter transcription. Moreover the chemical pathway linking the increased AMPK activation to the increase in transcription of glucose transporter is not yet known. That is why we have a simplified equation to govern the increase in glucose transporters.
This motion of glucose transporters and CPTI enzymes across the membrane is done using the Michaelis–Menten kinetics (Beard and Qian, 2008).
The increase in glucose leads to an increase in pyruvate. This is modeled using the Gibbs free energy of pyruvate production. The increase in pyruvate leads to an increase in Acetyl CoA. This is also modeled using Gibbs free energy.
This is based on the fact that longer the molecule, lower the stability, and hence faster the cleaving of two carbon atoms. But as the length of the fatty acid decreases the rate at which it is broken down also decreases. The FADH2, NADH, and acetyl CoA produced depend directly on the amount of fatty acid produced.
The Krebs cycle rate increases with the amount of Acetyl CoA produced. This increase is modeled using the Gibbs free energy for acetyl CoA to citrate. The rate of formation of the NADH and FADH2 is modeled using the Gibbs free energy obtained from the transition malate to oxaloacetate. This is the transition responsible for the rate of H+ ions released. So based on the rate of this reaction we determine the rate of formation of NADH and FADH2. The H+ ions formation from FADH2 and NADH is also modeled using the Gibbs free energy for releasing the H+ ions. The NADH and FADH2 inversely affect the amount of PDH. They are PDH inhibitors.
The currents generated due to the sodium, calcium, and chlorine influx in the pre-synaptic sites are added up and the net voltage generated due to them is calculated. This voltage generated is then passed to the voltage gated sodium, potassium, and chlorine channels. The number of ion channels activated will depend on the magnitude of the voltage due to the synaptic currents. It is assumed to be linearly dependent. The influx of ions is used to calculate the Voltage Spike. The equation used to govern this process is the Langevin equation inspired transporter equation (Schuss et al., 2001; Keizer, 2002; Beard and Qian, 2008). The Voltage Spike is used to calculate the number of calcium channels that are open. The calculation of Voltage Spike has been discussed earlier. The number of calcium channels is used to determine the number of calcium ions based on the conductance of each ion channel. This process is also implemented by the Langevin inspired transporter equation (Schuss et al., 2001; Keizer, 2002; Beard and Qian, 2008). The number of neurotransmitters released depends on the amount of activated SNARE proteins which in turn depends on the amount of calcium ions.
Spike activity and pre-synaptic dynamics
Similarly the amount the number of ROS generated is considered directly proportional to the amount of H+ ions generated. Where we could not scientifically determine a rate constant a value of 0.1 was chosen. A part of these oxygen ions is detoxified by the mitochondrial MnSOD and converted to less reactive water. But a part of these oxygen ions are also used to activate the UCP (Figure 9).
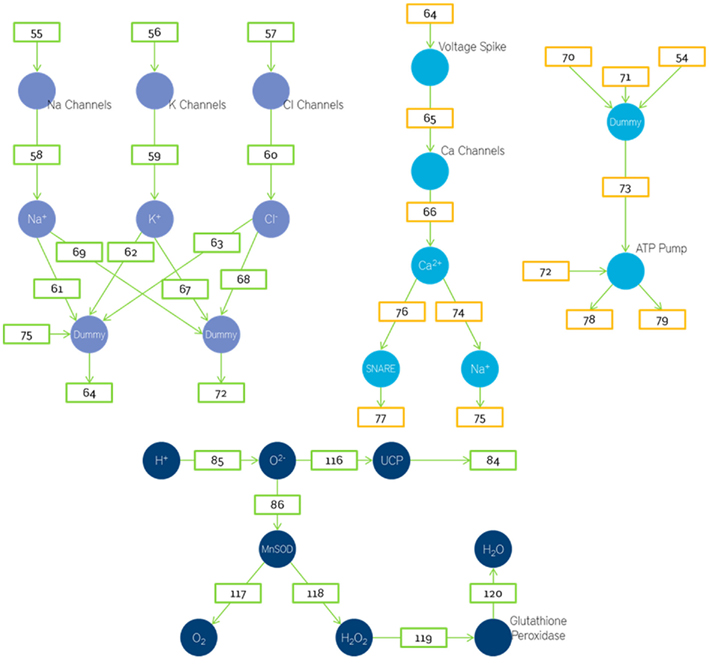
Figure 9. Petri nets based energetics model depicting the pre synapse and spike generation.
The number of output neurotransmitters will depend on the amount of activated SNARE and the number of vesicles. Assuming there is approximately 1 SNARE protein per vesicle the number of output neurotransmitters will be determined by whichever of the two (vesicles or SNARE) is smaller.
The number of activated glial cells will vary linearly with number of neurotransmitters in cleft. This is then assumed to cause a linear decrease in number of sodium ions. As this leads to a loss in the gradient the amount of oxygen required is also increased. Thus the oxygen required depends on both the acetyl CoA and sodium ions used up. In this model we have used a place called dummy. Dummy is used when the number of fan-ins is more than the number of fan-outs. In such cases we store the fan-ins in dummy and then execute the function. This is done to maintain the property that edges are alone transitions.
We are aware that there are more biochemical pathways that regulate mitochondrial respiration. However we have at present only considered the pathways mentioned above. In the future, we will be expanding our model to include the nucleus, transcription rates of proteins, housekeeping activities, and in-depth models of the Endoplasmic Reticulum, Peroxisome, and Golgi apparatus.
The modeling of the various biochemical reactions in the model was done based on the Gibbs free energies of the respective reactions. The rate constants for these biochemical reactions were calculated from the Gibbs free energy values.
However while modeling the biophysical processes several difficulties were faced when trying to determine the values for the various constants, used in the equations.
This problem was particularly pronounced when voltage gated ion channels, the contribution of calcium to the increase in electron transport chain, uncoupling protein activation, DAG activation, PKC activation, and CaMKII activation were being modeled. The problem stemmed from the lack of experimental data that quantified how sensitive one parameter was to another.
To be more precise, we could not find data that indicated how many ion channels per unit area are activated for a 1-mV increase in the voltage difference across the membrane or at the least if this dependency was non-linear or linear by nature. Similarly the contribution of calcium to the increase in the rate of electron transport chain was also unknown. Likewise for the synaptic parameters (Südhof, 2004) listed above.
In such cases a method of repeated simulations and analysis was adopted to obtain a realistic voltage spike. Repeated simulations were carried out to compare the output of the model to the experimental values and to get the appropriate rate constants in our simulator. We are also working on modeling the inter relation of heat with chemical reactions as we believe this would be a key to study thermogenic processes. Presently we are modeling the rate constants as a function of temperature and pH and will be incorporating it into the energetics model in the near future.
Discussion
The graphs indicate, the activity of the Krebs cycle directed toward spike generation, without taking into consideration housekeeping activities. The results obtained from the simulation indicate a healthy correlation between the Krebs Cycle Activity and the spiking activity of the neuron. Further, a significant correlation between the Krebs Cycle Activity and intracellular ATP concentration was observed. ATP is consumed quickly during the voltage spike, and rises immediately after the Krebs Cycle Activity increases. When the neurotransmitter input was removed, the ATP gradually restores itself to its equilibrium condition.
Our preliminary effort toward disease modeling considers Alzheimer’s disease as a combination of two factors, decrease in the activity of the Electron Transport Chain (Mattson et al., 2008) and an increased formation of Oxide ions (Mattson et al., 2008) Other parameters such as a large increase in intracellular and mitochondrial calcium have been identified (Mattson et al., 2008). However; the model in its current state cannot accommodate the variations of these parameters. Thus, further work at WARFT, is directed toward expanding the model and thus increasing its ability to accurately model diseases.
The simulations of a diseased neuron, in its preliminary form, indicate complete breakdown of the ionic concentration gradient across the neuronal membrane. This is due to severe inhibition of the ATP Synthase Enzyme which inhibits the activity of the ATP Pump. We believe that experimentations to capture the spike train of a defective single neuron could produce similar voltage spikes.
An important consideration in disease modeling is the quantitative variation in the considered parameters. Due to lack of accurate experimental data, we are forced to quantify this variation with assumptions. We find that even a small change in amplitude of this variation affects the severity of its deviation from that of healthy neurons. Since the model is still in its pilot phase, we are currently working on expanding the model to include all parameters that are responsible for such diseases. This would aid us in working on disease modeling using a method of optimization to quantify the deviation of rate constants dependencies described in detail at the end of this section.
As the voltage spike in the model is a function of the neuronal energetics through several biophysical and biochemical processes, we hope to be able to predict the concentrations of the various intracellular parameters and the nature of the various reactions taking place within the neuron based on the spike output of the integrated energetics model.
No doubt, this will pave the way for non-invasive testing of patients for diseases and could possibly be used in the future for accurate modeling of diseases. Such a model also promises several benefits toward a non-invasive simulation technique for drug testing and discovery.
A study in the potency of the drug could be done with no danger to the patient using such a model and its subsequent simulation. A time–frequency analysis of both the healthy and diseased simulated neuron can taken (Figure 5). Further, a neuron can be tested to see whether it is in a degenerate state or not by taking a time–frequency analysis of its spiking activity and comparing it with those of the simulated neurons. If there is a high correlation with that of the healthy simulated neuron it would indicate that the neuron is not degenerate.
The model that has been discussed in this paper relates the spike activity of a single neuron to its energetics. We would no doubt like to extend the single neuron model to a network level. The results that we get by studying a network of neurons would be comparatively simpler to verify experimentally than that of a single neuron because of the current limitations in experimental methods. Moreover the devastating effect of a disease are felt only when a network of degenerate neurons are considered as compared to a single degenerate neuron.
However, there were several practical difficulties that were encountered while trying to extend to a network model. The most significant being the lack of experimental data detailing the spatial distribution of mitochondria and other such organelles and chemicals within the neuron. As such information could not be found, a lumped model for the mitochondria and various intracellular chemicals, proteins such as voltage gated ion channels, ligand gated ion channels etc., was developed. To develop a network model we would in particular need precise and accurate information on the distribution of inhibitory and excitatory receptors on the dendritic tree. However as this information was hard to come by the ion channels were modeled lumped in nature. Needless to say a lumped ion channel model would make the spatio-temporal summation of input by dendrites (an essential feature of a network of neurons), impossible to bring in, thereby negating the very essence of a network of neurons.
Another important simplification we have made is with respect to the rate constants. With more than 80 interdependent parameters in our model the rate constants governing the various biochemical reactions take up a pivotal role. As explained earlier, these values were obtained by a process of repeated simulation and analysis.
Current work at WARFT aims at integrating this Voltage-Spike Energetics Model to a network of neurons generated in a neurogenesis inspired structure generation manner. The biochemical signaling pathways responsible for the growth of neurons are linked with the geometrical properties of the neuronal network. The cell growth and division, neurite outgrowth, axon selection and guidance, synapse and spine formation, and other anatomical parameters are modeled as function of the concentration of proteins and enzymes responsible for their development (Venkateswaran et al., 2011). In this regard, deeper models that investigate the distribution and movement of mitochondria within a neuron, distribution of ion channels across the neuronal surface and a spike propagation model that combines both these models are being simultaneously investigated.
As explained earlier, the unavailability of detailed information regarding the positioning and distribution of various organelles and chemicals and their inter relationship hold back the model. Thus immediate work aims at developing a robust optimization paradigm that would effectively optimize these parameter values as a function of the voltage spike. A two level Simulated Annealing – Game Theory optimization approach is being currently investigated based upon. (Mohan, 2008).
Computational Aspects
A framework for large scale simulation is presented here. A hyper graph data structure captures the neuronal network information. The hyper nodes and hyper edges represent the neurons and their synaptic connectivity while the sub level nodes and sub level edges represent the neuronal parameters and their dependency relations. The energetic based simulation is currently being executed over an arbitrary neuronal network which can be tuned to a specific connectivity.
At every timestamp, a centralized control triggers execution of energetics model across partitions of neuronal network. Within a neuronal partition, the computations performed and communications established are in parallel (Ramanathan, 2011).
Deeper investigation into simulation techniques to decide on event driven or data driven, centralized or distributed controls etc., are currently under research.
The parallel environment for the large scale simulation is facilitated by a hierarchy of host and node processes (Venkateswaran et al., 2008).
The intra and inter regional synaptic connectivity (communications within and across partitions) contribute to the communication complexity while computationally significant single neuron models capturing the dynamics spanning from molecular, cellular, and network levels contribute to the computational complexity. The enormity lies in managing these high communication and computational complexities pertaining to a dynamic system.
This research initiative demands a global database of experimental results and deeper experiments to capture energetic parameters. The enormity of this project calls for global support.
Conflict of Interest Statement
The authors declare that the research was conducted in the absence of any commercial or financial relationships that could be construed as a potential conflict of interest.
Acknowledgments
We would like to extend our heartfelt thanks to the two reviewers whose comments and suggestions enhanced the quality of this research. We would also like to thank Dr. Yuri Zilberter, Editor of this research topic for encouraging our work. Further, We are thankful to the Frontiers Foundation for providing us with a complete waiver for the publication of this paper.
References
Arnaudeau, S., Kelley, W. L., Walsh, J. V. Jr., and Demaurex, N. (2001). Mitochondria recycle Ca(2+) to the endoplasmic reticulum and prevent the depletion of neighboring endoplasmic reticulum regions. J. Biol. Chem. 276, 29430–29439.
Attwell, D., and Gibb, A. (2005). Neuroenergetics and the kinetic design of excitatory synapses. Nat. Rev. Neurosci. 6, 841–849.
Attwell, D., and Laughlin, S. B. (2001). An energy budget for signaling in the grey matter of the brain. J. Cereb. Blood Flow Metab. 21, 1133–1145.
Babinec, P., and Babincov, M. (2002). Spatial distribution of ion channel activity in biological membranes: the role of noise. Bioelectrochemistry 56, 167–170.
Baker, H. L., Errington, R. J., Davies, S. C., and Campbel, A. K. (2002). A mathematical model predicts that calreticulin interacts with the endoplasmic reticulum Ca2+–ATPase. Biophys. J. 82, 582–590.
Beard, D. A., and Qian, H. (2008). Chemical Biophysics: Quantitative Analysis of Cellular Systems. Cambridge: Cambridge University Press.
Buchholtz, F., Golowasch, J., Epstein, I. R., and Marder, E. (1992). Mathematical model of an identified stomatogastric ganglion neuron. J. Neurophysiol. 67, 332–340.
Cloutier, M., Bolger, F. B., Lowry, J. P., and Wellstead, P. (2009). An integrative dynamic model of brain energy metabolism using in vivo neurochemical measurements. J. Comput. Neurosci. 27, 391–414.
Duchen, M. R. (2000). Mitochondria and calcium: from cell signalling to cell death. J. Physiol. (Lond.) 529, 57–68.
Echtay, K. S., Murphy, M. P., Smith, R. A. J., Talbot, D. A., and Brand, M. D. (2002). Superoxide activates mitochondrial uncoupling protein 2 from the matrix side. J. Biol. Chem. 277, 47129–47135.
Fienberg, S. E. (1974). Stochastic models for single neuron firing trains: a survey. Biometrics 30, 399–427.
Fitzhugh, R. (1955). Mathematical models of threshold phenomena in the nerve membrane. Bull. Math. Biophys. 17, 257–278.
Hardy, J., and Selkoe, D. J. (2002). The amyloid hypothesis of Alzheimer’s disease: progress and problems on the road to therapeutics. Science 297, 2209.
Harrison, L. M., David, O., and Fritson, K. J. (2005). Stochastic models of neuronal dynamics. Philos. Trans. R. Soc. Lond. B Biol. Sci. 360, 1075–1091.
Hayashi, Y., Shi, S. H., Esteban, J. A., Piccini, A., Poncer, J. C., and Malinow, R. (2000). Driving AMPA receptors into synapses by LTP and CaMKII: requirement for GluR1 and PDZ domain interaction. Science 287, 2262–2267.
Hirai, K., Aliev, G., Nunomura, A., Fujioka, H., Russell, R. L., Atwood, C. S., Johnson, A. B., Kress, Y., Vinters, H. V., Tabaton, M., Shimohama, S., Cash, A. D., Siedlak, S. L., Harris, P. L., Jones, P. K., Petersen, R. B., Perry, G., and Smith, M. A. (2001). Mitochondrial abnormalities in Alzheimer’s disease. J. Neurosci. 21, 3017–3023.
Hodgkin, A. L., and Huxley, A. F. (1952). A quantitative description of membrane current and its application to conduction and excitation in nerve. J. Physiol. (Lond.) 117, 500–544.
Jäger, S., Handschin, C., St-Pierre, J., and Spiegelman, B. M. (2007). AMP-activated protein kinase (AMPK) action in skeletal muscle via direct phosphorylation of PGC-1α. PNAS 104, 12017–12022.
Jouaville, L. S., Pinton, P., Bastianutto, C., Rutter, G. A., and Rizzuto, R. (1999). Regulation of mitochondrial ATP synthesis by calcium: evidence for a long-term metabolic priming. Proc. Natl. Acad. Sci. U.S.A. 96, 13807–13812.
Kandel, E. R., Schwartz, J., and Jessell, T. (1991). Principles of Neuroscience, 4th Edn. New York: McGraw-Hill.
Linden, D. J. (2001). The expression of cerebellar LTD in culture is not associated with changes in AMPA-receptor kinetics, agonist affinity, or unitary conductance. Proc. Natl. Acad. Sci. U.S.A. 98, 14066–14071.
Mattson, M. P., Gleichmann, M., and Cheng, A. (2008). Mitochondria in neuroplasticity and neurological disorders. J. Neurosci. 60, 748–766.
Mogilevskaya, E., Demin, O., and Goryanin, I. (2006). Kinetic model of mitochondrial Krebs cycle: unraveling the mechanism of salicylate hepatotoxic effects. J. Biol. Phys. 32, 245–271.
Mohan, A. (2008). The MMINi-DASS Simulator and its Application to Visual Pathway Connectivity Prediction. [A thesis submitted to WAran Research FoundaTion]. Available at: http://www.warftindia.org/Ashutosh.pdf
Mohan, A., Nagarajan, V., Sekhar, S., Sharath, N. K., Thiagarajan, T. S., Ramanathan, S., and Kannan, D. (2010a). “Energetics based simulation of large-scale 3D neuronal network: energetics-based models,” in Frontiers Neuroscience Conference Abstract: Neuroinformatics 2010, Kobe. doi: 10.3389/conf.fnins.2010.13.00092
Mohan, A., Nagarajan, V., Ramanathan, S., Sekhar, S., Thiagarajan, T. S., Kannan, D., and Sharath, N. K. (2010b). “Energetics-based simulation of 3D neuronal network: neurogenesis-inspired structure generation,” in Frontiers Neuroscience Conference Abstract: Neuroinformatics 2010, Kobe. doi: 10.3389/conf.fnins.2010.13.00097
Oja, E. (1982). A simplified neuron model as a principal component analyzer. J. Math. Biol. 15, 267–273.
Parekh, A. B. (2003). Mitochondrial regulation of intracellular Ca2+ signaling: more than just simple Ca2+ buffers. News Physiol. Sci. 18, 252–256.
Rall, W. (1959). Branching dendritic trees and motoneuron membrane resistivity. Exp. Neurol. 1, 491–527.
Rall, W. (1960). Membrane potential transients and membrane time constant of motoneurons. Exp. Neurol. 2, 503–532.
Ramanathan, S. (2011). 3D Neuronal Structure: Towards Generation, Simulation and Optimization for Brain Specific Region. [A thesis submitted to WAran Research FoundaTion]. Available at: www.warftindia.org/Subbu.pdf
Remy, S., and Spruston, N. (2007). Dendritic spikes induce single-burst long-term potentiation. Proc. Natl. Acad. Sci. U.S.A. 104, 17192–17197.
Rousset, S., Alves-Guerra, M. C., Mozo, J., Miroux, B., Cassard-Doulcier, A. M., Bouillaud, F., and Ricquier, D. (2004). The biology of uncoupling proteins. Diabetes 53(Suppl. 1), S130–S135.
Schulman, R. G., and Rothman, D. L. (2004). Brain Energetics and Neuronal Activity. Chichester: Wiley.
Schuss, Z., Nadler, B., and Eisenberg, R. S. (2001). Derivation of Poisson and Nernst-Planck equations in a bath and channel from a molecular model. Phys. Rev. E Stat. Nonlin. Soft Matter Phys. 64, 036116.
Sherwood, C. C., Stimpson, C. D., Raghanti, M. N., Wildman, D. E. Uddin, M., Grossman, L. I., Goodman, M., Redmond, J. C., Bonar, C. J., Erwin, J. M., and Hof, P. R. (2006). Evolution of increased glia–neuron ratios in the human frontal cortex. Proc. Natl. Acad. Sci. U.S.A. 103, 13606–13611.
Shulman, R. G., and Rothman, D. L. (eds) (2005). Brain Energetics, and Neuronal Activity. Chichester: John Wiley and Sons Limited, 315.
Steinberg, J. P., Huganir, R. L., and Linden, D. J. (2004). N-ethylmaleimide-sensitive factor is required for the synaptic incorporation and removal of AMPA receptors during cerebellar long-term depression. Proc. Natl. Acad. Sci. U.S.A. 101, 18212–18216.
Tsodyks, M., Uziel, A., and Markram, H. (2000). Synchrony generation in recurrent networks with frequency-dependent synapses. J. Neurosci. 20, RC50.
Turrens, J. F. (1997). Superoxide production by the mitochondrial respiratory chain. Biosci. Rep. 17, 3–8.
van Pelt, J., van Ooyen, A., and Uylings, H. B. M. (2001). “Modeling dendritic geometry and the development of nerve connections,” in Computational Neuroscience: Realistic Modeling for Experimentalists, ed. E. De Schutter (Boca Raton: CRC Press), 179–208.
Venkateswaran, N., Elangovan, V. K., Ganesan, K., Sagar, T. R. S., Aananthakrishanan, S., Ramalingam, S., Gopalakrishnan, S., Manivannan, M., Srinivasan, D., Krishnamurthy, V., Chandrasekar, K., Venkatesan, V., Subramaniam, B., Sangkar, V., Vasudevan, A., Ganapathy, S., Murali, S., and Thyagarajan, M. (2008). “On the concept of simultaneous execution of multiple applications on hierarchically based cluster and the silicon operating system,” in IEEE International Symposium on Parallel and Distributed Processing, 2008, Miami, FL.
Venkateswaran, N., Kabaleeswaran, D. K., Vignesh, S. R., Ramanathan, S., Jagathrakshakan, S. S., Narayanasamy, N., Sekhar, S., Krishnan, N. S., and Thiagarajan, T. S. (2011). “Single neuron development – a neurogenesis inspired structure generation model,” in Frontiers Neuroinformatics Conference Abstract, Boston. doi: 10.3389/conf.fninf.2011.08.00162
Volman, V., Ben-Jacob, E., and Levine, H. (2007). The astrocyte as a gatekeeper of synaptic information transfer. Neural. Comput. 19, 303–326.
Weber, J. T., De Zeeuw, C. I., Linden, D. J., and Hansel, C. (2003). Long-term depression of climbing fiber-evoked calcium transients in Purkinje cell dendrites. Proc. Natl. Acad. Sci. U.S.A. 100, 2878–2883.
Yu, T. P., McKinney, S., Lester, H. A., and Davidson, N. (2001). γ-Aminobutyric acid type A receptors modulate cAMP-mediated long-term potentiation and long-term depression at monosynaptic CA3–CA1 synapses. Proc. Natl. Acad. Sci. U.S.A. 98, 5264–5269.
Keywords: neuroenergetics, mitochondria, Alzheimer’s disease, Krebs cycle, wavelet transformations, Petri nets, voltage spike, ATP
Citation: Venkateswaran N, Sekhar S, Thirupatchur Sanjayasarathy T, Krishnan SN, Kabaleeswaran DK, Ramanathan S, Narayanasamy N, Jagathrakshakan SS and Vignesh SR (2012) Energetics based spike generation of a single neuron: simulation results and analysis. Front. Neuroenerg. 4:2. doi: 10.3389/fnene.2012.00002
Received: 22 September 2011; Accepted: 12 January 2012;
Published online: 01 February 2012.
Edited by:
Yuri Zilberter, Institut National de la Santé et de la Recherche Médicale U751, FranceReviewed by:
Tibor Kristian, University of Maryland School of Medicine, USAFahmeed Hyder, Yale University, USA
Copyright: © 2012 Venkateswaran, Sekhar, Thirupatchur Sanjayasarathy, Krishnan, Kabaleeswaran, Ramanathan, Narayanasamy, Jagathrakshakan and Vignesh. This is an open-access article distributed under the terms of the Creative Commons Attribution Non Commercial License, which permits non-commercial use, distribution, and reproduction in other forums, provided the original authors and source are credited.
*Correspondence: Nagarajan Venkateswaran, WAran Research FoundaTion, No. 46B, Mahadevan Street, West Mambalam, Chennai, Tamil Nadu, India. e-mail: warft.backup@gmail.com