Linear and Nonlinear Directed Connectivity Analysis of the Cardio-Respiratory System in Type 1 Diabetes
 Michele Sorelli
 T. Noah Hutson
 Leonidas Iasemidis
 Leonardo Bocchi
- 1European Laboratory for Non-Linear Spectroscopy, University of Florence, Florence, Italy
- 2Department of Physics and Astronomy, University of Florence, Florence, Italy
- 3Department of Translational Neuroscience, Barrow Neurological Institute, Phoenix, AZ, United States
- 4Department of Information Engineering, University of Florence, Florence, Italy
In this study, we explored the possibility of developing non-invasive biomarkers for patients with type 1 diabetes (T1D) by quantifying the directional couplings between the cardiac, vascular, and respiratory systems, treating them as interconnected nodes in a network configuration. Towards this goal, we employed a linear directional connectivity measure, the directed transfer function (DTF), estimated by a linear multivariate autoregressive modelling of ECG, respiratory and skin perfusion signals, and a nonlinear method, the dynamical Bayesian inference (DBI) analysis of bivariate phase interactions. The physiological data were recorded concurrently for a relatively short time period (5 min) from 10 healthy control subjects and 10 T1D patients. We found that, in both control and T1D subjects, breathing had greater influence on the heart and perfusion with respect to the opposite coupling direction and that, by both employed methods of analysis, the causal influence of breathing on the heart was significantly decreased (p < 0.05) in T1D patients compared to the control group. These preliminary results, although obtained from a limited number of subjects, provide a strong indication for the usefulness of a network-based multi-modal analysis for the development of biomarkers of T1D-related complications from short-duration data, as well as their potential in the exploration of the pathophysiological mechanisms that underlie this devastating and very widespread disease.
Introduction
Type 1 diabetes (T1D) is a chronic condition affecting roughly 5% of the world’s diabetic population (Ogurtsova et al., 2017), which is estimated to reach 642 million (95% CI: 521–829 million) by 2040 (it was 151 million in 2000 (Wild et al., 2004)) with dramatic social and financial implications. T1D is associated with pathogenetic mechanisms that lead to the apoptosis of pancreatic beta cells and, thus, to an inadequate production of the insulin hormone. There is no currently available cure for T1D, and its clinical care is focused primarily on the normalization of blood glucose levels for averting the onset of long-term complications including cardiovascular disease and renal failure. The treatment of diabetic-related chronic complications accounts for a considerable percentage [about 80% in the United Kingdom (Ogurtsova et al., 2017)] of the total medical costs of diabetes mellitus. Studies show that timing of medical intervention is key to reducing effects of comorbidities of T1D, with earlier interventions resulting in lower disease impact (Doria et al., 2012). Thus, there would be benefits to patients and healthcare systems alike from development of novel diagnostic techniques for early and non-invasive detection of T1D-related complications. Such diagnostic regimes could also have implications in outpatient monitoring and disease progression assessment.
The complex function of the cardiovascular system is realized by the synergistic activity of self-sustained cardiac, respiratory, and vascular oscillators (Ticcinelli et al., 2017), which is deemed to convey the necessary adaptability to sudden variations in the metabolic requirements of the organism or to changing environmental conditions (Penzel et al., 2017). There is a wide variety of clinically available devices for non-invasively monitoring the physiological systems that may be impacted by the progression of T1D. Such systems generate oscillatory modes that span a wide range of characteristic time scales, which can be isolated and separately characterized by means of established time-frequency representation (TFR) techniques (Clemson et al., 2016). In this regard, the wavelet transform (WT) analysis of laser Doppler flowmetry (LDF) signals of microvascular perfusion (Stefanovska et al., 1999) has contributed to the identification of myogenic (Aalkjaer et al., 2011), neurogenic (Söderström et al., 2003) and endothelial (Kvandal et al., 2006) frequency ranges in the microcirculatory vasomotion, in addition to the ones of the extrinsic cardiac and respiratory components (Stefanovska and Hozic, 2000) transmitted to the distal microvascular beds (Table 1). This, in turn, has enabled the non-invasive assessment of the underlying vasomotor mechanisms in pathological states.
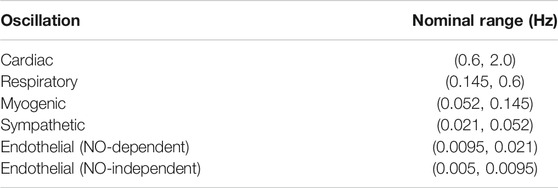
TABLE 1. Physiological frequency ranges in microvascular perfusion signals.
Furthermore, the wavelet cross-spectrum (Clemson et al., 2016) and the phase coherence of bivariate data, (Sheppard et al., 2012; Tankanag et al., 2014; Perrella et al., 2018), along with statistical properties translated from information theory [e.g., Granger causality (Granger, 1969) and transfer entropy (Vejmelka and Palus, 2008; Sabesan et al., 2009)], have been used to gain insights into the presence of significant relations between oscillatory sources, and to determine the existence of a mutual physiological coordination, e.g., the well-known synchronous modulation of the heartbeat period by the breathing rhythm, produced at the respiratory centers located within the medulla oblongata and pons of the brainstem (Eckberg, 2003). However, beyond the effects manifested in the oscillators’ phase dynamics, the fundamental functional mechanisms underlying these interactions can be probed via more sophisticated techniques, able to provide information about the directional strength of the coupling and hence about the causality of the interaction (Rosenblum and Pikovsky, 2001; Palus and Stefanovska, 2003; Faes et al., 2004). Since the cardiovascular system must handle time-varying conditions, the employed methods should be capable of capturing non-stationary functional couplings. The dynamical Bayesian inference (DBI) technique, more recently introduced by Stankovski et al. (2012), seeks to account for such non-stationarities. In DBI, the cardiovascular system is modelled as a network of phase oscillators coupled by time-dependent functions, which are identified dynamically through a Bayesian estimation framework within subsequent time windows of the oscillators’ phase time series. Several researchers have employed DBI to investigate potential changes in the direct and indirect coupling between the cardiac, respiratory and vasomotor activities; their studies have detected a reduction in the respiratory sinus arrhythmia with ageing (Shiogai et al., 2010; Iatsenko et al., 2013; Stankovski et al., 2014; Ticcinelli et al., 2015; Ticcinelli et al., 2017), and a weakening of the coupling between the microvascular myogenic vasomotion and the central cardiac and respiratory oscillations in the elderly population and in primary hypertension (Ticcinelli et al., 2017). Since metabolic diseases, such as obesity and diabetes, have been recognized as models of accelerated ageing, the aforementioned alterations may also be present in subjects diagnosed with T1D.
Non-stationary metrics of time-frequency activity could elucidate stochastic coupling but require an adequate number of data points over stationary windows for inferences to be statistically significant. Linearly modelling the data may provide a valuable alternative. Multivariate autoregressive (MVAR) models have been used for describing interactions between time series originating from different nodes within a network (Baccalá et al., 2007; Vlachos et al., 2017). In detail, MVAR-based parametric techniques can be utilized to elucidate inter-node connections via coherence-based measures of implicit causality. One such measure is the directed transfer function (DTF), a frequency-domain descriptor of directed network connectivity with fundamental implications from Granger causality (Baccalá et al., 2007). DTF measures cascaded direct and indirect interactions, emphasizes source-based outflow and has been employed in several neuroscience applications (Kamiński et al., 2001; Blinowska et al., 2013; Kamiński and Blinowska, 2014; Vlachos et al., 2017; Adkinson et al., 2018; Hutson et al., 2018). DTF and other MVAR-based measures of directional connectivity may also be applied to the evaluation of the directional coupling between the cardiac, respiratory, and peripheral blood flow systems. The utility of these measures in neuro-cardio-respiratory network interactions has been shown lately in animal studies of sudden unexpected death in epilepsy (SUDEP), a condition that involves potential failure of central control units of cardiac and respiratory behavior (Hutson et al., 2020).
Employing directed connectivity measures to quantify the inter-modulation of the biological oscillations originating from separate but interconnected systems could have valuable diagnostic potential for assessing the deterioration of the cardiovascular and respiratory function in prevalent high-risk conditions such as T1D. According to the results of a recent review article (Klein et al., 2010), adult subjects diagnosed with type 2 diabetes are characterized by reduced respiratory parameters, which appear to be inversely related to blood glucose levels and the time since the initial diagnosis. This review has linked chronic hyperglycemia and inflammation, autonomic neuropathy, microangiopathy of the pulmonary arterioles, and stiffening of the lung parenchyma to the possible biological mechanisms underlying the lung function impairment. This may then result in a detrimental impact on the mutual physiological coupling between the breathing and heart function. In light of the above, in the present study we employed the DBI and DTF frameworks with the aim to non-invasively detect characteristics of the potential decline of connectivity in the cardio-respiratory oscillatory network in a preliminary, relatively small group of healthy controls and patients diagnosed with T1D.
Materials and Methods
Experimental Setup and Subjects
10 healthy controls (age: 26.7 ± 1.5 years; M/F: 7/3) and 10 T1D patients (age: 29.7 ± 13.3 years; M/F: 5/5) were recruited for the present study. Research activities were carried out in accordance with the guidelines of the Declaration of Helsinki of the World Medical Association: the included subjects received detailed information on the research protocol and its purpose and signed an informed consent form. The general characteristics of the participants are summarized in Table 2; one control subject (i.e., 10%) and four T1D subjects (40%) were smokers. ECG, breathing and microvascular perfusion signals were simultaneously recorded. Microvascular perfusion was measured on the distal phalanx of the right forefinger using a Periflux 5,000 laser Doppler flowmetry (LDF) system (Perimed AB, Sweden). The time constant of the output low-pass filter of the instrument was set to 0.03 s in order to preserve pulse waveforms. The heart and spontaneous respiratory activities were instead monitored by means of a BioHarness 3.0 wearable chest strap sensor (Zephyr Technology, United States) and transmitted to a PC via Bluetooth. A graphical illustration of the recording setup is shown in Figure 1.
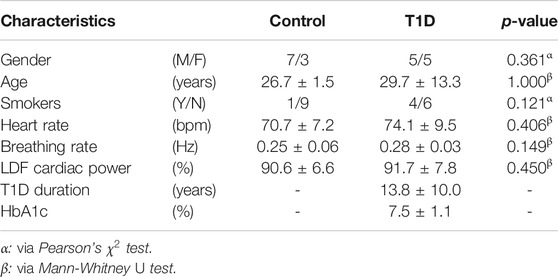
TABLE 2. Study participants: general characteristics.
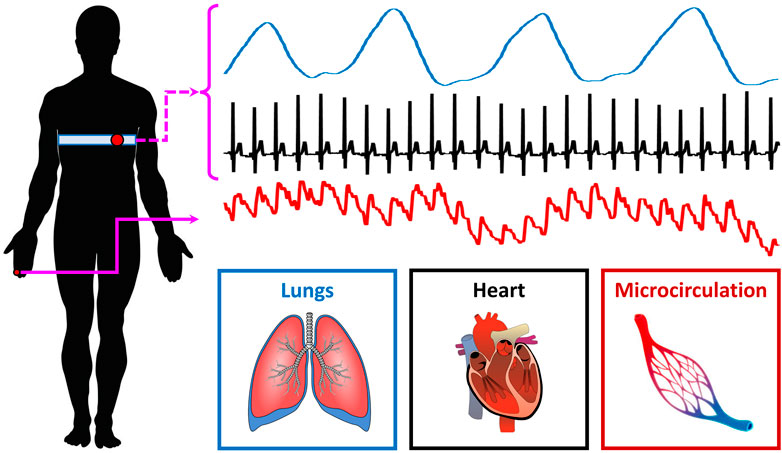
FIGURE 1. Experimental recording setup.
The above three signals were concurrently recorded and digitized at a sampling frequency of 250 Hz (being synchronized through a dedicated data acquisition software). Each recording session lasted 5 min and took place in thermally stable conditions (T ≈ 23°C) following a preliminary acclimatization time interval of 10 min. During signal acquisition, subjects were seated in a chair with back support and leaned their right forearm on a table; furthermore, they were instructed to carefully avoid abrupt movements to prevent the displacement of the LDF probe and thus the introduction of motion-related artifacts in the recorded perfusion signals. An example of the raw signals acquired from a young control individual is shown in Figure 2.
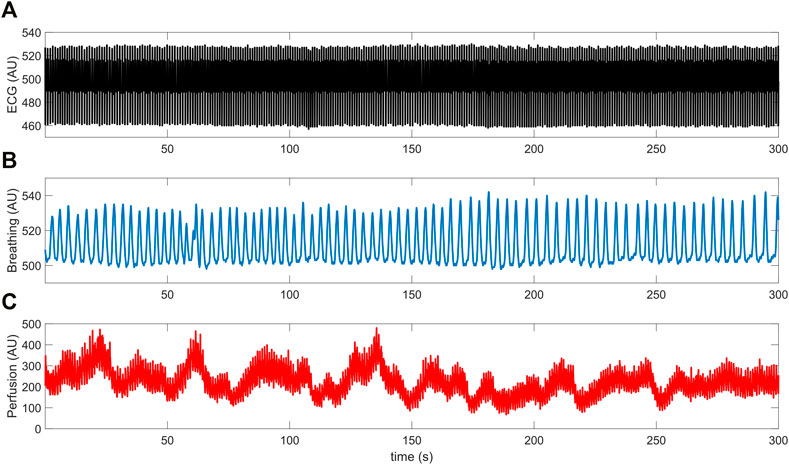
FIGURE 2. Example of (A) ECG, (B) breathing and (C) LDF perfusion signals recorded from a young control subject.
The mean breathing rate of all subjects was inside the nominal physiological range, that is (0.145, 0.6) Hz (Table 1). Furthermore, LDF perfusion signals recorded from the pathological group did not exhibit a significantly different (p = 0.450) power within the nominal frequency range of the cardiac rhythm (0.6, 2) Hz. However, T1D subjects included a larger proportion of smokers and were on average older than the control subjects. Nevertheless, these differences did not reach statistical significance according to Pearson’s
Dynamical Bayesian Inference
The functional physiological interaction between cardiac and respiratory processes was investigated by means of the dynamical Bayesian inference (DBI) technique (Duggento et al., 2012; Stankovski et al., 2012). This method regards the cardio-respiratory system as a network of coupled self-sustained nonlinear phase oscillators and uses a Bayesian inference scheme to dynamically estimate their time-evolving coupling strength and causality (i.e., the direction of interactions). Myogenic, sympathetic, and endothelial microvascular oscillations (Table 1) were not considered in the present study, due to the insufficient duration of the recorded signals. A comprehensive description of the approach can be found elsewhere (Duggento et al., 2012; Stankovski et al., 2012; Iatsenko et al., 2013; Clemson et al., 2016; Ticcinelli et al., 2017). Briefly, in DBI, the phase dynamics of two interacting oscillatory processes
where
where N is the order of the expansion and
In detail, DBI analysis usually requires the extraction of the instantaneous frequency of the oscillations of interest, in order to track their characteristic time-dependent phase
Prior to the application of the WT, signals were downsampled to 50 Hz, detrended by means of a third order polynomial fit, and band-passed inside the cardiac and respiratory frequency intervals listed in Table 1, to remove the influence of components lying outside the physiological range of interest. The discretization of the frequency domain was performed with a density of 128 voices/octave, which enabled the extraction of smooth ridge curves. DBI was then applied to consecutive overlapping windows of the original time series, with an overlap factor of 50%. The window width was set so as to include approximately five cycles of the slowest oscillatory component for inference of the coupling parameters

FIGURE 3. Time-frequency ridges of the (A) ECG, (B) breathing and (C) LDF perfusion signals shown in Figure 2. Ridges were estimated by means of the adaptive parametric approach developed in (Iatsenko et al., 2016).
As done by Iatsenko et al. (2013) and Ticcinelli et al. (2017), a Fourier decomposition up to the second order (i.e., N = 2) was chosen for the phase dynamics model expressed in Eq. 1. Moreover, the propagation constant
where
Furthermore, a directionality index
This index, proposed by Rosenblum and Pikovsky (2001) has been used in the recent literature for detecting the predominant direction of influence between the cardiac and respiratory oscillators (Stankovski et al., 2012; Iatsenko, et al., 2013; Ticcinelli, et al., 2017). Namely, if
Directed Transfer Function
Multivariate autoregressive (MVAR) modelling of the data within short-time segments, each data window aligned in time with concurrent ones from more than one time series, is recommended for network connectivity analysis assuming that these signals are recorded from different parts of a multi-dimensional, linear and wide-sense stationary system. For each window, the estimated array of MVAR model coefficients can then be further analyzed in the frequency domain and, depending on different types of normalization utilized, provides frequency-specific measures of directional functional connectivity between the nodes of the assumed network configuration of the system (Baccalá et al., 2007). We have successfully employed such measures in network analyses of intracranial EEG (iEEG) (Vlachos et al., 2017; Adkinson et al., 2018), and magnetoencephalographic (MEG) recordings (Krishnan et al., 2015) from patients with focal epilepsy for localization of their epileptogenic focus, as well as the assessment of the dynamics of brain’s network connections en route to a life-threatening neurological event, status epilepticus (T. N. Hutson et al., 2018). In the current study we fitted a MVAR model to each of 60-s consecutive non-overlapping data segments from the three recorded signals (ECG, breathing, perfusion) over 5 min. By using a 60-s time window, our frequency resolution is 1/60 s = 0.017 Hz = 0.05 Hz/3, and thus the lowest frequency we can deal with moving the analysis in the frequency domain is three times less than the 0.05 Hz, the lowest frequency in the frequency band of (0.05, 2) Hz we are interested in here. Thus, the MVAR model was of dimension D = 3 [i.e., the data to be fitted were placed in three-dimensional column vectors
For each set of three 60-s running windows extracted at the same time from all three signals, the model linearly fits the data in the column vectors
where the time index
where
Specifically, DTF is estimated via the following equation:
The statistical significance of the DTF values of each interaction derived from each 60-s window was determined. The statistical criteria for inferring the statistical significance and confidence interval of the derived frequency-domain Granger causality-based connectivity measures are recent and have been discussed by a small number of researchers. In this study, we have followed an asymptotic analysis for evaluation of the connectivity measures from the MVAR modelling of our data (Baccalá et al., 1997; Baccalá et al., 2016). In detail, the significance of the connectivity measures
Rejecting
Results
Dynamical Bayesian Inference
Figure 4 shows sample coupling strength signals of the time-evolving pairwise interactions among peripheral pulse, respiratory and ECG signals, estimated using DBI in a control subject and a T1D patient. Directional coupling strength estimates below the corresponding median values of the surrogates reported in Table 3 (100 surrogate subjects, for a total of Nw = 2,300 windows), were rejected. Also, only those windows for which both directional coupling strengths per paired interaction were found to be statistically significant according to the above rule were further considered in the statistical analysis of the directionality index,
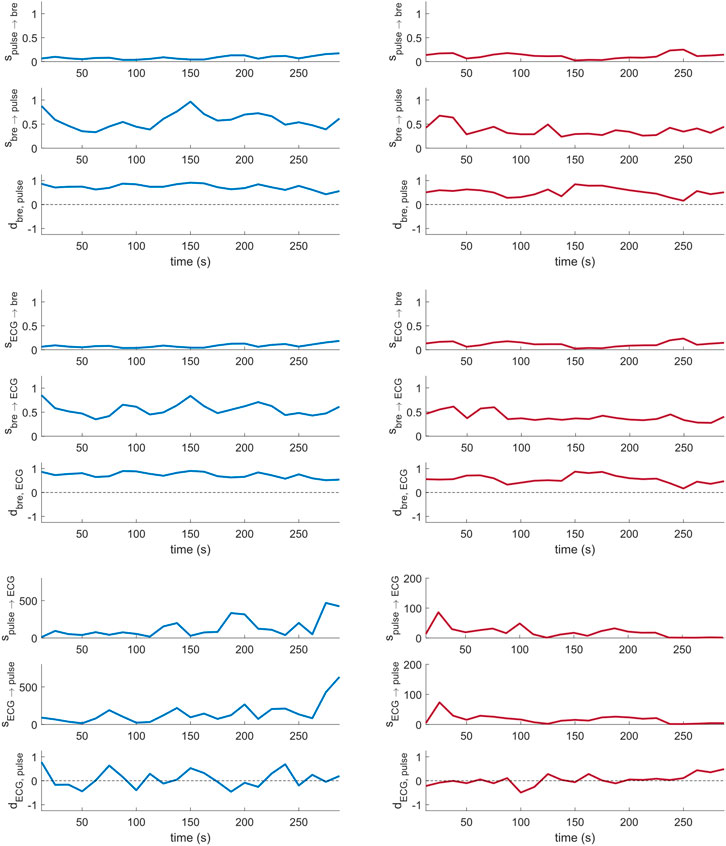
FIGURE 4. Cardio-respiratory directional coupling strength parameters estimated via DBI (Eqs 4, 5; two per panel), and respective directionality indices (Eq. 6; one per panel) obtained from a control subject (left) and a T1D patient (right).
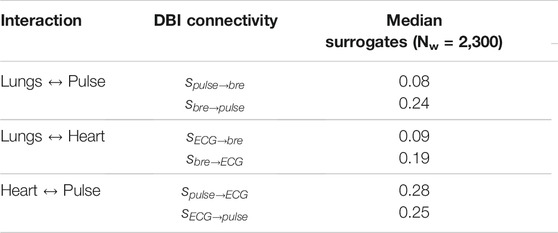
TABLE 3. Median coupling strength values obtained from 100 inter-subject surrogates.
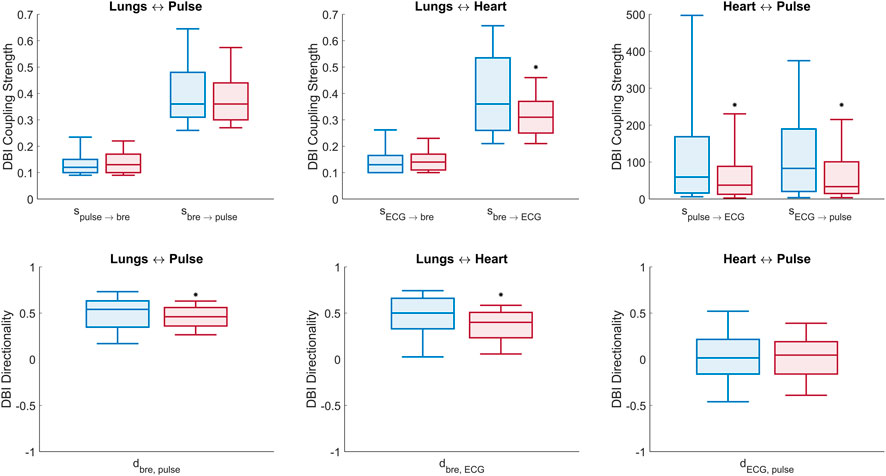
FIGURE 5. Box plots of DBI measures of connectivity (Eqs 4–6). Top panel: comparison of all (six) cardio-respiratory coupling parameters estimated with DBI for the control (blue) and T1D (red) groups. Bottom panel: comparison of the (three) directionality indices per pair interaction for the control (blue) and T1D (red) groups. Statistically significant decreases, identified by one-tailed Wilcoxon rank-sum tests, are denoted by (*) above the respective boxes.
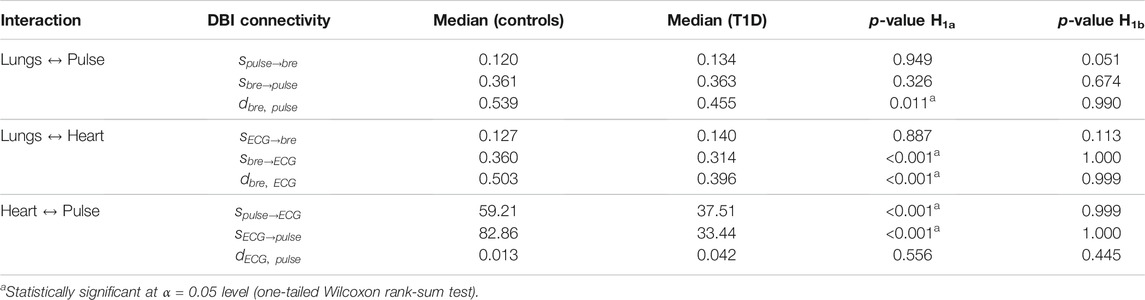
TABLE 4. Median of statistically significant (p < 0.05, vs. surrogates) DBI coupling strengths and directionality indices per interaction in controls and T1D patients. The statistical significance of the differences observed between the groups was estimated by one-tailed Wilcoxon rank-sum tests comparing the null hypothesis H0 (medians in the two groups are equal) to two alternative hypotheses: H1a, the median of controls being greater than that of T1D; and H1b, the median of T1D being greater than that of controls. The p-values for each of the two performed Wilcoxon tests (last two columns) refer to the probability of accepting hypothesis H0 to be true over the alternative hypotheses H1a or H1b.
Lungs–Heart interaction. Compared to controls, T1D patients exhibited a significant reduction in the directionality index
Lungs–Pulse interaction. T1D patients also exhibited a significant decrease in the
Heart–Pulse interaction. With respect to the healthy group, T1D patients were characterized by significantly lowered directional coupling strengths,
Directed Transfer Function
The statistically significant DTF values (ssDTF) of directional connectivity estimated per interaction from MVAR modelling (six directional interactions between the three recorded signals) were aggregated over all windows (60-s non-overlapping data segments) and subjects within the same group (control or T1D) and averaged over the physiologically relevant frequency band (0.05, 2) Hz. The median and quartiles of the ssDTF values obtained from the control and T1D groups are shown in Figure 6. It is relevant to highlight that MVAR modelling evaluate signals across identical frequencies over the entire physiological range of interest, in contrast to DBI which is based on the extraction of the specific time-varying frequency component of the cardiac pulsatility, within an effectively tighter range. Therefore, in this section interactions involving LDF signals are denoted as “perfusion”, rather than “pulse”. From Figure 6, we make the following statistically significant observations about the assessed directional interactions: “Perfusion→Breathing”, “Perfusion→ECG” and “ECG→Breathing” connectivity strengths are elevated in T1D subjects compared to controls. Conversely, the “Breathing→ECG” interaction in T1D is lower than the controls’. It is also noteworthy that “Breathing→ECG” is significantly higher in connectivity than “ECG→Breathing” for both T1D and controls. Also, the “Perfusion→ECG” coupling is higher than “ECG→Perfusion” in both groups.
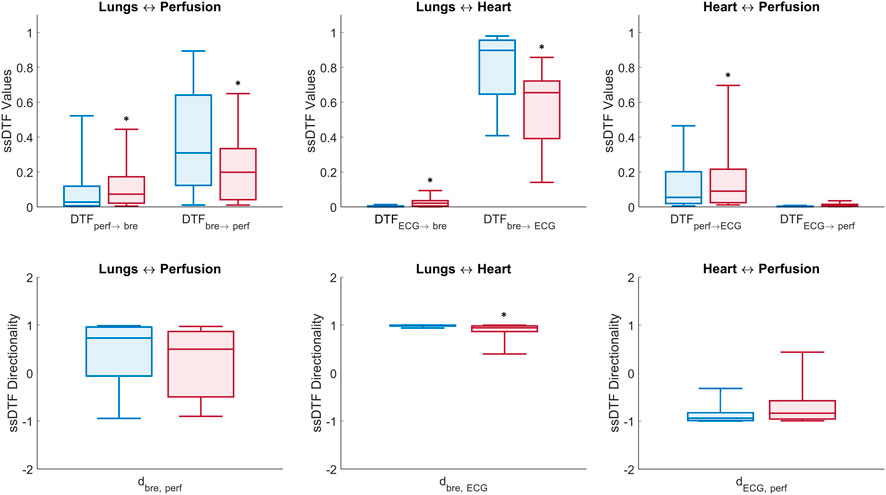
FIGURE 6. Box plots of DTF measures of connectivity in the (0.05, 2) Hz frequency band (Eqs 10, 12). Top panel: median ± first and third quartiles of ssDTF values across all directed interactions for control (blue) and T1D (red) groups. Bottom panel: directionality indices per pair interaction for the control (blue) and T1D (red) groups (*) above boxes denotes p-value < 0.05 estimated from non-parametric one-tailed Wilcoxon rank-sum tests comparing T1D and control groups.
Statistically significant directional interactions (p < 0.05) between the network nodes for each pair of recorded signals are reported in Table 5 (columns 3 and 4) together with their directionality index
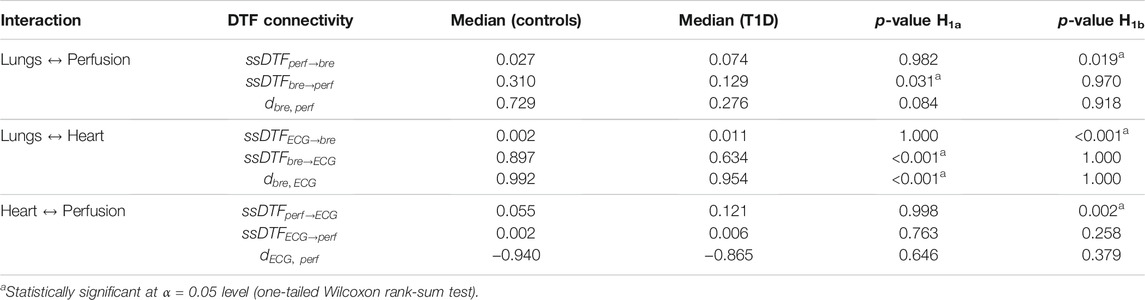
TABLE 5. Median of statistically significant (p < 0.05, vs. surrogates) DFT values (ssDTF) and directionality indices aggregated over subsequent time windows, and averaged over the frequency range (0.05, 2) Hz. The statistical significance of the differences observed between the control and T1D groups is also illustrated as in Table 4.
Lungs–Heart interaction. In agreement with the results from the DBI method, DTF shows that T1D patients exhibit a statistically significant reduction (p < 0.001) in the directional coupling strength from the lungs to the heart, as well as in the directionality index
Lungs–Perfusion interaction. Similarly to the DBI analysis, the DTF measures of connectivity showed a decrease in the
Heart–Perfusion interaction. T1D patients exhibited increased connectivity compared to the controls in both directions, with the difference in the “Perfusion→ECG” coupling reaching statistical significance (p = 0.002) (Table 5, rows 7 and 8). The above trends contributed to a diminished absolute value of the directionality index
Finally, within each group, a few interesting features were also observed from the DTF results in relation to the difference in the strength of the directional couplings per interaction. In particular, in both control subjects and T1D patients, the median coupling strengths from the lungs to the heart and from the lungs to the microcirculation were considerably higher than in the opposite direction (the same outcome of the DBI analysis). However, the inter-group differences in the directional strengths between heart and microcirculation were contradictory with respect to the DBI analysis, which associated a higher level of bidirectional connectivity to the control group (Table 5, columns 3 and 4).
Discussion
Towards the goal of developing reliable and non-invasive biomarkers for T1D, we employed both nonlinear (bivariate) and linear (multivariate) measures to assess possible impairments in the coupling strength and directionality of influence between three representative nodes of the cardiovascular and respiratory systems (heart, lungs, microcirculation) in patients diagnosed with T1D compared to control subjects. The two adopted methods can capture equivalent or different features in the communication between the nodes of a physiological network because of their different capabilities, that is: linearity (DTF) vs. nonlinearity (DBI) in the data; multivariate (DTF) vs. bivariate (DBI) data analysis; measure of connectivity between signals at the same frequency (DTF) vs. different frequencies (DBI). Employing these two techniques, we did identify impairments (by both or one of the approaches) in the functional directional interactions between heart, lungs, and microcirculation in T1D patients. In detail, an impairment was defined as a statistically significant difference (p < 0.05) in the directional coupling strengths between the respective nodes, compared to the homologous estimate obtained from the control group (i.e., rejection of the null hypothesis H0).
Regarding the functional interactions between heart and lungs, DBI, the nonlinear framework, revealed a significantly reduced (p < 0.001) influence of the respiratory activity on the phase of the cardiac rhythm in the T1D group. A similar, statistically significant (p < 0.001) finding also emerged from the linear network analysis, using DTF. Moreover, the imbalance in the two communication channels from the lungs to the heart and vice versa, as captured by the directionality index, was also highly significantly different in both methods (p < 0.001). It is well known that the phase of the respiratory activity directly influences the action of the heart pump, as breathing-related changes in the intrathoracic volume alter the cardiac pre-load, thus affecting cardiac filling, post-load and other circulatory variables. Furthermore, respiration gates the timing of autonomic motoneuron firing (Eckberg, 2003), thus modulating the peripheral autonomic nervous system’s outflow to the heart, an indirect cardio-respiratory coupling occurring via neuronal control (Iatsenko et al., 2013; Kralemann et al., 2013). Therefore, our finding of a reduced driving relationship of the lungs to the heart in T1D patients could be related to autonomic neuropathy, vascular degeneration or lung tissue stiffening, common co-morbidities associated with diabetes mellitus (Klein et al., 2010).
An analogous decrease of the influence of respiration on the microvascular perfusion in the T1D group compared to controls was observed by DTF analysis (p = 0.031) but could not be verified by DBI (p > 0.05). However, like for the lungs-heart interaction, the imbalance in the directional coupling strengths between lungs and microcirculation, as reflected by the directionality index, was significantly less (p = 0.011) in T1D than in controls as shown by DBI as well as by DTF, though without reaching a statistical significance level (p = 0.084). Also, regarding the DBI analysis of phase interactions, it is notable that control subjects exhibited similar statistics with respect to the evaluation of breathing and ECG signals. This result would be in line with previous findings by Jamšek and Stefanovska on the coupling information among cardiac and respiratory processes which propagates to the distal microvascular beds (Jamšek and Stefanovska, 2007), and can be characterized through the analysis of LDF signals recorded non-invasively from the skin.
In T1D subjects, the DBI analysis highlighted a significantly decreased communication in both directions between the ECG and the microvascular pulse signal extracted from LDF signals. This finding, however, could not be validated by DTF too. It is noteworthy that these directional interactions were associated with significantly higher coupling strength values (Table 4). This could be due to the way DBI evaluates causal relationships and what it can capture. In this case, DBI basically assesses the phase coupling between ECG and pulse signals that, although recorded at different anatomical locations, originate from the same source, representing the electrical and mechanical activities of the heart, respectively (Kralemann et al., 2013).
Finally, the estimated directional couplings from the lungs to the heart and microvasculature, via either the DBI or DTF methods, were considerably higher than the ones from the heart and vasculature towards the lungs, in both control subjects and T1D patients. Since this outcome was common in both groups, it cannot be used as a biomarker for T1D. However, it agrees with the findings of Palus and Stefanovska (2003), which have shown that the respiratory process drives the heart activity at all breathing frequencies, whether paced or spontaneous, and may shed more light on the involved physiological mechanisms en route to a better understanding of the cardio-respiratory system.
A potential limitation of this study is the availability and analysis of signals from only a small number of nodes (lungs, heart, microcirculation) in the network under investigation. Both DTF and DBI measure the global (direct and indirect) interactions between two nodes A and B, the indirect interactions from A to B or from B to A occurring through other node(s) C that we may not have access to in the network (Kamiński et al., 2001; Baccalá et al., 2016). In this regard, it is established that each respiratory cycle is tightly controlled by four separate control centers in the pons and medulla (Smith et al., 1991; Hilaire and Pásaro, 2003; Dampney, 2017), which cannot operate without central intervention from the brain, and direct feedback from the heart. Furthermore, central autonomic neural control has a well-known role in the low- and high-frequency variability of the heart rate (Shaffer and Ginsberg, 2017). Thus, ignoring the brain (EEG) and investigating this complex neuro-cardio-respiratory network from only three nodes (lungs, heart, microcirculation) could have skewed the level of the estimated bivariate interactions in both T1D and control groups. However, the comparative statistical analysis of each measure across the two groups may take care of this skewness if it were in the same direction in both groups, per interaction.
In summary, we found that in both control and T1D subjects, breathing had greater influence on the heart and peripheral microvascular perfusion, compared to the opposite directional couplings and that, by both the employed methods of connectivity analysis, the causal influence of the respiratory activity on the heart was significantly decreased (p < 0.05) in T1D patients compared to the control group. These preliminary results can be linked to established comorbidities of T1D and, although obtained from a limited number of subjects, provide a strong indication for the usefulness of a network-based multi-modal analysis for the development of biomarkers from short-duration data, and for monitoring the disease and T1D-related complications over time, as well as its potential in the exploration of the pathophysiological mechanisms that underlie this devastating and very widespread disease.
Data Availability Statement
The raw data supporting the conclusion of this article will be made available by the authors, without undue reservation.
Ethics Statement
Ethical review and approval was not required for the study on human participants in accordance with the local legislation and institutional requirements. Written informed consent to participate in this study was provided by the participants’ legal guardian/next of kin.
Author Contributions
MS collected and shared data with United States site, conceptualized and performed the dynamical Bayesian inference, in addition to compiling and preparing results for publication. TH conceptualized and performed the directed transfer function analysis in addition to compiling and preparing results for publication. LI gave input and expertise on signal processing and analysis, and assisted with full preparation and review of the manuscript. LB provided expertise on data, disease state, and analytical decisions in addition to preparation and review of the manuscript. All authors contributed to review and revision of results and final manuscript.
Funding
This work was supported by grants from United States’s National Science Foundation (NSF EPSCoR grant OIA 1632891 to LI) and Fondazione Cassa di Risparmio di Firenze (grants number 2015.0914 and 2017.0800).
Conflict of Interest
The authors declare that the research was conducted in the absence of any commercial or financial relationships that could be construed as a potential conflict of interest.
Publisher’s Note
All claims expressed in this article are solely those of the authors and do not necessarily represent those of their affiliated organizations, or those of the publisher, the editors and the reviewers. Any product that may be evaluated in this article, or claim that may be made by its manufacturer, is not guaranteed or endorsed by the publisher.
References
Aalkjaer, C., Boedtkjer, D., and Matchkov, V. (2011). Vasomotion - What Is Currently Thought? Acta Physiol. 202, 253–269. doi:10.1111/j.1748-1716.2011.02320.x
Adkinson, J. A., Karumuri, B., Hutson, T. N., Liu, R., Alamoudi, O., Vlachos, I., et al. (2018). Connectivity and Centrality Characteristics of the Epileptogenic Focus Using Directed Network Analysis. IEEE Trans. Neural Syst. Rehabil. Eng. 27 (1), 22–30. doi:10.1109/TNSRE.2018.2886211
Baccalá, L. A., de Brito, C. S., Takahashi, D. Y., and Sameshima, K. (1997). Unified Asymptotic Theory for All Partial Directed Coherence Forms. Philos. Trans. A. Math. Phys. Eng. Sci. 371, 20120158. doi:10.1098/rsta.2012.0158
Baccalá, L. A., Sameshima, K., and Takahashi, D. (2007). “Generalized Partial Directed Coherence,” in 2007 15th International Conference on Digital Signal Processing, Cardiff, UK, 1-4 July 2007, 3, 163–166. doi:10.1109/icdsp.2007.4288544
Baccalá, L. A., Takahashi, D. Y., and Sameshima, K. (2016). Directed Transfer Function: Unified Asymptotic Theory and Some of its Implications. IEEE Trans. Biomed. Eng. 63 (12), 2450–2460. doi:10.1109/tbme.2016.2550199
Blinowska, K. J., Kamiński, M., Brzezicka, A., and Kamiński, J. (2013). Application of Directed Transfer Function and Network Formalism for the Assessment of Functional Connectivity in Working Memory Task. Philos. Trans. A. Math. Phys. Eng. Sci. 371, 20110614. doi:10.1098/rsta.2011.0614
Clemson, P., Lancaster, G., and Stefanovska, A. (2016). Reconstructing Time-Dependent Dynamics. Proc. IEEE 104 (2), 223–241. doi:10.1109/jproc.2015.2491262
Dampney, R. (2017). Central Mechanisms Regulating Coordinated Cardiovascular and Respiratory Function. Oxford Res. Encyclopedia Neurosci. 1, 1–27. doi:10.1093/acrefore/9780190264086.013.64
Doria, A., Niewczas, M. A., and Fiorina, P. (2012). Can Existing Drugs Approved for Other Indications Retard Renal Function Decline in Patients with Type 1 Diabetes and Nephropathy? Semin. Nephrol. 32 (5), 437–444. doi:10.1016/j.semnephrol.2012.07.006
Duggento, A., Stankovski, T., McClintock, P. V., and Stefanovska, A. (2012). Dynamical Bayesian Inference of Time-Evolving Interactions: from a Pair of Coupled Oscillators to Networks of Oscillators. Phys. Rev. E Stat. Nonlin Soft Matter Phys. 86, 061126. doi:10.1103/PhysRevE.86.061126
Eckberg, D. L. (2003). The Human Respiratory Gate. J. Physiol. 548 (2), 339–352. doi:10.1113/jphysiol.2002.037192
Faes, L., Porta, A., Cucino, R., Cerutti, S., Antolini, R., and Nollo, G. (2004). Causal Transfer Function Analysis to Describe Closed Loop Interactions between Cardiovascular and Cardiorespiratory Variability Signals. Biol. Cybern. 90 (6), 390–399. doi:10.1007/s00422-004-0488-0
Granger, C. W. J. (1969). Investigating Causal Relations by Econometric Models and Cross-Spectral Methods. Econometrica 37 (3), 424–438. doi:10.2307/1912791
Hilaire, G., and Pásaro, R. (2003). Genesis and Control of the Respiratory Rhythm in Adult Mammals. News Physiol. Sci. 18, 23–28. doi:10.1152/nips.01406.2002
Hutson, T., Pizarro, D., Pati, S., and Iasemidis, L. D. (2018). Predictability and Resetting in a Case of Convulsive Status Epilepticus. Front. Neurol. 9, 172–178. doi:10.3389/fneur.2018.00172
Hutson, T. N., Rezaei, F., Gautier, N. M., Indumathy, J., Glasscock, E., and Iasemidis, L. (2020). Directed Connectivity Analysis of the Neuro-Cardio- and Respiratory Systems Reveals Novel Biomarkers of Susceptibility to SUDEP. IEEE Open J. Eng. Med. Biol. 1, 301–311. doi:10.1109/ojemb.2020.3036544
Iatsenko, D., Bernjak, A., Stankovski, T., Shiogai, Y., Owen-Lynch, P. J., Clarkson, P. B., et al. (2013). Evolution of Cardiorespiratory Interactions with Age. Philos. Trans. A. Math. Phys. Eng. Sci. 371, 20110622. doi:10.1098/rsta.2011.0622
Iatsenko, D., McClintock, P. V. E., and Stefanovska, A. (2016). Extraction of Instantaneous Frequencies from Ridges in Time-Frequency Representations of Signals. Signal. Process. 125, 290–303. doi:10.1016/j.sigpro.2016.01.024
Iatsenko, D., McClintock, P. V. E., and Stefanovska, A. (2015). Linear and Synchrosqueezed Time-Frequency Representations Revisited: Overview, Standards of Use, Resolution, Reconstruction, Concentration, and Algorithms. Digital Signal. Process. 42, 1–26. doi:10.1016/j.dsp.2015.03.004
Jamšek, J., and Stefanovska, A. (2007). “The Cardio-Respiratory Couplings Observed in the LDF Signal Using Wavelet Bispectrum,” in Proceedings of the 29th Annual International Conference of the IEEE EMBS, Lyon, France, 22-26 Aug. 2007, 2007, 4072–4075. doi:10.1109/IEMBS.2007.4353228
Kamiński, M., Ding, M., Truccolo, W. A., and Bressler, S. L. (2001). Evaluating Causal Relations in Neural Systems: Granger Causality, Directed Transfer Function and Statistical Assessment of Significance. Biol. Cybern 85 (2), 145–157. doi:10.1007/s004220000235
Kamiński, M., and Blinowska, K. J. (2014). Directed Transfer Function Is Not Influenced by Volume Conductionâ€"inexpedient Pre-Processing Should Be Avoided. Front. Comput. Neurosci. 8, 61. doi:10.3389/fncom.2014.00061
Klein, O. L., Krishnan, J. A., Glick, S., and Smith, L. J. (2010). Systematic Review of the Association between Lung Function and Type 2 Diabetes Mellitus. Diabetic Med. 27 (9), 977–987. doi:10.1111/j.1464-5491.2010.03073.x
Kralemann, B., Frühwirth, M., Pikovsky, A., Rosenblum, M., Kenner, T., Schaefer, J., et al. (2013). In Vivo cardiac Phase Response Curve Elucidates Human Respiratory Heart Rate Variability. Nat. Commun. 4, 2418. doi:10.1038/ncomms3418
Krishnan, B., Vlachos, I., Wang, Z. I., Mosher, J., Najm, I., Burgess, R., et al. (2015). Epileptic Focus Localization Based on Resting State Interictal MEG Recordings Is Feasible Irrespective of the Presence or Absence of Spikes. Clin. Neurophysiol. 126 (4), 667–674. doi:10.1016/j.clinph.2014.07.014
Kvandal, P., Landsverk, S. A., Bernjak, A., Stefanovska, A., Kvernmo, H. D., and Kirkebøen, K. A. (2006). Low-Frequency Oscillations of the Laser Doppler Perfusion Signal in Human Skin. Microvasc. Res. 72, 120–127. doi:10.1016/j.mvr.2006.05.006
Ogurtsova, K., da Rocha Fernandesda, J. D. R., Huang, Y., Linnenkamp, U., Guariguata, L., Cho, N. H., et al. (2017). IDF Diabetes Atlas: Global Estimates for the Prevalence of Diabetes for 2015 and 2040. Diabetes Res. Clin. Pract. 128, 40–50. doi:10.1016/j.diabres.2017.03.024
Palus, M., and Stefanovska, A. (2003). Direction of Coupling from Phases of Interacting Oscillators: An Information-Theoretic Approach. Phys. Rev. E Stat. Nonlin Soft Matter Phys. 67 (2), 055201. doi:10.1103/PhysRevE.67.055201
Penzel, T., Porta, A., Stefanovska, A., and Wessel, N. (2017). Recent Advances in Physiological Oscillations. Physiol. Meas. 38 (5), E1–E7. doi:10.1088/1361-6579/aa6780
Perrella, A., Sorelli, M., Giardini, F., Frassineti, L., Francia, P., and Bocchi, L. (2018). Wavelet Phase Coherence between the Microvascular Pulse Contour and the Respiratory Activity. World Congress Med. Phys. Biomed. Eng. 68 (2), 311–314. doi:10.1007/978-981-10-9038-7_58
Rosenblum, M. G., and Pikovsky, A. S. (2001). Detecting Direction of Coupling in Interacting Oscillators. Phys. Rev. E 64 (4), 045202. doi:10.1103/PhysRevE.64.045202
Sabesan, S., Good, L. B., Tsakalis, K. S., Spanias, A., Treiman, D. M., and Iasemidis, L. D. (2009). Information Flow and Application to Epileptogenic Focus Localization from Intracranial EEG. IEEE Trans. Neural Syst. Rehabil. Eng. 17 (3), 244–253. doi:10.1109/tnsre.2009.2023291
Shaffer, F., and Ginsberg, J. P. (2017). An Overview of Heart Rate Variability Metrics and Norms. Front. Public Health 5, 258. doi:10.3389/fpubh.2017.00258
Sheppard, L. W., Stefanovska, A., and McClintock, P. V. (2012). Testing for Time-Localized Coherence in Bivariate Data. Phys. Rev. E Stat. Nonlin Soft Matter Phys. 85, 046205–046282. doi:10.1103/PhysRevE.85.046205
Shiogai, Y., Stefanovska, A., and McClintock, P. V. (2010). Nonlinear Dynamics of Cardiovascular Ageing. Phys. Rep. 488 (2–3), 51–110. doi:10.1016/j.physrep.2009.12.003
Smith, J. C., Ellenberger, H. H., Ballanyi, K., Richter, D. W., and Feldman, J. L. (1991). Pre-Bötzinger Complex: A Brainstem Region that May Generate Respiratory Rhythm in Mammals. Science 254 (5032), 726–729. doi:10.1126/science.1683005
Söderström, T., Stefanovska, A., Veber, M., and Svensson, H. (2003). Involvement of Sympathetic Nerve Activity in Skin Blood Flow Oscillations in Humans. Am. J. Physiology-Heart Circulatory Physiol. 284, H1638–H1646. doi:10.1152/ajpheart.00826.2000
Stankovski, T., Duggento, A., McClintock, P. V., and Stefanovska, A. (2012). Inference of Time-Evolving Coupled Dynamical Systems in the Presence of Noise. Phys. Rev. Lett. 109 (2), 024101–024105. doi:10.1103/PhysRevLett.109.024101
Stankovski, T., McClintock, P. V. E., and Stefanovska, A. (2014). “Cardiorespiratory Coupling Functions, Synchronization and Ageing,” in 2014 8th Conference of the European Study Group on Cardiovascular Oscillations (ESGCO), Trento, Italy, 25-28 May 2014. doi:10.1109/esgco.2014.6847579
Stefanovska, A., Bracic, M., and Kvernmo, H. D. (1999). Wavelet Analysis of Oscillations in the Peripheral Blood Circulation Measured by Laser Doppler Technique. IEEE Trans. Biomed. Eng. 46 (10), 1230–1239. doi:10.1109/10.790500
Stefanovska, A., and Hožič, M. (2000). Spatial Synchronization in the Human Cardiovascular System. Prog. Theor. Phys. Suppl. 139, 270–282. doi:10.1143/PTPS.139.270
Tankanag, A. V., Grinevich, A. A., Kirilina, T. V., Krasnikov, G. V., Piskunova, G. M., and Chemeris, N. K. (2014). Wavelet Phase Coherence Analysis of the Skin Blood Flow Oscillations in Human. Microvasc. Res. 95, 53–59. doi:10.1016/j.mvr.2014.07.003
Ticcinelli, V., Stankovski, T., Iatsenko, D., Bernjak, A., Bradbury, A. E., Gallagher, A. R., et al. (2017). Coherence and Coupling Functions Reveal Microvascular Impairment in Treated Hypertension. Front. Physiol. 8, 749. doi:10.3389/fphys.2017.00749
Ticcinelli, V., Stankovski, T., McClintock, P. V. E., and Stefanovska, A. (2015). “Ageing of the Couplings between Cardiac, Respiratory and Myogenic Activity in Humans,” in 37th Annual International Conference of the IEEE Engineering in Medicine and Biology Society (EMBC), Milan, Italy, 25-29 Aug. 2015. doi:10.1109/embc.2015.7320093
Toledo, E., Akselrod, S., Pinhas, I., and Aravot, D. (2002). Does Synchronization Reflect a True Interaction in the Cardiorespiratory System? Med. Eng. Phys. 24, 45–52. doi:10.1016/S1350-4533(01)00114-X
Toppi, J., Mattia, D., Risetti, M., Formisano, R., Babiloni, F., and Astolfi, L. (2016). Testing the Significance of Connectivity Networks: Comparison of Different Assessing Procedures. IEEE Trans. Biomed. Eng. 63 (12), 2461–2473. doi:10.1109/TBME.2016.2621668
Vejmelka, M., and Palus, M. (2008). Inferring the Directionality of Coupling with Conditional Mutual Information. Phys. Rev. E 77 (2), 026214. doi:10.1103/PhysRevE.77.026214
Vlachos, I., Krishnan, B., Treiman, D. M., Tsakalis, K., Kugiumtzis, D., and Iasemidis, L. D. (2017). The Concept of Effective Inflow: Application to Interictal Localization of the Epileptogenic Focus from iEEG. IEEE Trans. Biomed. Eng. 64 (9), 2241–2252. doi:10.1109/tbme.2016.2633200
Keywords: directional connectivity, type 1 diabetes (T1D), dynamical Bayesian inference, directed transfer function (DTF), cardio-respiratory system
Citation: Sorelli M, Hutson TN, Iasemidis L and Bocchi L (2022) Linear and Nonlinear Directed Connectivity Analysis of the Cardio-Respiratory System in Type 1 Diabetes. Front. Netw. Physiol. 2:840829. doi: 10.3389/fnetp.2022.840829
Received: 21 December 2021; Accepted: 14 February 2022;
Published: 08 March 2022.
Edited by:
Luca Faes, University of Palermo, ItalyReviewed by:
Mirjana M. Platiša, University of Belgrade, SerbiaMario Lavanga, Aix-Marseille Université, France
Luiz Eduardo Virgilio Silva, Children’s Hospital of Philadelphia, United States
Copyright © 2022 Sorelli, Hutson, Iasemidis and Bocchi. This is an open-access article distributed under the terms of the Creative Commons Attribution License (CC BY). The use, distribution or reproduction in other forums is permitted, provided the original author(s) and the copyright owner(s) are credited and that the original publication in this journal is cited, in accordance with accepted academic practice. No use, distribution or reproduction is permitted which does not comply with these terms.
*Correspondence: Leonardo Bocchi, leonardo.bocchi@unifi.it
†These authors have contributed equally to this work and share first authorship