Full-lung simulations of mechanically ventilated lungs incorporating recruitment/derecruitment dynamics
 Haoran Ma
 Hideki Fujioka
 David Halpern
 Jason H. T. Bates
 Donald P. Gaver III
- 1Department of Biomedical Engineering, Tulane University, New Orleans, LA, United States
- 2Center for Computational Science, Tulane University, New Orleans, LA, United States
- 3Department of Mathematics, University of Alabama, Tuscaloosa, AL, United States
- 4Larner College of Medicine, University of Vermont, Burlington, VT, United States
This study developed and investigated a comprehensive multiscale computational model of a mechanically ventilated ARDS lung to elucidate the underlying mechanisms contributing to the development or prevention of VILI. This model is built upon a healthy lung model that incorporates realistic airway and alveolar geometry, tissue distensibility, and surfactant dynamics. Key features of the ARDS model include recruitment and derecruitment (RD) dynamics, alveolar tissue viscoelasticity, and surfactant deficiency. This model successfully reproduces realistic pressure-volume (PV) behavior, dynamic surface tension, and time-dependent descriptions of RD events as a function of the ventilation scenario. Simulations of Time-Controlled Adaptive Ventilation (TCAV) modes, with short and long durations of exhalation (TLow- and TLow+, respectively), reveal a higher incidence of RD for TLow+ despite reduced surface tensions due to interfacial compression. This finding aligns with experimental evidence emphasizing the critical role of timing in protective ventilation strategies. Quantitative analysis of energy dissipation indicates that while alveolar recruitment contributes only a small fraction of total energy dissipation, its spatial concentration and brief duration may significantly contribute to VILI progression due to its focal nature and higher intensity. Leveraging the computational framework, the model may be extended to facilitate the development of personalized protective ventilation strategies to enhance patient outcomes. As such, this computational modeling approach offers valuable insights into the complex dynamics of VILI that may guide the optimization of ventilation strategies in ARDS management.
1 Introduction
Approximately 200,000 acute respiratory distress syndrome (ARDS) cases occur annually in U.S. (prior to COVID-19), with a mortality of 40% (Rubenfeld et al., 2005; Maybauer et al., 2006). Supportive care centered around mechanical ventilation is the foundation of ARDS treatment, but this itself can damage the lung, leading to ventilator-induced lung injury (VILI). The ARDSNet Protocol reduces tidal volume and plateau pressure to avoid overdistension (OD) of healthy tissue (volutrauma) and applies positive end-expiratory pressure (PEEP) to minimize atelectrauma (Brower et al., 2000). Nevertheless, the mortality rate for ARDS remains unacceptably high.
One of the principal mechanisms driving VILI is the occurrence of repetitive recruitment of lung units that derecruit during expiration. These events generate injurious stresses on the airway and alveolar epithelium that degrade the epithelial barrier in a spatially heterogeneous manner, particularly when pulmonary surfactant function is already compromised by leakage of fluid and proteins from the blood plasma. Once this process begins in earnest it leads to further barrier degradation, increased fluid leakage, and progressively worsening VILI (Jacob et al., 1985; Yamaguchi et al., 2022). Eventually, large areas of the lung become destabilized (Gaver et al., 2020) with concomitant effects on overall lung function. This type of lung injury is known as atelectrauma.
Atelectrauma plays out over a distributed network of airways and alveoli and involves effects manifesting over a wide range of length scales from the molecular (surfactant) to that of the individual epithelial cell to the entire organ. Understanding these complexities and their ultimate consequences for the lung is a considerable challenge. The premise of our research is that meeting these challenges can be greatly facilitated by computational models incorporating the known multi-scale network anatomy and physiology of the lung. Accordingly, in the present study we develop such a model by drawing on our prior modeling work on the interactions between different multiscale pulmonary components (Ma et al., 2020), tethering interactions between the parenchyma and airway wall (Ryans et al., 1985), the non-compliant closure of airways involving liquid plug propagation in 2D airway networks (Ryans et al., 2016), and a time-dependent approach to simulate recruitment and derecruitment (Massa et al., 1985). We demonstrate how the resulting model can provide insight into the nature of VILI development during specific modes of mechanical ventilation, and how this development is linked to energy dissipation within the lung. Our goal is to provide a tool that can assist in identifying personalized ventilation strategies for reducing VILI.
2 Materials and methods
Below, we first present our base model in §2.1, which was previously used to simulate a “healthy lung” (Ma et al., 2020). We next modify this base model to create a model of Acute Respiratory Distress Syndrome (ARDS). To accurately simulate the lung’s response to mechanical ventilation in ARDS, we introduce a model of recruitment/derecruitment (RD) behavior at the acinar level through a fractional representation of alveolar collapse within sub-acinar units (§2.2). This behavior dynamically affects the compliance of both specific lung regions and the overall lung. We investigate this behavior by simulating mechanical ventilation using time-controlled adaptive ventilation (TCAV), a form of airway pressure release ventilation (APRV), which has been used to study experimentally the physiological impact of RD and overdistension (OD) in ARDS porcine models (Nieman et al., 2022; Ramcharran et al., 2022). Through our simulations, we examine the occurrence of RD events under different ventilation scenarios and analyze the energy delivery and dissipation that may be associated with VILI. In §5 we provide a Glossary to enhance clarity. In the supplementary, we provide an Appendix that provides specific details of the foundational health lung model based on (Ma et al., 2020).
2.1 Base model
Our multiscale base model includes spatial scales from the organ-level to the molecular level and allows for temporal resolution to the millisecond timescale. Figure 1 illustrates the interconnections of the different components, including.
1) Airflow in the respiratory tree and acini,
2) Tissue behavior including viscoelasticity,
3) Interdependence between airways and alveoli, and
4) Liquid-lining and surfactant dynamics.
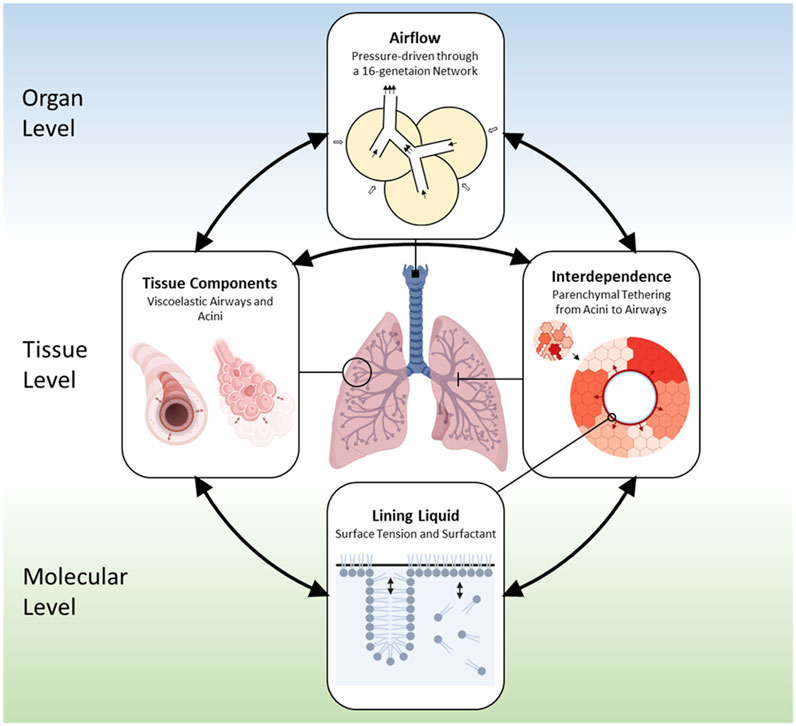
FIGURE 1. Outline of the base model (Ma et al., 2020). The domain of the lung has a bronchial tree with 16 generations. Components in the model include: 1) Air components, which represent air spaces and airflow; 2) Tissue components, which include compliant airways, acini, and their parenchymal connection; 3) Liquid components, which consist of the liquid lining on the inner tissue wall of the compliant tissue and the soluble surfactant that exist in a multilayer structure.
These components create a large set (O (106)) of coupled time-dependent equations that evolve depending on the forcing in the system. For normal breathing, this forcing arises from the time-dependent pleural pressure
2.1.1 Lung domain
The bronchial tree is created using an anatomically-based space-filling algorithm (Tawhai et al., 2000) that creates an asymmetric network with 16 Horsfield generations as a half-lung within a 3D space. Each airway is compliant, liquid-lined, and terminates with an acinus (described in detail below) that is formed from liquid lined compliant alveoli that are space filling within the lung domain. The Horsfield generation (
2.1.2 Airflow in airways and acinus
Airflow in the compliant bronchial tree and alveoli is driven by pressure differences throughout the network. We assume uniform flow in each generation following Eq. 1, where the flowrate
Here
The airway network creates a system of flow equations that satisfy conservation of mass between parent and daughter generations, with the airflow through a terminal airway equal to the airflow into its attached acinus. The endpoints of the network are the trachea and acini, with the acinar pressure linked to its volume through its compliance (see below). As the volume cycles, the internal pressures and airflow vary as a function of both the forcing and the compliance of the system, the latter being determined by tissue components and interdependence, which are described next.
2.1.3 Compliant tissue components and interdependence
Tissue components are comprised of airways and alveoli. The bronchial tree consists of airways that are modeled as compliant vessels with a morphology based on (Lambert, 1984). The airway compliance is described by a tube law that is a function of the local airway transmural pressure,
The mechanical interdependence between airways and alveoli is a critical feature that can help to stabilize the lung (Anafi and Wilson, 2001), though it may also result in localized stress concentrations in the parenchyma (Vlahakis and Hubmayr, 2005). We model interdependence based upon our earlier finite-element analysis (Ryans et al., 1985), which established that the airway transmural pressure
Here
Interdependence arises from the term
For acini, the transmural pressure
where
2.1.4 Lining fluid and surfactant components
Because alveoli are small, the dynamic surface tension of the lining fluid plays a very large role in lung mechanics. We model soluble surfactant as existing in a bulk and a multilayer structure at the air-liquid interface where transport between the bulk and interface dynamically modifies the surface tension, as has been described in (Krueger and Gaver, 2000) and in our healthy lung model (Ma et al., 2020) (see Supplementary Material).
As stated above, surface tension affects the compliant response of the tissue components. And, in turn, the change in tissue geometry affects the air-liquid surface area which dynamically modulates the surfactant distribution which influences the mechanical stresses. This physicochemical feedback mechanism contributes to the pressure-volume behavior observed experimentally (Mead et al., 1957) and is replicated in our healthy lung model (Ma et al., 2020).
2.2 The ARDS model—An acinar recruitment/derecruitment model
Given the baseline model described above, we now modify this with pathological characteristics as a model of ARDS. In this model, we simulate two aspects of ARDS: 1) surfactant dysfunction, and 2) the resulting RD at the acinar level.
2.2.1 Surfactant dysfunction (
Surfactant dysfunction is modeled to first order by a reduced surfactant concentration. To do so, we introduce the variable
2.2.2 Sub-acinar units
We subdivide each acinus into
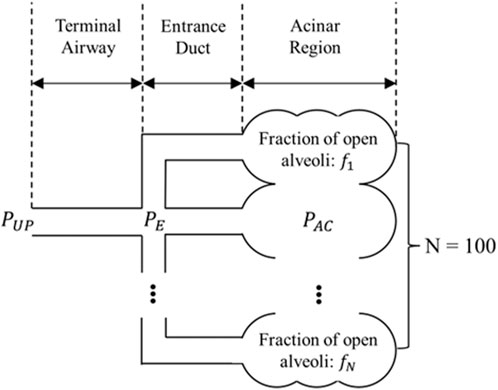
FIGURE 2. Sub-acinar units (sACs) connected to a terminal airway. Each sAC consists of an entrance duct and its downstream alveolar cluster. These alveolar clusters are interconnected and as a whole follow the PV relationship decribed by Supplementary Eqs 7, 8 in the Appendix.
Here,
where
In our simulations, we assume that all acini are initially open so that the initial
2.2.3 Acinar recruitment/derecruitment (
We now incorporate a model of acinar RD that represents a dynamic conversion from a derecruited to a recruited state, and vice versa. To do so, we introduce
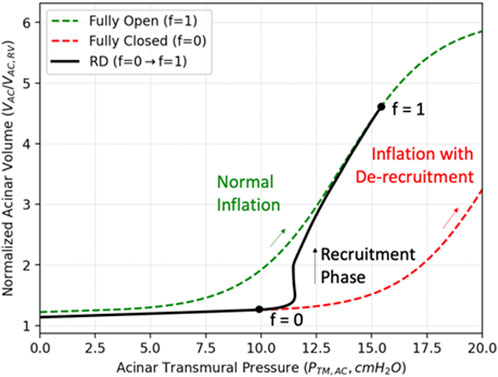
FIGURE 3. Compliance recovery during recruitment. The green curve describes the PV relationship for a completely recruited acinus during inflation (
To model this fractional recruitment process, we borrow from the formalism of the Bates “virtual trajectory” model (Massa et al., 1985) to quantify the fraction of recruited alveoli in each sAC with the time-dependent variable
We assume that the rate of change of the open fraction,
where
The value of
where
In addition to airway resistance, RD may also affect the acinar compliance (Hickling, 1998). We use an approach comparable to Eq. 11 to describe the compliance (PV relationship) change of the entire interconnected acinar region by
where
2.2.4 Energy dissipation
We estimate the energy dissipation due to RD (
where
2.2.5 Parameter estimation
We estimated the closing pressure
We estimate the opening pressure,
We estimated a baseline
In order to prevent all sACs from acting identically, we distributed
2.3 Computational tools
The solution vector for an airway object (
For an acinus object (
The lining liquid of each airway and acinus is modeled by a surfactant object. For a surfactant object (
In addition to the individual airway, acinus, and surfactant components, air pressures at each bifurcation in the airway tree are solved by the approach introduced in 2.1. In total, the differential-algebraic equation system includes −150 k unknowns with respective governing equations described above.
High-performance computing simulations were conducted on the Tulane University Cypress supercomputer. The code was written in C++ with the parallel MPI library. The differential-algebraic equation systems solver used in the code was SUNDIALS IDAS solver with adaptive time-stepping (Hindmarsh et al., 2005). The simulation utilized 10 Intel Xeon E5-2,680 v2 CPUs. Wall time for one simulation (60 s of breathing) was up to 6 h.
2.4 Simulation protocols
We explore our ARDS model by conducting simulations of time-controlled adaptive ventilation (TCAV), which has been suggested as a personalized method for mechanical ventilation (Nieman et al., 2020). TCAV represents a variant of airway pressure release ventilation (APRV) where the exhalation phase duration (
To explore ARDS, we set
• TLow+: 25% MEFR provides a long
• TLow−: 75% MEFR conversely provides a short
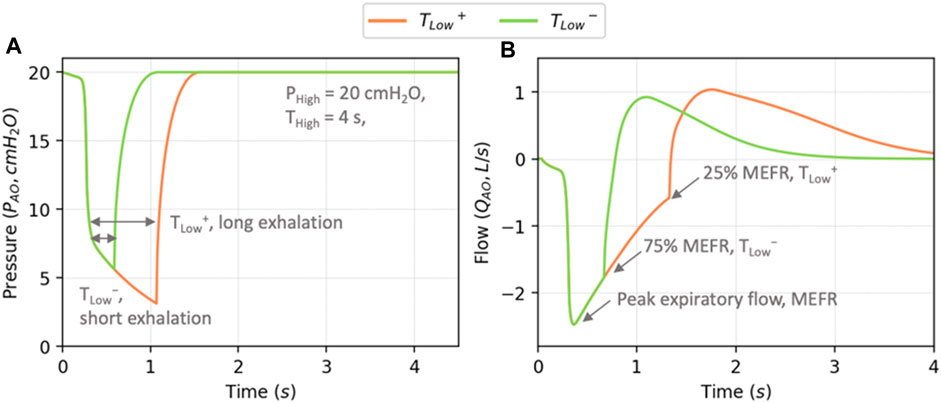
FIGURE 4. Example profiles of airway opening pressure
The ARDS model was initiated with all airways and alveoli in the open state, with the surfactant level
3 Results and discussion
In this section, we show results from the TLow+ and TLow− protocols for different levels of
3.1 Lung volumes
Figure 5A shows the behavior of V(t) for TLow+ and TLow− with
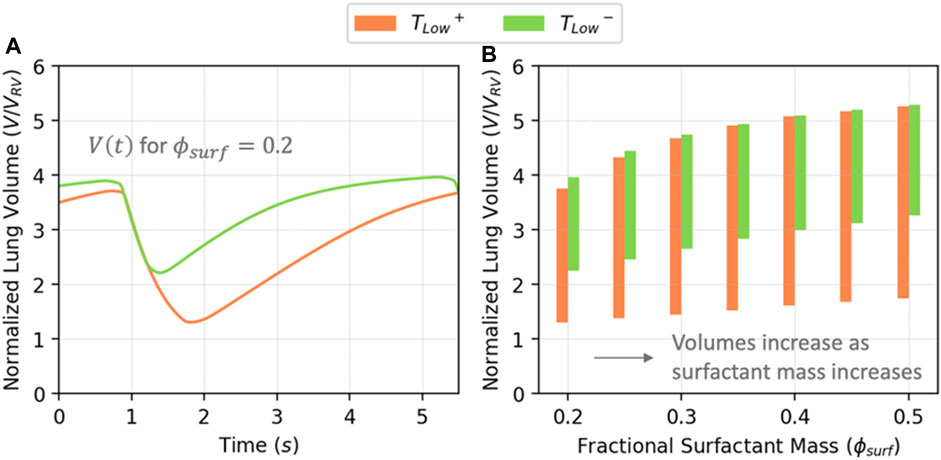
FIGURE 5. (A) Normalized lung volume vs. time for
Figure 6 illustrates PV relationships for
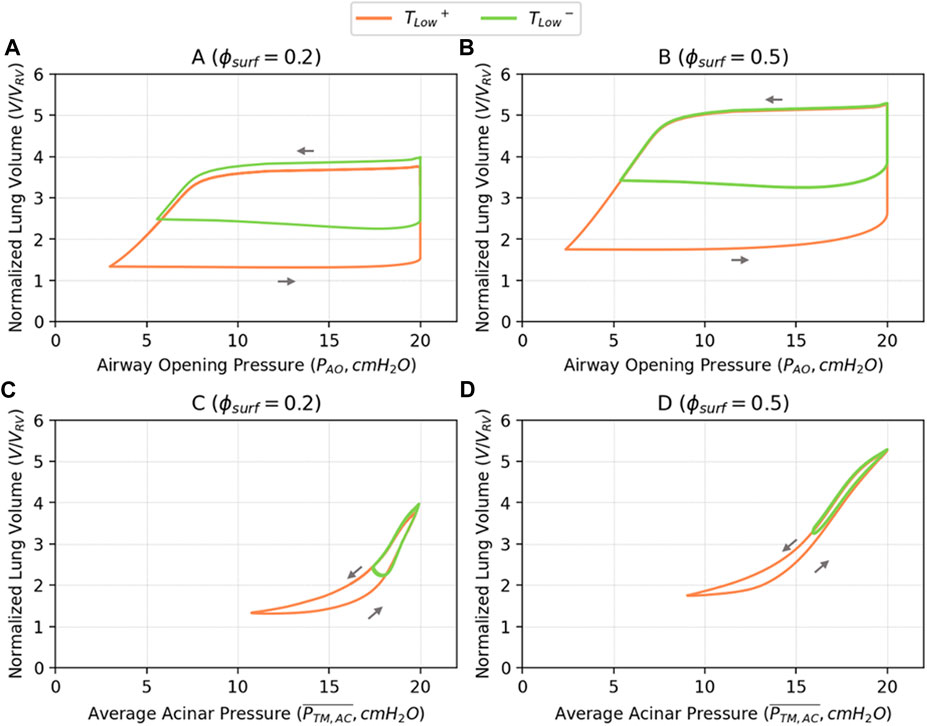
FIGURE 6. Pressure-volume relationships based on airway opening pressure (
3.2 Surfactant behavior
Figure 7 illustrates the correlation between
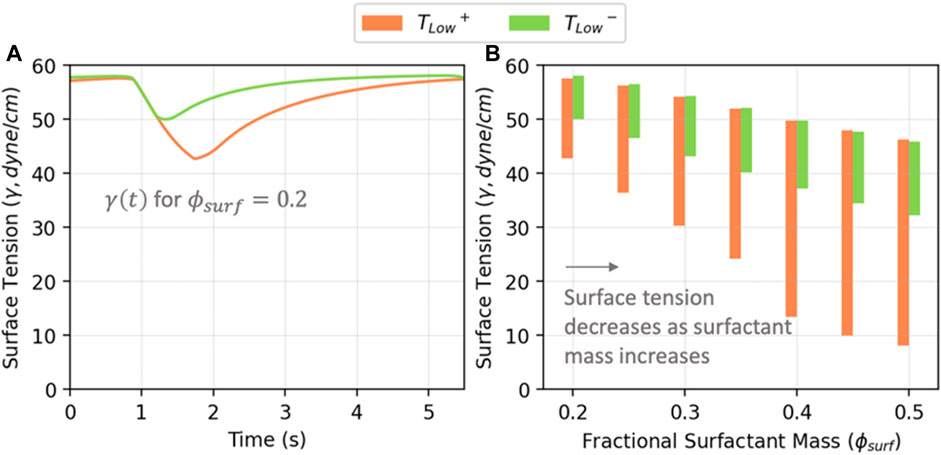
FIGURE 7. (A) Average surface tension vs. time in acini for
3.3 Recruitment and derecruitment
Figure 8A illustrates the recruitment/derecruitment patterns obtained by ventilating with TLow+ and TLow− in relation to
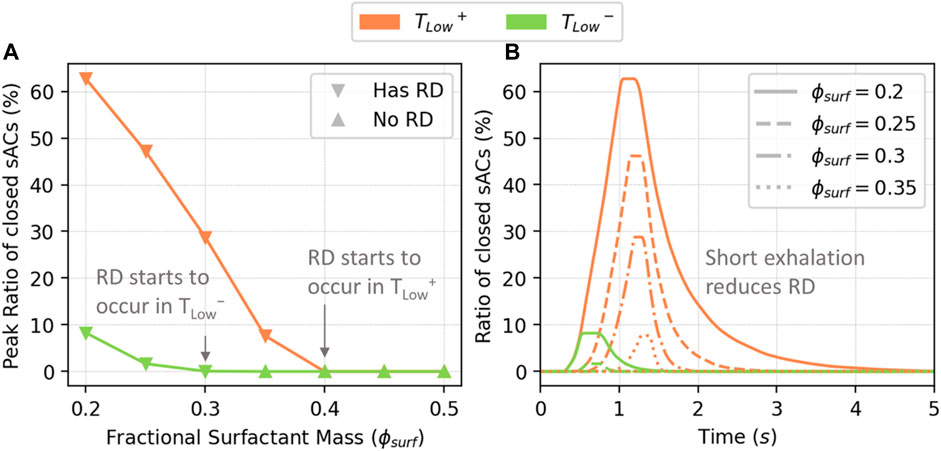
FIGURE 8. The peak percentage of closed sACs (A), and closed sACs vs. time (B). RD starts to occur in TLow+ when
We note that the global behavior shown in Figure 8B is a result from the local acinar behavior that is highly heterogeneous. Figure 9 demonstrates the percentage of closed sACs in the acinar regions from the simulation of
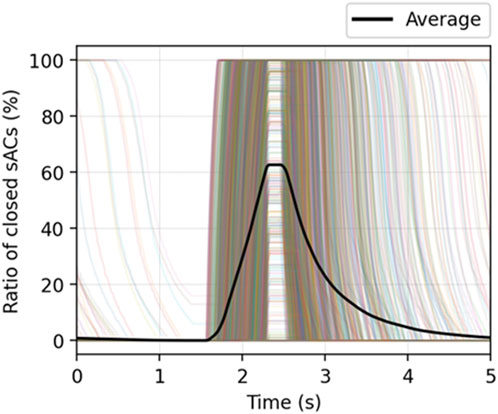
FIGURE 9. The percentage of closed sACs in the acinar regions from the simulation of
Our model demonstrates dynamics that are representative of an ARDS lung, including elevated pulmonary elastance and recruitment events. Herein we examine the implications and limitations of this model.
3.4 Energy dissipation
Recently, there has been a great deal of interest in the hypothesis that energy delivery and/or dissipation during mechanical ventilation is responsible for ventilator-induced lung injury (VILI) (Gattinoni et al., 2017; Barnes et al., 2018; Barnes and Enk, 2019). This is reasonable since energy is required to disrupt and damage any mechanical system. In the context of the lung, energy dissipation could disrupt regions of the lung and spawn further catastrophic damage (Gaver et al., 2020). During mechanical ventilation, the total work of breathing represents the energy dissipated throughout a breathing cycle (
1)
2)
While these components are difficult to assess in vivo, our integrated multiscale model can provide a testbed to evaluate the relative contributions and locations of each.
The total energy dissipation
Figure 10 demonstrates
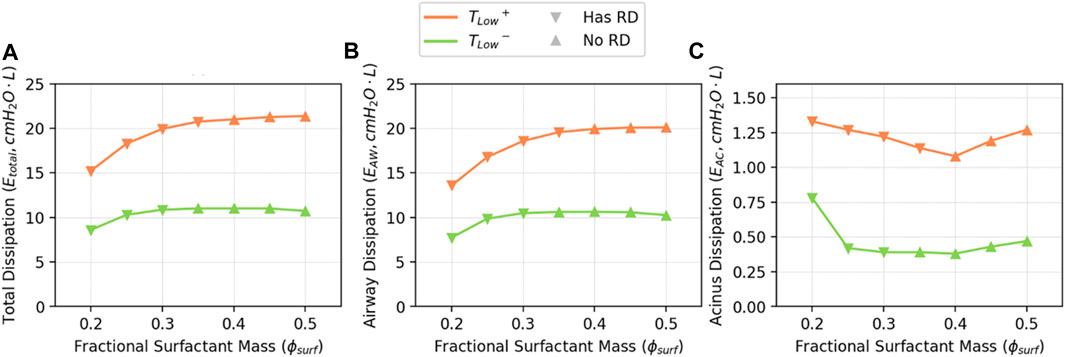
FIGURE 10. Estimated
In Figure 11, we illustrate the estimated energy dissipation resulting from airway and alveolar recruitment (
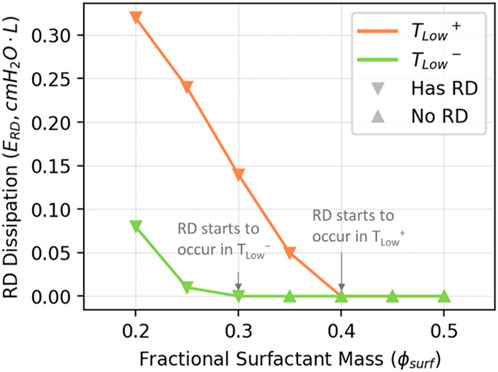
FIGURE 11. Estimated
Given its small contribution to total energy dissipation, how can
3.5 Surfactant dynamics
To understand the implications of RD energy dissipation, it is necessary to elucidate how surfactant dysfunction and lung pathophysiology interact. As shown in Figure 7B, as the amount of surfactant in the system increases, both the maximum and minimum surface tensions decrease, as does the surface tension range. We demonstrate this with
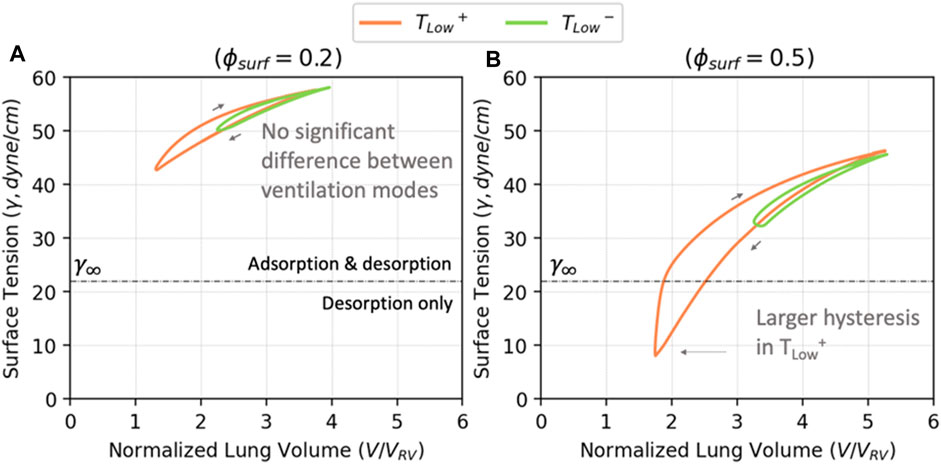
FIGURE 12. The volume—surface tension relationship for
Figure 12A demonstrates that for
The hysteresis loops in Figure 12 show that TLow+ results in lower minimum surface tensions than TLow−, but this does not directly relate to alveolar stability (Figure 8). Figure 13 explores the relationship between minimum surface tension and the peak RD, revealing the critical minimum surface tension (
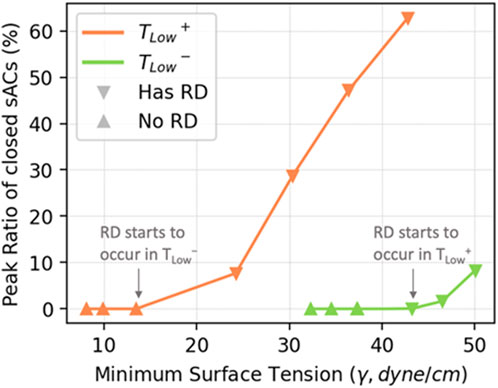
FIGURE 13. The relationship between minimum surface tension and the peak level of RD in simulated cases. The peak level of RD is proportional to the minimum surface tension within each ventilation mode.
3.6 Limitations
Our model has limitations that require consideration to assess the validity of the predictions. These limitations stem from the reliance on a substantial number of parameters, some of which are inferred on the basis of known physiological but lack experimental reference values or may vary within the lung or among patients. We estimate the values of these parameters through idealized assumptions that provide physiologically reasonable behavior in a healthy lung model. Our multi-scale model integrates reduced-dimension representations of micro-scale phenomena. Although these models are grounded in physics, they simplify the dynamic physicochemical interactions at the smallest scales, such as recruitment dynamics, despite the large number of interactions.
In developing our ARDS model, we made rational and simplified modifications to our existing healthy lung model. For instance, we addressed surfactant dysfunction by globally reducing surfactant function using the parameter
To model RD, we adapted a time-dependent model (Massa et al., 1985) by incorporating physically justifiable opening and closing pressures, and trajectory velocities. This model used a single acinar entrance region connected to subtended sub-acinar units (sACs) that exhibit fractional measures of RD. However, this representation does not account for potential interactions between acini, the airflow among alveolar regions and liquid fluxes. Another variation of this trajectory model has recently been published in (Geitner et al., 2022).
The current modeling approach does not account for the microscale fluid dynamics occurring in the small airways, the surfactant fluxes, and the interfacial instabilities of the lining liquid. These factors can trigger the development of liquid plugs. Plugs can also cause airway collapse. Recruitment of collapsed airways is achieved by a finger of air that separates the walls that are held in apposition. These types of events can increase flow resistance dramatically. While single events of this nature have been modeled computationally (Halpern and Grotberg, 1992; Gaver et al., 1996; Halpern and Gaver, 2012; Filoche et al., 2015; Fujioka et al., 2016; Ryans et al., 2016), including this level of complexity in a network model is not yet computationally feasible. Consequently, our model cannot currently simulate the microscale fluid mechanical interactions occurring at the time scale of individual recruitment events. As such, the present model does not completely represent the dynamic complexity of the diseased lung, and likely underestimates energy dissipation from RD. In addition, we are neglecting fluid flow across the blood-gas barrier, which can modulate surfactant function. Fluid flow itself can be influenced by surface tension effects that modify Starling pressure gradients. This could influence the course of injury development (Beretta et al., 2021).
Overdistension is represented by viscoelastic models of distensible alveolar tissue stress-strain behavior, however this does not include a damage mechanism that would change the elastic tissue properties and dissipate energy in the process. We also have not yet included mechanical stress concentrations that could exist at the interface between recruited and derecruited alveolar regions, which may lead to microscale tissue distension and tissue damage. This can contribute to ventilator-induced lung injury (VILI) through microfluidic interactions and biomechanical stresses that may lead to injury progression processes such as those proposed by (Gaver et al., 2020).
Nevertheless, this idealized model is employed to investigate and highlight the behavior of ARDS in comparison to a healthy lung and provide insight into biophysical interactions that cannot be experimentally measured. The simulation results demonstrate qualitative similarities to those obtained from animal experiments (Nieman et al., 2020). The future validation and improvement of this model will rely on the availability of relevant real-world data and the efficacy of parameter fitting.
4 Conclusion
In this study, we present a computational model to investigate the multiscale network behavior of a lung afflicted with ARDS. To do so, we modified a healthy lung model (Ma et al., 2020), and integrated acinar mechanics that includes viscoelastic tissue behavior and recruitment/derecruitment dynamics. Our model successfully reproduces realistic PV behavior and predicts RD events. Simulations of Time-Controlled Adaptive Ventilation (TCAV) modes with either short or long duration exhalation (TLow− and TLow+, respectively) illustrate a significantly increased incidence of RD for TLow+ despite the reduction in surface tensions due to interfacial compression. This finding aligns with experimental investigations that emphasize the importance of timing, in addition to pressure, in protective ventilation strategies (Ramcharran et al., 2022).
A benefit of this computational approach is its capacity to evaluate processes that are challenging to measure in vivo. We showcase its capacity to evaluate the energy dissipation landscape with a breakdown of energy dissipation from airflow, acinar tissue viscoelastic and surfactant transport, and RD mechanisms. Our simulations reveal that the majority of energy dissipation occurs from airflow, while a mere 2%–3% stems from RD. Nevertheless, the association of RD to atelectrauma in VILI suggests that RD-related energy dissipation may be far more injurious than other forms of dissipation due to its focal nature, resulting in a higher energy transfer intensity.
Our model is able to predict recruitment events that occur in quick succession during inhalation (Figure 8B). This resembles the “avalanche” behavior described in (Suki et al., 1994). However, the microscale pattern of the “avalanches” in (Baudoin et al., 2013; Stewart and Jensen, 2015) requires tracking liquid lining flows and surfactant transport at the airway level, which is not included in our current model. The excessive mechanical stress on epithelial cells due to plug propagation and rupture have been investigated in (Bilek et al., 2003; Kay et al., 2004; Ghadiali and Gaver, 2008) and cannot yet be investigated with our model. Nevertheless, our model provides a multiscale platform that can be expanded by utilizing those studies as “building blocks” by interconnecting the microscale, mesoscale and macroscale interactions to elucidate how physicochemical properties affect this behavior. This may be valuable in designing the ventilation strategy and managing the local recruitment events.
This in silico study is based upon parameter estimates that are intended to illustrate the potential of this model paradigm. Despite the non-specific approach, the results show similarity to on-going analyses of animal model experiments of ARDS (Ramcharran et al., 2022). Going forward, it may be feasible to employ this methodology within a physics-inspired machine-learning framework that adheres to fundamental physical conservation principles. The proposed framework has the potential to ascertain parameter values and distributions that enhance the representation of physiological features while also identifying mechanisms through which biomechanical stress concentrations contribute to an increased propensity for lung damage. Consequently, this process may facilitate the development of patient-specific models of mechanically ventilated lungs, which could be leveraged to create personalized ventilation strategies for mitigating VILI.
Data availability statement
The raw data supporting the conclusion of this article will be made available by the authors, without undue reservation.
Author contributions
HM: Writing–original draft, Writing–review and editing. HF: Writing–review and editing. DH: Writing–review and editing. JB: Writing–review and editing. DG: Writing–review and editing.
Funding
The author(s) declare financial support was received for the research, authorship, and/or publication of this article. Supported by NSF CBET 1706801 and NIH 1R01 HL142702. Portions of this research were conducted on the Tulane University Cypress supercomputer.
Conflict of interest
The authors declare that the research was conducted in the absence of any commercial or financial relationships that could be construed as a potential conflict of interest.
The authors JB and DG declared that they were editorial board members of Frontiers at the time of submission. This had no impact on the peer review process and the final decision.
Publisher’s note
All claims expressed in this article are solely those of the authors and do not necessarily represent those of their affiliated organizations, or those of the publisher, the editors and the reviewers. Any product that may be evaluated in this article, or claim that may be made by its manufacturer, is not guaranteed or endorsed by the publisher.
Supplementary material
The Supplementary Material for this article can be found online at: https://www.frontiersin.org/articles/10.3389/fnetp.2023.1257710/full#supplementary-material
References
Anafi, R. C., and Wilson, T. A. (2001). Airway stability and heterogeneity in the constricted lung. J. Appl. Physiology 91 (3), 1185–1192. doi:10.1152/jappl.2001.91.3.1185
Barnes, T., and Enk, D. (2019). Ventilation for low dissipated energy achieved using flow control during both inspiration and expiration. Trends Anaesth. Crit. Care 24, 5–12. doi:10.1016/j.tacc.2018.09.003
Barnes, T., van Asseldonk, D., and Enk, D. (2018). Minimisation of dissipated energy in the airways during mechanical ventilation by using constant inspiratory and expiratory flows–flow-controlled ventilation (FCV). Med. Hypotheses 121, 167–176. doi:10.1016/j.mehy.2018.09.038
Bastacky, J., Lee, C. Y., Goerke, J., Koushafar, H., Yager, D., Kenaga, L., et al. Alveolar lining layer is thin and continuous: low-temperature scanning electron microscopy of rat lung. J. Appl. Physiol. (1985). 79(5): p. 1615–1628. doi:10.1152/jappl.1995.79.5.1615
Baudoin, M., Song, Y., Manneville, P., and Baroud, C. N. (2013). Airway reopening through catastrophic events in a hierarchical network. Proc. Natl. Acad. Sci. 110 (3), 859–864. doi:10.1073/pnas.1211706110
Beretta, E., Romanò, F., Sancini, G., Grotberg, J. B., Nieman, G. F., and Miserocchi, G. (2021). Pulmonary interstitial matrix and lung fluid balance from normal to the acutely injured lung. Front. physiology 12, 781874. doi:10.3389/fphys.2021.781874
Bilek, A. M., Dee, K. C., and Gaver, D. P. (2003). Mechanisms of surface-tension-induced epithelial cell damage in a model of pulmonary airway reopening. J. Appl. physiology 94 (2), 770–783. doi:10.1152/japplphysiol.00764.2002
Brower, R. G., Matthay, M. A., Morris, A., Schoenfeld, D., Thompson, B. T., and Wheeler, A. (2000). Acute respiratory distress syndrome. Vent. Low. tidal volumes as Comp. traditional tidal volumes acute lung Inj. acute Respir. distress syndrome N Engl J Med 342 (18), 1301–1308. doi:10.1056/NEJM200005043421801
Cressoni, M., Chiurazzi, C., Gotti, M., Amini, M., Brioni, M., Algieri, I., et al. (2015). Lung inhomogeneities and time course of ventilator-induced mechanical injuries. Anesthesiology 123 (3), 618–627. doi:10.1097/ALN.0000000000000727
Fernsler, J. G., and Zasadzinski, J. A. (2009). Competitive adsorption: a physical model for lung surfactant inactivation. Langmuir 25 (14), 8131–8143. doi:10.1021/la8039434
Filoche, M., Tai, C. F., and Grotberg, J. B. (2015). Three-dimensional model of surfactant replacement therapy. Proc. Natl. Acad. Sci. U. S. A. 112 (30), 9287–9292. doi:10.1073/pnas.1504025112
Fujioka, H., Halpern, D., and Gaver, D. P. (2013). A model of surfactant-induced surface tension effects on the parenchymal tethering of pulmonary airways. J. Biomech. 46 (2), 319–328. doi:10.1016/j.jbiomech.2012.11.031
Fujioka, H., Halpern, D., Ryans, J., and Gaver, D. P. (2016). Reduced-dimension model of liquid plug propagation in tubes. Phys. Rev. Fluids 1 (5), 053201. doi:10.1103/physrevfluids.1.053201
Gattinoni, L., Marini, J. J., Collino, F., Maiolo, G., Rapetti, F., Tonetti, T., et al. (2017). The future of mechanical ventilation: lessons from the present and the past. Crit. Care 21 (1), 183. doi:10.1186/s13054-017-1750-x
Gattinoni, L., and Pesenti, A. (2005). The concept of "baby lung. Intensive Care Med. 31 (6), 776–784. doi:10.1007/s00134-005-2627-z
Gaver, D. P., Samsel, R. W., and Solway, J., Effects of surface tension and viscosity on airway reopening. J. Appl. Physiol., 1990. 69(1): p. 74–85. doi:10.1152/jappl.1990.69.1.74
Gaver, D. P., Halpern, D., Jensen, O. E., and Grotberg, J. B. (1996). The steady motion of a semi-infinite bubble through a flexible-walled channel. J. Fluid Mech. 319, 25–65. doi:10.1017/s0022112096007240
Gaver, D. P., Nieman, G. F., Gatto, L. A., Cereda, M., Habashi, N. M., and Bates, J. H. (2020). The poor get POORer: a hypothesis for the pathogenesis of ventilator-induced lung injury. Am. J. Respir. Crit. Care Med. 202, 1081–1087. (ja). doi:10.1164/rccm.202002-0453CP
Geitner, C. M., Becher, T., Frerichs, I., Weiler, N., Bates, J. H., and Wall, W. A., An approach to study recruitment/derecruitment dynamics in a patient-specific computational model of an injured human lung. arXiv preprint arXiv:2212.01114, 2022.
Ghadiali, S. N., and Gaver, D. P. (2008). Biomechanics of liquid–epithelium interactions in pulmonary airways. Respir. physiology Neurobiol. 163 (1-3), 232–243. doi:10.1016/j.resp.2008.04.008
Halpern, D., and Gaver, D. P. (2012). The influence of surfactant on the propagation of a semi-infinite bubble through a liquid-filled compliant channel. J. Fluid Mech. 698, 125–159. doi:10.1017/jfm.2012.66
Halpern, D., and Grotberg, J. (1992). Fluid-elastic instabilities of liquid-lined flexible tubes. J. Fluid Mech. 244, 615–632. doi:10.1017/s0022112092003227
Halpern, D., and Grotberg, J. B. (1994). Erratum: “surfactant effects on fluid-elastic instabilities of liquid-lined tubes: a model of airway closure” (journal of biomechanical engineering, 1993, 115, pp. 271–277). J. Biomechanical Engineering-Transactions Asme 116 (1), 133. doi:10.1115/1.2895698
Hickling, K. G. (1998). The pressure-volume curve is greatly modified by recruitment. A mathematical model of ARDS lungs. Am. J. Respir. Crit. Care Med. 158 (1), 194–202. doi:10.1164/ajrccm.158.1.9708049
Hindmarsh, A. C., Brown, P. N., Grant, K. E., Lee, S. L., Serban, R., Shumaker, D. E., et al. (2005). SUNDIALS: suite of nonlinear and differential/algebraic equation solvers. ACM Trans. Math. Softw. (TOMS) 31 (3), 363–396. doi:10.1145/1089014.1089020
Ismail, M., Comerford, A., and Wall, W. A. (2013). Coupled and reduced dimensional modeling of respiratory mechanics during spontaneous breathing. Int. J. Numer. Method Biomed. Eng. 29 (11), 1285–1305. doi:10.1002/cnm.2577
Jacob, A. M., and Gaver, D. P., Atelectrauma disrupts pulmonary epithelial barrier integrity and alters the distribution of tight junction proteins ZO-1 and claudin 4. J. Appl. Physiol. (1985). 113(9): p. 1377–1387. doi:10.1152/japplphysiol.01432.2011
Kay, S. S., Bilek, A. M., Dee, K. C., and Gaver, D. P. (2004). Pressure gradient, not exposure duration, determines the extent of epithelial cell damage in a model of pulmonary airway reopening. J. Appl. Physiology 97 (1), 269–276. doi:10.1152/japplphysiol.01288.2003
Knudsen, L., and Ochs, M. (2018). The micromechanics of lung alveoli: structure and function of surfactant and tissue components. Histochem Cell. Biol. 150 (6), 661–676. doi:10.1007/s00418-018-1747-9
Krueger, M. A., and Gaver, D. P. (2000). A theoretical model of pulmonary surfactant multilayer collapse under oscillating area conditions. J. Colloid Interface Sci. 229 (2), 353–364. doi:10.1006/jcis.2000.7029
Lambert, R. K. (1984). Sensitivity and specificity of the computational model for maximal expiratory flow. J. Appl. Physiol. Respir. Environ. Exerc Physiol. 57 (4), 958–970. doi:10.1152/jappl.1984.57.4.958
Lambert, R. K., Wilson, T. A., Hyatt, R. E., and Rodarte, J. R. (1982). A computational model for expiratory flow. J. Appl. Physiology 52 (1), 44–56. doi:10.1152/jappl.1982.52.1.44
Ma, H., Fujioka, H., Halpern, D., and Gaver, D. P. (2020). Surfactant-mediated airway and acinar interactions in a multi-scale model of a healthy lung. Front. Physiology 11 (941), 941. doi:10.3389/fphys.2020.00941
MacIntyre, N. R., Cook, D. J., Ely, E. W., Epstein, S. K., Fink, J. B., Heffner, J. E., et al. (2001). Evidence-based guidelines for weaning and discontinuing ventilatory support: a collective task force facilitated by the American college of chest physicians; the American association for respiratory care; and the American college of critical care medicine. Evidence-based Guidel. weaning discontinuing Vent. support a Collect. task force Facil. by Am. Coll. Chest Physicians; Am. Assoc. Respir. Care; Am. Coll. Crit. Care Med. Chest 120 (), 375S–95S. doi:10.1378/chest.120.6_suppl.375s
Massa, C. B., Allen, G. B., and Bates, J. H., Modeling the dynamics of recruitment and derecruitment in mice with acute lung injury. J. Appl. Physiol. (1985). 105(6): p. 1813–1821. doi:10.1152/japplphysiol.90806.2008
Maybauer, M. O., Maybauer, D. M., and Herndon, D. N. (2006). Incidence and outcomes of acute lung injury. N. Engl. J. Med. 354 (4), 416–7.
Mead, J., Whittenberger, J., and Radford, E. (1957). Surface tension as a factor in pulmonary volume-pressure hysteresis. J. Appl. Physiology 10 (2), 191–196. doi:10.1152/jappl.1957.10.2.191
Nieman, G., Kollisch-Singule, M., Ramcharran, H., Satalin, J., Blair, S., Gatto, L. A., et al. (2022). Unshrinking the baby lung to calm the VILI vortex. Crit. Care 26 (1), 242–314. doi:10.1186/s13054-022-04105-x
Nieman, G. F., Andrews, P., Satalin, J., Wilcox, K., Kollisch-Singule, M., Madden, M., et al. (2018). Acute lung injury: how to stabilize a broken lung. Crit. care 22, 136–211. doi:10.1186/s13054-018-2051-8
Nieman, G. F., Gatto, L. A., Andrews, P., Satalin, J., Camporota, L., Daxon, B., et al. (2020). Prevention and treatment of acute lung injury with time-controlled adaptive ventilation: physiologically informed modification of airway pressure release ventilation. Ann. Intensive Care 10 (1), 3. doi:10.1186/s13613-019-0619-3
Pedley, T., Schroter, R., and Sudlow, M. (1970). The prediction of pressure drop and variation of resistance within the human bronchial airways. Respir. Physiol. 9 (3), 387–405. doi:10.1016/0034-5687(70)90094-0
Prange, H. D. (2003). Laplace's law and the alveolus: a misconception of anatomy and a misapplication of physics. Adv. Physiol. Educ. 27 (1-4), 34–40. doi:10.1152/advan.00024.2002
Putensen, C. (2013). “Chapter 11. Airway pressure release ventilation,” in Principles and Practice of Mechanical Ventilation, 3e. Editor M. J. Tobin (New York, NY: The McGraw-Hill Companies).
Ramcharran, H., Bates, J. H., Satalin, J., Blair, S., Andrews, P. L., Gaver, D. P., et al. (2022). Protective ventilation in a pig model of acute lung injury: timing is as important as pressure. J. Appl. Physiology 133 (5), 1093–1105. doi:10.1152/japplphysiol.00312.2022
Rubenfeld, G. D., Caldwell, E., Peabody, E., Weaver, J., Martin, D. P., Neff, M., et al. (2005). Incidence and outcomes of acute lung injury. N. Engl. J. Med. 353 (16), 1685–1693. doi:10.1056/NEJMoa050333
Ryans, J., Fujioka, H., Halpern, D., and Gaver, D. P. (2016). Reduced-dimension modeling approach for simulating recruitment/de-recruitment dynamics in the lung. Ann. Biomed. Eng. 44 (12), 3619–3631. doi:10.1007/s10439-016-1672-9
Ryans, J. M., Fujioka, H., and Gaver, D. P., Microscale to mesoscale analysis of parenchymal tethering: the effect of heterogeneous alveolar pressures on the pulmonary mechanics of compliant airways. J. Appl. Physiol. (1985). 126(5): p. 1204–1213. doi:10.1152/japplphysiol.00178.2018
Seah, A. S., Grant, K. A., Aliyeva, M., Allen, G. B., and Bates, J. H. (2011). Quantifying the roles of tidal volume and PEEP in the pathogenesis of ventilator-induced lung injury. Ann. Biomed. Eng. 39 (5), 1505–1516. doi:10.1007/s10439-010-0237-6
Stewart, P. S., and Jensen, O. E. (2015). Patterns of recruitment and injury in a heterogeneous airway network model. J. R. Soc. Interface 12 (111), 20150523. doi:10.1098/rsif.2015.0523
Suki, B., Barabási, A.-L., Hantos, Z., Peták, F., and Stanley, H. E. (1994). Avalanches and power-law behaviour in lung inflation. Nature 368 (6472), 615–618. doi:10.1038/368615a0
Tawhai, M. H., Nash, M. P., Lin, C. L., and Hoffman, E. A., Supine and prone differences in regional lung density and pleural pressure gradients in the human lung with constant shape. J. Appl. Physiol. (1985). 107(3): p. 912–920. doi:10.1152/japplphysiol.00324.2009
Tawhai, M. H., Pullan, A. J., and Hunter, P. J. (2000). Generation of an anatomically based three-dimensional model of the conducting airways. Ann. Biomed. Eng. 28 (7), 793–802. doi:10.1114/1.1289457
van Ertbruggen, C., Hirsch, C., and Paiva, M., Anatomically based three-dimensional model of airways to simulate flow and particle transport using computational fluid dynamics. J. Appl. Physiol. (1985). 98(3): p. 970–980. doi:10.1152/japplphysiol.00795.2004
Vlahakis, N. E., and Hubmayr, R. D. (2005). Cellular stress failure in ventilator-injured lungs. Am. J. Respir. Crit. Care Med. 171 (12), 1328–1342. doi:10.1164/rccm.200408-1036SO
Wilson, T. A., and Bachofen, H. (1982). A model for mechanical structure of the alveolar duct. J. Appl. Physiol. Respir. Environ. Exerc Physiol. 52 (4), 1064–1070. doi:10.1152/jappl.1982.52.4.1064
Keywords: acute respiratory distress syndrome (ARDS), ventilator-induced lung injury (VILI), recruitment and derecruitment (RD), pressure-volume (PV) relationship, multiscale computational model
Citation: Ma H, Fujioka H, Halpern D, Bates JHT and Gaver DP III (2023) Full-lung simulations of mechanically ventilated lungs incorporating recruitment/derecruitment dynamics. Front. Netw. Physiol. 3:1257710. doi: 10.3389/fnetp.2023.1257710
Received: 12 July 2023; Accepted: 18 October 2023;
Published: 02 November 2023.
Edited by:
Egidio Paolo Beretta, University of Milano Bicocca, ItalyReviewed by:
Bindi Shah Brook, University of Nottingham, United KingdomChiara Veneroni, Polytechnic University of Milan, Italy
Copyright © 2023 Ma, Fujioka, Halpern, Bates and Gaver. This is an open-access article distributed under the terms of the Creative Commons Attribution License (CC BY). The use, distribution or reproduction in other forums is permitted, provided the original author(s) and the copyright owner(s) are credited and that the original publication in this journal is cited, in accordance with accepted academic practice. No use, distribution or reproduction is permitted which does not comply with these terms.
*Correspondence: Donald P. Gaver, dpg@tulane.edu