Model-based closed-loop control of thalamic deep brain stimulation
 Yupeng Tian1,2,3
  Srikar Saradhi1,2
  Edward Bello4
  Matthew D. Johnson4
  Gabriele D’Eleuterio5
  Milos R. Popovic2,3,6 Milad Lankarany1,2,3,6,7,8*
- 1Krembil Brain Institute—University Health Network, Toronto, ON, Canada
- 2Institute of Biomedical Engineering, University of Toronto, Toronto, ON, Canada
- 3KITE Research Institute, Toronto Rehabilitation Institute - University Health Network, Toronto, ON, Canada
- 4Department of Biomedical Engineering, University of Minnesota, Minneapolis, MN, United States
- 5Institute of Aerospace Studies, University of Toronto, Toronto, ON, Canada
- 6Center for Advancing Neurotechnological Innovation to Application, University Health Network and University of Toronto, Toronto, ON, Canada
- 7Department of Physiology, University of Toronto, Toronto, ON, Canada
- 8Institute of Medical Science, University of Toronto, Toronto, ON, Canada
Introduction: Closed-loop control of deep brain stimulation (DBS) is beneficial for effective and automatic treatment of various neurological disorders like Parkinson’s disease (PD) and essential tremor (ET). Manual (open-loop) DBS programming solely based on clinical observations relies on neurologists’ expertise and patients’ experience. Continuous stimulation in open-loop DBS may decrease battery life and cause side effects. On the contrary, a closed-loop DBS system uses a feedback biomarker/signal to track worsening (or improving) of patients’ symptoms and offers several advantages compared to the open-loop DBS system. Existing closed-loop DBS control systems do not incorporate physiological mechanisms underlying DBS or symptoms, e.g., how DBS modulates dynamics of synaptic plasticity.
Methods: In this work, we propose a computational framework for development of a model-based DBS controller where a neural model can describe the relationship between DBS and neural activity and a polynomial-based approximation can estimate the relationship between neural and behavioral activities. A controller is used in our model in a quasi-real-time manner to find DBS patterns that significantly reduce the worsening of symptoms. By using the proposed computational framework, these DBS patterns can be tested clinically by predicting the effect of DBS before delivering it to the patient. We applied this framework to the problem of finding optimal DBS frequencies for essential tremor given electromyography (EMG) recordings solely. Building on our recent network model of ventral intermediate nuclei (Vim), the main surgical target of the tremor, in response to DBS, we developed neural model simulation in which physiological mechanisms underlying Vim–DBS are linked to symptomatic changes in EMG signals. By using a proportional–integral–derivative (PID) controller, we showed that a closed-loop system can track EMG signals and adjust the stimulation frequency of Vim–DBS so that the power of EMG reaches a desired control target.
Results and discussion: We demonstrated that the model-based DBS frequency aligns well with that used in clinical studies. Our model-based closed-loop system is adaptable to different control targets and can potentially be used for different diseases and personalized systems.
Introduction
Deep brain stimulation (DBS) is a standard therapy for various movement disorders, including Parkinson’s disease (PD) (Limousin et al., 1998), essential tremor (ET) (Dallapiazza et al., 2019), and dystonia (Hung et al., 2007). The thalamic ventral intermediate nucleus (Vim) is the primary surgical target of DBS for ET treatment. The stimulation frequency of clinical Vim–DBS for treating ET is usually chosen to be
A closed-loop DBS control system consists of three essential components: (i) input DBS pulses; (ii) output feedback, i.e., the biomarker observed during DBS; and (iii) feedback control, which adjusts the DBS parameters based on the feedback biomarker (Arlotti et al., 2016; Little and Brown, 2012; Grado et al., 2018). Such a system offers an automatic way to adapt stimulation parameters moment-to-moment with respect to the patient’s clinical states (Arlotti et al., 2016). Compared with manually programmed (open-loop) cDBS, closed-loop DBS can significantly reduce the stimulation time and enhances clinical efficacy (Arlotti et al., 2016; Little et al., 2013; Cernera et al., 2021).
Most common closed-loop DBS systems use local field potential (LFP), recorded from stimulated nuclei, to find an effective feedback biomarker (Little et al., 2013; Priori et al., 2013; Velisar et al., 2019), e.g., the power of the beta oscillation (12–32 Hz) of LFP recorded in the subthalamic nucleus (STN) for reducing PD symptoms (Grado et al., 2018; Arlotti et al., 2016; Little et al., 2013). Velisar et al. (2019) developed a closed-loop DBS control system in which the beta oscillation power of the STN-LFP was chosen as the biomarker and the DBS amplitude was updated by a dual-threshold control method that maintains the STN–LFP beta power within a certain range. Other signals like muscle activities in electromyography (EMG) or inertial measurement units (IMUs) have also been used as biomarkers in treatment of tremors by closed-loop DBS (Cernera et al., 2021; Yamamoto et al., 2013; Haddock et al., 2017; Herron et al., 2017). For example, in the treatment of ET, Herron et al. (2017) developed a closed-loop DBS system that controls the EMG power to be below a specified threshold. There are also other types of feedback biomarkers used in closed-loop DBS, e.g., single-unit recordings (Rosin et al., 2011) and the coherence among electroencephalogram (EEG) recordings (Silberstein et al., 2005).
Regardless of the type of the feedback biomarker, DBS settings are determined solely based on neural (e.g., LFP) or behavioral (e.g., EMG) signals in most existing closed-loop DBS controllers (Velisar et al., 2019; Little et al., 2013; Herron et al., 2017; Haddock et al., 2019; Castaño-Candamil et al., 2020; Chandrabhatla et al., 2023). However, these methods suffer from the lack of an understanding of the physiological mechanisms underlying the DBS and disease-related neuronal circuits. An effective approach to overcome this problem is to embed a computational model of the underlying mechanisms into the control system (Grado et al., 2018). For example, to control Parkinson’s disease, closed-loop DBS systems were developed based on the physiological models of the related cortico-basal ganglia–thalamic network (Liu et al., 2021; Fleming et al., 2020). Liu et al. (2021) used the control system to suppress the beta oscillations in the cortex, and Fleming et al. (2020) suppressed the beta power of LFP in the STN. Although these computational studies included methods for adjusting DBS in a closed-loop manner (Fleming et al., 2020; Grado et al., 2018; Liu et al., 2021), the models used were not validated for replicating/tracking experimental data nor did they incorporate DBS mechanisms of actions, e.g., DBS-induced short-term synaptic plasticity (Milosevic et al., 2021; Tian et al., 2023a; Ghadimi et al., 2022).
In this work, we develop a closed-loop control system to adjust the stimulation frequency of Vim–DBS automatically. Our control system is based on a computational model that predicts the EMG activities in response to different frequencies of Vim–DBS. In this computational model, the firing rate of Vim neurons in response to Vim–DBS is predicted by our recently developed rate network model that reproduces the human clinical data recorded in Vim neurons in response to different DBS frequencies (10–200 Hz) (Tian et al., 2023b). Dynamics of DBS-induced short-term synaptic plasticity (Tian et al., 2023b) are incorporated in the rate network model. We used a neural model simulation study including models of DBS, Vim, the motor cortex, motoneurons in the spinal cord, and muscle fibers to generate muscle activities (represented by EMG). To link Vim–DBS to EMG signals in our model-based control framework, model-predicted EMG signals, generated in our simulation study, are used to calculate the feedback biomarker by a polynomial fit, which is processed and implemented in a proportional–integral–derivative (PID) controller (O’Hara et al., 1997; Raj et al., 2016; Sattar et al., 2019) that automatically updates the appropriate DBS frequency. Our model-predicted EMG can predict the symptoms of essential tremor during DBS-OFF and is consistent with clinical observations of tremors during different frequencies of Vim–DBS. In a closed-loop DBS control system, the ability of predicting the biomarker decreases the probability of delivering inappropriate DBS frequencies to the patient, and thus increases the therapeutic efficacy and reduces side effects.
The proposed model-based closed-loop DBS control system is based on synthetic EMG data and is currently in the stage of proof-of-concept. However, we anticipate that our computational framework can facilitate the development of model-based control systems that can be potentially implemented in and out of the clinic to automatically update the appropriate DBS frequency for individual patients suffering from different diseases.
Materials and methods
We developed a computational framework for incorporating the physiological mechanisms of deep brain stimulation into controlling disease symptoms. This framework consists of two main parts: (1) a computational model characterizing the physiological mechanism of the stimulated neuronal network and (structurally/functionally) connected neurons and (2) a feedback control reflecting the disease state. In this study, we use computer simulations and apply our framework to control DBS frequency for reducing ET symptoms observed from EMG signals.
Computational model
The computational model consists of four components: (i) neural activities, spikes, generated by the Vim network model in response to different DBS frequencies; (ii) motor cortex neural activities influenced by propagation of Vim–DBS effects to the motor cortex; (iii) spinal motoneuron activities impacted by neurons in the motor cortex; (iv) motor unit action potentials in the muscle fibers innervated by the spinal motoneurons.
(i) Vim network model impacted by Vim–DBS
The baseline firing rate of Vim neurons during DBS-OFF is often chosen in the range of 10–40 Hz (Milosevic et al., 2021; Tian et al., 2023b). The firing rate dynamics of the Vim neurons in response to Vim–DBS were simulated by our previous model of the Vim network based on clinical DBS data recorded during surgery on human patients with essential tremor (ET) (Supplementary Method S2) (Tian et al., 2023b). The impact of DBS pulses was modeled as the induction of synaptic release (Tian et al., 2023b), the dynamics of which is characterized by the Tsodyks and Markram (TM) model (Tsodyks et al., 1998) (Supplementary Method S1) of short-term synaptic plasticity (STP) (Milosevic et al., 2021). DBS pulses are fed into the TM model to obtain the post-synaptic currents into Vim neurons (Tian et al., 2023b). The firing rate network model consists of recurrent connections among three neural groups: DBS-targeted Vim neurons, external excitatory nuclei, and inhibitory nuclei (Supplementary Method S2) (Tian et al., 2023b). Our previous model could accurately reproduce the clinically recorded instantaneous firing rate of the Vim neurons receiving DBS of different stimulation frequencies (10–200 Hz) (Supplementary Figure S5) (Tian et al., 2023b).
(ii) Propagation to the primary motor cortex
In our model, the effects of Vim–DBS are propagated to the primary motor cortex (M1). We modeled the propagation using the dynamics induced by two sources: (1) the effects of Vim–DBS and (2) the background neuronal activities that induce tremor symptoms. The Vim–DBS effects are induced by the direct DBS activation of the axons projected to the M1 neuron and the firings of the Vim neurons during Vim–DBS.
These effects consist of direct axon activation and DBS-induced Vim firings. DBS activates the axons connecting to the synapses projecting to the M1 neuron, and these synapses are characterized by the Tsodyks and Markram model (Tsodyks et al., 1998) (Supplementary Method S1). In addition to the direct axon activation, the M1 neuron is also affected by the DBS-induced firings of the Vim neurons. With our previous Vim network model (Tian et al., 2023b), we simulated the instantaneous firing rate of the Vim neurons receiving DBS of different stimulation frequencies (10–200 Hz). The Vim firing rate signal is the time-varying Poisson rate for generating Poisson spike trains, which were passed to the TM-modeled synapses to produce the post-synaptic current in the M1 neurons (Supplementary Method S1).
In addition to the DBS effects, we also modeled the background neuronal activities inducing tremor symptoms. The tremor activities observed in the EMG from ET patients are often in the frequency band of 4–8 Hz (Halliday et al., 2000; Hess and Pullman, 2012; Herron et al., 2017). The tremor-inducing background firing rate was taken as a waveform consisting of 6-Hz bursts with a baseline shift (Supplementary Figure S1). To be consistent with the EMG recordings from ET patients (Halliday et al., 2000; Vaillancourt et al., 2003; Hess and Pullman, 2012; Zhang et al., 2017), each burst consists of three consecutive sinusoidal waves and the period of each wave is 20 ms (Supplementary Figure S1). We then generated Poisson spike trains from the background firing rate waveform; these spikes were then passed to the M1 synapses characterized by the TM model (Tsodyks et al., 1998), which produced the post-synaptic current into the M1 neurons (Supplementary Method S1).
The membrane potential of one neuron in the M1 neuron population was characterized by a leaky integrate-and-fire (LIF) model (Eq. 1) as follows:
where
(iii) Projection from the primary motor cortex to spinal motoneurons
We modeled the effects of Vim–DBS as being propagated to a population of 150 M1 neurons (
where
where
(iv) Generation of EMG activities from spinal motoneuron spikes
The spikes from the spinal motoneurons generate action potentials in the motor units of muscle fibers (Moezzi et al., 2018; Watanabe et al., 2013). These motor unit action potentials (MUAPs) were modeled (Eq. 4) as follows (Watanabe et al., 2013; Moezzi et al., 2018; Lo Conte et al., 1994):
where
Feedback control for DBS frequency
Our computational model simulates the EMG signal in response to different DBS frequencies. Simulated EMG signals are used to calculate the feedback biomarker which controls the DBS frequency. The feedback control consists of three main parts: (1) biomarker identification, (2) computation of a system output from the biomarker, and (3) a closed-loop controller that implements the system output to update the DBS frequency.
Biomarker identification
The EMG simulation of our computational model is slow to implement: it takes more than 30 min when using MATLAB R2022b with a personal computer to simulate 10 s of the EMG signal. Thus, to facilitate the implementation speed of the model in a closed-loop control system, we need rapid EMG estimation to replace the direct EMG simulation. We implemented a polynomial method to estimate the EMG from the Vim firing rate, and the direct model-simulated EMG is used as the reference (i.e., reference EMG) for estimation. We implemented the MATLAB custom function polyfit for polynomial estimation, which gives a least-square fit of the polynomial coefficients. The estimated EMG is formulated as follows:
where
Computation of system output from the estimated EMG
The power spectral density (PSD) of the estimated EMG
where
The EMG power thus computed can be used to analyze the EMG activities in the frequency domain in response to different frequencies of DBS.
In response to DBS frequency
Finally, a closed-loop controller updates the DBS frequency
The PID controller that updates the DBS frequency
We implemented the proportional–integral–derivative (PID) controller (O’Hara et al., 1997; Raj et al., 2016; Sattar et al., 2019) to update the DBS frequency based on the system output, z (Eq. 9). The updated DBS frequency
and is evaluated at the time points {
Results
Our proposed computational framework for model-based closed-loop DBS control is shown in Figure 1. As shown in Figure 1A, an encoding model is used to replicate (predict) neuronal activities in response to DBS frequencies. In this encoding model, the dynamics of synaptic plasticity and other biophysical details can be preserved, and model parameters are estimated by fitting the model output to experimental data (Tian et al., 2023b; Tian et al., 2023a). Additionally, to map neural activities to behavioral signals, we use a data-driven approach (Eq. 6) in our framework. A controller, e.g., a PID controller, is developed to adjust DBS patterns given behavioral signals solely. It is to be noted that, unlike the encoding model, using neural models to identify neural–behavioral relationships requires building a network of several neuronal circuits (see our simulation study in Figure 2), which in turn increases the complexity of this type of model for mapping neural features to behavioral activities. However, we show that data-driven approaches are strong alternatives. The proposed computational framework in Figure 1B highlights the contributions of encoding (biophysical) and decoding (data-driven) models.
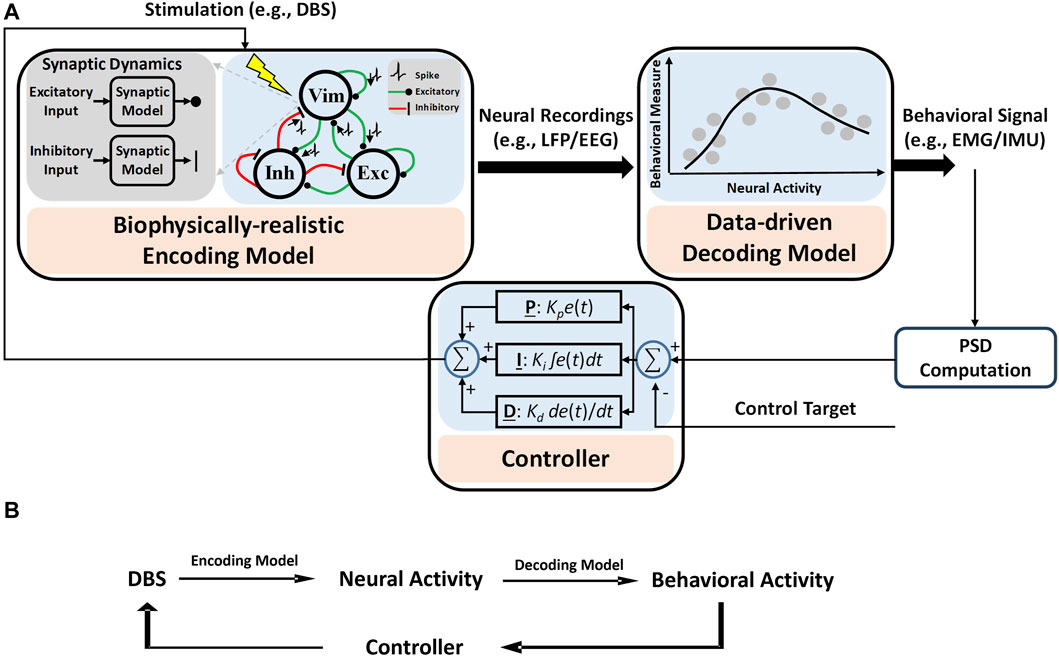
Figure 1. Computational framework for the proposed model-based closed-loop DBS control system. (A) Biophysical details, e.g., dynamics of synaptic plasticity, are preserved in the encoding model to identify how different patterns of DBS change the neural activities of simulated neurons. A data-driven decoding model was used to map the neural activity to behavioral signals like EMG. A controller is used to adjust DBS in a closed-loop manner. The control target is a specified value of the system output, which is related to the power spectral density (PSD) of EMG (see Eq. 10 for details). (B) A summary diagram of proposed computational framework.
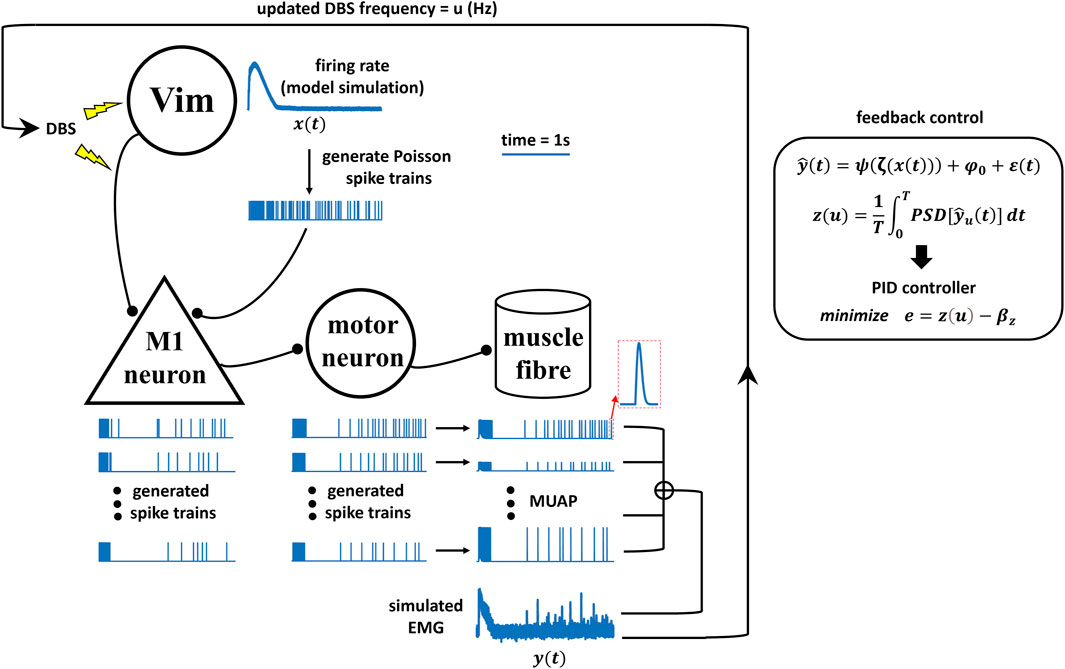
Figure 2. Schematics of the neural model simulation study for Vim–DBS control.
In the next sections, we present details of the model-based closed-loop DBS system that can effectively control the DBS frequency based on EMG signals generated by a neural model simulation (Figure 2) of the underlying neuronal network (from DBS/Vim neural activity to muscle activity).
Schematics of the neural model simulation study for Vim-DBS control
The simulation study for the Vim–DBS control system is schematized in Figure 2. The effects of Vim–DBS included direct axon activation and DBS-induced Vim firings, which were simulated from our previous Vim network model established based on clinical Vim–DBS data (Tian et al., 2023b). The Vim–DBS effects are propagated to the M1 neuron, which projects to the motoneuron in the spinal cord. The firings of the spinal motoneurons innervate the corresponding motor units in the muscle fibers and induce motor unit action potentials (MUAPs). The simulated EMG consists of a linear summation of MUAPs and a low-level Gaussian white noise. In the feedback control, in order to facilitate the implementation speed, we estimated the simulated EMG by a polynomial fit. Then, we computed the mean power spectral density (PSD) of such polynomial-estimated EMG as the system output. Finally, a proportional–integral–derivative (PID) controller updated the DBS frequency that brought the system output close to a specified control target.
DBS pulses are delivered to the neurons in the thalamic ventral intermediate nucleus (Vim) and also activate the axons projecting to neurons in the primary motor cortex (M1). The firing rate of the Vim neurons impacted by DBS was obtained from our previous Vim network model that reproduced experimental DBS data (Tian et al., 2023b). Spike trains are generated from the modeled Vim firing rate (
The Vim–Cortex propagation
Our model of the propagation of the Vim–DBS effects to the cortical M1 neurons was validated by using a 10-s block of neural spike data from single-unit recordings in M1 during 130-Hz VPLo-DBS in non-human primates, reported in Agnesi et al. (2015). The thalamic VPLo nucleus (ventralis posterior lateralis pars oralis, in the Olszewski atlas) in non-human primates is homologous to the Vim in humans (Molnar et al., 2005; Xiao et al., 2018). To assess the response of Vim to 130-Hz DBS, a peristimulus time histogram (PSTH) was calculated based on spike times occurring between 0 and 7.7 ms after each DBS pulse, with the PSTH further smoothed by an optimal Gaussian kernel (Shimazaki and Shinomoto, 2007; Shimazaki and Shinomoto, 2010) (Figure 3), both for empirical and simulated data. The standard deviation of the Gaussian kernel was 0.2 ms, which was obtained from optimization of the Gaussian kernel to best characterize the spikes using a Poisson process (Shimazaki and Shinomoto, 2007; Shimazaki and Shinomoto, 2010; Tian et al., 2023b). Our Vim–M1 propagation model’s generated M1 spike activity behaved similarly to that of the empirically recorded non-human primate M1, as indicated by the spike raster plot and PSTH firing rate analysis (Figure 3). We computed the
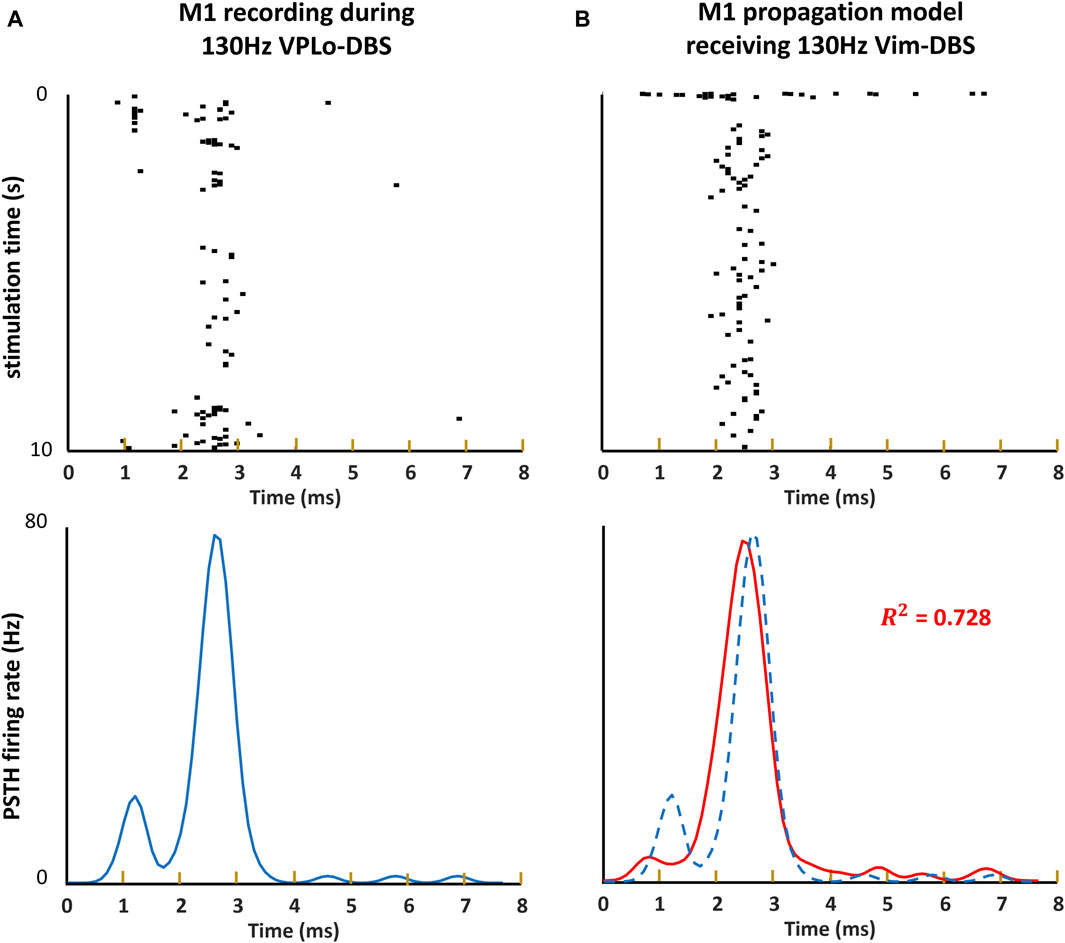
Figure 3. Raster plot and PSTH of model simulation and non-human primate recording. (A, B) The spike times occurring within each inter-pulse interval during 10 s of 130-Hz DBS are visualized as a raster plot. We obtain an estimate of the instantaneous firing rate induced around each DBS event by computing a peristimulus time histograms (PSTHs), convolving the spikes with a 0.2-ms Gaussian kernel. (A) The raster plot and PSTH of the non-human primate single-unit recording in the primary motor cortex (M1) during 130-Hz VPLo-DBS (Agnesi et al., 2015). (B) The raster plot and PSTH of our model simulation of M1 spikes during 130-Hz Vim-DBS. We compute the
EMG simulation from the computational model
We simulated the EMG from our model, both during DBS-OFF and in response to Vim-DBS of different stimulation frequencies in [10–200] Hz (Figure 4).
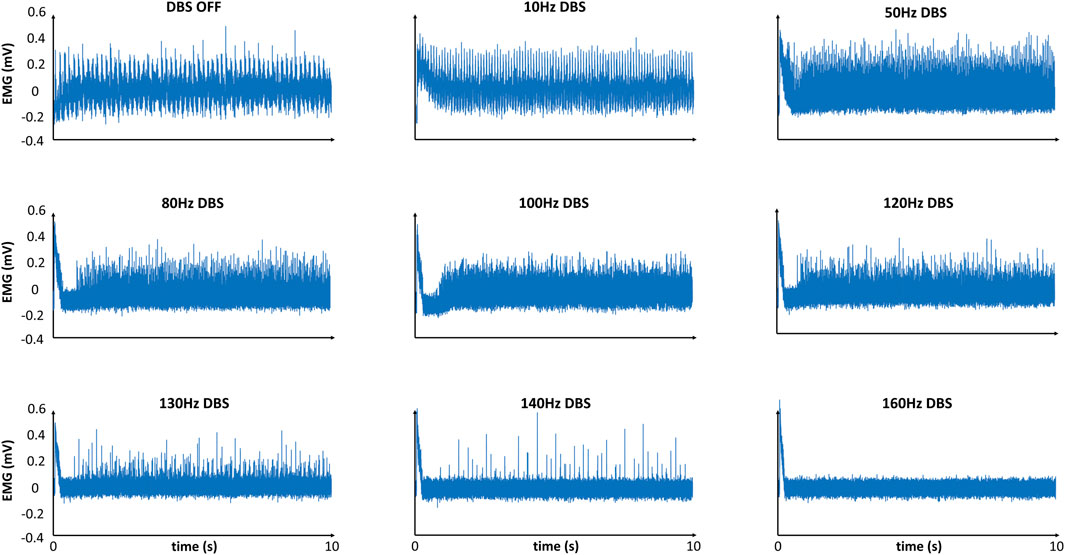
Figure 4. Model-simulated EMG in response to different frequencies of DBS. Simulated EMG with our model, in response to different frequencies of Vim–DBS. Each signal is given relative to its mean.
The EMG simulation with DBS-OFF presented a typical tremor band (∼6 Hz) in the clinical EMG signals recorded from ET patients (Halliday et al., 2000; Hess and Pullman, 2012; Herron et al., 2017). During low-frequency (
Estimation of the simulated EMG
The EMG simulation from the model is too slow for practical implementation. Thus, we estimated the model-simulated EMG with a polynomial fit to facilitate the computational speed in a closed-loop control system. The model-simulated EMG and polynomial-estimated EMG are denoted as “reference EMG” and “estimated EMG,” respectively (Figure 5). We compared the reference EMG and estimated EMG in response to different frequencies of DBS (Figures 5, 6).
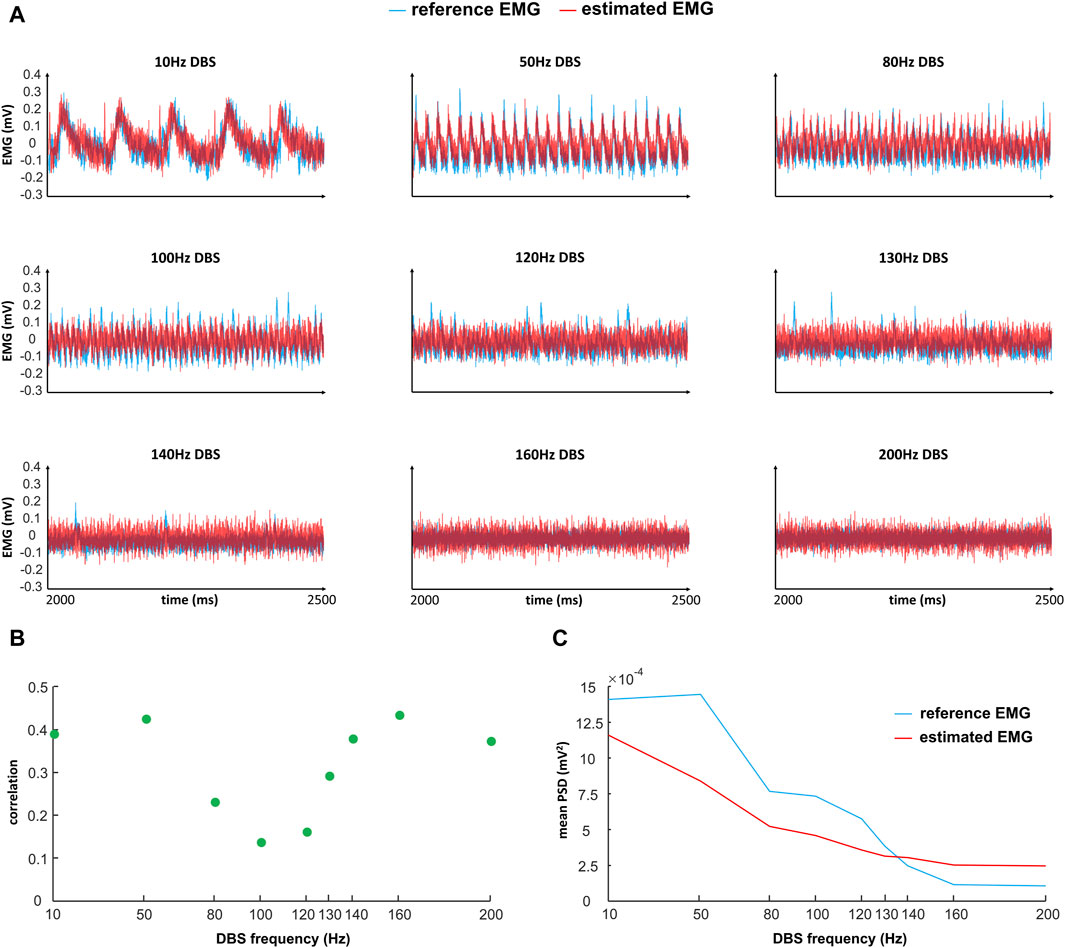
Figure 5. Comparison of reference and estimated EMGs (time domain) in response to different frequencies of DBS. “Reference EMG” is the EMG simulated by our model (
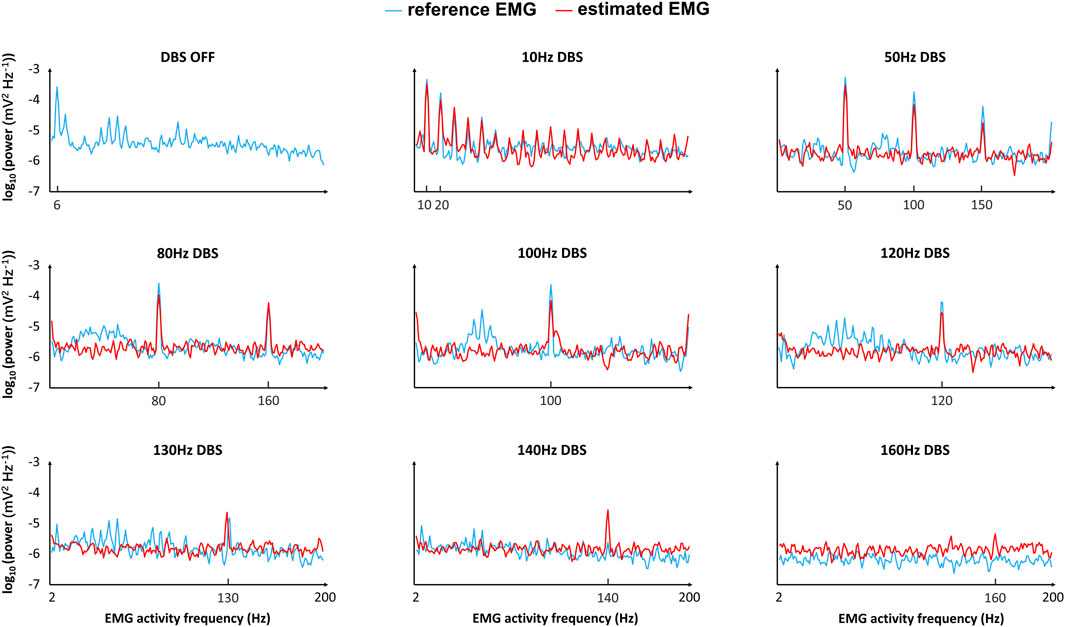
Figure 6. Comparison of the reference and estimated EMGs (frequency domain) in response to different frequencies of DBS. “Reference EMG” is the EMG simulated by our model (
In the time domain, the estimated EMG is similar to the reference EMG across different DBS frequencies (10–200 Hz), in terms of both amplitude and variation (Figure 5A). The correlation between the reference and estimated EMGs is generally above 0.3, representing some positive correlations (Figure 5B); the correlation is not very high because of the existence of white noise in the simulations. The power is generally similar between reference and estimated EMGs (Figure 5C). In addition to the comparison in the time domain, we also compared the reference and estimated EMGs in the frequency domain (Figure 6). At each frequency in the band [2–200] Hz of the EMG activities, we computed the corresponding frequency power with Eq. 8 in the initial T = 5 s of the EMG (Figure 6). The estimated EMG [by a 25-order polynomial (Eq. 6)] is well-fitted to the reference EMG in the frequency domain, with R2 = 0.745 (Supplementary Figure S3), computed based on the signals across different DBS frequencies. Additionally, we observed other similarities between the estimated and reference EMGs in terms of the amplitude and pattern of different frequency powers of EMG activities (Figure 6). The EMG power is high with DBS-OFF and during low-frequency (<100 Hz) DBS and is mostly suppressed during
The system output based on EMG power spectral density
We computed the system output to be implemented in a closed-loop controller updating the DBS frequency. The system output during Vim–DBS was computed with the estimated EMG (Eq. 6) that facilitates the implementation speed. For DBS frequency
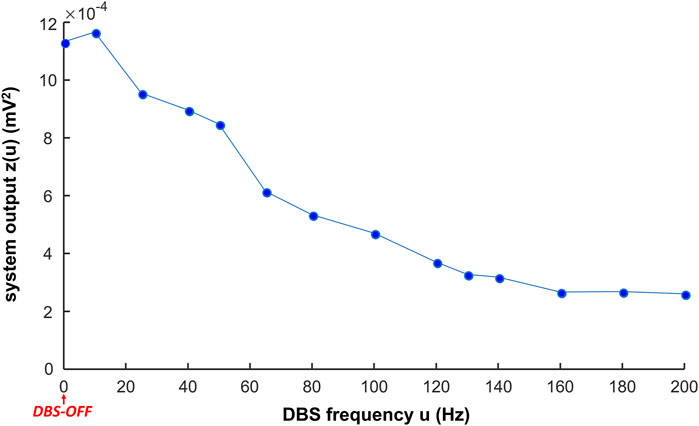
Figure 7. System output in response to different frequencies of DBS. The system output z(u) is the mean power spectral density (PSD) in the initial interval T = 5 s of the estimated EMG (
In general, the system output decreases with increase in the DBS frequency (Figure 7, Supplementary Table S3). During low-frequency (
Closed-loop control of the DBS frequency with the PID controller
A PID controller (Eq. 10) was implemented to update the DBS frequency in the closed-loop system, based on the system output z (Eq. 9). The parameters
As a test of the controller, when the control target is the power of the biomarker (estimated EMG, Eq. 6) from 130-Hz DBS, the PID controller can converge to the target in 10 min (Figure 8A and Supplementary Table S4). This shows that our control system is potentially effective and efficient for clinical implementation. Note that during the PID control, only the steady-state DBS frequency (reached after ∼10 min) is delivered to the patient. As we change the control target of the system output, the result of the PID control is also robustly and flexibly changed (Figure 8B). As shown in Figure 8B, the five control targets of the system output correspond to the biomarker power from both observed and unobserved DBS frequencies (Supplementary Table S4). The observed DBS frequencies (10, 50, 80, 100, 120, 130, 140, 160, and 200 Hz) were used in fitting the polynomial coefficients (Eq. 6), and the unobserved DBS frequencies are arbitrary.
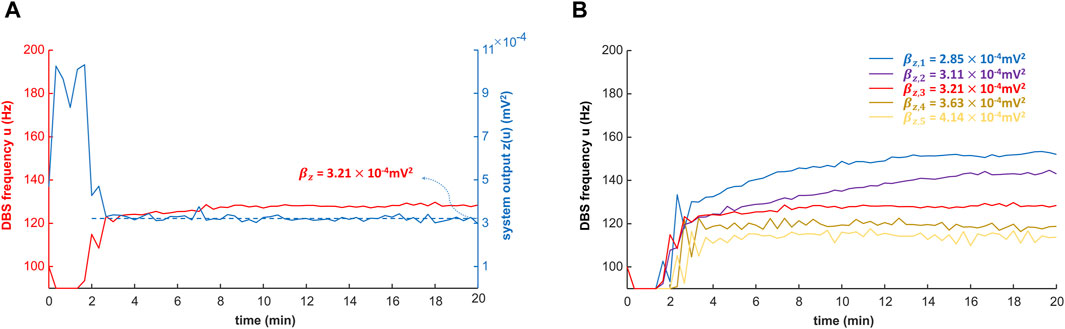
Figure 8. Closed-loop control of the DBS frequency with the PID controller. The DBS frequency is controlled in closed-loop with the proportional–integral–derivative (PID) controller (Eq. 10; Figure 2). The simulation of the PID controller is performed with MATLAB R2022b. (A) PID control of the DBS frequency with a specified target
Discussion
We developed a model-based closed-loop control system for the stimulation frequency of Vim–DBS. The DBS control system was based on our previously verified computational model, which represents the neuronal network characterizing the physiological mechanisms that connect the input (DBS pulses) and the output (model-predicted EMG activities). In order to facilitate the implementation speed, we estimated the model-predicted EMG with a polynomial fit, which was used as the feedback biomarker for the controller. The power spectrum of the biomarker was the system output implemented in a PID controller that automatically updates the appropriate DBS frequency. Thus, the closed-loop system controls the EMG power by adjusting the DBS frequency. Our closed-loop system can control the DBS frequency to achieve different control targets of EMG power and can potentially be implementable for different diseases and individual patients.
Clinical relevance of the system output
The system output used in our closed-loop system is related to the power of the model-predicted EMG signals, and the optimal DBS frequency is obtained by bringing the system output to a specified control target. In clinical studies, the power of EMG is a commonly observed indicator for different movement disorders, e.g., PD (Zhang et al., 2017), ET (Halliday et al., 2000), and akinesia (Bisdorff et al., 1999). Tremor symptoms, characterized by the tremor amplitude and frequency, can be identified using the power of EMG (Hess and Pullman, 2012). Tremor amplitude is the primary indicator of the severity of tremors (Hess and Pullman, 2012). Tremor frequency can be used to partially differentiate disease types; e.g., the peak tremor frequency observed in the EMG of PD patients is often 3 ∼ 6 Hz (Zhang et al., 2017; Hess and Pullman, 2012) and in the EMG of ET patients is often 4 ∼ 8 Hz (Halliday et al., 2000; Herron et al., 2017). Thus, use of the power of EMG as a biomarker for ET in a closed-loop DBS is clinically relevant (Yamamoto et al., 2013; Herron et al., 2017). During the DBS control, the control target of the EMG power should be appropriate: a high EMG power indicates the insufficiency of tremor suppression, and a low EMG power can be related to akinesia (Bisdorff et al., 1999) and myasthenia gravis (Mills, 2005).
Importance of predictability in a control system
The ability to predict how different frequencies of DBS change neural and behavioral activities is the main advantage of our model-based closed-loop DBS. A controller (e.g., PID) can select appropriate DBS patterns that are biophysically relevant and clinically effective. Although the model parameters [for both encoding and decoding models (see Figure 2) are obtained based on sparse DBS frequencies, 5, 10, 20, 30, 50, 100, 130, and 200 Hz [human Vim data (Tian et al., 2023b) and non-human primate cortical data (Agnesi et al., 2015)], the encoding model can robustly predict the effect of an arbitrary DBS frequency in the continuous spectrum of 5–200 Hz DBS (see Figure 4 for some examples; see Table 1 in Tian et al. (2023a) for a test of robustness of the firing rate model). Model-based control of DBS was addressed in previous computational studies (Fleming et al., 2020; Grado et al., 2018; Liu et al., 2021). Despite the usability of these control systems for in silico explorations, the underlying models were not fitted to experimental data. More importantly, these models do not consider the physiological mechanisms of the DBS effects. In this work, our (encoding) model not only incorporates biophysically realistic dynamics of DBS-induced short-term synaptic dynamics but also provides an accurate fit to Vim–DBS experimental data (Tian et al., 2023b). Additionally, our data-driven decoding model provides a fit (see Figures 5, 6) to simulated EMG data in which physiological mechanisms of tremor symptoms were preserved (see Figure 2 for details of the simulation study). Our control system predicts the effect of DBS frequency on the power of EMG and delivers an optimal DBS frequency.
The use of machine learning methods in closed-loop DBS
In recent closed-loop DBS control systems, machine learning methods have been developed to map biomarker features (input) to patients’ observed states (output) and could further deliver an appropriate DBS setting (Chandrabhatla et al., 2023; Kuo et al., 2018; Merk et al., 2022). Therefore, it is imperative to identify key biomarkers that need to be extracted from the LFP and EMG as they will serve as input features for a judiciously selected machine learning model. Castaño-Candamil et al. (2020) used a regression method to estimate tremor severity from electrocorticographic (ECoG) power in ET patients and adjusted the DBS intensity according to tremor severity. Golshan et al. (2018) used the wavelet coefficients of the STN-LFP beta frequency range as features and further developed a support vector machine (SVM) classifier for studying the behaviors of PD patients. Numerous prior studies have established high performance using SVM classifiers with input features such as phase-amplitude coupling (Chandrabhatla et al., 2023), Hjorth parameters (Oliveira et al., 2023), beta band power (Chandrabhatla et al., 2023), and burst duration (Merk et al., 2022). Using power densities within the beta (Kuo et al., 2018) and gamma (Yao et al., 2020) bands as features, hidden Markov models (Merk et al., 2022; Sun et al., 2020; Yao et al., 2020), SVM (Golshan et al., 2018), convolutional neural networks (CNNs) (Merk et al., 2022; Golshan et al., 2020; Oliveira et al., 2023), linear discriminant analysis (LDA) (Merk et al., 2022), and logistic regression (Houston et al., 2019) have been investigated. It was also recommended in a couple of studies that deep learning methods such as CNNs are worth investigating as they capture nonlinear temporal dynamics and waveform shape (Merk et al., 2022; Oliveira et al., 2023). For example, Haddock et al. (2019) developed a deep learning method that classified the behaviors of ET patients based on the PSD of ECoG and used the classification results to turn DBS ON/OFF.
A key improvement to existing machine learning methods is to incorporate physiological characterizations of the input–output mapping. In this work, we developed a physiological model to map the input (DBS frequency) to the output (model-predicted EMG). We then used a polynomial-based approximation to estimate the input–output map to facilitate the implementation speed of the control system. However, the polynomial method is prone to be less robust to unseen inputs, owing to its high-order terms (Kane et al., 2017; Beltrão et al., 1991). Thus, an important line of future work is to use state-of-the-art machine learning methods, particularly deep learning methods, to replace the simple polynomial-based input–output mapping. Consequently, it is important to understand key EMG features for muscle activation in Parkinson’s disease. The literature highlights sample kurtosis, recurrence rate, and correlation dimension as three specific EMG features that are responsive to changes in DBS treatment parameters (Rissanen et al., 2015). These features have been fed as input into the LDA, CNN, and SVM, where the SVM performed the best (Ruonala, 2022). In a few investigations, EMG features, encompassing frequency, amplitude, and regularity, were scrutinized (Khobragade et al., 2018; Wang et al., 2020). The signal mean and power of the peak frequency performed well as features when using a random forest model and a deep learning network for adaptive DBS (Khobragade et al., 2018). It is important to note that while simpler models like LDA are valued (Ozturk et al., 2020; Watts et al., 2020) for their interpretability in the context of DBS for PD, the limited availability of labeled datasets resulted in ambiguous success for complex models, particularly deep neural networks (Oliveira et al., 2023).
Our closed-loop DBS control is based on a physiological model that can generate an arbitrary amount of synthetic data, which can be implemented in fully training deep learning methods. The arbitrary amount of data in the training set will increase the accuracy and robustness of our future closed-loop DBS control based on physiological models and deep learning methods. Therefore, it is recommended that the efficacy of the SVM, logistic regression, LDA, hidden Markov model (HMM), random forests, and deep neural network models like CNNs be evaluated in greater detail using the abundance of synthetic data. Watts et al. (2020) performed a thorough retroactive study of various machine learning classifiers used to identify optimal DBS parameters for PD, and it was recommended to pursue machine learning in the context of adaptive closed-loop DBS for PD.
Different DBS mechanisms
Synaptic depression can partially explain the therapeutic mechanisms of high-frequency DBS (e.g., Vim–DBS), which can stem from synaptic and axonal failure (Rosenbaum et al., 2014; Tian et al., 2023a). In the present work, we incorporated dynamics of DBS-induced short-term synaptic plasticity (STP)—characterized by the Tsodyks and Markram model (Tsodyks et al., 1998)—in our neural model. Such a modeling strategy of the DBS effect is consistent with previous works (Farokhniaee and McIntyre, 2019; Milosevic et al., 2021). Further details of the DBS effect can also be considered in neuronal simulations. For example, Schmidt et al. (2020) modeled the effect of DBS by generating a spherical electrical field that affects the potential of all neuronal elements (including soma and axon) within a certain distance from the DBS electrode (Schmidt et al., 2020). The electrical field induced by DBS can be non-spherical if multiple electrodes or directional leads are used (Steffen et al., 2020; Masuda et al., 2022). DBS can induce both orthodromic and antidromic activations of axons, e.g., in Vim–DBS (Grill et al., 2008) and STN–DBS (Neumann et al., 2023). In particular, during STN–DBS, the antidromic activation of the cortical circuitry is a key factor in changing neural dynamics (Neumann et al., 2023). We will investigate the DBS effect of antidromic activations in our future models and compare different models of the DBS mechanisms.
Limitations and future work
In our closed-loop system, the EMG power of a broad band is used as the system output to update the input DBS frequency. We used the band [2–200] Hz that covers the DBS frequencies [10–200] Hz, which induces DBS-evoked activities in our EMG simulations (Figures 5, 6). These DBS-evoked activities could be a mechanism of the ineffectiveness of low-frequency Vim–DBS (Ushe et al., 2004; Earhart et al., 2007; Pedrosa et al., 2013) and need to be suppressed in the closed-loop control system. Yet, EMG recordings during low-frequency DBS are very limited, and more such recordings are needed to fully investigate the underlying mechanisms. There have been closed-loop DBS systems controlling the tremor band [∼(2, 12) Hz] of EMG activities in ET patients (Cernera et al., 2021; Yamamoto et al., 2013). Cernera et al. (2021) showed that during DBS-OFF for an ET patient, most of the EMG power belongs to the band (2–12) Hz (Cernera et al., 2021). Thus, the control result may be similar when using the broad band [2–200] Hz, in which the power of [12–200] Hz is small, and the result will not be biased toward this relatively small power. In the future, we will perform the control of the tremor band ∼ (2–12) Hz of EMG activities and compare it with the current scheme.
We developed a model-based closed-loop control system that automatically updates the DBS frequency. Although the DBS frequency is a commonly tuned parameter in clinical applications (Merola et al., 2013), the tuning of another DBS parameter (e.g., pulse width and amplitude), or a combination of different DBS parameters, may also be clinically effective. Our closed-loop system adapts the DBS frequency because the underlying Vim network model was built to fit clinical data recorded during different frequencies of DBS. In the future, we will develop closed-loop systems that can adapt different DBS parameters, based on the corresponding new clinical data.
Our model-based closed-loop DBS control system is in the proof-of-concept stage for clinical implementations. The system will be implemented together with a constant monitoring of the EMG signal. In contrast to existing closed-loop DBS systems that update DBS parameters based on EMG signals solely (Yamamoto et al., 2013; Herron et al., 2017), before delivering DBS to the patient, our system predicts the effect of DBS frequency based on the underlying computational model. During implementation, the recorded EMG signal will be used to adjust our model predictions to personalize the model-based system and increase the prediction accuracy.
Our model included the clinical Vim–DBS data recorded in Vim neurons across different stimulation frequencies (10–200 Hz) (Tian et al., 2023b). However, experimental data were not sufficiently included in other components of our model. We incorporated non-human primate single-unit recordings in M1 during 130-Hz VPLo-DBS reported in Agnesi et al. (2015), but M1 activities in response to other DBS frequencies were not recorded. The EMG model simulation is consistent with some clinical observations, but was not further developed and validated by fitting clinical EMG data. In fact, in current experimental work on DBS, the EMG signal is usually recorded with DBS-OFF or high DBS frequencies (>100 Hz) (Herron et al., 2017; Vaillancourt et al., 2003; Rissanen et al., 2011), and they lack EMG recordings in response to a wide spectrum of DBS frequencies (e.g., 10–200 Hz). In the future, we plan to incorporate more experimental data into the further development of the model-based closed-loop DBS control, and these experimental data—in particular, cortical and EMG data—need to be recorded with different DBS frequencies from each individual subject.
It is worth mentioning that the synaptic connections between the Vim (VPLo in primate) are reciprocal and excitatory, though the projections that the M1 sends to the Vim are in different M1 laminae than the ones it receives from Vim (Stepniewska et al., 1994). Our model simplified this excitatory feedback relationship by considering the excitatory propagation effect as unidirectional, from the Vim to the M1. We fitted the simplified model to the recording from one M1 neuron during 130-Hz VPLo-DBS, and there are variabilities among the dynamics of different M1 neurons. In the future, we will develop a more detailed Vim-M1 model based on more M1 recordings. In this work, we modeled the spinal motoneurons as one population. Spinal motoneurons can be classified into two function groups: somatic and visceral (Fields et al., 1970). The M1–motoneuron synaptic projection can be modeled by pair-based STDP, which characterizes membrane potential dynamics using spike timings of both pre- and post-synaptic spikes (Morrison et al., 2008; Gütig et al., 2003). We will develop more detailed models of the M1–motoneuron circuits in the future. Our future closed-loop DBS systems will be constructed based on both improved models and deep learning methods.
Data availability statement
The raw data supporting the conclusion of this article will be made available by the authors, without undue reservation.
Ethics statement
The studies involving humans were approved by the Tri-Council Policy on Ethical Conduct for Research Involving Humans and the University Health Network Research Ethics Board. The studies were conducted in accordance with the local legislation and institutional requirements. The participants provided their written informed consent to participate in this study. The animal study was approved by the Institutional Animal Care and Use Committee of the University of Minnesota and United States Public Health Service policy on the humane care and use of laboratory animals. The study was conducted in accordance with the local legislation and institutional requirements.
Author contributions
YT: conceptualization, formal analysis, investigation, methodology, resources, software, validation, visualization, writing–original draft, and writing–review and editing. SS: writing–original draft and writing–review and editing. EB: data curation, resources, writing–original draft, and writing–review and editing. MJ: writing–original draft and writing–review and editing. GE: writing–original draft and writing–review and editing. MP: writing–original draft and writing–review and editing. ML: conceptualization, formal analysis, funding acquisition, investigation, methodology, project administration, resources, supervision, visualization, writing–original draft, and writing–review and editing.
Funding
The author(s) declare that financial support was received for the research, authorship, and/or publication of this article. This work was supported by ML NSERC Discovery Grant (RGPIN-2020-05868), CIHR Project Grant, and Brain Canada (Azrieli Foundation).
Conflict of interest
The authors declare that the research was conducted in the absence of any commercial or financial relationships that could be construed as a potential conflict of interest.
Publisher’s note
All claims expressed in this article are solely those of the authors and do not necessarily represent those of their affiliated organizations, or those of the publisher, the editors, and the reviewers. Any product that may be evaluated in this article, or claim that may be made by its manufacturer, is not guaranteed or endorsed by the publisher.
Supplementary material
The Supplementary Material for this article can be found online at: https://www.frontiersin.org/articles/10.3389/fnetp.2024.1356653/full#supplementary-material
References
Agnesi, F., Muralidharan, A., Baker, K. B., Vitek, J. L., and Johnson, M. D. (2015). Fidelity of frequency and phase entrainment of circuit-level spike activity during DBS. J. Neurophysiol. 114 (2), 825–834. doi:10.1152/jn.00259.2015
Arlotti, M., Rosa, M., Marceglia, S., Barbieri, S., and Priori, A. (2016). The adaptive deep brain stimulation challenge. Park. Relat. Disord. 28, 12–17. doi:10.1016/j.parkreldis.2016.03.020
Baker, S. N., and Lemon, R. N. (1998). Computer simulation of post-spike facilitation in spike-triggered averages of rectified EMG. J. Neurophysiol. 80 (3), 1391–1406. doi:10.1152/jn.1998.80.3.1391
Barbe, M. T., Liebhart, L., Runge, M., Pauls, K. A. M., Wojtecki, L., Schnitzler, A., et al. (2011). Deep brain stimulation in the nucleus ventralis intermedius in patients with essential tremor: habituation of tremor suppression. J. Neurol. 258 (3), 434–439. doi:10.1007/s00415-010-5773-3
Beltrão, J. F., Silva, J. B. C., and Costa, J. C. (1991). Robust polynomial fitting method for regional gravity estimation. GEOPHYSICS 56 (1), 80–89. doi:10.1190/1.1442960
Bisdorff, A. R., Bronstein, A. M., Wolsley, C., Gresty, M. A., Davies, A., and Young, A. (1999). EMG responses to free fall in elderly subjects and akinetic rigid patients. J. Neurol. Neurosurg. Psychiatry 66 (4), 447–455. doi:10.1136/jnnp.66.4.447
Borg, K., and Borg, J. (1987). Conduction velocity and refractory period of single motor nerve fibres in antecedent poliomyelitis. J. Neurol. Neurosurg. Psychiatry 50 (4), 443–446. doi:10.1136/jnnp.50.4.443
Boutet, A., Madhavan, R., Elias, G. J. B., Joel, S. E., Gramer, R., Ranjan, M., et al. (2021). Predicting optimal deep brain stimulation parameters for Parkinson’s disease using functional MRI and machine learning. Nat. Commun. 12 (1), 3043. doi:10.1038/s41467-021-23311-9
Castaño-Candamil, S., Ferleger, B. I., Haddock, A., Cooper, S. S., Herron, J., Ko, A., et al. (2020). A pilot study on data-driven adaptive deep brain stimulation in chronically implanted essential tremor patients. Front. Hum. Neurosci. 14, 541625. doi:10.3389/fnhum.2020.541625
Cernera, S., Alcantara, J. D., Opri, E., Cagle, J. N., Eisinger, R. S., Boogaart, Z., et al. (2021). Wearable sensor-driven responsive deep brain stimulation for essential tremor. Brain Stimul. Basic Transl. Clin. Res. Neuromodulation 14 (6), 1434–1443. doi:10.1016/j.brs.2021.09.002
Chandrabhatla, A. S., Pomeraniec, I. J., Horgan, T. M., Wat, E. K., and Ksendzovsky, A. (2023). Landscape and future directions of machine learning applications in closed-loop brain stimulation. Npj Digit. Med. 6 (1), 79. doi:10.1038/s41746-023-00779-x
Colin Cameron, A., and Windmeijer, F. A. G. (1997). An R-squared measure of goodness of fit for some common nonlinear regression models. J. Econom. 77 (2), 329–342. doi:10.1016/S0304-4076(96)01818-0
Dallapiazza, R. F., Lee, D. J., De Vloo, P., Fomenko, A., Hamani, C., Hodaie, M., et al. (2019). Outcomes from stereotactic surgery for essential tremor. J. Neurol. Neurosurg. Psychiatry 90 (4), 474–482. doi:10.1136/jnnp-2018-318240
Dembek, T. A., Petry-Schmelzer, J. N., Reker, P., Wirths, J., Hamacher, S., Steffen, J., et al. (2020). PSA and VIM DBS efficiency in essential tremor depends on distance to the dentatorubrothalamic tract. NeuroImage Clin. 26, 102235. doi:10.1016/j.nicl.2020.102235
Deuschl, G., Paschen, S., and Witt, K. (2013). Clinical outcome of deep brain stimulation for Parkinson’s disease. Handb. Clin. Neurol. 116, 107–128. doi:10.1016/B978-0-444-53497-2.00010-3
Dowsey-Limousin, P. (2002). Postoperative management of Vim DBS for tremor. Mov. Disord. 17 (S3), S208–S211. doi:10.1002/mds.10165
Duchateau, J., and Baudry, S. (2014). Maximal discharge rate of motor units determines the maximal rate of force development during ballistic contractions in human. Front. Hum. Neurosci. 8, 234. doi:10.3389/fnhum.2014.00234
Earhart, G. M., Hong, M., Tabbal, S. D., and Perlmutter, J. S. (2007). Effects of thalamic stimulation frequency on intention and postural tremor. Exp. Neurol. 208 (2), 257–263. doi:10.1016/j.expneurol.2007.08.014
Eyre, J. A., Miller, S., Clowry, G. J., Conway, E. A., and Watts, C. (2000). Functional corticospinal projections are established prenatally in the human foetus permitting involvement in the development of spinal motor centres. Brain J. Neurol. 123 (Pt 1), 51–64. doi:10.1093/brain/123.1.51
Farokhniaee, A., and McIntyre, C. C. (2019). Theoretical principles of deep brain stimulation induced synaptic suppression. Brain Stimul. 12 (6), 1402–1409. doi:10.1016/j.brs.2019.07.005
Fields, H. L., Meyer, G. A., and Partridge, L. D. (1970). Convergence of visceral and somatic input onto spinal neurons. Exp. Neurol. 26 (1), 36–52. doi:10.1016/0014-4886(70)90086-5
Fleming, J. E., Dunn, E., and Lowery, M. M. (2020). Simulation of closed-loop deep brain stimulation control schemes for suppression of pathological beta oscillations in Parkinson’s disease. Front. Neurosci. 14, 166. doi:10.3389/fnins.2020.00166
Florin, E., Reck, C., Burghaus, L., Lehrke, R., Gross, J., Sturm, V., et al. (2008). Ten Hertz thalamus stimulation increases tremor activity in the subthalamic nucleus in a patient with Parkinson’s disease. Clin. Neurophysiol. Off. J. Int. Fed. Clin. Neurophysiol. 119 (9), 2098–2103. doi:10.1016/j.clinph.2008.05.026
Ghadimi, A., Steiner, L. A., Popovic, M. R., Milosevic, L., and Lankarany, M. (2022). Inferring stimulation induced short-term synaptic plasticity dynamics using novel dual optimization algorithm. PloS One 17 (9), e0273699. doi:10.1371/journal.pone.0273699
Golshan, H. M., Hebb, A. O., Hanrahan, S. J., Nedrud, J., and Mahoor, M. H. (2018). A hierarchical structure for human behavior classification using STN local field potentials. J. Neurosci. Methods 293, 254–263. doi:10.1016/j.jneumeth.2017.10.001
Golshan, H. M., Hebb, A. O., and Mahoor, M. H. (2020). LFP-Net: a deep learning framework to recognize human behavioral activities using brain STN-LFP signals. J. Neurosci. Methods 335, 108621. doi:10.1016/j.jneumeth.2020.108621
Grado, L. L., Johnson, M. D., and Netoff, T. I. (2018). Bayesian adaptive dual control of deep brain stimulation in a computational model of Parkinson’s disease. PLOS Comput. Biol. 14 (12), e1006606. doi:10.1371/journal.pcbi.1006606
Grill, W. M., Cantrell, M. B., and Robertson, M. S. (2008). Antidromic propagation of action potentials in branched axons: implications for the mechanisms of action of deep brain stimulation. J. Comput. Neurosci. 24 (1), 81–93. doi:10.1007/s10827-007-0043-9
Gütig, R., Aharonov, R., Rotter, S., and Sompolinsky, H. (2003). Learning input correlations through nonlinear temporally asymmetric hebbian plasticity. J. Neurosci. 23 (9), 3697–3714. doi:10.1523/jneurosci.23-09-03697.2003
Haddock, A., Chizeck, H. J., and Ko, A. L. (2019). “Deep neural networks for context-dependent deep brain stimulation,” in 2019 9th International IEEE/EMBS Conference on Neural Engineering (NER), 957–960. doi:10.1109/NER.2019.8717056
Haddock, A., Velisar, A., Herron, J., Bronte-Stewart, H., and Chizeck, H. J. (2017). “Model predictive control of deep brain stimulation for Parkinsonian tremor,” in 2017 8th International IEEE/EMBS Conference on Neural Engineering (NER), 358–362. doi:10.1109/NER.2017.8008364
Halliday, D., Conway, B., Farmer, S., Shahani, U., Russell, A., and Rosenberg, J. (2000). Coherence between low-frequency activation of the motor cortex and tremor in patients with essential tremor. Lancet 355 (9210), 1149–1153. doi:10.1016/S0140-6736(00)02064-X
Herrmann, A., and Gerstner, W. (2002). Noise and the PSTH response to current transients: II. Integrate-and-fire model with slow recovery and application to motoneuron data. J. Comput. Neurosci. 12 (2), 83–95. doi:10.1023/a:1015739523224
Herron, J. A., Thompson, M. C., Brown, T., Chizeck, H. J., Ojemann, J. G., and Ko, A. L. (2017). Chronic electrocorticography for sensing movement intention and closed-loop deep brain stimulation with wearable sensors in an essential tremor patient. J. Neurosurg. 127 (3), 580–587. doi:10.3171/2016.8.JNS16536
Hess, C. W., and Pullman, S. L. (2012). Tremor: clinical phenomenology and assessment techniques. Tremor Hyperkinetic Mov. N. Y. N. 2, 02–11. doi:10.5334/tohm.115
Houston, B., Thompson, M., Ko, A., and Chizeck, H. (2019). A machine-learning approach to volitional control of a closed-loop deep brain stimulation system. J. Neural Eng. 16 (1), 016004. doi:10.1088/1741-2552/aae67f
Hung, S. W., Hamani, C., Lozano, A. M., Poon, Y. Y. W., Piboolnurak, P., Miyasaki, J. M., et al. (2007). Long-term outcome of bilateral pallidal deep brain stimulation for primary cervical dystonia. Neurology 68 (6), 457–459. doi:10.1212/01.wnl.0000252932.71306.89
Izhikevich, E. M. (2006). Polychronization: computation with spikes. Neural comput. 18 (2), 245–282. doi:10.1162/089976606775093882
Kane, D., Karmalkar, S., and Price, E. (2017). “Robust polynomial regression up to the information theoretic limit,” in 2017 IEEE 58th Annual Symposium on Foundations of Computer Science (FOCS), 391–402. doi:10.1109/FOCS.2017.43
Khaleeq, T., Hasegawa, H., Samuel, M., and Ashkan, K. (2019). Fixed-life or rechargeable battery for deep brain stimulation: which do patients prefer? Neuromodulation Technol. Neural Interface 22 (4), 489–492. doi:10.1111/ner.12810
Khobragade, N., Tuninetti, D., and Graupe, D. (2018). On the need for adaptive learning in on-demand deep brain stimulation for movement disorders. Annu. Int. Conf. IEEE Eng. Med. Biol. Soc. IEEE Eng. Med. Biol. Soc. Annu. Int. Conf. 2018, 2190–2193. doi:10.1109/EMBC.2018.8512664
Kuo, C.-H., White-Dzuro, G. A., and Ko, A. L. (2018). Approaches to closed-loop deep brain stimulation for movement disorders. Neurosurg. Focus 45 (2), E2. doi:10.3171/2018.5.FOCUS18173
Li, X., Rymer, W. Z., and Zhou, P. (2012). A simulation-based analysis of motor unit number index (MUNIX) technique using motoneuron pool and surface electromyogram models. IEEE Trans. Neural Syst. Rehabil. Eng. Publ. IEEE Eng. Med. Biol. Soc. 20 (3), 297–304. doi:10.1109/TNSRE.2012.2194311
Limousin, P., Krack, P., Pollak, P., Benazzouz, A., Ardouin, C., Hoffmann, D., et al. (1998). Electrical stimulation of the subthalamic nucleus in advanced Parkinson’s disease. N. Engl. J. Med. 339 (16), 1105–1111. doi:10.1056/NEJM199810153391603
Little, S., and Brown, P. (2012). What brain signals are suitable for feedback control of deep brain stimulation in Parkinson’s disease? Ann. N. Y. Acad. Sci. 1265, 9–24. doi:10.1111/j.1749-6632.2012.06650.x
Little, S., Pogosyan, A., Neal, S., Zavala, B., Zrinzo, L., Hariz, M., et al. (2013). Adaptive deep brain stimulation in advanced Parkinson disease. Ann. Neurol. 74 (3), 449–457. doi:10.1002/ana.23951
Liu, C., Zhao, G., Meng, Z., Zhou, C., Zhu, X., Zhang, W., et al. (2021). Closing the loop of DBS using the beta oscillations in cortex. Cogn. Neurodyn. 15 (6), 1157–1167. doi:10.1007/s11571-021-09690-1
Lo Conte, L. R., Merletti, R., and Sandri, G. V. (1994). Hermite expansions of compact support waveforms: applications to myoelectric signals. IEEE Trans. Biomed. Eng. 41 (12), 1147–1159. doi:10.1109/10.335863
Macefield, V. G., Gandevia, S. C., Bigland-Ritchie, B., Gorman, R. B., and Burke, D. (1993). The firing rates of human motoneurones voluntarily activated in the absence of muscle afferent feedback. J. Physiol. 471, 429–443. doi:10.1113/jphysiol.1993.sp019908
Masuda, H., Shirozu, H., Ito, Y., Fukuda, M., and Fujii, Y. (2022). Surgical strategy for directional deep brain stimulation. Neurol. Med. Chir. (Tokyo) 62 (1), 1–12. doi:10.2176/nmc.ra.2021-0214
Merk, T., Peterson, V., Köhler, R., Haufe, S., Richardson, R. M., and Neumann, W.-J. (2022). Machine learning based brain signal decoding for intelligent adaptive deep brain stimulation. Exp. Neurol. 351, 113993. doi:10.1016/j.expneurol.2022.113993
Merola, A., Zibetti, M., Artusi, C. A., Rizzi, L., Angrisano, S., Lanotte, M., et al. (2013). 80 Hz versus 130 Hz subthalamic nucleus deep brain stimulation: effects on involuntary movements. Park. Relat. Disord. 19 (4), 453–456. doi:10.1016/j.parkreldis.2013.01.006
Miller, K. J. (2019). A library of human electrocorticographic data and analyses. Nat. Hum. Behav. 3 (11), 1225–1235. doi:10.1038/s41562-019-0678-3
Mills, K. R. (2005). Specialised electromyography and nerve conduction studies. J. Neurol. Neurosurg. Psychiatry 76 (Suppl. 2), ii36–ii40. doi:10.1136/jnnp.2005.068981
Milosevic, L., Kalia, S. K., Hodaie, M., Lozano, A. M., Popovic, M. R., and Hutchison, W. D. (2018). Physiological mechanisms of thalamic ventral intermediate nucleus stimulation for tremor suppression. Brain J. Neurol. 141 (7), 2142–2155. doi:10.1093/brain/awy139
Moezzi, B., Schaworonkow, N., Plogmacher, L., Goldsworthy, M. R., Hordacre, B., McDonnell, M. D., et al. (2018). Simulation of electromyographic recordings following transcranial magnetic stimulation. J. Neurophysiol. 120 (5), 2532–2541. doi:10.1152/jn.00626.2017
Molnar, G. F., Pilliar, A., Lozano, A. M., and Dostrovsky, J. O. (2005). Differences in neuronal firing rates in pallidal and cerebellar receiving areas of thalamus in patients with Parkinson’s disease, essential tremor, and pain. J. Neurophysiol. 93, 3094–3101. doi:10.1152/jn.00881.2004
Morrison, A., Diesmann, M., and Gerstner, W. (2008). Phenomenological models of synaptic plasticity based on spike timing. Biol. Cybern. 98 (6), 459–478. doi:10.1007/s00422-008-0233-1
Neumann, W.-J., Steiner, L. A., and Milosevic, L. (2023). Neurophysiological mechanisms of deep brain stimulation across spatiotemporal resolutions. Brain J. Neurol. 146 (11), 4456–4468. doi:10.1093/brain/awad239
O’Hara, D. A., Hexem, J. G., Derbyshire, G. J., Overdyk, F. J., Chen, B., Henthorn, T. K., et al. (1997). The use of a PID controller to model vecuronium pharmacokinetics and pharmacodynamics during liver transplantation. Proportional-integral-derivative. IEEE Trans. Biomed. Eng. 44 (7), 610–619. doi:10.1109/10.594902
Oliveira, A. M., Coelho, L., Carvalho, E., Ferreira-Pinto, M. J., Vaz, R., and Aguiar, P. (2023). Machine learning for adaptive deep brain stimulation in Parkinson’s disease: closing the loop. J. Neurol. 270 (11), 5313–5326. doi:10.1007/s00415-023-11873-1
Ondo, W., Jankovic, J., Schwartz, K., Almaguer, M., and Simpson, R. K. (1998). Unilateral thalamic deep brain stimulation for refractory essential tremor and Parkinson’s disease tremor. Neurology 51 (4), 1063–1069. doi:10.1212/WNL.51.4.1063
Opri, E., Cernera, S., Molina, R., Eisinger, R. S., Cagle, J. N., Almeida, L., et al. (2020). Chronic embedded cortico-thalamic closed-loop deep brain stimulation for the treatment of essential tremor. Sci. Transl. Med. 12 (572), eaay7680. doi:10.1126/scitranslmed.aay7680
Ozturk, M., Telkes, I., Jimenez-Shahed, J., Viswanathan, A., Tarakad, A., Kumar, S., et al. (2020). Randomized, double-blind assessment of LFP versus sua guidance in STN-DBS lead implantation: a pilot study. Front. Neurosci. 14, 611. doi:10.3389/fnins.2020.00611
Pahwa, R., Lyons, K. E., Wilkinson, S. B., Simpson, R. K., Ondo, W. G., Tarsy, D., et al. (2006). Long-term evaluation of deep brain stimulation of the thalamus. J. Neurosurg. 104 (4), 506–512. doi:10.3171/jns.2006.104.4.506
Pedrosa, D. J., Auth, M., Eggers, C., and Timmermann, L. (2013). Effects of low-frequency thalamic deep brain stimulation in essential tremor patients. Exp. Neurol. 248, 205–212. doi:10.1016/j.expneurol.2013.06.009
Porter, R., and Lemon, R. (1995). “Corticospinal influences on the spinal cord machinery for movement,” in Corticospinal function and voluntary movement. Editors R. Porter,, and R. Lemon (Oxford University Press), 0. doi:10.1093/acprof:oso/9780198523758.003.0004
Priori, A., Foffani, G., Rossi, L., and Marceglia, S. (2013). Adaptive deep brain stimulation (aDBS) controlled by local field potential oscillations. Exp. Neurol. 245, 77–86. doi:10.1016/j.expneurol.2012.09.013
Raj, R., Ramakrishna, R., and Sivanandan, K. S. (2016). A real time surface electromyography signal driven prosthetic hand model using PID controlled DC motor. Biomed. Eng. Lett. 6 (4), 276–286. doi:10.1007/s13534-016-0240-4
Rissanen, S. M., Kankaanpää, M., Tarvainen, M. P., Novak, V., Novak, P., Hu, K., et al. (2011). Analysis of EMG and acceleration signals for quantifying the effects of deep brain stimulation in Parkinson’s disease. IEEE Trans. Biomed. Eng. 58 (9), 2545–2553. doi:10.1109/TBME.2011.2159380
Rissanen, S. M., Ruonala, V., Pekkonen, E., Kankaanpää, M., Airaksinen, O., and Karjalainen, P. A. (2015). Signal features of surface electromyography in advanced Parkinson’s disease during different settings of deep brain stimulation. Clin. Neurophysiol. Off. J. Int. Fed. Clin. Neurophysiol. 126 (12), 2290–2298. doi:10.1016/j.clinph.2015.01.021
Rosenbaum, R., Zimnik, A., Zheng, F., Turner, R. S., Alzheimer, C., Doiron, B., et al. (2014). Axonal and synaptic failure suppress the transfer of firing rate oscillations, synchrony and information during high frequency deep brain stimulation. Neurobiol. Dis. 62, 86–99. doi:10.1016/j.nbd.2013.09.006
Rosin, B., Slovik, M., Mitelman, R., Rivlin-Etzion, M., Haber, S. N., Israel, Z., et al. (2011). Closed-loop deep brain stimulation is superior in ameliorating parkinsonism. Neuron 72 (2), 370–384. doi:10.1016/j.neuron.2011.08.023
Ruonala, V. (2022). Surface electromyography and kinematic measurements in Parkinson’s disease: analysis methods for differential diagnosis and quantification of treatment. Disser in Fores and Natura Sci. Publisher: University of Eastern Finland, Faculty of Science and Forestry, Department of Applied Physics [Online]. Available: https://erepo.uef.fi/handle/123456789/27177 (Accessed December 13, 2023).
Sattar, N. Y., Syed, U. A., Muhammad, S., and Kausar, Z. (2019). “Real-time EMG signal processing with implementation of PID control for upper-limb prosthesis,” in 2019 IEEE/ASME International Conference on Advanced Intelligent Mechatronics (AIM), 120–125. doi:10.1109/AIM.2019.8868796
Schmidt, S. L., Brocker, D. T., Swan, B. D., Turner, D. A., and Grill, W. M. (2020). Evoked potentials reveal neural circuits engaged by human deep brain stimulation. Brain Stimul. 13 (6), 1706–1718. doi:10.1016/j.brs.2020.09.028
Shimazaki, H., and Shinomoto, S. (2010). Kernel bandwidth optimization in spike rate estimation. J. Comput. Neurosci. 29 (1), 171–182. doi:10.1007/s10827-009-0180-4
Shimazaki, H., and Shinomoto, S. (2007). A method for selecting the bin size of a time histogram. Neural comput. 19 (6), 1503–1527. doi:10.1162/neco.2007.19.6.1503
Silberstein, P., Pogosyan, A., Kühn, A. A., Hotton, G., Tisch, S., Kupsch, A., et al. (2005). Cortico-cortical coupling in Parkinson’s disease and its modulation by therapy. Brain J. Neurol. 128 (Pt 6), 1277–1291. doi:10.1093/brain/awh480
Steffen, J. K., Reker, P., Mennicken, F. K., Dembek, T. A., Dafsari, H. S., Fink, G. R., et al. (2020). Bipolar directional deep brain stimulation in essential and parkinsonian tremor. Neuromodulation J. Int. Neuromodulation Soc. 23 (4), 543–549. doi:10.1111/ner.13109
Stepniewska, I., Preuss, T. M., and Kaas, J. H. (1994). Thalamic connections of the primary motor cortex (M1) of owl monkeys. J. Comp. Neurol. 349 (4), 558–582. doi:10.1002/cne.903490405
Sun, S., Jiang, L. P., Peterson, S. M., Herron, J., Weaver, K., Ko, A., et al. (2020). Unsupervised sleep and wake state identification in long-term electrocorticography recordings. Annu. Int. Conf. IEEE Eng. Med. Biol. Soc. IEEE Eng. Med. Biol. Soc. Annu. Int. Conf. 2020, 629–632. doi:10.1109/EMBC44109.2020.9175359
Tian, Y., Bello, E., Crompton, D., Kalia, S. K., Hodaie, M., Lozano, A. M., et al. (2023b). Uncovering network mechanism underlying thalamic Deep Brain Stimulation using a novel firing rate model. bioRxiv. doi:10.1101/2023.12.09.570924
Tian, Y., Murphy, M. J. H., Steiner, L. A., Kalia, S. K., Hodaie, M., Lozano, A. M., et al. (2023a). Modeling instantaneous firing rate of deep brain stimulation target neuronal ensembles in the basal ganglia and thalamus. Neuromodulation Technol. Neural Interface. doi:10.1016/j.neurom.2023.03.012
Tsodyks, M., Pawelzik, K., and Markram, H. (1998). Neural networks with dynamic synapses. Neural comput. 10 (4), 821–835. doi:10.1162/089976698300017502
Ushe, M., Mink, J. W., Revilla, F. J., Wernle, A., Schneider Gibson, P., McGee-Minnich, L., et al. (2004). Effect of stimulation frequency on tremor suppression in essential tremor. Mov. Disord. 19 (10), 1163–1168. doi:10.1002/mds.20231
Vaillancourt, D. E., Sturman, M. M., Verhagen Metman, L., Bakay, R. a. E., and Corcos, D. M. (2003). Deep brain stimulation of the VIM thalamic nucleus modifies several features of essential tremor. Neurology 61 (7), 919–925. doi:10.1212/01.wnl.0000086371.78447.d2
Velisar, A., Syrkin-Nikolau, J., Blumenfeld, Z., Trager, M. H., Afzal, M. F., Prabhakar, V., et al. (2019). Dual threshold neural closed loop deep brain stimulation in Parkinson disease patients. Brain Stimul. 12 (4), 868–876. doi:10.1016/j.brs.2019.02.020
Wang, K.-L., Burns, M., Xu, D., Hu, W., Fan, S. Y., Han, C. L., et al. (2020). Electromyography biomarkers for quantifying the intraoperative efficacy of deep brain stimulation in Parkinson’s patients with resting tremor. Front. Neurol. 11, 142. doi:10.3389/fneur.2020.00142
Watanabe, R. N., Magalhães, F. H., Elias, L. A., Chaud, V. M., Mello, E. M., and Kohn, A. F. (2013). Influences of premotoneuronal command statistics on the scaling of motor output variability during isometric plantar flexion. J. Neurophysiol. 110 (11), 2592–2606. doi:10.1152/jn.00073.2013
Watts, J., Khojandi, A., Shylo, O., and Ramdhani, R. A. (2020). Machine learning’s application in deep brain stimulation for Parkinson’s disease: a review. Brain Sci. 10 (11), 809. doi:10.3390/brainsci10110809
Xiao, Y., Agnesi, F., Bello, E. M., Zhang, S., Vitek, J. L., and Johnson, M. D. (2018). Deep brain stimulation induces sparse distributions of locally modulated neuronal activity. Sci. Rep. 8 (1), 2062. doi:10.1038/s41598-018-20428-8
Yamamoto, T., Katayama, Y., Ushiba, J., Yoshino, H., Obuchi, T., Kobayashi, K., et al. (2013). On-demand control system for deep brain stimulation for treatment of intention tremor. Neuromodulation J. Int. Neuromodulation Soc. 16 (3), 230–235. doi:10.1111/j.1525-1403.2012.00521.x
Yao, L., Brown, P., and Shoaran, M. (2020). Improved detection of Parkinsonian resting tremor with feature engineering and Kalman filtering. Clin. Neurophysiol. Off. J. Int. Fed. Clin. Neurophysiol. 131 (1), 274–284. doi:10.1016/j.clinph.2019.09.021
Keywords: deep brain stimulation, closed-loop control (CLC) system, physiological model, short-term synaptic plasticity, thalamic ventral intermediate nucleus
Citation: Tian Y, Saradhi S, Bello E, Johnson MD, D’Eleuterio G, Popovic MR and Lankarany M (2024) Model-based closed-loop control of thalamic deep brain stimulation. Front. Netw. Physiol. 4:1356653. doi: 10.3389/fnetp.2024.1356653
Received: 15 December 2023; Accepted: 18 March 2024;
Published: 08 April 2024.
Edited by:
Kelly Cristiane Iarosz, Faculdade de Telêmaco Borba (FATEB), BrazilReviewed by:
Nada Yousif, University of Hertfordshire, United KingdomJustus Alfred Kromer, Stanford University, United States
Copyright © 2024 Tian, Saradhi, Bello, Johnson, D’Eleuterio, Popovic and Lankarany. This is an open-access article distributed under the terms of the Creative Commons Attribution License (CC BY). The use, distribution or reproduction in other forums is permitted, provided the original author(s) and the copyright owner(s) are credited and that the original publication in this journal is cited, in accordance with accepted academic practice. No use, distribution or reproduction is permitted which does not comply with these terms.
*Correspondence: Milad Lankarany, milad.lankarany@uhn.ca