 Ulrika Birkeldh1*
 Ali Manouchehrinia2Max Albert Hietala2Jan Hillert2
 Tomas Olsson2
 Fredrik Piehl2Ingrid Skelton Kockum2Lou Brundin2Ori Zahavi1
 Marika Wahlberg-Ramsay1
 Rune Brautaset1
 Maria Nilsson1
- 1Unit of Optometry, Department of Clinical Neuroscience, St. Erik Eye Hospital, Karolinska Institute, Stockholm, Sweden
- 2Department of Clinical Neuroscience, Karolinska Institute at Karolinska University Hospital Solna, Stockholm, Sweden
Background: Reduced peripapillary retinal nerve fiber layer (pRNFL) and combined ganglion cell and inner plexiform layer (GCIP) thicknesses as measured by optical coherence tomography (OCT) have been observed in multiple sclerosis (MS) patients. The purpose was to determine the most associative OCT measure to level of cognitive and physical disability in MS.
Methods: Data were collected from 546 MS patients and 175 healthy controls (HCs). We compared the average pRNFL, temporal pRNFL (T-pRNFL), overall inner ganglion cell/inner plexiform layer (GCIP), and the overall ganglion cell complex (GCC) including macular RNFL and GCIP thicknesses measurements in differentiating MS subtypes from HCs. The association between OCT measures, Expanded Disability Status Scale (EDSS), and Symbol Digit Modalities Test (SDMT) were assessed using generalized estimating equations models.
Results: Both peripapillary and macular OCT measurements could differentiate all MS subtypes from HCs. The SDMT score was significantly associated with reduced thickness of all OCT measures, mostly in average pRNFL (0.14 µm, P = 0.001) and T-pRNFL (0.17 µm, P < 0.001). The EDSS score was significantly associated with reduced inner retinal layer thickness. The largest reduction was seen in T-pRNFL (−1.52 μm, P < 0.001) and inner GCC (−1.78 μm, P < 0.001).
Conclusion: The T-pRNFL is highly sensitive and associated with level of both cognitive and physical disability.
Introduction
Multiple sclerosis (MS) is a chronic inflammatory disease of the central nervous system (CNS), associated with development of both cognitive impairment and physical disability. So far MRI-based methods have been the most established method to assess degree of CNS damage. However, a growing body of evidence suggests that also optical coherence tomography (OCT) can be used to estimate degree of neurodegeneration. Reduced peripapillary retinal nerve fiber layer (pRNFL) thickness as measured with OCT has been observed in MS patients with and without history of optic neuritis (ON) (1–6) and in other neurological conditions such as cluster headache (7). The retina is part of the CNS and measurements of the un-myelinated axons in the eye can point toward the overall neural degeneration associated with the disease (8). Some studies have suggested OCT as an important tool for monitoring MS and as a complementary measure to magnetic resonance imaging (MRI) (9–12). Functional and/or cognitive disability have been found to be correlated with pRNFL thickness in some (13–15), but not all studies (9, 16).
Lately, software advancements of the SD-OCT technique allow measurement and automatic segmentation of the ganglion cell–inner plexiform layer (GCIP). Reduced GCIP thickness has been found in MS (8, 17, 18) and also in Parkinson’s disease (19), Alzheimer’s disease (20), Susac’s syndrome (21), idiopathic intracranial hypertension (22), and neuromyelitis optica (23). Furthermore, the GCIP thickness in MS patients has been shown to correlate better than pRNFL thickness with functional outcomes such as visual function and the Expanded Disability Status Scale (EDSS) score (24), the most established measure of physical disability in MS.
Today, there are numerous parameters that could be used to describe the retinal structure. Identification of a single and robust OCT parameter in a large population based study would be beneficial to research studies and in daily clinical work. Hence, the aim of the this study was to identify the most sensitive macular parameter to disability change in MS by comparing different OCT outcomes and their correlation to clinical data such as history of ON, MS subtype, disease duration, EDSS score, and cognitive function.
Materials and Methods
We designed and performed a cross-sectional study measuring the association between the average pRNFL thickness and temporal peripapillary RNFL (T-pRNFL) thickness, macular layer thickness, and demographic and clinical outcomes in MS patients. The macular layers were measured both as GCIP and as a ganglion cell complex (GCC) including macular RNFL, macular ganglion cell layer, and macular inner plexiform layer in an inner ring (with an inner diameter of 1.5 mm and an outer diameter of 5 mm) and an outer ring (with an inner diameter of 5 mm and an outer diameter of 10 mm), see Figure 1. We aimed at identifying the most sensitive method to successfully differentiate MS subtypes from healthy controls (HCs) and the method with highest association with cognitive and physical disability in MS patients. We complemented the cross-sectional study by a longitudinal investigation in which the predictive value of baseline OCT measurement on trajectory of future physical and cognitive disability was assessed. The design of this study followed the Declaration of Helsinki principles and was approved by the local ethical committee. Informed consents were obtained from all participants.
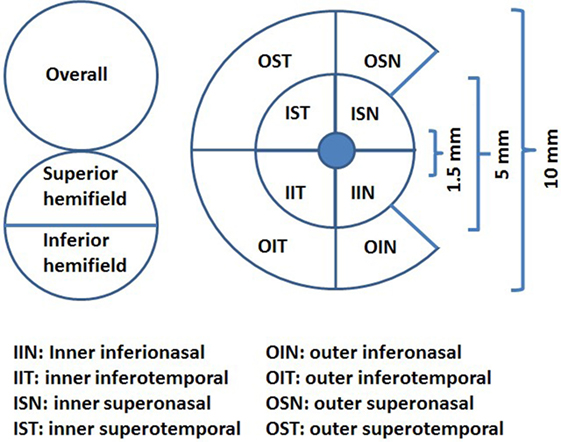
Figure 1. The ganglion cell thickness map as a complex including macular retinal nerve fiber layer, macular ganglion cell layer, and macular inner plexiform layer (ganglion cell complex) (illustration inspired from Ng et al., 2015).
Study Population
Multiple sclerosis patients were recruited consecutively when coming for their normal routine examination between May 2013 and 2016 to the Neurology Clinic, Neuro Centrum at Karolinska University Hospital, Solna, Sweden. Patients with other neurologic or ocular diseases that could influence the outcome measures were excluded, such as retinal and optic nerve disorders. Patients with acute ON the last 6 months before the OCT measurement were excluded. Related medical records were carefully reviewed, including disease duration, EDSS score, MS subtype [relapsing–remitting (RR), secondary progressive (SP), and primary progressing], treatment duration, and history of ON. Data from the most prior visit to the OCT examination were retrieved. Age was recorded at the time of the visit for OCT examination. We also recruited unaffected controls with the same exclusion criteria. A recently completed study, which compared the repeatability of a Canon OCT HS-100 and a Zeiss Cirrus HD-OCT, also contributed with normal data to the control group of this study (25). Those examinations were performed by an equally experienced operator and with the same OCT instrument as used for examination of the subjects in this study. Controls were selected to age and sex match the MS group.
Clinical Measurements
Physical disability was assessed by the EDSS and the MS Impact Scale 29 (MSIS-29) physical domain, a patient-reported outcome measure. Cognitive impairment was assessed using Symbol Digit Modalities Test (SDMT) and MSIS-29 psychological domain. All measurements were performed during patients’ routine clinic visits and within an average of 1-month range from the date of OCT examination. Consecutive data from the date of OCT examinations on SDMT, MSIS-29, and EDSS scores was retrieved from the Swedish MS register.
Spectral Domain OCT
All subjects underwent SD-OCT examination using the Canon OCT HS-100 with software version 1.00 (Canon Europe, Amstelveen, Netherlands) which performs up to 70,000 A-scans/second with an axial resolution of 3 µm. The fixation target was a 2 mm wide cross, and the scan mode “Disk 3D” was used. The site for the “Disk 3D” was 6 mm × 6 mm, and the scan was 512 × 256. From the “Disk 3D” measurement, the average pRNFL thickness for 360° around the optic disk and the temporal portion of the pRNFL (T-pRNFL) were used. For macular measurements, the scan mode “Glaucoma 3D” was used to measure the GCIP thickness over a 10 mm × 10 mm area centered on the fovea. This 3D scan mode is built up of 128 B-scans each consisting of 1,024 A-scans. The total GCIP thickness area consisted of an inner ring (inner center) for macular GCIP thickness and an outer ring for perimacular GCIP thickness. The area consists of eight subfields, four in each ring, see Figure 1. The incorporated algorithm also reports the GCIP thickness for the overall average and the superior and inferior hemi fields of the whole measured area. Measurements were obtained from both eyes of each patient. Only scans without artifacts, signal strength of ≥7 (maximum, 10) and in agreement with the OSCAR-1B criteria (26, 27) were selected for further analysis. The Advised Protocol for OCT Study Terminology and Elements recommendations (APOSTEL recommendation) were followed (28). To reach reproducibility and reliability, the same examiner performed all the measurements on both the control and the MS group.
Statistical Analysis
R version 3.3.3 (R Core Team, 2016) and package geepack were used for data analyses (29). Generalized estimating equations (GEEs) models were used to account for within-patient inter-eye correlations. We started by comparing the average pRNFL thickness, T-pRNFL thickness, inner and outer GCC thickness, and inner and outer GCIP thickness between MS including all subtypes, each MS subtype separately, and HCs while controlling for the potential confounding effects of age, sex, and previous history of ON. OCT measures with the ability to significantly differentiate MS subtypes with highest regression coefficient were considered optimal.
Similar models were fitted when investigating the association between cognitive and physical disability and OCT measurements at the time of OCT examination (baseline). These models were adjusted for age, sex, disease duration, MS subtype, previous history of ON and duration of exposure to first-line (interferon beta 1a and 1b and glatiramer acetate) and second-line (natalizumab, fingolimod, and rituximab) disease modifying treatments (DMTs). When investigating SDMT score additional adjustment for the number of previous SDMT examinations was made. Since the impact of ON can be significantly different between individuals, we ran the same analyses on eyes with no history of ON to make sure that the statistical adjustment for ON has been adequate.
Finally, we examined the predictive value of baseline average pRNFL, T-pRNFL, inner GCC, and average inner GCIP measures on the trajectory of consecutive SDMT and EDSS scores over 36 months of follow-up. Measurements were categorized into two groups of “reduced” and “normal.” “Normal” OCT measure was defined if the measurement was within one standard deviation of the respective measure in HCs. The OCT measure was considered “reduced” if the measurement was two or more standard deviations lower than the respective measure in HCs. The longitudinal assessment was performed using GEE models adjusted for age, sex, onset age, MS subtype, previous history of ON, and duration of exposure to first-line and second-line DMTs. This was an exploratory analysis so that no correction for multiple comparisons was made.
Results
Data from examinations of 546 MS patients and 175 HCs were gathered (Table 1). 19 patients were diagnosed with primary progressive multiple sclerosis (PPMS), 391 had relapsing–remitting multiple sclerosis (RRMS), and 136 had converted to secondary progressive multiple sclerosis (SPMS) at the time of OCT examination. 70% of MS patients and 76% HCs were female. As expected, physical disability as measured by the EDSS score was significantly higher in PPMS and SPMS patients compared with RRMS (P-value < 0.001). Similarly, PPMS and SPMS patients showed significantly lower SDMT score compared with RRMS patients (P-value < 0.001). Nineteen percent of RRMS and 15% of SPMS patients had previous history of ON in one eye. 7% of RRMS and 4% of SPMS patients had history of ON in both eyes.
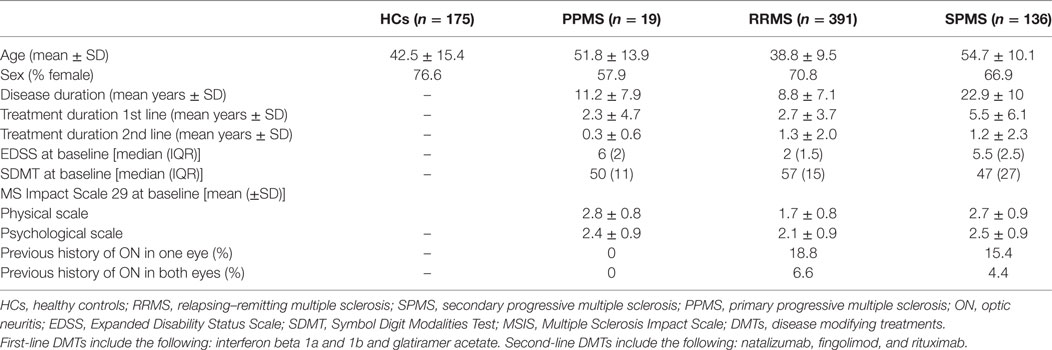
Table 1. Demographic and clinical characteristics of 546 MS patients and 175 HCs.
Comparison of OCT Measures between MS Patients and HCs
The average pRNFL thickness was significantly reduced in both MS with all subtypes included and in all MS subtypes separately compared with HCs (Table 2). However, the T-pRNFL and GCC measurements showed higher sensitivity and superior performance with higher regression coefficient and stronger P-values in differentiating MS subtypes from HCs (Table 2). The absolute OCT thickness values of each group are presented in the Table S1 in Supplementary Material.
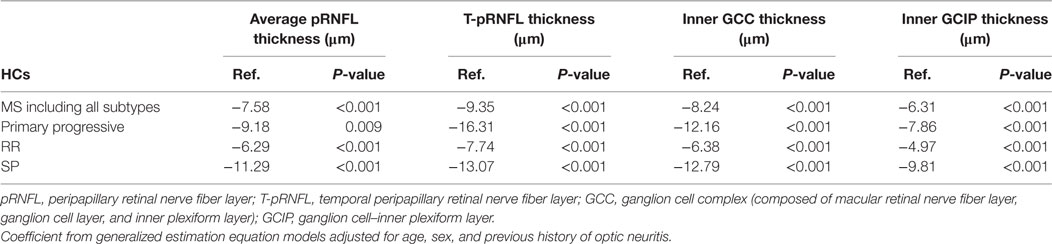
Table 2. Average reduction of optical coherence tomography measures in 19 primary progressive, 391 relapsing–remitting (RR), and 136 secondary progressive (SP) multiple sclerosis (MS) patients compared with 175 healthy controls (HCs).
Association between OCT Measures and Cognitive and Physical Disability
Higher EDSS scores were associated with a significant reduction in all the four OCT measures after controlling for potential confounders including MS subtype, sex, age, disease duration, previous ON history, and duration of exposure to first- and second-line DMTs. The most noticeable reduction was seen in inner GCC thickness (Coef: −1.78 μm, P-value < 0.001) followed by T-pRNFL thickness (Coef: −1.52 μm, P-value < 0.001), and inner GCIP thickness (Coef: −1.28 μm, P-value < 0.001). Cognitive performance as measured by SDMT score was also associated with reduction in all OCT measures. None of the OCT measures were associated with MSIS-29 physical and psychological scales. Limiting the analysis to non-ON eyes did not significantly influence the results (Table 3).
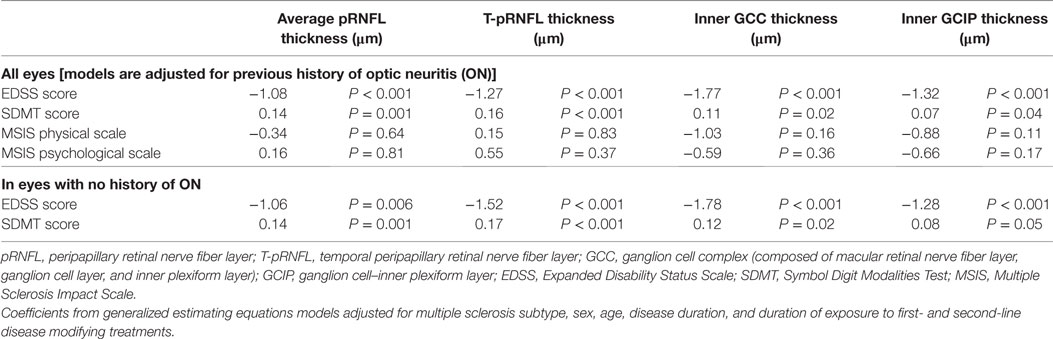
Table 3. The association between optical coherence tomography measures and cognitive and physical disability at baseline.
Baseline OCT Measures and Future Disability Worsening
Over the follow-up time (up to 36 months), on 6-month average, SDMT increased by 1.2 (P-value = 0.005) score. The EDSS score increased by 6-month average of 0.06 score, however, the increase was not significant (P-value = 0.2). Patients with reduced OCT measure scored consistently almost 4.4 SDMT (4.1–4.9) score lower than patients with normal OCT measures over the follow-up time. The EDSS score was also consistently remaining higher in patients with reduced OCT measures. Overall, patients with reduced or normal baseline OCT measures did not diverge significantly differently (having similar rate of change) in their future cognitive performance and physical disability worsening (Table 4; Figures 2 and 3).
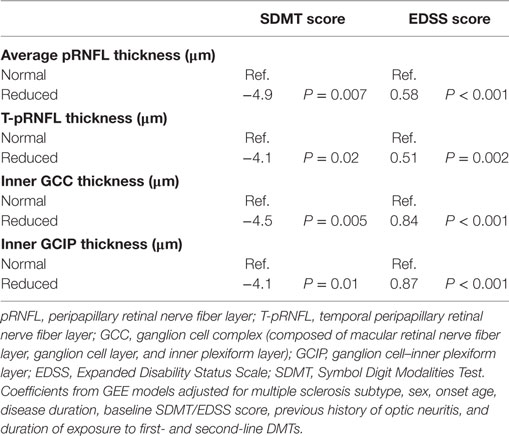
Table 4. Coefficients of interaction between follow-up time and baseline inner GCIP and temporal pRNFL thickness.
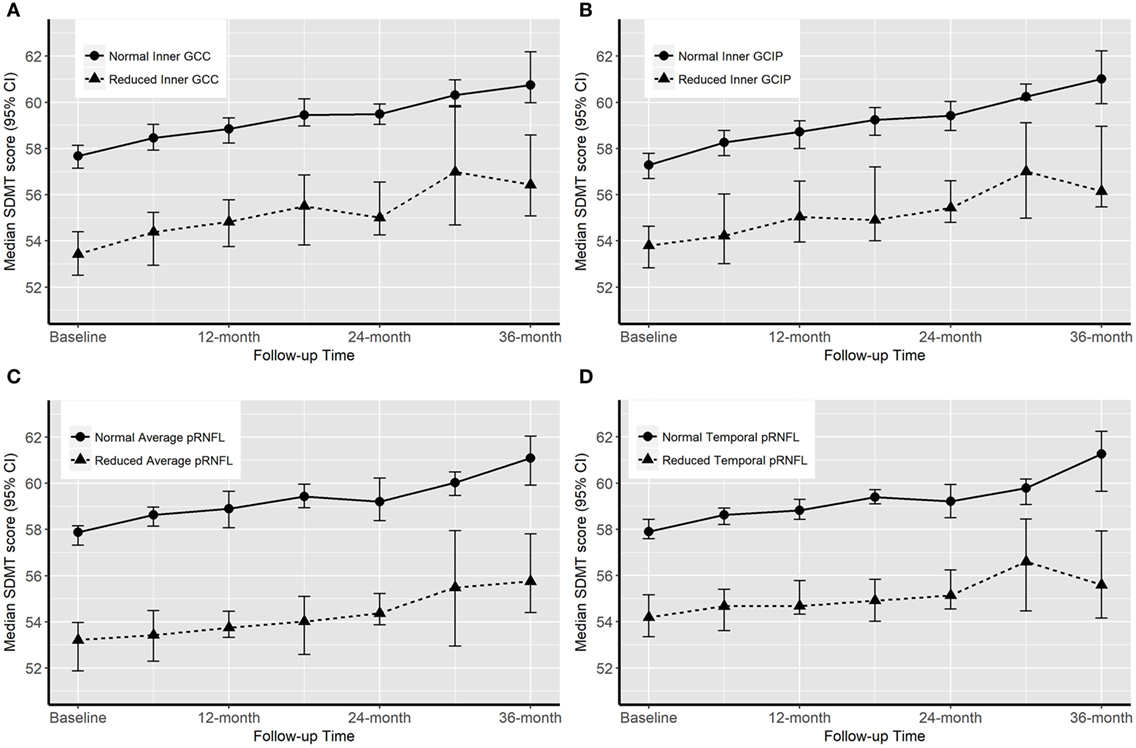
Figure 2. Progression of cognitive impairment [Symbol Digit Modalities Test (SDMT) score] according to the baseline optical coherence tomography (OCT) measures. “Normal” OCT measure falls within one SD of the respective measure in healthy controls (HCs). “Reduced” measures are two or more SDs lower than the respective measure in HCs.
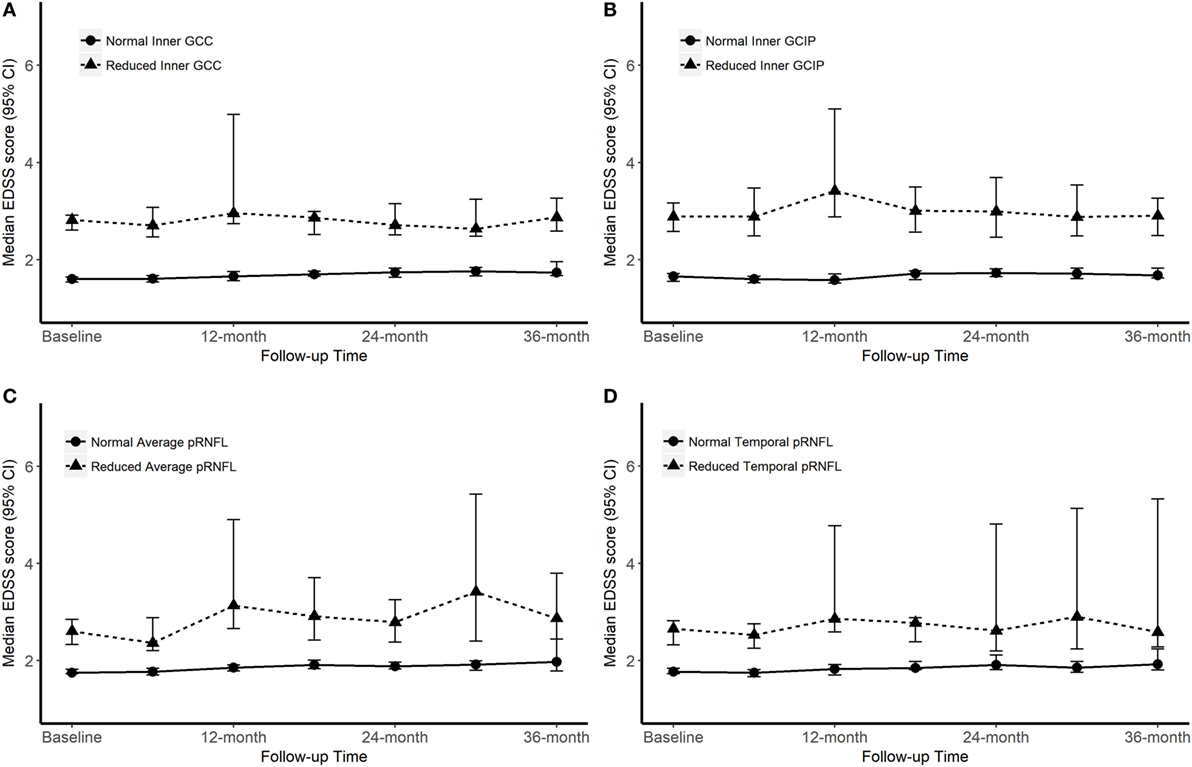
Figure 3. Progression of Expanded Disability Status Scale (EDSS) score according to the baseline optical coherence tomography (OCT) measures. “Normal” OCT measure falls within one SD of the respective measure in healthy controls (HCs). “Reduced” measures are two or more SDs lower than the respective measure in HCs.
Discussion
The results of this study with a large OCT data set from a well-defined MS cohort confirm previous findings of reduced GCIP and pRNFL thickness in patients with MS (17, 30, 31). In our study, the T-pRNFL measurement was the most associative measure for both the physical and cognitive disability assessed by EDSS and SDMT, respectively. All included OCT measures showed a difference between MS subtypes, including PPMS patients, and HCs. Many studies have used the average pRNFL thickness as the main outcome parameter, which according to our findings, is not as sensitive as T-pRNFL to reflect the neurodegenerative aspect of MS. The average pRNFL and T-pRNFL were significantly thinner in all MS subtypes. However, the degree of association (as measured by regression coefficient) for the T-pRNFL was higher than pRNFL in all MS subtypes. The average pRNFL was less sensitive than T-pRNFL in the PPMS group (P = 0.009). The largest atrophy of the inner retinal layers was seen in the T-pRNFL of PPMS patients (16.31 µm). Previous studies have reported that the RNFL thickness is reduced in eyes without previous ON and is associated with optic radiation damage (32, 33). Klistorner and coworkers (33) showed that the largest thinning was seen in the T-pRNFL when comparing MS eyes without history of ON and controls. These results are in line with earlier studies (4, 34, 35) and our study. A preferential loss of axons in the temporal quadrant of the pRNFL might be that this region subserves the central vision and consists primarily of the small parvocellular axons, which are likely to be more susceptible to damage in MS than the larger sized magnocellular axons (36).
The complex of inner GCC and inner GCIP was significantly reduced in thickness in all MS subtypes, especially the inner GCC in the progressive subtypes (12.16 µm in PPMS and 12.79 µm in SPMS). Interestingly, in one of the most recent studies (37) it was presented that a loss of macular ganglion cells was not accompanied by a pRNFL thinning in newly diagnosed RRMS patients without previous history of ON, compared with HCs. They concluded that this finding suggests that the retinal damage might begin in the macular ganglion cell layer and is then spread to the axons.
In a cross-sectional study by Coric et al. (14), an association between atrophy of the inner retinal layers and cognitive impairment was found. The association was confirmed both with T-pRNFL and GCIP thickness. It was noticeable that the GCIP parameter correlated with all the cognitive tests while the T-pRNFL parameter only correlated with SDMT and a test measuring working memory (memory comparison test). When looking at the average pRNFL and T-pRNFL in our study, a strong and statistically significant correlation with SDMT was found, regardless of history of ON. A statistically significant correlation with SDMT was also found in the inner GCC and inner GCIP; however, this relationship showed a weaker P-value. Therefore, the peripapillary OCT measurements seem to reflect MS related cognitive disability better than the macular measurements.
In addition to the association between cognitive dysfunction and inner retinal nerve layer thicknesses, we also found a correlation with physical disability as measured by the EDSS score. Regarding EDSS, all OCT parameters showed a strong and significant correlation (P < 0.001), and it was not possible to conclude if any measurement better explained physical disability than the others.
Garcia-Martin et al. (38) recently reported an association between reduced quality of life (based on 54-item Multiple Sclerosis Quality of Life Scale Score) and peripapillary RNFL thinning in the temporal quadrant over 5 years. In this study, another patient-reported outcome measure was used (MSIS-29), and no correlation was found with any of the inner retinal layer OCT measurements.
Some attempts have been made to study the possibility to use inner retinal thickness parameters to predict the future cognitive and/or physical disability worsening. Coric and coworkers (14) reached the conclusion that atrophy of the inner retinal layers is significantly associated with increased odds of being cognitively impaired. A similar idea was tested by Martinez-Lapiscina et al. (10), although with focus on physical disability. Patients with an average pRNFL equal to or below a certain cutoff value had double risk of disability worsening at any point after 1–3 years. Graham et al. showed that progressive losses of retinal axons were more apparent on T-pRNFL than on GCIP thickness over a 3-year follow-up including RRMS patients (17). To investigate the predictive value of baseline OCT measurements we looked at patients’ disability worsening over a 36-month time period. Overall, while groups with the normal and reduced OCT measures were significantly different in their level of physical and cognitive disability, both groups’ trajectories of disability and impairment worsening were almost parallel over the 36-month time period. Therefore, the longitudinal results from this study cannot confirm the value of patients’ baseline OCT measures in predicting the future physical and cognitive disability.
It has been suggested that the retinal degeneration measured as GCIP or pRNFL could serve as an estimate of the global brain atrophy seen in MS, and that OCT is a useful tool for clinical monitoring and as outcome in investigative trials (8, 12, 39, 40). Compared with magnetic resonance imaging (MRI) OCT is a less time consuming, more cost-efficient, and simpler technique. It is also an imaging technique that is specific for axonal loss and might be a complement to MRI for MS.
From a clinical perspective, it might be preferable to measure neuronal changes in the macula rather than in the optic disk. The OCT images are more easily acquired when the patient fixates straight ahead (macula scan). It is also known that the repeatability is better in the macula than in the optic disk (25). On the other hand, macular images are influenced by common retinal abnormalities, such as epiretinal membrane and age-related macular degeneration. However, MS is a disease that primarily affects the younger population so the risk of having any age-related changes in the macula is small.
The strength of this study, except the large sample size, is the identification of OCT parameters that correlates strongly with both cognitive impairment and physical disability in MS. A limitation with the study and a potential bias is that we did not have the same number of patients through the whole 36-month time period. Therefore, investigations regarding OCT outcomes over time are ongoing.
In conclusion, our results suggest that the T-pRNFL is the most important OCT estimate and that OCT might be a valuable tool in assessing neuronal and axonal degeneration in MS. This study has a cross-sectional value demonstrating a strong association for T-pRNFL with both cognitive and physical disability; however, it is not clear if T-pRNFL can serve as a risk indicator to predict disability worsening.
Ethics Statement
This study was carried out in accordance with the recommendations of Etiska Regionala etikprövningsnämnden with written informed consent from all subjects. All subjects gave written informed consent in accordance with the Declaration of Helsinki. The protocol was approved by the Etiska Regionala etikprövningsnämnden.
Author Contributions
UB, AM, RB, and MN—substantial contributions to the design, acquisition, analysis, and interpretation of data and drafting of the manuscript. MH—substantial contributions to the acquisition, analysis, and interpretation of data and critical revision for intellectual content. JH and FP—substantial contributions to the design, acquisition, analysis, and interpretation of data and critical revision for intellectual content. TO, IK, LB, OZ, and MW-R—substantial contributions to the analysis and interpretation of data and critical revision for intellectual content. All the authors gave final approval of the version to be published and were agreed to be accountable for all aspects of the manuscript in ensuring that questions related to the accuracy or integrity of any part of the work are appropriately investigated and resolved.
Conflict of Interest Statement
The authors declare that the research was conducted in the absence of any commercial or financial relationships that could be construed as a potential conflict of interest.
Supplementary Material
The Supplementary Material for this article can be found online at http://www.frontiersin.org/articles/10.3389/fneur.2017.00675/full#supplementary-material.
Abbreviations
T-pRNFL, temporal peripapillary retinal nerve fiber layer; pRNFL, peripapillary retinal nerve fiber layer; GCIP, ganglion cell–inner plexiform layer; GCC, ganglion cell complex (composed of macular retinal nerve fiber layer, macular ganglion cell layer, and macular inner plexiform layer).
References
1. Pulicken M, Gordon-Lipkin E, Balcer LJ, Frohman E, Cutter G, Calabresi PA. Optical coherence tomography and disease subtype in multiple sclerosis. Neurology (2007) 69(22):2085–92. doi:10.1212/01.wnl.0000294876.49861.dc
2. Petzold A, de Boer JF, Schippling S, Vermersch P, Kardon R, Green A, et al. Optical coherence tomography in multiple sclerosis: a systematic review and meta-analysis. Lancet Neurol (2010) 9(9):921–32. doi:10.1016/s1474-4422(10)70168-x
3. Fjeldstad C, Bemben M, Pardo G. Reduced retinal nerve fiber layer and macular thickness in patients with multiple sclerosis with no history of optic neuritis identified by the use of spectral domain high-definition optical coherence tomography. J Clin Neurosci (2011) 18(11):1469–72. doi:10.1016/j.jocn.2011.04.008
4. Gelfand JM, Goodin DS, Boscardin WJ, Nolan R, Cuneo A, Green AJ. Retinal axonal loss begins early in the course of multiple sclerosis and is similar between progressive phenotypes. PLoS One (2012) 7(5):e36847. doi:10.1371/journal.pone.0036847
5. Oberwahrenbrock T, Schippling S, Ringelstein M, Kaufhold F, Zimmermann H, Keser N, et al. Retinal damage in multiple sclerosis disease subtypes measured by high-resolution optical coherence tomography. Mult Scler Int (2012) 2012:530305. doi:10.1155/2012/530305
6. Petzold A, Balcer LJ, Calabresi PA, Costello F, Frohman TC, Frohman EM, et al. Retinal layer segmentation in multiple sclerosis: a systematic review and meta-analysis. Lancet Neurol (2017) 16(10):797–812. doi:10.1016/s1474-4422(17)30278-8
7. Ewering C, Hasal N, Alten F, Clemens CR, Eter N, Oberwahrenbrock T, et al. Temporal retinal nerve fibre layer thinning in cluster headache patients detected by optical coherence tomography. Cephalalgia (2015) 35(11):946–58. doi:10.1177/0333102414560632
8. Saidha S, Al-Louzi O, Ratchford JN, Bhargava P, Oh J, Newsome SD, et al. Optical coherence tomography reflects brain atrophy in multiple sclerosis: a four-year study. Ann Neurol (2015) 78(5):801–13. doi:10.1002/ana.24487
9. Grazioli E, Zivadinov R, Weinstock-Guttman B, Lincoff N, Baier M, Wong JR, et al. Retinal nerve fiber layer thickness is associated with brain MRI outcomes in multiple sclerosis. J Neurol Sci (2008) 268(1–2):12–7. doi:10.1016/j.jns.2007.10.020
10. Martinez-Lapiscina EH, Arnow S, Wilson JA, Saidha S, Preiningerova JL, Oberwahrenbrock T, et al. Retinal thickness measured with optical coherence tomography and risk of disability worsening in multiple sclerosis: a cohort study. Lancet Neurol (2016) 15(6):574–84. doi:10.1016/s1474-4422(16)00068-5
11. Frohman EM, Dwyer MG, Frohman T, Cox JL, Salter A, Greenberg BM, et al. Relationship of optic nerve and brain conventional and non-conventional MRI measures and retinal nerve fiber layer thickness, as assessed by OCT and GDx: a pilot study. J Neurol Sci (2009) 282(1–2):96–105. doi:10.1016/j.jns.2009.04.010
12. Dorr J, Wernecke KD, Bock M, Gaede G, Wuerfel JT, Pfueller CF, et al. Association of retinal and macular damage with brain atrophy in multiple sclerosis. PLoS One (2011) 6(4):e18132. doi:10.1371/journal.pone.0018132
13. Saidha S, Syc SB, Ibrahim MA, Eckstein C, Warner CV, Farrell SK, et al. Primary retinal pathology in multiple sclerosis as detected by optical coherence tomography. Brain (2011) 134(Pt 2):518–33. doi:10.1093/brain/awq346
14. Coric D, Balk LJ, Verrijp M, Eijlers A, Schoonheim MM, Killestein J, et al. Cognitive impairment in patients with multiple sclerosis is associated with atrophy of the inner retinal layers. Mult Scler (2017) 1:1352458517694090. doi:10.1177/1352458517694090
15. Birkeldh U, Manouchehrinia A, Hietala A, Hillert J, Olsson T, Piehl F, et al. Retinal nerve fibre layer thickness associates with cognitive impairment and physical disability in multiple sclerosis. (2017). (Submitted).
16. Lange AP, Zhu F, Sayao AL, Sadjadi R, Alkabie S, Traboulsee AL, et al. Retinal nerve fiber layer thickness in benign multiple sclerosis. Mult Scler (2013) 19(10):1275–81. doi:10.1177/1352458512474706
17. Graham EC, You Y, Yiannikas C, Garrick R, Parratt J, Barnett MH, et al. Progressive loss of retinal ganglion cells and axons in nonoptic neuritis eyes in multiple sclerosis: a longitudinal optical coherence tomography study. Invest Ophthalmol Vis Sci (2016) 57(4):2311–7. doi:10.1167/iovs.15-19047
18. Narayanan D, Cheng H, Bonem KN, Saenz R, Tang RA, Frishman LJ. Tracking changes over time in retinal nerve fiber layer and ganglion cell-inner plexiform layer thickness in multiple sclerosis. Mult Scler (2014) 20(10):1331–41. doi:10.1177/1352458514523498
19. Bayhan HA, Aslan Bayhan S, Tanik N, Gurdal C. The association of spectral-domain optical coherence tomography determined ganglion cell complex parameters and disease severity in Parkinson’s disease. Curr Eye Res (2014) 39(11):1117–22. doi:10.3109/02713683.2014.894080
20. Cheung CY, Ong YT, Hilal S, Ikram MK, Low S, Ong YL, et al. Retinal ganglion cell analysis using high-definition optical coherence tomography in patients with mild cognitive impairment and Alzheimer’s disease. J Alzheimers Dis (2015) 45(1):45–56. doi:10.3233/jad-141659
21. Ringelstein M, Albrecht P, Kleffner I, Buhn B, Harmel J, Muller AK, et al. Retinal pathology in Susac syndrome detected by spectral-domain optical coherence tomography. Neurology (2015) 85(7):610–8. doi:10.1212/wnl.0000000000001852
22. Albrecht P, Blasberg C, Ringelstein M, Muller AK, Finis D, Guthoff R, et al. Optical coherence tomography for the diagnosis and monitoring of idiopathic intracranial hypertension. J Neurol (2017) 264(7):1370–80. doi:10.1007/s00415-017-8532-x
23. Bennett JL, de Seze J, Lana-Peixoto M, Palace J, Waldman A, Schippling S, et al. Neuromyelitis optica and multiple sclerosis: seeing differences through optical coherence tomography. Mult Scler (2015) 21(6):678–88. doi:10.1177/1352458514567216
24. Saidha S, Syc SB, Durbin MK, Eckstein C, Oakley JD, Meyer SA, et al. Visual dysfunction in multiple sclerosis correlates better with optical coherence tomography derived estimates of macular ganglion cell layer thickness than peripapillary retinal nerve fiber layer thickness. Mult Scler (2011) 17(12):1449–63. doi:10.1177/1352458511418630
25. Brautaset R, Birkeldh U, Rosen R, Ramsay MW, Nilsson M. Reproducibility of disc and macula optical coherence tomography using the Canon OCT-HS100 as compared with the Zeiss Cirrus HD-OCT. Eur J Ophthalmol (2014) 24(5):722–7. doi:10.5301/ejo.5000437
26. Tewarie P, Balk L, Costello F, Green A, Martin R, Schippling S, et al. The OSCAR-IB consensus criteria for retinal OCT quality assessment. PLoS One (2012) 7(4):e34823. doi:10.1371/journal.pone.0034823
27. Schippling S, Balk LJ, Costello F, Albrecht P, Balcer L, Calabresi PA, et al. Quality control for retinal OCT in multiple sclerosis: validation of the OSCAR-IB criteria. Mult Scler (2015) 21(2):163–70. doi:10.1177/1352458514538110
28. Cruz-Herranz A, Balk LJ, Oberwahrenbrock T, Saidha S, Martinez-Lapiscina EH, Lagreze WA, et al. The APOSTEL recommendations for reporting quantitative optical coherence tomography studies. Neurology (2016) 86(24):2303–9. doi:10.1212/wnl.0000000000002774
29. R Core Team. R: A Language and Environment for Statistical Computing. Vienna, Austria: R Foundation for Statistical Computing (2017). Available from: https://www.R-project.org/
30. Balk LJ, Cruz-Herranz A, Albrecht P, Arnow S, Gelfand JM, Tewarie P, et al. Timing of retinal neuronal and axonal loss in f: a longitudinal OCT study. J Neurol (2016) 263(7):1323–31. doi:10.1007/s00415-016-8127-y
31. Huang-Link YM, Fredrikson M, Link H. Benign multiple sclerosis is associated with reduced thinning of the retinal nerve fiber and ganglion cell layers in non-optic-neuritis eyes. J Clin Neurol (2015) 11(3):241–7. doi:10.3988/jcn.2015.11.3.241
32. Sinnecker T, Oberwahrenbrock T, Metz I, Zimmermann H, Pfueller CF, Harms L, et al. Optic radiation damage in multiple sclerosis is associated with visual dysfunction and retinal thinning – an ultrahigh-field MR pilot study. Eur Radiol (2015) 25(1):122–31. doi:10.1007/s00330-014-3358-8
33. Klistorner A, Sriram P, Vootakuru N, Wang C, Barnett MH, Garrick R, et al. Axonal loss of retinal neurons in multiple sclerosis associated with optic radiation lesions. Neurology (2014) 82(24):2165–72. doi:10.1212/wnl.0000000000000522
34. Pueyo V, Martin J, Fernandez J, Almarcegui C, Ara J, Egea C, et al. Axonal loss in the retinal nerve fiber layer in patients with multiple sclerosis. Mult Scler (2008) 14(5):609–14. doi:10.1177/1352458507087326
35. Henderson AP, Trip SA, Schlottmann PG, Altmann DR, Garway-Heath DF, Plant GT, et al. An investigation of the retinal nerve fibre layer in progressive multiple sclerosis using optical coherence tomography. Brain (2008) 131(Pt 1):277–87. doi:10.1093/brain/awm285
36. Evangelou N, Konz D, Esiri MM, Smith S, Palace J, Matthews PM. Size-selective neuronal changes in the anterior optic pathways suggest a differential susceptibility to injury in multiple sclerosis. Brain (2001) 124(Pt 9):1813–20. doi:10.1093/brain/124.9.1813
37. Pietroboni AM, Dell’Arti L, Caprioli M, Scarioni M, Carandini T, Arighi A, et al. The loss of macular ganglion cells begins from the early stages of disease and correlates with brain atrophy in multiple sclerosis patients. Mult Scler (2017) 1:1352458517740214. doi:10.1177/1352458517740214
38. Garcia-Martin E, Ara JR, Martin J, Almarcegui C, Dolz I, Vilades E, et al. Retinal and optic nerve degeneration in patients with multiple sclerosis followed up for 5 years. Ophthalmology (2017) 124(5):688–96. doi:10.1016/j.ophtha.2017.01.005
39. Gandhi S, Hagemeier J, Chandra A, Ahmed Sanai S, Jakimovski D, Ahmed R, et al. Optical coherence tomography is associated with development of brain atrophy in relapsing-remitting multiple sclerosis: a longitudinal 5-year follow-up study. Neurology (2016) 86(16 Supplement):P4.142.
Keywords: multiple sclerosis, retinal nerve fiber layer, ganglion cell–inner plexiform layer, optical coherence tomography, cognitive impairment, physical disability
Citation: Birkeldh U, Manouchehrinia A, Hietala MA, Hillert J, Olsson T, Piehl F, Kockum IS, Brundin L, Zahavi O, Wahlberg-Ramsay M, Brautaset R and Nilsson M (2017) The Temporal Retinal Nerve Fiber Layer Thickness Is the Most Important Optical Coherence Tomography Estimate in Multiple Sclerosis. Front. Neurol. 8:675. doi: 10.3389/fneur.2017.00675
Received: 05 October 2017; Accepted: 28 November 2017;
Published: 13 December 2017
Edited by:
Zsolt Illes, University of Southern Denmark Odense, DenmarkReviewed by:
Friedemann Paul, Charité Universitätsmedizin Berlin, GermanyAnna Margherita Pietroboni, Fondazione IRCCS Ca’ Granda Ospedale Maggiore Policlinico (IRCCS), Italy
Copyright: © 2017 Birkeldh, Manouchehrinia, Hietala, Hillert, Olsson, Piehl, Kockum, Brundin, Zahavi, Wahlberg-Ramsay, Brautaset and Nilsson. This is an open-access article distributed under the terms of the Creative Commons Attribution License (CC BY). The use, distribution or reproduction in other forums is permitted, provided the original author(s) or licensor are credited and that the original publication in this journal is cited, in accordance with accepted academic practice. No use, distribution or reproduction is permitted which does not comply with these terms.
*Correspondence: Ulrika Birkeldh, ulrika.birkeldh@ki.se