 Jonah Doustar
 Tania Torbati
 Keith L. Black1
 Maya Koronyo-Hamaoui
- 1Department of Neurosurgery, Maxine Dunitz Neurosurgical Research Institute, Cedars-Sinai Medical Center, Los Angeles, CA, United States
- 2College of Osteopathic Medicine of the Pacific, Western University of Health Sciences, Pomona, CA, United States
- 3Department of Biomedical Sciences, Cedars-Sinai Medical Center, Los Angeles, CA, United States
Over the past decade, a surge of evidence has documented various pathological processes in the retina of patients suffering from mild cognitive impairment, Alzheimer’s disease (AD), Parkinson’s disease (PD), and other neurodegenerative diseases. Numerous studies have shown that the retina, a central nervous system tissue formed as a developmental outgrowth of the brain, is profoundly affected by AD. Harboring the earliest detectable disease-specific signs, amyloid β-protein (Aβ) plaques, the retina of AD patients undergoes substantial ganglion cell degeneration, thinning of the retinal nerve fiber layer, and loss of axonal projections in the optic nerve, among other abnormalities. More recent investigations described Aβ plaques in the retina located within sites of neuronal degeneration and occurring in clusters in the mid- and far-periphery of the superior and inferior quadrants, regions that had been previously overlooked. Diverse structural and/or disease-specific changes were also identified in the retina of PD, Huntington’s disease, and multiple sclerosis patients. The pathological relationship between the retina and brain prompted the development of imaging tools designed to noninvasively detect and monitor these signs in living patients. One such tool is optical coherence tomography (OCT), uniquely providing high-resolution two-dimensional cross-sectional imaging and three-dimensional volumetric measurements. As such, OCT emerged as a prominent approach for assessing retinal abnormalities in vivo, and indeed provided multiple parameters that allowed for the distinction between normal aged individuals and patients with neurodegenerative diseases. Beyond the use of retinal optical fundus imaging, which recently allowed for the detection and quantification of amyloid plaques in living AD patients via a wide-field view of the peripheral retina, a major advantage of OCT has been the ability to measure the volumetric changes in specified retinal layers. OCT has proven to be particularly useful in analyzing retinal structural abnormalities consistent with disease pathogenesis. In this review, we provide a summary of OCT findings in the retina of patients with AD and other neurodegenerative diseases. Future studies should explore the combination of imaging early hallmark signs together with structural–functional biomarkers in the accessible retina as a practical means of assessing risk, disease progression, and therapeutic efficacy in these patients.
Introduction
Shielded against external injuries, the brain is a concealed central nervous system (CNS) structure that may be uniquely observed through the one exception to its enclosure: the retina. The neuro retina, a developmental outgrowth of the embryonic brain, contains multiple molecular and cellular features in common with the brain, including neurons, glial cells, connected vasculature, and the existence of a blood barrier (1–4). The tight link between these two CNS tissues raises the prospect of whether the easily accessible retina may faithfully represent the brain in healthy and neurodegenerative conditions.
As the most common form of neurodegeneration, Alzheimer’s disease (AD) is an invariably fatal senile dementia with no cure and limited ability for early unequivocal diagnosis in primary care settings (5). AD is clinically represented by severe cognitive decline, socio-behavioral manifestations, and various visual dysfunctions involving narrowed visual field, reduced contrast and color recognition, and circadian sleep-wake disturbances (6–10). Its neuropathology is a complex continuum of detrimental processes, most likely beginning with the accumulation and propagation of misfolded amyloid β-protein (Aβ) assemblies followed by the hyperphosphorylation of (p)tau proteins forming neurofibrillary tangles (NFTs) (11). These processes are thought to initiate a cascade of secondary pathologies including destructive inflammatory responses, vascular-associated abnormalities, oxidative stress, mitochondrial dysregulation, and vast synaptic and neuronal loss (12–14). While these secondary indicators are shared among several neurodegenerative diseases, they may indicate disease progression, denoting functional deterioration and clinical staging. Importantly, growing evidence indicates that AD is not confined to the brain but also massively affects the retina, an organ feasible for direct, high-resolution imaging [reviewed in Ref. (15)].
Over the past three decades, corresponding pathologies associated with tissue degeneration were found in the retina of patients with neurodegenerative diseases [reviewed in Ref. (2, 15, 16)]. In particular, severe optic nerve and retinal ganglion cell (RGC) degeneration, thinning of the retinal nerve fiber layer (RNFL), and abnormal electroretinography responses were documented in patients with mild cognitive impairment (MCI) and AD, perhaps offering an effective measure of neurodegenerative progression. Similar to AD, other neurological diseases have been shown to affect the retina in certain geometric locations and cellular layers. This pathological relationship between the retina and brain prompted the development of imaging tools designed to noninvasively detect and monitor these signs in living patients.
One such tool, optical coherence tomography (OCT), is a unique technology providing high-resolution (1–15 µm) two-dimensional cross-sectional imaging and three-dimensional volumetric measurements. As such, OCT is emerging as a prominent technique for assessing retinal abnormalities in vivo, utilizing the reflective and optical properties of tissue against a long wavelength light beam for analysis and distinction of layers (17–22). Several generations of enhancements have produced different modalities such as Fourier/frequency domain OCT (fd-OCT), stratus-OCT, and spectral domain OCT (sd-OCT), which has distinct advantages in resolution and signal-to-noise ratios above time domain OCT (19, 23–25). In recent years, multiple studies have acknowledged the benefits of these advancements, particularly in AD, Parkinson’s disease (PD) and Huntington’s disease (HD). Along with future technological improvements, the ability of OCT to provide detailed data on retinal atrophy may prove to be a useful technique for assessing neurodegenerative attributes in patients, both post- and presymptomatic.
While the pathological hallmarks of AD—Aβ plaques and NFTs—have been well established in the brain for over a century, their existence in the retina has only recently been identified (26–28). Likewise, accumulation of the PD pathological hallmark α-synuclein was newly shown in retinal tissues of patients (29). Disease-specific protein aggregates are definitive signs that could facilitate differential diagnosis between various neurodegenerative diseases affecting the CNS. In particular, cerebral Aβ deposits are asserted as the earliest pathognomonic risk factor for AD, evidenced by studies detecting accumulation as early as 20 years prior to the onset of clinical dementia, an insidious phase denoted as prodromal AD (12, 30, 31). Recent identification of retinal Aβ deposits in concurrence with RGC degeneration in AD patients (26, 28) combined with the accessibility of the retina for noninvasive high-resolution imaging offers hope for prodromal phase intervention and effective treatment. This review covers key pathological findings in the retina of AD and other neurodegenerative diseases, as well as current investigational retinal imaging approaches to detect disease in living patients, with a focus on the utility of OCT.
Retinal Pathology in AD
Evidence of Retinal Degeneration in AD
Growing evidence suggests that various cerebral pathologies associated with AD also exist in the retina of MCI and AD patients (15, 21, 32–51). In 1986, Hinton et al. reported findings of optic nerve degeneration in 8/10 AD patients, of which 3/4 patient retinas also displayed ganglion cell layer (GCL) loss and thinning of the RNFL (52). In a follow-up study, Blanks et al. (53) confirmed the original report in 14/16 AD patients, with a significant loss of RGCs and their axons as well as vacuolar degeneration occurring within these cells (53). An investigation by Sadun and Bassi (54) suggested similar findings, while highlighting a predominant loss of M-cell class RGCs (54). A later study showed an extensive decrease in ganglion cell number in the foveal and parafoveal retina (55). Examination of flatmount retinas including peripheral regions from 11 AD patients and 9 controls revealed a substantial >36% overall neuronal loss throughout the retina, which was more pronounced in the superior and inferior quadrants, specifically in the mid-peripheral regions (40–49%) and far-peripheral inferior retina (50–59%) (56).
With regard to inflammation and vascular changes, retinal astrogliosis was described alongside neuronal loss in the retina of AD patients (56). Subsequent examination of AD retina added support for structural changes in inner retinal layers (41, 57), and further uncovered a host of alterations in cup-to-disk ratio, macular volume, blood flow, and vasculature (15, 58–64). Of great interest were numerous findings of retinal angiopathy and vascular-related changes similar to cerebral AD pathologies, including narrowed veins, reduction of blood flow, elevated blood oxygen saturation, and increased tortuosity (36, 59, 60, 64–66). Converging data on AD-related retinal abnormalities encouraged investigators to develop noninvasive retinal imaging modalities in order to detect and measure these anatomical changes in living patients. This was initially attempted using blue-light high-resolution photography by Tsai et al. (63), and later advanced to utilizing cross-sectional imaging by OCT (34, 37, 67–70). OCT findings in MCI, AD, and PD patients along with their correlations with cognition and vision are described subsequently and summarized in Tables 1 and 2.
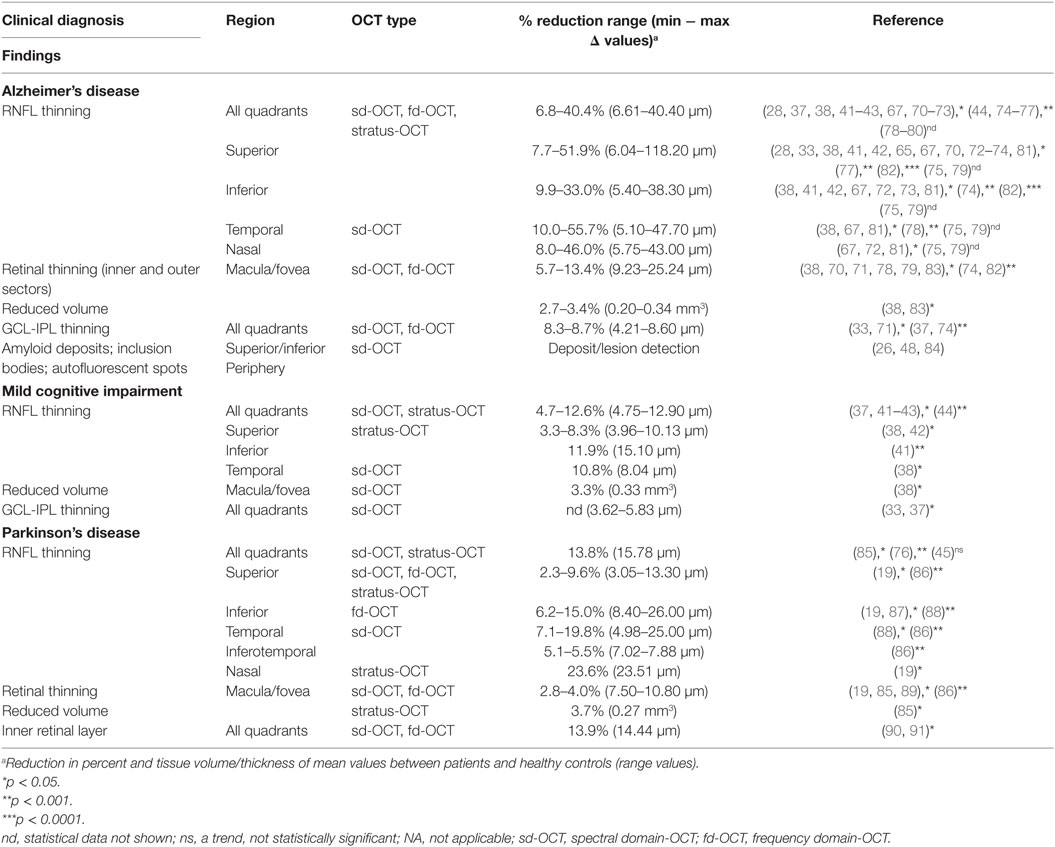
Table 1. OCT findings in the retina of AD, MCI, and PD patients.
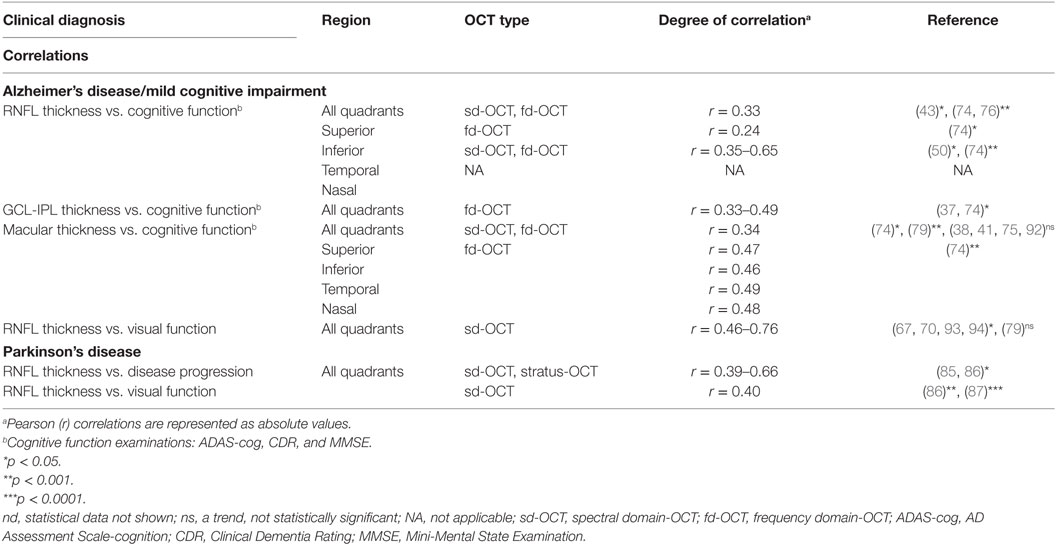
Table 2. Correlations between OCT findings and clinical dysfunction/progression in AD and PD patients.
AD Hallmark Pathology in the Retina
While structural and vascular alterations observed in the retina of AD patients may prove essential for predicting functional decline or conversion to symptomatic AD, they could be shared among several neurodegenerative diseases. It was not until recently that the existence of AD-specific hallmarks, Aβ plaques, was revealed by Koronyo-Hamaoui et al. (27) in 13/13 postmortem retinas of definite AD patients and early-stage cases, in a stark contrast to 5 healthy controls (27). Corroborating these findings, several other groups later demonstrated elevated Aβ peptides, forms of Aβ deposits, and the presence of hyperphosphorylated (p)tau in retinas of AD patients but not in controls (26, 28, 95–98). Scanning of large flatmount retinal sections, especially of mid- and far-peripheral regions, allowed for the identification of diverse retinal Aβ plaque morphologies that were often associated with blood vessels or colocalized with sites of cell degeneration (26–28). Retinal plaque pathology mirrored amyloid pathology in the brain, including the vascular amyloid component and the existence of classical and neuritic plaques as well as proto-fibrils and fibrils comprised of Aβ42 alloforms (26, 27).
Cross sections isolated from regions rich in Aβ pathology showed that these plaques occur in patients more abundantly in inner retinal layers, especially in the GCL, while colocalizing around and within degenerating RGCs (see Figures 1A–D) (26). Curcumin-based fundus imaging in 10 living AD patients versus 6 healthy controls showed that, in agreement with histologic examination of additional retinas from 23 definite AD patients versus 14 healthy controls, retinal Aβ deposits appear in clusters and are frequently mapped to peripheral regions of the superior and inferior quadrants (see Figures 1E–G) (26). These regions were often overlooked due to their perceived irrelevance in common retinopathies [i.e., age-dependent macular degeneration (AMD), glaucoma] and visual acuity (VA).
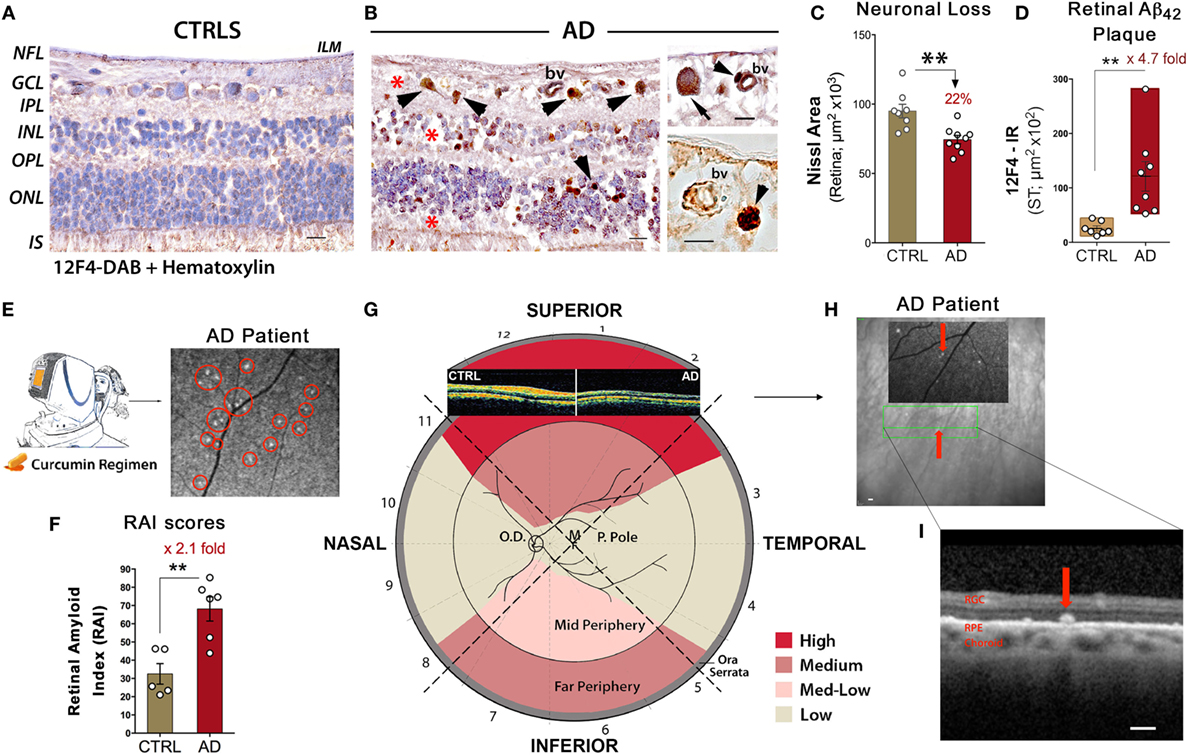
Figure 1. Noninvasive retinal imaging in Alzheimer’s patients: detecting Aβ deposits and nerve degeneration via scanning laser ophthalmoscopy and optical coherence tomography. (A,B) Retinal cross sections from superior quadrants of Alzheimer’s disease (AD) patients (n = 12) and matched healthy controls (CTRL; n = 8) stained with anti-Aβ42 mAbs (12F4) and peroxidase-based labeling (brown). Hematoxylin counterstain for nuclei (violet). Retinas of AD patients contained a multitude of Aβ deposits (arrowheads), especially in the ganglion cell layer (GCL). Marked loss of retinal cells is apparent in the GCL, inner nuclear layer (INL), and outer nuclear layer (ONL); areas of nuclei loss are indicated by red asterisks. The inner limiting membrane (ILM) and retinal nerve fiber layer (RNFL) are intact in CTRL in contrast to AD. Scale bars = 20 μm. Higher magnification images [(B), right panel] show Aβ deposits near and inside blood vessel walls (bv; arrowheads) and inside ganglion cell soma (arrow). Scale bars = 10 μm. (C) Quantitative Nissl neuronal area in AD patients (n = 9) and age- and gender-matched CTRL (n = 8) revealing a significant reduction in AD patients. (D) Quantitative analysis of 12F4-immunoreactive (IR) area of Aβ42-containing plaques in the superior quadrant of retinal flatmounts in a subset of definite AD patients (n = 8) and matched controls (n = 7) showing a significant increase of Aβ42 plaques in AD patients. (E) Schematic of a noninvasive retinal amyloid imaging method using curcumin (Longvida®) to label retinal Aβ in live human patients. Subjects’ retinas were imaged with a modified scanning-laser ophthalmoscope prior to and following curcumin intake. White spots marked by red circles are curcumin-positive amyloid plaques detected in the retina of a living AD patient. (F) Scatter bar plot displays retinal amyloid index (RAI) scores, a fully automated calculation of increased curcumin fluorescence representing amyloid deposits in the retina. AD patients (n = 6) showed a significant increase in RAI score in comparison to age-matched CTRL (n = 5). (G) Qualitative mapping of the “geometric hotspot” regions of Aβ deposits in retinal quadrants of AD patients. Schematic of OCT images from an AD patient vs. control are shown [adopted from: Coppola et al. (21)]. (H) OCT image of a selected curcumin-positive plaque (red arrow) in an AD patient with no maculopathy. Certain retinal amyloid plaque visualized by curcumin fluorescence fundography in insert. Green lines delineate region of OCT segmentation. (I) Retinal cross section by OCT reveals amyloid plaque in outer retinal layers; curcumin-positive deposit located above retinal pigment epithelium (RPE), along with intact RPE and Bruch’s membrane. Scale bars = 200 μm. Group means and SEMs are shown. *p < 0.05 and **p < 0.01, unpaired two-tailed Student’s t-test. Images and data of (A–I) panels, except for part of (E), are modified reprinted from Koronyo et al. (26).
A quantitative histological analysis of Aβ42-containing retinal plaques in 8 confirmed AD patients and 7 age- and gender-matched controls indicated a substantial 4.7-fold increase of plaque burden in the retina of patients (Figure 1D), correlating with Aβ burden in the respective brains (26). Similarly, noninvasive curcumin fundus imaging in living patients showed a 2.1-fold increase in retinal amyloid index (RAI) scores in a subset of AD patients versus matched controls (Figure 1F) (26). The discovery of classical and neuritic-like plaques, albeit smaller in size compared to plaques in the brain, along with NFTs, Aβ42 fibrils, protofibrils, and structures resembling oligomers, suggests that the specific signs of AD are shared between the retina and the brain (26). Importantly, in a clinical study, circadian dysfunctions were found in AD patients along with structural OCT changes, especially in the superior quadrant (28). Degeneration of (melanopsin-containing) mRGCs, photoreceptors known to drive circadian photoentrainment, was further shown to be associated with retinal Aβ deposits in AD patients [reviewed in Ref. (99)].
In agreement with findings in patients, retinal Aβ deposits were identified in various transgenic and sporadic rodent models of AD at different disease stages [reviewed in Ref. (15, 100)] (27, 98, 101–107). Retinal Aβ was associated with RGC degeneration, local inflammation, and functional impairments. Transgenic mouse models of AD subjected to immunotherapy (108–111) exhibited reduction of Aβ plaque burden in the retina to the same extent as in the brain (27, 104, 105, 112). To visualize in vivo retinal Aβ pathology in animal models and AD patients, our group developed a noninvasive retinal amyloid imaging method, using curcumin as a fluorescent probe binding to Aβ deposits (26, 27, 104). This approach enabled noninvasive, longitudinal monitoring of individual Aβ deposits, their appearance during disease progression, and their clearance following immunomodulation therapy in mice (104). The evidence of atrophic and proteinaceous pathology in animal models and AD patient retinae, described above, provides the rationale for the application of OCT retinal imaging in neurodegeneration detection.
OCT Findings in AD
RNFL Thinning
Current OCT research investigating visual system degeneration in various neurological diseases produces compelling evidence for retinal thinning, particularly in MCI and AD (see summary in Table 1). While a subset of these studies have shown specific deterioration of the GCL along with the inner plexiform layer (IPL) (33, 37, 71, 74), the majority have demonstrated thinning of the RNFL, especially in the superior and inferior quadrants, with a focus on the peripapillary region [peripapillary retinal nerve fiber layer (pRNFL)] surrounding the optic disk (21, 34, 35, 37, 50, 65, 68, 71, 74, 78, 83, 92, 113, 114). As the inner-most layer of the ocular fundus, this area is composed of RGC axonal projections leading to the optic nerve. Parisi et al. (67) were the first to describe retinal abnormalities in AD patients by utilizing cross-sectional imaging by OCT (67). With modern advancements in noninvasive imaging technologies including next-generation OCT methods along with the identification of pathological hallmarks in the retina, there has been an exponential growth of investigations into retinal pathology in AD patients, especially using OCT. A recent report extensively assessed quadrant-specific circumpapillary RNFL and macular thickness as well as macular volume in AD patients compared to healthy controls (AD, n = 18; HC, n = 41) (32). Significant thinning in all quadrants—superior, inferior, nasal, and temporal—of the circumpapillary RNFL (p < 0.001) of both left and right eyes was detected, in addition to inner and outer macular ring thinning.
Although a couple of studies failed to find differences in retinal thickness between patients with AD or MCI and matched HC (45, 92), many more studies detected significant RNFL structure abnormalities in AD and MCI patients compared with matched HC (32, 37, 38, 41–44, 46, 50, 67, 71–73, 75, 76, 78, 79, 81, 82, 87, 114–116). These reports have indicated that RNFL thickness in the patients was substantially decreased in all quadrants or that there were specific reductions in the supraretina and infra-retina. Moreover, meta-analysis studies support the important role of OCT for RNFL analysis in monitoring the progression of AD by reporting that retinal thickness was significantly decreased in AD and MCI patients compared to HC (21, 35). Results of OCT studies in MCI and AD patients are summarized in Table 1.
Although measurements of RNFL thinning in AD demonstrates promise as a means of assessing degeneration, investigation of distinct AD effects in certain retinal regions could enhance the practicality of OCT in diagnosis, since some overlap was reported between OCT findings in AD and other neurodegenerative diseases. One study reported a significant decrease in RNLF thickness in AD, dementia with Lewy bodies, and dementia associated with PD, compared to HC group; however, there was no significant difference between types of dementia (76). In addition, patients with frontotemporal dementia exhibited a significant pRNFL reduction, similar to AD and MCI patients (37). In a more recent multisite study, 21 AD patients were compared against 74 age-matched controls, revealing a significant (p = 0.038) reduction in average RNFL thickness via OCT imaging. A detailed investigation into region-specific degeneration showed that the superior quadrant presented the most significant reduction [p = 0.006 (28)]. A continued theme of quadrant-specific RNFL thinning in the superior region has been reported in multiple AD retinal studies (33, 41, 42, 65, 68, 70, 73, 77). Marked RNFL thinning in the superior quadrant in AD patients may significantly correlate with disease stage and support the important role of OCT for RNFL analysis in monitoring AD progression.
Correlation of RNFL Thickness with Visual-Related Dysfunction in AD
To explore a possible relationship between OCT-detected retinal structural abnormalities and visual dysfunctions in AD patients, a correlation between RNFL thinning and retinal electrical response via pattern electroretinogram (PERG) was investigated in these patients (67). Specifically, each participant was exposed to a controlled, standardized stimulus, with amplitudinal voltage response as the measured dependent variable. Response time of N35, P50, and N95 were significantly delayed with the amplitudinal difference from N35-P50 and P50-N95 also equally impaired in AD subjects (67). When these data were compared against RNFL thickness, significant correlations between overall RNFL and PERG P50 and N95 implicit times as well as P50-N95 amplitude were revealed. A follow-up study from the same research group found similar correlations between retinal structure and function among patients affected by ocular hypertension glaucoma, demyelinating optic neuritis (MSON), and AD (93). Those patients who exhibited abnormal PERG responses with delayed implicit times and reduced amplitudes also had a significant reduction in NFL thickness compared to controls (93).
A later study by Iseri et al. (79) did not find a significant difference in the latency of visual-evoked potential P100 between AD patients and control subjects, with no correlation to RNFL thinning (79). Of note, Moschos et al. (82) reported a decrease in macular and RNFL thickness along with reduced multifocal-ERG activity of the macula in patients with AD, even in those without visual deficits (82).
Impairments in contrast-sensitive vision (CSV), VA, and color vision (CV) in AD patients were demonstrated in a study by Polo et al. (70), together with a strong correlation to sd-OCT measurements (70). In addition to superior quadrant thinning of the RNFL, both CSV and CV significantly worsened in AD patients as compared to controls. CSV was the functional parameter most strongly correlated with structural measurements in patients with AD; CV was strongly associated with macular volume. VA at different levels of contrast was associated with macular and RNFL thickness in AD (70). The correlations between OCT findings and visual-related changes are summarized in Table 2. Future examination of morphological and pathological origins of ocular functional decline should be performed to establish the association between visual-related dysfunction and RNFL thickness in AD.
Correlation of Retinal Thickness and Cognitive Function in MCI and AD
An intriguing study by Ascaso et al. (32) described that the retinal thinning observed in MCI patients was further exacerbated in AD patients. A correlation between RNFL thickness and cognitive assessments such as the Mini-Mental State Examination (MMSE), Alzheimer’s Disease Assessment Scale-cognition (ADAS-cog), or Clinical Dementia Rating (CDR) could help to conclusively determine the coprogression of RNFL thinning and cognitive decline (32). Indeed, in a new study by Ferrari et al. (37) in which AD and MCI patients exhibited a significant reduction in RNFL and GCL-IPL compared to HC, the GCL-IPL thickness measurement correlated with MMSE scores without significant effects of age, gender, or disease duration. Correlation with disease severity in AD suggested that retinal and brain neurodegeneration may occur in parallel to some extent (37). Furthermore, Cunha et al. (74) revealed that there is a significant correlation in AD patients between MMSE scores and pRNFL thickness in average (p = 0.001), superior quadrant (p = 0.019), and inferior quadrant thickness (p < 0.001) (74). Significant correlations were also noted in various full-length macular measurements (i.e., average thickness, p = 0.001) as well as GCL-IPL layer thickness (p = 0.001) (74).
The relationship between the degree of cognitive impairment and RNFL thickness was further studied by Oktem et al. (43). RNFL thickness was significantly lower in AD and MCI groups compared with the HC group; a significant correlation was found between MMSE scores and RNFL thickness values (43). To investigate the potential association between RNFL thickness and episodic memory in MCI patients, Shen et al. (46) reported that in MCI patients, inferior quadrant RNFL thickness was inversely associated with the following episodic memory scores: word list learning (r = −0.652, p = 0.001), story memory (r = −0.429, p = 0.041), and story recall (r = −0.502, p = 0.015) (46). A summary of correlation analyses between OCT measurements and cognitive dysfunctions is displayed in Table 2.
Interestingly, Iseri et al. (79) found that reduction in macular volume in AD patients was linked to severity of cognitive impairment; total macular volume and MMSE scores were significantly correlated (79). A longitudinal case study spanning 12 months investigated whether OCT measurements of AD patients would correlate with progressive changes in cognition as determined by multiple cognitive exams (50). In particular, significant correlations between the change in pRNFL thickness and the shift in ADAS-cog (r = −0.35, p = 0.02) and CDR scores (r = −0.39, p = 0.008) were found (50). Since a few studies resulted in no significant correlation between cognition and OCT-derived degeneration (38, 41, 75, 92), further careful investigation is needed to determine whether OCT can be used to determine neurodegeneration as the source of cognitive dysfunction in AD.
Noninvasive Retinal Amyloid Imaging in AD
Optical coherence tomography is a valuable and useful in vivo technique for determining retinal structural abnormalities and cell neurodegeneration in AD patients, and may help to distinguish between HC, AD patients, and other neurodegenerative diseases by the measure of RNFL thinning, specifically in the superior and inferior quadrants. Yet, definitive diagnosis of AD requires the hallmark specific identification of Aβ and NFTs. In recent years, a few studies have been able to detect retinal amyloid deposits, inclusion bodies, and autofluorescent spots in live subjects via a modified scanning laser ophthalmoscope (SLO), fundus autofluorescence (FAF) imaging, and/or OCT. In a clinical study, Kayabasi et al. (84) examined 30 MCI patients with FAF and OCT and claimed to detect abnormal Aβ deposits, mostly in the outer plexiform, ganglion, and nerve fiber layers of the retina, concentrated in the perimacular and perivascular areas (84). In a subset of 20 patients and 20 HC, hyperintense dots were detected with FAF following turmeric (Phytosome-Meriva) administration. Additional examination with OCT showed that the deposits were more prominent in MCI patients (84). In 2016, a study by Snyder et al. used OCT to explore whether retinal anatomic alterations are visible in pre-clinical stages of AD (48). A comparison between neocortical amyloid aggregation (florbetapir PET imaging) and various retinal sd-OCT markers of possible disease burden revealed that the surface area of retinal inclusion bodies significantly increased as a function of cortical amyloid burden (48).
Notably, Koronyo et al. (26) recently employed proprietary curcumin administration to fluorescently label amyloid deposits in the retina of 10 AD patients as compared to 2 patients with AMD and 6 HC (26). Imaging subjects with a modified SLO, prior to and after curcumin oral uptake, allowed for the detection of curcumin fluorescence signal and amyloid deposits with high resolution (Figure 1E). In this proof-of-concept clinical study, the feasibility to detect significant augmentation in retinal amyloid burden in a subset of AD patients compared to matched HC was demonstrated (Figure 1F) (26). Further, the team utilized focal scanning by OCT and revealed specified localization of amyloid deposits above retinal pigment epithelium and in the outer layers of the retina (Figures 1H,I). Importantly, this was in the absence of any maculopathy and was different than the picture in AMD patients (26). Consistent with histological examinations, retinal amyloid deposits measured in vivo were frequently concentrated in the mid- and far-periphery of the superior hemisphere (Figures 1E,G), an area that shows significant RNFL thinning in AD patients by OCT studies. While OCT has been presented as a feasible method of detecting neurodegeneration, these recent studies may implicate a new enhanced application of OCT to provide layer localization of the identified retinal plaques by SLO in MCI and AD patients.
OCT in Other Neurodegenerative Disorders
Parkinson’s Disease
As the second most common neurodegenerative disease, PD is characterized by motor dysfunctions such as tremor, rigidity, and bradykinesia in addition to psychological impairments including cognitive deficits, mood variability, and dementia (117–119). Like AD patients, individuals suffering from PD experience visual disturbances, which, in particular, manifest as hallucinations and reduced VA (16, 58, 85–87, 120, 121). Physiological injury primarily involves the loss of cerebral dopamine, a neurotransmitter involved in physical movement and reward-seeking behavior. Initial studies examining the retina of PD patients by OCT reported a significant reduction in RNFL thickness (inferotemporal, superotemporal, inferior, and temporal quadrants) (19, 76, 82, 87, 88, 90, 122), macular thickness (85, 89, 91), and foveal thickness (123) when compared to healthy subjects. OCT abnormalities in PD patients and their correlations with disease progression alongside visual dysfunction are summarized in Tables 1 and 2.
Notably, a large, longitudinal study evaluated the retina of PD patients via OCT and revealed that these patients exhibit a significant progressive thinning of the RNFL in the superotemporal and inferotemporal regions as well as a reduction in macular thickness against healthy controls (86). After a 5-year follow-up, the results indicating a significant reduction in the superotemporal and temporal regions were confirmed. Importantly, there was a moderate correlation between superotemporal thinning and visual dysfunction as well as disease severity (86). Although one study was unable to find differences between PD patients and matched controls in RNFL and GCL thickness and in macular volume (45), other studies supported these findings (19, 76, 82, 85–91, 122, 123). With the recent studies demonstrating a progressive retinal degeneration and the discovery of disease-specific α-synuclein in the retina of PD patients (29, 89–91, 120, 124–126), the use of retinal imaging in measuring PD-related neurodegeneration is promising, especially OCT. So far, OCT has seemingly provided an effective means of assessing structural changes in the retina in order to identify suitable detection pathways that may allow for earlier diagnosis, treatment, and slowing of disease progression.
Huntington’s Disease
Patients with HD, a neurodegenerative disease with a largely genetic component, experience a wide array of symptoms including involuntary muscular movements known as chorea, dementia, and behavioral disturbances (119, 127, 128). In particular, the spreading of the disease follows an autosomal dominant inheritance with a genetic HTT mutation elongating the CAG repeat, with longer repeats translating to earlier onset [recently reviewed in Ref. (129)] (130–132). Kersten et al. (133) examined sd-OCT scans of the macula and pRNFL in 26 HD and 29 healthy patients (133). Markedly, though the research team found no difference in average pRNFL between HD and healthy individuals, they demonstrated a significant reduction in temporal pRNFL thickness in patients compared to healthy controls (62.3 vs. 69.8 mm; p = 0.005). In addition, the research team also noted that disease duration negatively correlates with both pRNFL thickness and macular volume, suggesting that increased length of HD affliction significantly thins the pRNFL and reduces macular size. In line with the latter correlation analysis of macular volume, Andrade et al. (134) evaluated macular and pRNFL thickness in patients with HD and normal control individuals by use of sd-OCT (134). Findings from this study suggested that HD patients express significantly decreased average (231.3 vs. 296.2; p = 0.033), central (341.8 vs. 252.0; p = 0.015), and inferior (225.3 vs. 313.8; p = 0.007) macular choroidal thickness in comparison to healthy controls (134). In summary, these studies suggest that noninvasive detection of HD signs in ocular tissues may provide a useful modality for diagnosis and following disease progression.
Multiple Sclerosis (MS)
Multiple sclerosis, an autoimmune disease represented by demyelination of axons and disruptions to inflammatory homeostasis, has also been identified by neuronal death (135–137). Given that patients with MS exhibit inflamed eyes, past reports have suggested that cerebral pathology may mirror ocular manifestations, further enriching the value of using optical imaging mechanisms in diagnosing the disease. Notably, the ocular inflammation present in MS patients has recently been associated with RNFL thinning and neuronal degeneration (138). Similar to the results shown for AD, OCT imaging of MS patients has demonstrated a thinning of the RNFL compared to controls. Significant thinning of average and temporal RNFL thickness was found in MS-related optic neuritis patients (80, 93, 139) and in MS patients without optic neuritis (140, 141). A study by Fisher et al. (142) demonstrated that RNFL thickness is reduced significantly among MS patients (92 µm) vs. controls (105 µm) and is particularly reduced in diseased eyes with a history of optic neuritis (85 µm) (142). Studying a subgroup of MS patients with the macular thinning predominant phenotype showed conflicting results; while Saidha et al. (143, 144) reported that primary retinal pathology detectable by OCT defines this subset of patients with MS from controls (143, 144), a study by Brandt et al. (145) did not support this conclusion (145).
In addition, several earlier OCT studies have not only enhanced the understanding of ocular indicators for MS, but have also helped to elucidate the disease’s pathologically progressive timeline (141, 146–148). For instance, OCT examination by Henderson et al. (141) in patients with secondary progressive MS showed a more advanced disease stage compared to those with primary progressive MS. This study further indicated that RNFL thickness in the superior and temporal quadrants as well as macular volume exhibit considerable diminutions in secondary progressive MS patients (p = 0.045, p < 0.001, and p = 0.005, respectively) as compared to controls, but only in the temporal quadrant (p = 0.008) in patients with primary progressive MS, offering a means of distinguishing between the two disease stages (141). Accordingly, the use of OCT in MS promises to be highly constructive given not only the ability to detect retinal markers tied to the disease but also the variability in ocular pathologies based on disease advancement.
OCT in Neurodegenerative Retinopathies
Similar to neurodegenerative diseases such as AD, PD, and MSON, open-angle glaucoma patients have been shown to experience significantly reduced RNFL thickness by use of OCT, with thinner RFNL corresponding to hindered visual performance as measured by PERG, an exam assessing retinal function (93). Specifically, Parisi et al. demonstrated that the PERG recordings from glaucoma, ocular hypertension, AD, and MSON patients exhibited smaller amplitudes and prolonged implicit times as compared to healthy individuals, suggesting that such diseases similarly impair visual function (93). Like AD patients, normal-tension glaucoma patients also experience this decrease in pRFNL thickness (p = 0.004) in addition to reduced macular ganglion cell complex (GCC) thickness (p = 0.006) and augmented global loss volume (p < 0.001) (71). Markedly, Eraslan et al. (71) further indicated the pertinence of considering retinopathy in AD by showing no significant difference between the pRNFL and GCC thickness of AD patients and normal-tension glaucoma patients via OCT imaging (p > 0.05).
Other ocular diseases that involve a neuronal degenerative component are AMD and diabetes retinopathy; a common feature of AMD is degeneration of retinal neurons (149, 150), and within diabetes are a variety of pathologies, which include targeted neuronal death (151). Regardless of the non-significant difference found in RFNL and GCL thickness between healthy individuals and type 1 diabetics, Carnevali et al. (152) sparked interest in examining diabetic retinopathy with OCT by divulging the ability to detect microvascular alterations that may appear before the manifestation of more prominent neuro-retinopathologies associated with diabetes. Specifically, diabetic patients exhibited reduced ocular vessel density in comparison to healthy controls (0.464 vs. 0.477, p = 0.005), further enhancing the relevance of OCT as an efficient imaging tool for early disease detection and preventative care (152). Additionally, in comparison to other imaging modalities such as blue-light and near-infrared FAF, OCT has been noted as the most correct and reproducible tool in examining impairments to the geographic atrophy of the fovea for AMD diagnosis (153). Furthermore, sd-OCT allows not only for investigation of structural changes in the retina, but also for variations occurring at the cellular level in order to accurately diagnose AMD (154). Overall, OCT analysis allowing for detection of diverse pathologies may, in conjunction with disease-specific biomarker imaging, facilitate differential diagnosis of various retino- and neurodegenerative diseases.
Concluding Remarks
A revolutionary idea has arisen in recent years suggesting representation of brain pathology in retinal tissue, evidenced by similar manifestations such as hallmark depositions and neuronal cell death. The AD-specific misfolded protein, Aβ plaque, is thought to drive tauopathy and inflammation (11, 155), cocontributing to the vast synaptic and neuronal loss (14), and making Aβ the holy grail of AD diagnostic biomarkers. In the retina, the most extensively reported neural degeneration is of RGCs and the corresponding axonal thinning of the RNFL, as demonstrated mainly by OCT imaging. The apparent correlations between OCT-structural findings and visual and cognitive functions in AD patients support its utilization in assessing neurodegenerative incidence and progression. However, while the geometric distribution of progressive tissue atrophy is profound in the superior and inferior quadrants of AD retina, the potential overlap of the structural changes between various neurodegenerative diseases, such as PD, HD, and MS may instill an inherent limitation in differential diagnosis that should be addressed in future studies.
Recent estimates suggest that over 45 million individuals suffer from AD and associated dementia worldwide, and this number may more than double by 2040 (5, 6). This is a major concern for the aging population, as incidence rises sharply after 65 years of age, affecting roughly 50% of individuals aged 85 and older (5, 6). Despite considerable progress toward detection of AD biomarkers, practical diagnostic methods suitable for wide clinical deployment are greatly needed. Existing brain amyloid imaging technologies are the gold standard for AD diagnosis (156), but present challenges such as high costs, limited accessibility, and exposure to radioactive isotopes (13, 157, 158), and thus are currently unfit for large-scale population screening or monitoring response to therapies (13, 159–161). With the reported colocalization of retinal Aβ and ganglion cell degeneration, a combined method to detect hallmark Aβ deposits via fundus optical imaging with assessment of structural abnormalities by OCT may prove to be a superior approach for screening at-risk populations, assessing disease progression, and evaluating therapeutic efficacy.
Author Contributions
JD, TT, YK, and MK-H: data collection and summary and discussion of intellectual content, manuscript writing, and editing. JD and MK-H: conceptual ideas, figure creation, and main writing. KB: discussion of intellectual content and editing. MK-H: supervision and final approval of manuscript.
Conflict of Interest Statement
The authors declare that the research was conducted in the absence of any commercial or financial relationships that could be construed as a potential conflict of interest.
The reviewer NB and handling editor declared their shared affiliation.
Acknowledgments
We thank Mia Oviatt for assisting with editing the manuscript. This article is dedicated to the memory of Dr. Salomon Moni Hamaoui and Lillian Jones Black, both of whom died from Alzheimer’s disease.
Funding
This study was funded by NIH/NIA AG044897 and AG056478 Awards (MK-H); The Saban and The Marciano Family Foundations (MK-H).
Abbreviations
AMD, age-dependent macular degeneration; AD, Alzheimer’s disease; ADAS-cog, Alzheimer’s Disease Assessment Scale-cognition; Aβ, Amyloid beta-protein; CNS, central nervous system; CDR, Clinical Dementia Rating; CV, color vision; CSV, contrast-sensitive vision; fd-OCT, fourier/frequency domain OCT; FAF, fundus autofluorescence; GCL, ganglion cell layer; HD, Huntington’s disease; IPL, inner plexiform layer; MCI, mild cognitive impairment; MMSE, Mini-Mental State Examination; MS, multiple sclerosis; NFTs, neurofibrillary tangles; OCT, optical coherence tomography; PD, Parkinson’s disease; PERG, pattern electroretinogram; pRNFL, peripapillary retinal nerve fiber layer; RAI, retinal amyloid index; RGC, retinal ganglion cell; RNFL, retinal nerve fiber layer; RPE, retinal pigment epithelium; sd-OCT, spectral domain OCT; VA, visual acuity.
References
1. Byerly MS, Blackshaw S. Vertebrate retina and hypothalamus development. Wiley Interdiscip Rev Syst Biol Med (2009) 1:380–9. doi:10.1002/wsbm.22
2. Purves D, Augustine GJ, Fitzpatrick D, Katz LC, LaMantia A-S, McNamara JO, et al. The Retina. Sunderland, MA: Sinauer Associates (2001).
3. Trost A, Lange S, Schroedl F, Bruckner D, Motloch KA, Bogner B, et al. Brain and retinal pericytes: origin, function and role. Front Cell Neurosci (2016) 10:20. doi:10.3389/fncel.2016.00020
4. Crair MC, Mason CA. Reconnecting eye to brain. J Neurosci (2016) 36:10707–22. doi:10.1523/JNEUROSCI.1711-16.2016
5. Alzheimer’s A. 2016 Alzheimer’s disease facts and figures. Alzheimers Dement (2016) 12:459–509. doi:10.1016/j.jalz.2016.03.001
6. Hickman RA, Faustin A, Wisniewski T. Alzheimer disease and its growing epidemic: risk factors, biomarkers, and the urgent need for therapeutics. Neurol Clin (2016) 34:941–53. doi:10.1016/j.ncl.2016.06.009
7. Sadun AA, Borchert M, DeVita E, Hinton DR, Bassi CJ. Assessment of visual impairment in patients with Alzheimer’s disease. Am J Ophthalmol (1987) 104:113–20. doi:10.1016/0002-9394(87)90001-8
8. Emamian F, Khazaie H, Tahmasian M, Leschziner GD, Morrell MJ, Hsiung GY, et al. The association between obstructive sleep apnea and Alzheimer’s disease: a meta-analysis perspective. Front Aging Neurosci (2016) 8:78. doi:10.3389/fnagi.2016.00078
9. Ju YE, McLeland JS, Toedebusch CD, Xiong C, Fagan AM, Duntley SP, et al. Sleep quality and preclinical Alzheimer disease. JAMA Neurol (2013) 70:587–93. doi:10.1001/jamaneurol.2013.2334
10. Vitiello MV, Borson S. Sleep disturbances in patients with Alzheimer’s disease: epidemiology, pathophysiology and treatment. CNS Drugs (2001) 15:777–96. doi:10.2165/00023210-200115100-00004
11. Hardy J, Selkoe DJ. The amyloid hypothesis of Alzheimer’s disease: progress and problems on the road to therapeutics. Science (2002) 297:353–6. doi:10.1126/science.1072994
12. Bateman RJ, Xiong C, Benzinger TL, Fagan AM, Goate A, Fox NC, et al. Clinical and biomarker changes in dominantly inherited Alzheimer’s disease. N Engl J Med (2012) 367:795–804. doi:10.1056/NEJMoa1202753
13. Blennow K, Mattsson N, Scholl M, Hansson O, Zetterberg H. Amyloid biomarkers in Alzheimer’s disease. Trends Pharmacol Sci (2015) 36:297–309. doi:10.1016/j.tips.2015.03.002
14. De Strooper B, Karran E. The cellular phase of Alzheimer’s disease. Cell (2016) 164:603–15. doi:10.1016/j.cell.2015.12.056
15. Hart NJ, Koronyo Y, Black KL, Koronyo-Hamaoui M. Ocular indicators of Alzheimer’s: exploring disease in the retina. Acta Neuropathol (2016) 132:767–87. doi:10.1007/s00401-016-1613-6
16. Archibald NK, Clarke MP, Mosimann UP, Burn DJ. The retina in Parkinson’s disease. Brain (2009) 132:1128–45. doi:10.1093/brain/awp068
17. Thomas D, Duguid G. Optical coherence tomography – a review of the principles and contemporary uses in retinal investigation. Eye (Lond) (2004) 18:561–70. doi:10.1038/sj.eye.6700729
18. Boppart SA. Optical coherence tomography: technology and applications for neuroimaging. Psychophysiology (2003) 40:529–41. doi:10.1111/1469-8986.00055
19. Satue M, Garcia-Martin E, Fuertes I, Otin S, Alarcia R, Herrero R, et al. Use of Fourier-domain OCT to detect retinal nerve fiber layer degeneration in Parkinson’s disease patients. Eye (Lond) (2013) 27:507–14. doi:10.1038/eye.2013.4
20. Lamirel C, Newman NJ, Biousse V. Optical coherence tomography (OCT) in optic neuritis and multiple sclerosis. Rev Neurol (Paris) (2010) 166:978–86. doi:10.1016/j.neurol.2010.03.024
21. Coppola G, Di Renzo A, Ziccardi L, Martelli F, Fadda A, Manni G, et al. Optical coherence tomography in Alzheimer’s disease: a meta-analysis. PLoS One (2015) 10:e0134750. doi:10.1371/journal.pone.0134750
22. Bagci AM, Shahidi M, Ansari R, Blair M, Blair NP, Zelkha R. Thickness profiles of retinal layers by optical coherence tomography image segmentation. Am J Ophthalmol (2008) 146:679–87. doi:10.1016/j.ajo.2008.06.010
23. Costa RA, Skaf M, Melo LA Jr, Calucci D, Cardillo JA, Castro JC, et al. Retinal assessment using optical coherence tomography. Prog Retin Eye Res (2006) 25:325–53. doi:10.1016/j.preteyeres.2006.03.001
24. Forooghian F, Cukras C, Meyerle CB, Chew EY, Wong WT. Evaluation of time domain and spectral domain optical coherence tomography in the measurement of diabetic macular edema. Invest Ophthalmol Vis Sci (2008) 49:4290–6. doi:10.1167/iovs.08-2113
25. Yi K, Mujat M, Park BH, Sun W, Miller JW, Seddon JM, et al. Spectral domain optical coherence tomography for quantitative evaluation of drusen and associated structural changes in non-neovascular age-related macular degeneration. Br J Ophthalmol (2009) 93:176–81. doi:10.1136/bjo.2008.137356
26. Koronyo Y, Biggs D, Barron E, Boyer DS, Pearlman JA, Au WJ, et al. Retinal amyloid pathology and proof-of-concept imaging trial in Alzheimer’s disease. JCI Insight (2017) 2:ii:93621. doi:10.1172/jci.insight.93621
27. Koronyo-Hamaoui M, Koronyo Y, Ljubimov AV, Miller CA, Ko MK, Black KL, et al. Identification of amyloid plaques in retinas from Alzheimer’s patients and noninvasive in vivo optical imaging of retinal plaques in a mouse model. Neuroimage (2011) 1:S204–17. doi:10.1016/j.neuroimage.2010.06.020
28. La Morgia C, Ross-Cisneros FN, Koronyo Y, Hannibal J, Gallassi R, Cantalupo G, et al. Melanopsin retinal ganglion cell loss in Alzheimer disease. Ann Neurol (2016) 79:90–109. doi:10.1002/ana.24548
29. Bodis-Wollner I, Kozlowski PB, Glazman S, Miri S. alpha-Synuclein in the inner retina in Parkinson disease. Ann Neurol (2014) 75:964–6. doi:10.1002/ana.24182
30. Bilgel M, An Y, Zhou Y, Wong DF, Prince JL, Ferrucci L, et al. Individual estimates of age at detectable amyloid onset for risk factor assessment. Alzheimers Dement (2016) 12:373–9. doi:10.1016/j.jalz.2015.08.166
31. Perrin RJ, Fagan AM, Holtzman DM. Multimodal techniques for diagnosis and prognosis of Alzheimer’s disease. Nature (2009) 461:916–22. doi:10.1038/nature08538
32. Ascaso FJ, Cruz N, Modrego PJ, Lopez-Anton R, Santabarbara J, Pascual LF, et al. Retinal alterations in mild cognitive impairment and Alzheimer’s disease: an optical coherence tomography study. J Neurol (2014) 261:1522–30. doi:10.1007/s00415-014-7374-z
33. Cheung CY, Ong YT, Hilal S, Ikram MK, Low S, Ong YL, et al. Retinal ganglion cell analysis using high-definition optical coherence tomography in patients with mild cognitive impairment and Alzheimer’s disease. J Alzheimers Dis (2015) 45:45–56. doi:10.3233/JAD-141659
34. Cunha LP, Almeida AL, Costa-Cunha LV, Costa CF, Monteiro ML. The role of optical coherence tomography in Alzheimer’s disease. Int J Retina Vitreous (2016) 2:24. doi:10.1186/s40942-016-0049-4
35. den Haan J, Verbraak FD, Visser PJ, Bouwman FH. Retinal thickness in Alzheimer’s disease: a systematic review and meta-analysis. Alzheimers Dement (Amst) (2017) 6:162–70. doi:10.1016/j.dadm.2016.12.014
36. Feke G, Hyman B, Stern R, Pasquale L. Retinal blood flow in mild cognitive impairment and Alzheimer’s disease. Alzheimer Dement (2015) 1:144–51. doi:10.1016/j.dadm.2015.01.004
37. Ferrari L, Huang SC, Magnani G, Ambrosi A, Comi G, Leocani L. Optical coherence tomography reveals retinal neuroaxonal thinning in frontotemporal dementia as in Alzheimer’s disease. J Alzheimers Dis (2017) 56:1101–7. doi:10.3233/JAD-160886
38. Gao L, Liu Y, Li X, Bai Q, Liu P. Abnormal retinal nerve fiber layer thickness and macula lutea in patients with mild cognitive impairment and Alzheimer’s disease. Arch Gerontol Geriatr (2015) 60:162–7. doi:10.1016/j.archger.2014.10.011
39. Goozee KG, Shah TM, Sohrabi HR, Rainey-Smith SR, Brown B, Verdile G, et al. Examining the potential clinical value of curcumin in the prevention and diagnosis of Alzheimer’s disease. Br J Nutr (2016) 115:449–65. doi:10.1017/S0007114515004687
40. Ikram MK, Cheung CY, Wong TY, Chen CP. Retinal pathology as biomarker for cognitive impairment and Alzheimer’s disease. J Neurol Neurosurg Psychiatry (2012) 83:917–22. doi:10.1136/jnnp-2011-301628
41. Kesler A, Vakhapova V, Korczyn AD, Naftaliev E, Neudorfer M. Retinal thickness in patients with mild cognitive impairment and Alzheimer’s disease. Clin Neurol Neurosurg (2011) 113:523–6. doi:10.1016/j.clineuro.2011.02.014
42. Liu D, Zhang L, Li Z, Zhang X, Wu Y, Yang H, et al. Thinner changes of the retinal nerve fiber layer in patients with mild cognitive impairment and Alzheimer’s disease. BMC Neurol (2015) 15:14. doi:10.1186/s12883-015-0268-6
43. Oktem EO, Derle E, Kibaroglu S, Oktem C, Akkoyun I, Can U. The relationship between the degree of cognitive impairment and retinal nerve fiber layer thickness. Neurol Sci (2015) 36:1141–6. doi:10.1007/s10072-014-2055-3
44. Paquet C, Boissonnot M, Roger F, Dighiero P, Gil R, Hugon J. Abnormal retinal thickness in patients with mild cognitive impairment and Alzheimer’s disease. Neurosci Lett (2007) 420:97–9. doi:10.1016/j.neulet.2007.02.090
45. Pillai JA, Bermel R, Bonner-Jackson A, Rae-Grant A, Fernandez H, Bena J, et al. Retinal nerve fiber layer thinning in Alzheimer’s disease: a case-control study in comparison to normal aging, Parkinson’s disease, and non-Alzheimer’s dementia. Am J Alzheimers Dis Other Demen (2016) 31:430–6. doi:10.1177/1533317515628053
46. Shen Y, Liu L, Cheng Y, Feng W, Shi Z, Zhu Y, et al. Retinal nerve fiber layer thickness is associated with episodic memory deficit in mild cognitive impairment patients. Curr Alzheimer Res (2014) 11:259–66. doi:10.2174/1567205011666140131114418
47. Shi Z, Wu Y, Wang M, Cao J, Feng W, Cheng Y, et al. Greater attenuation of retinal nerve fiber layer thickness in Alzheimer’s disease patients. J Alzheimers Dis (2014) 40:277–83. doi:10.3233/JAD-131898
48. Snyder PJ, Johnson LN, Lim YY, Santos CY, Alber J, Maruff P, et al. Nonvascular retinal imaging markers of preclinical Alzheimer’s disease. Alzheimers Dement (Amst) (2016) 4:169–78. doi:10.1016/j.dadm.2016.09.001
49. Thomson KL, Yeo JM, Waddell B, Cameron JR, Pal S. A systematic review and meta-analysis of retinal nerve fiber layer change in dementia, using optical coherence tomography. Alzheimers Dement (Amst) (2015) 1:136–43. doi:10.1016/j.dadm.2015.03.001
50. Trebbastoni A, D’Antonio F, Bruscolini A, Marcelli M, Cecere M, Campanelli A, et al. Retinal nerve fibre layer thickness changes in Alzheimer’s disease: results from a 12-month prospective case series. Neurosci Lett (2016) 629:165–70. doi:10.1016/j.neulet.2016.07.006
51. Valenti DA. Alzheimer’s disease and glaucoma: imaging the biomarkers of neurodegenerative disease. Int J Alzheimers Dis (2011) 2010:793931. doi:10.4061/2010/793931
52. Hinton DR, Sadun AA, Blanks JC, Miller CA. Optic-nerve degeneration in Alzheimer’s disease. N Engl J Med (1986) 315:485–7. doi:10.1056/NEJM198608213150804
53. Blanks JC, Hinton DR, Sadun AA, Miller CA. Retinal ganglion cell degeneration in Alzheimer’s disease. Brain Res (1989) 501:364–72. doi:10.1016/0006-8993(89)90653-7
54. Sadun AA, Bassi CJ. Optic nerve damage in Alzheimer’s disease. Ophthalmology (1990) 97:9–17. doi:10.1016/S0161-6420(90)32621-0
55. Blanks JC, Torigoe Y, Hinton DR, Blanks RH. Retinal pathology in Alzheimer’s disease. I. Ganglion cell loss in foveal/parafoveal retina. Neurobiol Aging (1996) 17:377–84. doi:10.1016/0197-4580(96)00009-7
56. Blanks JC, Schmidt SY, Torigoe Y, Porrello KV, Hinton DR, Blanks RH. Retinal pathology in Alzheimer’s disease. II. Regional neuron loss and glial changes in GCL. Neurobiol Aging (1996) 17:385–95. doi:10.1016/0197-4580(96)00009-7
57. Hedges TR III, Perez Galves R, Speigelman D, Barbas NR, Peli E, Yardley CJ. Retinal nerve fiber layer abnormalities in Alzheimer’s disease. Acta Ophthalmol Scand (1996) 74:271–5. doi:10.1111/j.1600-0420.1996.tb00090.x
58. Armstrong R, Kergoat H. Oculo-visual changes and clinical considerations affecting older patients with dementia. Ophthalmic Physiol Opt (2015) 35:352–76. doi:10.1111/opo.12220
59. Einarsdottir AB, Hardarson SH, Kristjansdottir JV, Bragason DT, Snaedal J, Stefansson E. Retinal oximetry imaging in Alzheimer’s disease. J Alzheimers Dis (2015) 49:79–83. doi:10.3233/JAD-150457
60. Frost S, Kanagasingam Y, Sohrabi H, Vignarajan J, Bourgeat P, Salvado O, et al. Retinal vascular biomarkers for early detection and monitoring of Alzheimer’s disease. Transl Psychiatry (2013) 3:e233. doi:10.1038/tp.2012.150
61. Frost S, Martins RN, Kanagasingam Y. Ocular biomarkers for early detection of Alzheimer’s disease. J Alzheimers Dis (2010) 22:1–16. doi:10.3233/JAD-2010-100819
62. Stefansson E, Olafsdottir OB, Einarsdottir AB, Eliasdottir TS, Eysteinsson T, Vehmeijer W, et al. Retinal oximetry discovers novel biomarkers in retinal and brain diseases. Invest Ophthalmol Vis Sci (2017) 58:BIO227–33. doi:10.1167/iovs.17-21776
63. Tsai CS, Ritch R, Schwartz B, Lee SS, Miller NR, Chi T, et al. Optic nerve head and nerve fiber layer in Alzheimer’s disease. Arch Ophthalmol (1991) 109:199–204. doi:10.1001/archopht.1991.01080020045040
64. Williams MA, McGowan AJ, Cardwell CR, Cheung CY, Craig D, Passmore P, et al. Retinal microvascular network attenuation in Alzheimer’s disease. Alzheimers Dement (Amst) (2015) 1:229–35. doi:10.1016/j.dadm.2015.04.001
65. Berisha F, Feke GT, Trempe CL, McMeel JW, Schepens CL. Retinal abnormalities in early Alzheimer’s disease. Invest Ophthalmol Vis Sci (2007) 48:2285–9. doi:10.1167/iovs.06-1029
66. Cheung CY, Ong YT, Ikram MK, Ong SY, Li X, Hilal S, et al. Microvascular network alterations in the retina of patients with Alzheimer’s disease. Alzheimers Dement (2014) 10:135–42. doi:10.1016/j.jalz.2013.06.009
67. Parisi V, Restuccia R, Fattapposta F, Mina C, Bucci MG, Pierelli F. Morphological and functional retinal impairment in Alzheimer’s disease patients. Clin Neurophysiol (2001) 112:1860–7. doi:10.1016/S1388-2457(01)00620-4
68. Kromer R, Serbecic N, Hausner L, Froelich L, Aboul-Enein F, Beutelspacher SC. Detection of retinal nerve fiber layer defects in Alzheimer’s disease using SD-OCT. Front Psychiatry (2014) 5:22. doi:10.3389/fpsyt.2014.00022
69. Polans J, Keller B, Carrasco-Zevallos OM, LaRocca F, Cole E, Whitson HE, et al. Wide-field retinal optical coherence tomography with wavefront sensorless adaptive optics for enhanced imaging of targeted regions. Biomed Opt Express (2017) 8:16–37. doi:10.1364/BOE.8.000016
70. Polo V, Rodrigo MJ, Garcia-Martin E, Otin S, Larrosa JM, Fuertes MI, et al. Visual dysfunction and its correlation with retinal changes in patients with Alzheimer’s disease. Eye (Lond) (2017) 31:1034–41. doi:10.1038/eye.2017.23
71. Eraslan M, Cerman E, Cekic O, Balci S, Dericioglu V, Sahin O, et al. Neurodegeneration in ocular and central nervous systems: optical coherence tomography study in normal-tension glaucoma and Alzheimer disease. Turk J Med Sci (2015) 45:1106–14. doi:10.3906/sag-1406-145
72. Bambo MP, Garcia-Martin E, Gutierrez-Ruiz F, Pinilla J, Perez-Olivan S, Larrosa JM, et al. Analysis of optic disk color changes in Alzheimer’s disease: a potential new biomarker. Clin Neurol Neurosurg (2015) 132:68–73. doi:10.1016/j.clineuro.2015.02.016
73. Lu Y, Li Z, Zhang X, Ming B, Jia J, Wang R, et al. Retinal nerve fiber layer structure abnormalities in early Alzheimer’s disease: evidence in optical coherence tomography. Neurosci Lett (2010) 480:69–72. doi:10.1016/j.neulet.2010.06.006
74. Cunha LP, Lopes LC, Costa-Cunha LV, Costa CF, Pires LA, Almeida AL, et al. Macular thickness measurements with frequency domain-OCT for quantification of retinal neural loss and its correlation with cognitive impairment in Alzheimer’s disease. PLoS One (2016) 11:e0153830. doi:10.1371/journal.pone.0153830
75. Gunes A, Demirci S, Tok L, Tok O, Demirci S. Evaluation of retinal nerve fiber layer thickness in Alzheimer disease using spectral-domain optical coherence tomography. Turk J Med Sci (2015) 45:1094–7. doi:10.3906/sag-1405-114
76. Moreno-Ramos T, Benito-Leon J, Villarejo A, Bermejo-Pareja F. Retinal nerve fiber layer thinning in dementia associated with Parkinson’s disease, dementia with Lewy bodies, and Alzheimer’s disease. J Alzheimers Dis (2013) 34:659–64. doi:10.3233/JAD-121975
77. Kirbas S, Turkyilmaz K, Anlar O, Tufekci A, Durmus M. Retinal nerve fiber layer thickness in patients with Alzheimer disease. J Neuroophthalmol (2013) 33:58–61. doi:10.1097/WNO.0b013e318267fd5f
78. Cunha JP, Proenca R, Dias-Santos A, Almeida R, Aguas H, Alves M, et al. OCT in Alzheimer’s disease: thinning of the RNFL and superior hemiretina. Graefes Arch Clin Exp Ophthalmol (2017) 255:1827–35. doi:10.1007/s00417-017-3715-9
79. Iseri PK, Altinas O, Tokay T, Yuksel N. Relationship between cognitive impairment and retinal morphological and visual functional abnormalities in Alzheimer disease. J Neuroophthalmol (2006) 26:18–24. doi:10.1097/01.wno.0000204645.56873.26
80. Parisi V, Manni G, Spadaro M, Colacino G, Restuccia R, Marchi S, et al. Correlation between morphological and functional retinal impairment in multiple sclerosis patients. Invest Ophthalmol Vis Sci (1999) 40:2520–7.
81. Marziani E, Pomati S, Ramolfo P, Cigada M, Giani A, Mariani C, et al. Evaluation of retinal nerve fiber layer and ganglion cell layer thickness in Alzheimer’s disease using spectral-domain optical coherence tomography. Invest Ophthalmol Vis Sci (2013) 54:5953–8. doi:10.1167/iovs.13-12046
82. Moschos MM, Markopoulos I, Chatziralli I, Rouvas A, Papageorgiou SG, Ladas I, et al. Structural and functional impairment of the retina and optic nerve in Alzheimer’s disease. Curr Alzheimer Res (2012) 9:782–8. doi:10.2174/156720512802455340
83. Salobrar-Garcia E, Hoyas I, Leal M, de Hoz R, Rojas B, Ramirez AI, et al. Analysis of retinal peripapillary segmentation in early Alzheimer’s disease patients. Biomed Res Int (2015) 2015:636548. doi:10.1155/2015/636548
84. Kayabasi U, Sergott R, Rispoli M. Retinal examination for the diagnosis of Alzheimer’s disease. Int J Ophthalmic Pathol (2014) 3:4. doi:10.4172/2324-8599.1000145
85. Altintas O, Iseri P, Ozkan B, Caglar Y. Correlation between retinal morphological and functional findings and clinical severity in Parkinson’s disease. Doc Ophthalmol (2008) 116:137–46. doi:10.1007/s10633-007-9091-8
86. Satue M, Rodrigo MJ, Obis J, Vilades E, Gracia H, Otin S, et al. Evaluation of progressive visual dysfunction and retinal degeneration in patients with Parkinson’s disease. Invest Ophthalmol Vis Sci (2017) 58:1151–7. doi:10.1167/iovs.16-20460
87. Moschos MM, Tagaris G, Markopoulos I, Margetis I, Tsapakis S, Kanakis M, et al. Morphologic changes and functional retinal impairment in patients with Parkinson disease without visual loss. Eur J Ophthalmol (2011) 21:24–9. doi:10.5301/EJO.2010.1318
88. Inzelberg R, Ramirez JA, Nisipeanu P, Ophir A. Retinal nerve fiber layer thinning in Parkinson disease. Vision Res (2004) 44:2793–7. doi:10.1016/j.visres.2004.06.009
89. Shrier EM, Adam CR, Spund B, Glazman S, Bodis-Wollner I. Interocular asymmetry of foveal thickness in Parkinson disease. J Ophthalmol (2012) 2012:728457. doi:10.1155/2012/728457
90. Hajee ME, March WF, Lazzaro DR, Wolintz AH, Shrier EM, Glazman S, et al. Inner retinal layer thinning in Parkinson disease. Arch Ophthalmol (2009) 127:737–41. doi:10.1001/archophthalmol.2009.106
91. Adam CR, Shrier E, Ding Y, Glazman S, Bodis-Wollner I. Correlation of inner retinal thickness evaluated by spectral-domain optical coherence tomography and contrast sensitivity in Parkinson disease. J Neuroophthalmol (2013) 33:137–42. doi:10.1097/WNO.0b013e31828c4e1a
92. Gharbiya M, Trebbastoni A, Parisi F, Manganiello S, Cruciani F, D’Antonio F, et al. Choroidal thinning as a new finding in Alzheimer’s disease: evidence from enhanced depth imaging spectral domain optical coherence tomography. J Alzheimers Dis (2014) 40:907–17. doi:10.3233/JAD-132039
93. Parisi V. Correlation between morphological and functional retinal impairment in patients affected by ocular hypertension, glaucoma, demyelinating optic neuritis and Alzheimer’s disease. Semin Ophthalmol (2003) 18:50–7. doi:10.1080/08820530390897855
94. Gilmore GC, Wenk HE, Naylor LA, Koss E. Motion perception and Alzheimer’s disease. J Gerontol (1994) 49:52–7. doi:10.1093/geronj/49.2.P52
95. Alexandrov PN, Pogue A, Bhattacharjee S, Lukiw WJ. Retinal amyloid peptides and complement factor H in transgenic models of Alzheimer’s disease. Neuroreport (2011) 22:623–7. doi:10.1097/WNR.0b013e3283497334
96. Loffler KU, Edward DP, Tso MO. Immunoreactivity against tau, amyloid precursor protein, and beta-amyloid in the human retina. Invest Ophthalmol Vis Sci (1995) 36:24–31.
97. Schon C, Hoffmann NA, Ochs SM, Burgold S, Filser S, Steinbach S, et al. Long-term in vivo imaging of fibrillar tau in the retina of P301S transgenic mice. PLoS One (2012) 7:e53547. doi:10.1371/journal.pone.0053547
98. Tsai Y, Lu B, Ljubimov AV, Girman S, Ross-Cisneros FN, Sadun AA, et al. Ocular changes in TgF344-AD rat model of Alzheimer’s disease. Invest Ophthalmol Vis Sci (2014) 55:523–34. doi:10.1167/iovs.13-12888
99. La Morgia C, Ross-Cisneros FN, Sadun AA, Carelli V. Retinal ganglion cells and circadian rhythms in Alzheimer’s disease, Parkinson’s disease, and beyond. Front Neurol (2017) 8:162. doi:10.3389/fneur.2017.00162
100. Chang LY, Lowe J, Ardiles A, Lim J, Grey AC, Robertson K, et al. Alzheimer’s disease in the human eye. Clinical tests that identify ocular and visual information processing deficit as biomarkers. Alzheimers Dement (2014) 10:251–61. doi:10.1016/j.jalz.2013.06.004
101. Du LY, Chang LY, Ardiles AO, Tapia-Rojas C, Araya J, Inestrosa NC, et al. Alzheimer’s disease-related protein expression in the retina of Octodon degus. PLoS One (2015) 10:e0135499. doi:10.1371/journal.pone.0135499
102. Dutescu RM, Li QX, Crowston J, Masters CL, Baird PN, Culvenor JG. Amyloid precursor protein processing and retinal pathology in mouse models of Alzheimer’s disease. Graefes Arch Clin Exp Ophthalmol (2009) 247:1213–21. doi:10.1007/s00417-009-1060-3
103. Gupta VK, Chitranshi N, Gupta VB, Golzan M, Dheer Y, Wall RV, et al. Amyloid beta accumulation and inner retinal degenerative changes in Alzheimer’s disease transgenic mouse. Neurosci Lett (2016) 623:52–6. doi:10.1016/j.neulet.2016.04.059
104. Koronyo Y, Salumbides BC, Black KL, Koronyo-Hamaoui M. Alzheimer’s disease in the retina: imaging retinal abeta plaques for early diagnosis and therapy assessment. Neurodegener Dis (2012) 10:285–93. doi:10.1159/000335154
105. Liu B, Rasool S, Yang Z, Glabe CG, Schreiber SS, Ge J, et al. Amyloid-peptide vaccinations reduce {beta}-amyloid plaques but exacerbate vascular deposition and inflammation in the retina of Alzheimer’s transgenic mice. Am J Pathol (2009) 175:2099–110. doi:10.2353/ajpath.2009.090159
106. Ning A, Cui J, To E, Ashe KH, Matsubara J. Amyloid-beta deposits lead to retinal degeneration in a mouse model of Alzheimer disease. Invest Ophthalmol Vis Sci (2008) 49:5136–43. doi:10.1167/iovs.08-1849
107. Perez SE, Lumayag S, Kovacs B, Mufson EJ, Xu S. Beta-amyloid deposition and functional impairment in the retina of the APPswe/PS1DeltaE9 transgenic mouse model of Alzheimer’s disease. Invest Ophthalmol Vis Sci (2009) 50:793–800. doi:10.1167/iovs.08-2384
108. Koronyo-Hamaoui M, Ko MK, Koronyo Y, Azoulay D, Seksenyan A, Kunis G, et al. Attenuation of AD-like neuropathology by harnessing peripheral immune cells: local elevation of IL-10 and MMP-9. J Neurochem (2009) 111:1409–24. doi:10.1111/j.1471-4159.2009.06402.x
109. Koronyo Y, Salumbides BC, Sheyn J, Pelissier L, Li S, Ljubimov V, et al. Therapeutic effects of glatiramer acetate and grafted CD115(+) monocytes in a mouse model of Alzheimer’s disease. Brain (2015) 138:2399–422. doi:10.1093/brain/awv150
110. Keene CD, Chang RC, Lopez-Yglesias AH, Shalloway BR, Sokal I, Li X, et al. Suppressed accumulation of cerebral amyloid {beta} peptides in aged transgenic Alzheimer’s disease mice by transplantation with wild-type or prostaglandin E2 receptor subtype 2-null bone marrow. Am J Pathol (2010) 177:346–54. doi:10.2353/ajpath.2010.090840
111. Zhou J, Fonseca MI, Kayed R, Hernandez I, Webster SD, Yazan O, et al. Novel Abeta peptide immunogens modulate plaque pathology and inflammation in a murine model of Alzheimer’s disease. J Neuroinflammation (2005) 2:28. doi:10.1186/1742-2094-2-28
112. Yang Y, Shiao C, Hemingway JF, Jorstad NL, Shalloway BR, Chang R, et al. Suppressed retinal degeneration in aged wild type and APPswe/PS1DeltaE9 mice by bone marrow transplantation. PLoS One (2013) 8:e64246. doi:10.1371/journal.pone.0064246
113. Jindahra P, Hedges TR, Mendoza-Santiesteban CE, Plant GT. Optical coherence tomography of the retina: applications in neurology. Curr Opin Neurol (2010) 23:16–23. doi:10.1097/WCO.0b013e328334e99b
114. Larrosa JM, Garcia-Martin E, Bambo MP, Pinilla J, Polo V, Otin S, et al. Potential new diagnostic tool for Alzheimer’s disease using a linear discriminant function for Fourier domain optical coherence tomography. Invest Ophthalmol Vis Sci (2014) 55:3043–51. doi:10.1167/iovs.13-13629
115. Cunha JP, Moura-Coelho N, Proenca RP, Dias-Santos A, Ferreira J, Louro C, et al. Alzheimer’s disease: a review of its visual system neuropathology. Optical coherence tomography-a potential role as a study tool in vivo. Graefes Arch Clin Exp Ophthalmol (2016) 254:2079–92. doi:10.1007/s00417-016-3430-y
116. Polo V, Garcia-Martin E, Bambo MP, Pinilla J, Larrosa JM, Satue M, et al. Reliability and validity of Cirrus and Spectralis optical coherence tomography for detecting retinal atrophy in Alzheimer’s disease. Eye (Lond) (2014) 28:680–90. doi:10.1038/eye.2014.51
117. Goedert M. NEURODEGENERATION. Alzheimer’s and Parkinson’s diseases: the prion concept in relation to assembled Abeta, tau, and alpha-synuclein. Science (2015) 349:1255555. doi:10.1126/science.1255555
118. Kalia LV, Lang AE. Parkinson’s disease. Lancet (Lond) (2015) 386:896–912. doi:10.1016/S0140-6736(14)61393-3
119. Ross CA, Poirier MA. Protein aggregation and neurodegenerative disease. Nat Med (2004) 10:S10–7. doi:10.1038/nm1066
120. Bodis-Wollner I, Yahr MD. Measurements of visual evoked potentials in Parkinson’s disease. Brain (1978) 101:661–71. doi:10.1093/brain/101.4.661
121. Chwiszczuk L, Breitve M, Hynninen M, Gjerstad MD, Aarsland D, Rongve A. Higher frequency and complexity of sleep disturbances in dementia with Lewy bodies as compared to Alzheimer’s disease. Neurodegener Dis (2016) 16:152–60. doi:10.1159/000439252
122. Moschos MM, Chatziralli IP. Evaluation of choroidal and retinal thickness changes in Parkinson’s disease using spectral domain optical coherence tomography. Semin Ophthalmol (2017) 1–4. doi:10.1080/08820538.2017.1307423
123. Cubo E, Tedejo RP, Rodriguez Mendez V, Lopez Pena MJ, Trejo Gabriel YGJM. Retina thickness in Parkinson’s disease and essential tremor. Mov Disord (2010) 25:2461–2. doi:10.1002/mds.23215
124. Bodis-Wollner I. Foveal vision is impaired in Parkinson’s disease. Parkinsonism Relat Disord (2013) 19:1–14. doi:10.1016/j.parkreldis.2012.07.012
125. Bodis-Wollner I, Glazman S, Yerram S. Fovea and foveation in Parkinson’s disease. Behav Neurosci (2013) 127:139–50. doi:10.1037/a0031225
126. Spund B, Ding Y, Liu T, Selesnick I, Glazman S, Shrier EM, et al. Remodeling of the fovea in Parkinson disease. J Neural Transm (Vienna) (2013) 120:745–53. doi:10.1007/s00702-012-0909-5
127. Purdon SE, Mohr E, Ilivitsky V, Jones BD. Huntington’s disease: pathogenesis, diagnosis and treatment. J Psychiatry Neurosci (1994) 19:359–67.
128. Stout JC, Paulsen JS, Queller S, Solomon AC, Whitlock KB, Campbell JC, et al. Neurocognitive signs in prodromal Huntington disease. Neuropsychology (2011) 25:1–14. doi:10.1037/a0020937
129. Apolinario TA, Paiva CL, Agostinho LA. REVIEW-ARTICLE intermediate alleles of Huntington’s disease HTT gene in different populations worldwide: a systematic review. Genet Mol Res (2017) 16:2. doi:10.4238/gmr16029648
130. Neueder A, Landles C, Ghosh R, Howland D, Myers RH, Faull RLM, et al. The pathogenic exon 1 HTT protein is produced by incomplete splicing in Huntington’s disease patients. Sci Rep (2017) 7:1307. doi:10.1038/s41598-017-01510-z
131. Lee JM, Galkina EI, Levantovsky RM, Fossale E, Anne Anderson M, Gillis T, et al. Dominant effects of the Huntington’s disease HTT CAG repeat length are captured in gene-expression data sets by a continuous analysis mathematical modeling strategy. Hum Mol Genet (2013) 22:3227–38. doi:10.1093/hmg/ddt176
132. Aziz NA, van Roon-Mom WM, Roos RA. CAG repeat size in the normal HTT allele and age of onset in Huntington’s disease. Mov Disord (2011) 26:2450–1; author reply 2451. doi:10.1002/mds.23849
133. Kersten HM, Danesh-Meyer HV, Kilfoyle DH, Roxburgh RH. Optical coherence tomography findings in Huntington’s disease: a potential biomarker of disease progression. J Neurol (2015) 262:2457–65. doi:10.1007/s00415-015-7869-2
134. Andrade C, Beato J, Monteiro A, Costa A, Penas S, Guimaraes J, et al. Spectral-domain optical coherence tomography as a potential biomarker in Huntington’s disease. Mov Disord (2016) 31:377–83. doi:10.1002/mds.26486
135. Dutta R, McDonough J, Yin X, Peterson J, Chang A, Torres T, et al. Mitochondrial dysfunction as a cause of axonal degeneration in multiple sclerosis patients. Ann Neurol (2006) 59:478–89. doi:10.1002/ana.20736
136. Sicotte NL, Voskuhl RR. Onset of multiple sclerosis associated with anti-TNF therapy. Neurology (2001) 57:1885–8. doi:10.1212/WNL.57.10.1885
137. Kallaur AP, Reiche EM, Oliveira SR, Simao AN, Pereira WL, Alfieri DF, et al. Genetic, immune-inflammatory, and oxidative stress biomarkers as predictors for disability and disease progression in multiple sclerosis. Mol Neurobiol (2017) 54:31–44. doi:10.1007/s12035-015-9648-6
138. Calabresi PA, Balcer LJ, Frohman EM. Retinal pathology in multiple sclerosis: insight into the mechanisms of neuronal pathology. Brain (2010) 133:1575–7. doi:10.1093/brain/awq133
139. Trip SA, Miller DH. Imaging in multiple sclerosis. J Neurol Neurosurg Psychiatry (2005) 76(Suppl 3):iii11–8. doi:10.1136/jnnp.2005.073213
140. Klistorner A, Garrick R, Barnett MH, Graham SL, Arvind H, Sriram P, et al. Axonal loss in non-optic neuritis eyes of patients with multiple sclerosis linked to delayed visual evoked potential. Neurology (2013) 80:242–5. doi:10.1212/WNL.0b013e31827deb39
141. Henderson AP, Trip SA, Schlottmann PG, Altmann DR, Garway-Heath DF, Plant GT, et al. An investigation of the retinal nerve fibre layer in progressive multiple sclerosis using optical coherence tomography. Brain (2008) 131:277–87. doi:10.1093/brain/awm285
142. Fisher JB, Jacobs DA, Markowitz CE, Galetta SL, Volpe NJ, Nano-Schiavi ML, et al. Relation of visual function to retinal nerve fiber layer thickness in multiple sclerosis. Ophthalmology (2006) 113:324–32. doi:10.1016/j.ophtha.2005.10.040
143. Saidha S, Syc SB, Durbin MK, Eckstein C, Oakley JD, Meyer SA, et al. Visual dysfunction in multiple sclerosis correlates better with optical coherence tomography derived estimates of macular ganglion cell layer thickness than peripapillary retinal nerve fiber layer thickness. Mult Scler (2011) 17:1449–63. doi:10.1177/1352458511418630
144. Saidha S, Syc SB, Ibrahim MA, Eckstein C, Warner CV, Farrell SK, et al. Primary retinal pathology in multiple sclerosis as detected by optical coherence tomography. Brain (2011) 134:518–33. doi:10.1093/brain/awq346
145. Brandt AU, Oberwahrenbrock T, Ringelstein M, Young KL, Tiede M, Hartung HP, et al. Primary retinal pathology in multiple sclerosis as detected by optical coherence tomography. Brain (2011) 134:e193; author reply e194. doi:10.1093/brain/awr095
146. Pulicken M, Gordon-Lipkin E, Balcer LJ, Frohman E, Cutter G, Calabresi PA. Optical coherence tomography and disease subtype in multiple sclerosis. Neurology (2007) 69:2085–92. doi:10.1212/01.wnl.0000294876.49861.dc
147. Young KL, Brandt AU, Petzold A, Reitz LY, Lintze F, Paul F, et al. Loss of retinal nerve fibre layer axons indicates white but not grey matter damage in early multiple sclerosis. Eur J Neurol (2013) 20:803–11. doi:10.1111/ene.12070
148. Costello F, Hodge W, Pan YI, Freedman M, DeMeulemeester C. Differences in retinal nerve fiber layer atrophy between multiple sclerosis subtypes. J Neurol Sci (2009) 281:74–9. doi:10.1016/j.jns.2009.02.354
149. Hahn P, Qian Y, Dentchev T, Chen L, Beard J, Harris ZL, et al. Disruption of ceruloplasmin and hephaestin in mice causes retinal iron overload and retinal degeneration with features of age-related macular degeneration. Proc Natl Acad Sci U S A (2004) 101:13850–5. doi:10.1073/pnas.0405146101
150. Ermilov VV, Nesterova AA. beta-Amyloidopathy in the pathogenesis of age-related macular degeneration in correlation with neurodegenerative diseases. Adv Exp Med Biol (2016) 854:119–25. doi:10.1007/978-3-319-17121-0_17
151. Sohn EH, van Dijk HW, Jiao C, Kok PH, Jeong W, Demirkaya N, et al. Retinal neurodegeneration may precede microvascular changes characteristic of diabetic retinopathy in diabetes mellitus. Proc Natl Acad Sci U S A (2016) 113:E2655–64. doi:10.1073/pnas.1522014113
152. Carnevali A, Sacconi R, Corbelli E, Tomasso L, Querques L, Zerbini G, et al. Optical coherence tomography angiography analysis of retinal vascular plexuses and choriocapillaris in patients with type 1 diabetes without diabetic retinopathy. Acta Diabetol (2017) 54:695–702. doi:10.1007/s00592-017-0996-8
153. Forte R, Querques G, Querques L, Leveziel N, Benhamou N, Souied EH. Multimodal evaluation of foveal sparing in patients with geographicatrophy due to age-related macular degeneration. Retina (2013) 33:482–9. doi:10.1097/IAE.0b013e318276e11e
154. Danis RP, Lavine JA, Domalpally A. Geographic atrophy in patients with advanced dry age-related macular degeneration: current challenges and future prospects. Clin Ophthalmol (2015) 9:2159–74. doi:10.2147/OPTH.S92359
155. Wyss-Coray T. Inflammation in Alzheimer disease: driving force, bystander or beneficial response? Nat Med (2006) 12:1005–15. doi:10.1038/nm1484
156. Klunk WE, Engler H, Nordberg A, Wang Y, Blomqvist G, Holt DP, et al. Imaging brain amyloid in Alzheimer’s disease with Pittsburgh Compound-B. Ann Neurol (2004) 55:306–19. doi:10.1002/ana.20009
157. Khan TK, Alkon DL. Alzheimer’s disease cerebrospinal fluid and neuroimaging biomarkers: diagnostic accuracy and relationship to drug efficacy. J Alzheimers Dis (2015) 46:817–36. doi:10.3233/JAD-150238
158. Tu P, Fu H, Cui M. Compounds for imaging amyloid-beta deposits in an Alzheimer’s brain: a patent review. Expert Opin Ther Pat (2015) 25:413–23. doi:10.1517/13543776.2015.1007953
159. Lockhart A, Lamb JR, Osredkar T, Sue LI, Joyce JN, Ye L, et al. PIB is a non-specific imaging marker of amyloid-beta (Abeta) peptide-related cerebral amyloidosis. Brain (2007) 130:2607–15. doi:10.1093/brain/awm191
160. Lockhart AC, Bukowski R, Rothenberg ML, Wang KK, Cooper W, Grover J, et al. Phase I trial of oral MAC-321 in subjects with advanced malignant solid tumors. Cancer Chemother Pharmacol (2007) 60:203–9. doi:10.1007/s00280-006-0362-y
Keywords: spectral domain, optical coherence tomography, beta-amyloid, alpha-synuclein, retinal imaging, Parkinson’s disease, multiple sclerosis, Huntington’s disease
Citation: Doustar J, Torbati T, Black KL, Koronyo Y and Koronyo-Hamaoui M (2017) Optical Coherence Tomography in Alzheimer’s Disease and Other Neurodegenerative Diseases. Front. Neurol. 8:701. doi: 10.3389/fneur.2017.00701
Received: 14 September 2017; Accepted: 06 December 2017;
Published: 19 December 2017
Edited by:
Piero Barboni, Studio Oculistico d’Azeglio, ItalyReviewed by:
Gianluca Coppola, Fondazione G.B. Bietti (IRCCS), ItalyNicole Balducci, Studio Oculistico d’Azeglio, Italy
Copyright: © 2017 Doustar, Torbati, Black, Koronyo and Koronyo-Hamaoui. This is an open-access article distributed under the terms of the Creative Commons Attribution License (CC BY). The use, distribution or reproduction in other forums is permitted, provided the original author(s) or licensor are credited and that the original publication in this journal is cited, in accordance with accepted academic practice. No use, distribution or reproduction is permitted which does not comply with these terms.
*Correspondence: Maya Koronyo-Hamaoui, maya.koronyo@csmc.edu
†Equal first authors.