 Si-Ying Song1,2,3
 Chang Hua4David Dornbors III5Rui-jun Kang6Xiao-Xi Zhao1Xin Du4Wen He6Yu-chuan Ding1,7
 Ran Meng1,2,3*
- 1Department of Neurology, Xuanwu Hospital, Capital Medical University, Beijing, China
- 2Advanced Center of Stroke, Beijing Institute for Brain Disorders, Beijing, China
- 3Department of China-America Institute of Neuroscience, Xuanwu Hospital, Capital Medical University, Beijing, China
- 4Department of Cardiology, Anzhen Hospital, Capital Medical University, Beijing, China
- 5Department of Neurological Surgery, Semmes-Murphey Clinic, The University of Tennessee Health Science Center, Memphis, TN, United States
- 6Department of Ultrasonography, Tiantan Hospital, Capital Medical University, Beijing, China
- 7Department of Neurosurgery, Wayne State University School of Medicine, Detroit, MI, United States
Background: Red blood cell distribution width (RDW) may be a potential biomarker of inflammation in patients with stroke. Elevated RDW is associated with higher incidence of stroke, unfavorable functional outcome, and increased mortality, although results are inconsistent in the reported literature. This study aims to evaluate the predictive power of RDW regarding stroke occurrence and outcome.
Methods: A thorough literature search was conducted utilizing the PubMed Central (PMC) and EMBASE databases to identify studies up to May 2019. Data from these studies were pooled, and combined odds ratios/risk ratios (ORs/RRs) were estimated for the risk of stroke, functional outcome, and mortality. A subgroup analysis was also performed to explore heterogeneity in terms of population status, demographic factors (age, gender distribution, and country), and vascular risk factors (hypertension, diabetes mellitus, and current smoking).
Results: A total of 31 studies with 3,487,896 patients were included in the analysis. Elevated RDW was found to be a risk factor in ischemic stroke (OR/RR 1.528; 95% confidence interval [CI] = 1.372–1.703), whereas combined OR in subarachnoid hemorrhage (SAH) was not statistically significant (OR/RR 1.835; 95% CI = 0.888–3.792). Elevated RDW posed increased risk in populations with conventionally higher risk of stroke, such as atrial fibrillation (AF) (OR/RR 1.292; 95% CI = 1.107–1.508) and diabetes mellitus (OR/RR 2.101; 95% CI = 1.488–2.968), and in community cohorts (OR/RR 1.245; 95% CI = 1.216–1.275). In addition, higher RDW was associated with unfavorable functional outcome, either at discharge (OR/RR 1.220; 95% CI = 1.070–1.39) or at 90 days (OR/RR 1.277; 95% CI = 1.155–1.413). Higher mortality was found in patients with increased RDW (OR/RR 1.278; 95% CI = 1.221–1.337), independent of demographic factors (age, gender distribution, and country).
Conclusions: Baseline RDW should be integrated into clinical practice as a predictor of ischemic stroke occurrence and outcome. Future studies should also explore the dynamic change of RDW in post-stroke patients to evaluate the clinical significance of RDW and its impact on the inflammatory state of ischemic stroke.
Introduction
Red blood cell distribution width (RDW) has served as a traditional biomarker for erythrocyte volume variability and as an indicator of erythrocyte homeostasis (1). However, the clinical significance of RDW is often overlooked and has historically been restricted to a narrow differential diagnosis, centered on anemia. Recent studies have shown that RDW elevation is seen in many human diseases, including cardiovascular diseases (2, 3), thrombosis (3, 4), and stroke (4, 5).
Inflammation has a profound impact on stroke development (6), and RDW is known to be closely associated with inflammatory responses on the basis of previous studies (1, 4, 7, 8). The relationship between RDW and stroke has begun to emerge with a large amount of evidence suggesting that elevated RDW might predict the incidence of stroke (4, 9, 10). Moreover, poor outcome in stroke is also related to a high baseline RDW level (11–13). Nevertheless, the clinical significance of RDW in stroke has not been comprehensively investigated owing to variations in sample populations and methodologies among current studies. This meta-analysis aims to evaluate the clinical value of RDW in stroke.
Methods
Search Strategy
This meta-analysis was registered in PROSPERO (International Prospective Register of Systematic Reviews) with the number CRD42018105318 and was conducted based on PRISMA (Preferred Reporting Items for Systematic Reviews and Meta-Analyses) guidelines (Supplementary Table 6). PubMed Central (PMC) and EMBASE databases were searched to identify studies up to May 2019. Medical subject headings and Emtree headings were used with the following keywords: “red blood cell distribution width OR RDW” and “prognosis OR prognostic OR survival OR outcome” and “stroke OR brain ischemia OR brain infarction OR cerebral infarction OR intracerebral hemorrhage OR intracranial hemorrhage.” The full search strategy is presented in Supplementary Table 1.
Study Selection
Prospective or retrospective studies that evaluated baseline RDW level prior to any treatment in patients with a confirmed diagnosis of ischemic stroke (IS) or subarachnoid hemorrhage (SAH) were included. Studies were identified as eligible if they provided hazard ratio (HR), odds ratio (OR), or relative risk ratio (RR) with 95% confidence interval (CI) regarding the risk of stroke or clinical outcomes. Studies without RDW at baseline were excluded. Furthermore, studies were eliminated if they involved patients who had nutritional deficiencies (vitamin B12 or folic acid deficiency) or hematological diseases (primary or secondary anemia, lymphoma/leukemia, and sickle cell disease/trait) or received a blood transfusion within 2 weeks. Conference abstracts, review articles, case reports, letters, animal studies, or in vitro studies were not included in the analysis. If two or more studies had duplicate or overlapping data, the study with a larger sample size was used. Two reviewers (SY-S and C-H) independently performed the study selection and resolved any disagreements via discussion.
Data Extraction
Two authors (SY-S and C-H) extracted data from all included studies, which was secondarily assessed by another author (RJ-K). Data extracted included the name of the first author, year of publication, country, study characteristics (sample size, age, and gender), clinical characteristics (population status and comorbid status), sample time, statistical methods used to define the cutoff value for RDW, and statistical sources of OR/RR (univariate or multivariate). A female-to-male ratio (F/M ratio) was introduced to precisely assess the various gender distributions among the included cohorts, which ranged from 0 to 3.2. The F/M ratio in a female-dominant subset was more than 1.2, whereas that in male-dominant cohort was <0.8. This reference interval was defined based on averaged population size in a subgroup analysis. OR/RR and 95% CI were extracted for risk of stroke/carotid atherosclerosis/thromboembolism, mortality (short or long term), and functional outcome. SPSS 19.0 was used to calculate RR and their 95% CI on the basis of data in studies if not explicitly stated in the manuscript and no response from the investigators was received after two requests. All disagreements were resolved by consensus.
Outcomes
In studies evaluating RDW as a predictor of stroke, carotid atherosclerosis, or thromboembolism in certain cohorts, the incidences of these events were recorded. In studies assessing RDW as a prognostic factor in stroke, the modified Rankin scale (mRS) was used to measure the functional outcomes in clinical follow-up. Death was defined as mRS of 6, whereas an unfavorable outcome was identified as mRS of 3–5.
Statistical Analyses
STATA version 14.0 (STATA, College Station, TX) was utilized in all analyses. Multivariate-adjusted OR/RR was prioritized, and univariate OR/RR was included in the meta-analysis if no multivariate-adjusted OR/RR was reported. Pooled estimates with 95% CI were derived under the Mantel–Haenszel method. Given the large sample size, OR was assumed to be a good approximation to RR, and therefore, OR and RR were pooled together and simplified to the description OR/RR. Heterogeneity was explored comprehensively through the subgroup analysis and sensitivity analyses and was assessed using the χ2 test and expressed as the I2 index (25% = low, 50% = medium, and 75% = high) (14). The random-effects model was performed if heterogeneity was more than 50%. Assessment of publication bias was done by visual inspection of funnel plots, combined with Begg's test and Egger's test (15, 16). Moreover, Duval and Tweede's trim-and-fill method was applied to estimate the corrected effect size after adjustment for publication bias (17). Evaluation of the risk of bias in eligible studies was under predefined criteria (18–20). P-values < 0.05 were considered statistically significant.
Results
Study Characteristics
We identified 150 potentially relevant records and then screened them by titles and abstracts. Seventy-four studies did not meet inclusion criteria. The remaining 76 articles were retrieved for a close analysis. Ultimately, 31 studies with 3,487,896 patients were included in the analysis according to the inclusion and exclusion criteria (Figure 1). The characteristics of the included studies can be seen in Table 1 (4, 5, 9–11, 13, 21–27, 29–44).
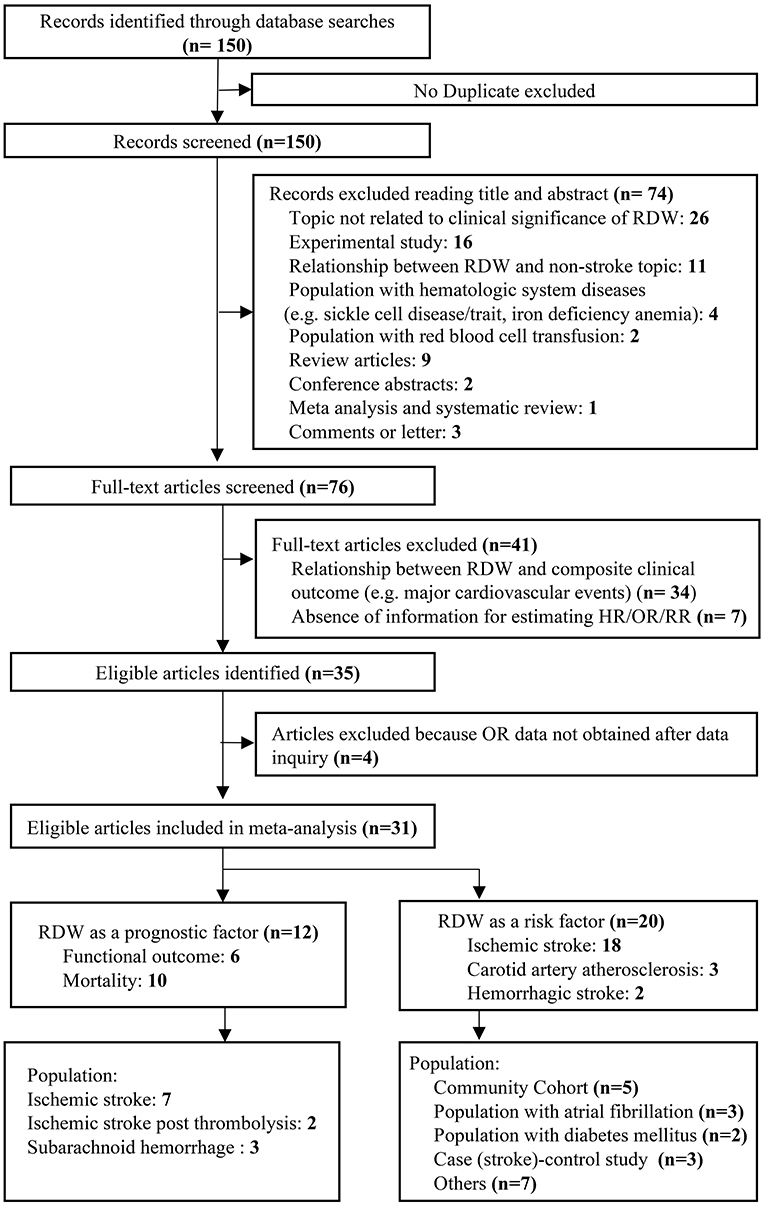
Figure 1. Flow diagram of the study selection process.
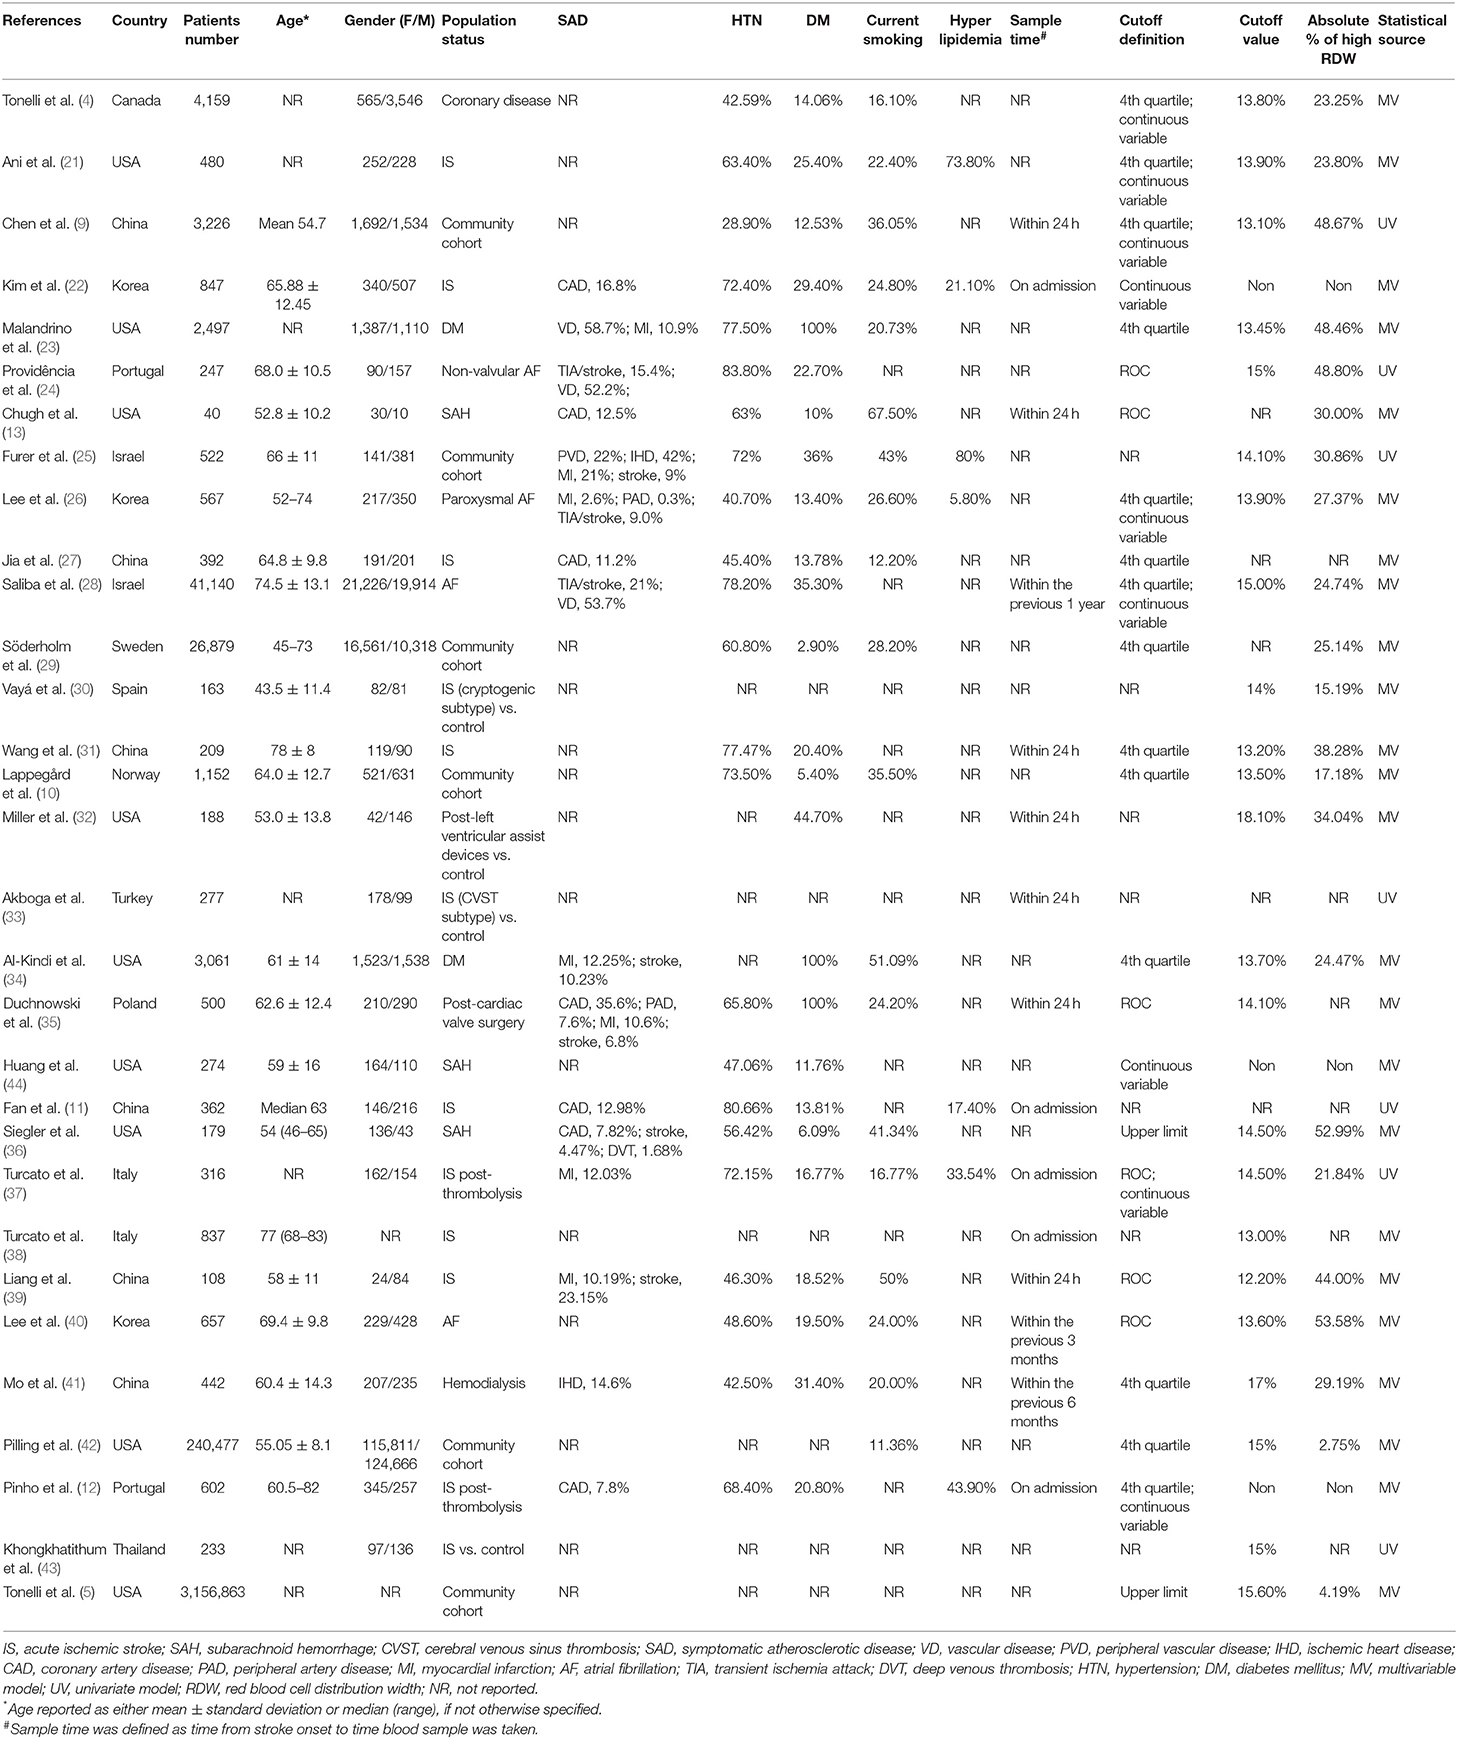
Table 1. Main characteristics of 31 eligible studies included in the meta-analysis.
Twenty studies evaluated RDW as a risk factor of stroke occurrence in different cohorts, such as community cohort (n = 6), atrial fibrillation (AF) (n = 4), and diabetes mellitus (DM) (n = 2). In addition, 12 studies assessed the prognostic value of RDW in stroke, including IS (n = 9) and SAH (n = 3). A large number of studies reported comorbidities within their respective cohorts. Most frequently evaluated comorbidities included DM (n = 25), hypertension (HTN) (n = 23), current smoking (n = 19), and systemic atherosclerosis (n = 16). Hyperlipidemia was only described in seven studies.
Among studies evaluating stroke prognosis, a blood sample was drawn at admission or within 24 h prior to treatment. In studies exploring RDW as a potential risk factor for stroke, only a few studies (15%) reported sample collection time, in which baseline RDW values were obtained within 1 year before enrollment. Four different methods for defining cutoff values of RDW were observed in the included studies. Quartiles of RDW distribution were used most frequently (n = 14), followed by continuous variables (n = 9), area under the receiver-operating curve (ROC) analysis (n = 6), and upper limit of normal RDW range (n = 2). The range of cutoffs of RDW was 13.8–18.1%, likely due to variable definitive methods and demographic characteristics among the cohorts, such as age, gender, and country of origin.
The majority of studies enrolled patients younger than 65 years (n = 14), with a balanced gender composition (n = 10). The number of cohorts originally from Western countries (n = 21) was substantially more than that of cohorts from Eastern countries (n = 10). More than 70% of the included studies provided results analyzed from the multivariate regression model (n = 24) (Supplementary Table 5). In terms of study quality, 26 studies had quality scores >7 (Supplementary Table 2).
Association Between Red Blood Cell Distribution Width and the Risk of Stroke/Carotid Atherosclerosis
A total of 20 studies with 3,535,653 patients provided OR/RR and 95% CI regarding the risk of IS/carotid atherosclerosis. Increased RDW was related to higher risk of combined stroke/carotid atherosclerosis (OR/RR = 1.544; 95% CI = 1.394–1.710; I2 = 64.6%; PH < 0.001; Figure 2). By analyzing these pathologies independently, elevated RDW was found to be a risk factor in IS (OR/RR = 1.528; 95% CI = 1.372–1.703; I2 = 61.6%; PH < 0.001; Figure 2) and carotid atherosclerosis (OR/RR = 1.869; 95% CI = 0.934–3.739; I2 = 86.7%; P < 0.001; Figure 2). RDW was not found to be a significant risk factor in SAH (OR/RR = 1.835; 95% CI = 0.888–3.792; I2 = 40.3%; PH = 0.196; Figure 2).
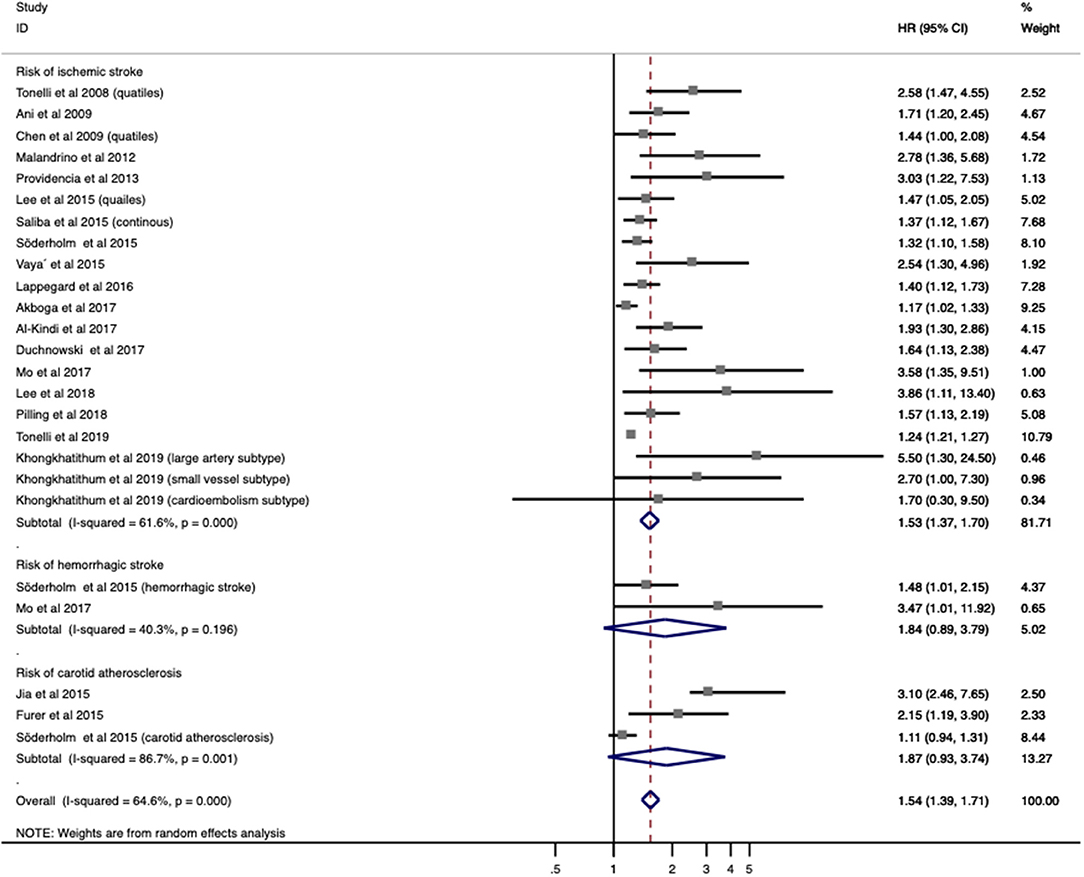
Figure 2. Meta-analysis of the association between RDW and risk of stroke in patients. Results are presented as individual and pooled risk ratios (RRs) with 95% confidence intervals (CIs). RDW, red blood cell distribution width.
Given the association between higher RDW and IS incidence, a further subgroup analysis was used to stratify patients by population status, demographic factors (age, gender distribution, and country), vascular risk factors (HTN, DM, and current smoking), and methodological factors (cutoff value, definition of cutoff value, and OR/RR calculation) (Table 2). Elevated RDW conferred increased risk in not only populations with conventionally higher risk of stroke, such as AF (OR/RR = 1.292; 95% CI = 1.107–1.508) and DM (OR/RR = 2.101; 95% CI = 1.488–2.968), but also non-selected community residents (OR/RR = 1.245; 95% CI = 1.216–1.275). No significant effect of high RDW was identified in either the elderly or younger populations. In terms of gender distribution, male-dominant cohorts with elevated RDW (OR/RR = 1.853; 95% CI = 1.505–2.283) were more prone to develop IS than were female-dominant cohorts (OR/RR = 1.330; 95% CI = 1.051–1.683). These results remained significant in studies performed in both Eastern and Western countries. Furthermore, the predictive value of RDW was found to be independent of vascular risk factors, such as HTN, DM, and current smoking status. Cutoff values of RDW varied among studies. Studies with cutoff values of RDW <15% were associated with worse OR/RR (OR/RR = 1.641; 95% CI = 1.453–1.855). The fourth quartile of RDW value became the most commonly used method to define a cutoff value, whereas a ROC analysis had the highest pooled OR/RR and the lowest heterogeneity among other subgroups (OR/RR = 1.890; 95% CI = 1.357–2.632, I2 = 30.0%). Both the multivariate and univariate models observed the adverse effect of RDW on IS.
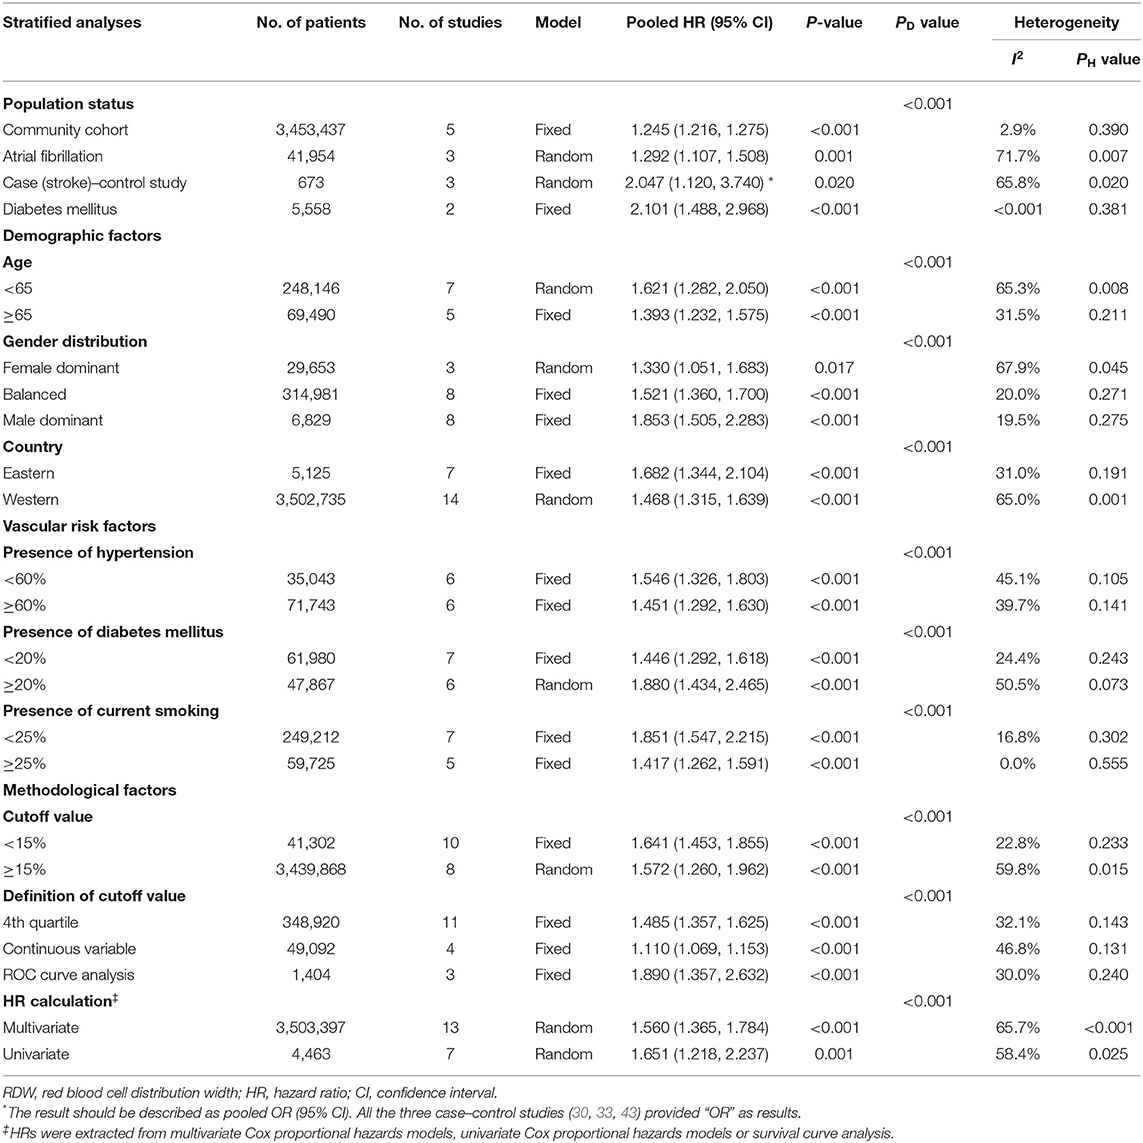
Table 2. Subgroup analyses of the associations between RDW and risk of ischemic stroke.
After a sensitivity analysis under the “one study removed” model, the pooled OR/RR was significantly affected by the exclusion of Tonelli et al. (Supplementary Table 3). Heterogeneity reduced by 5%, and the result remained statistically significant (OR/RR = 1.641; 95% CI = 1.448–1.859).
Association Between Red Blood Cell Distribution Width and Mortality in Stroke
Ten studies with 4,782 patients were analyzed for mortality. Overall, elevated RDW was associated with increased mortality (OR/RR = 1.278; 95% CI = 1.221–1.337; I2 = 49.3%; PH = 0.019; Figure 3). This adverse effect of higher RDW level was stronger in IS (OR/RR = 1.317; 95% CI = 1.212–1.432) than in hemorrhagic stroke (OR/RR = 1.266; 95% CI = 1.103–1.453; Table 3).
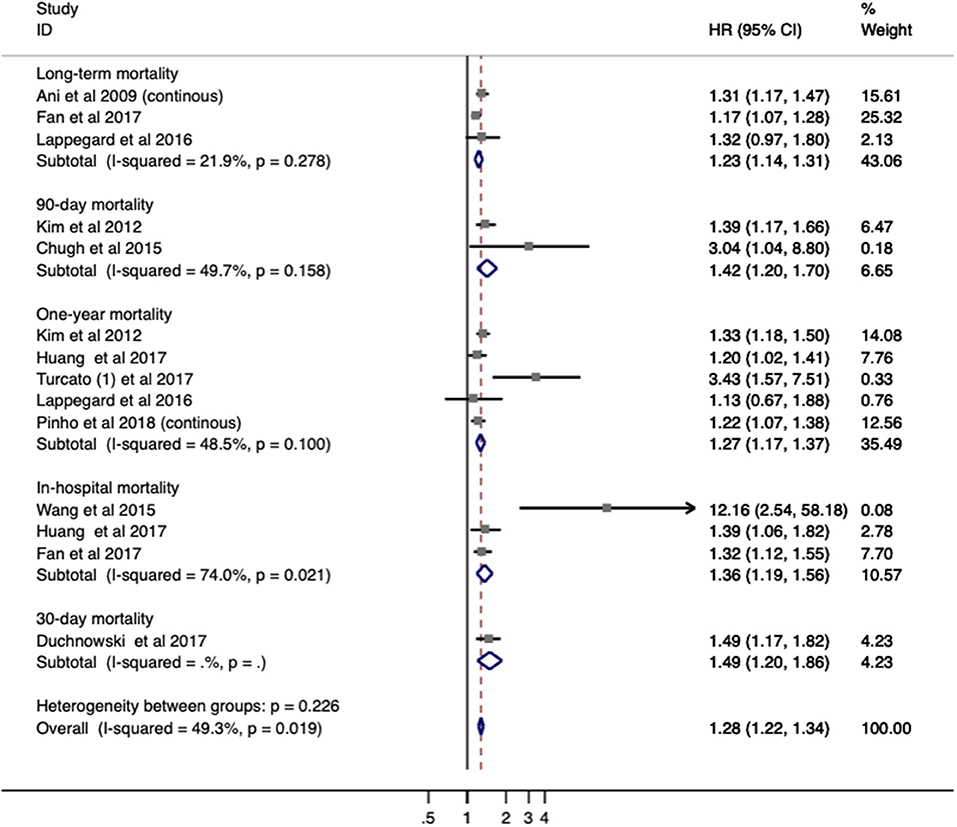
Figure 3. Meta-analysis of the association between RDW and mortality in patients. Results are presented as individual and pooled risk ratios (RRs) with 95% confidence intervals (CIs). RDW, red blood cell distribution width.
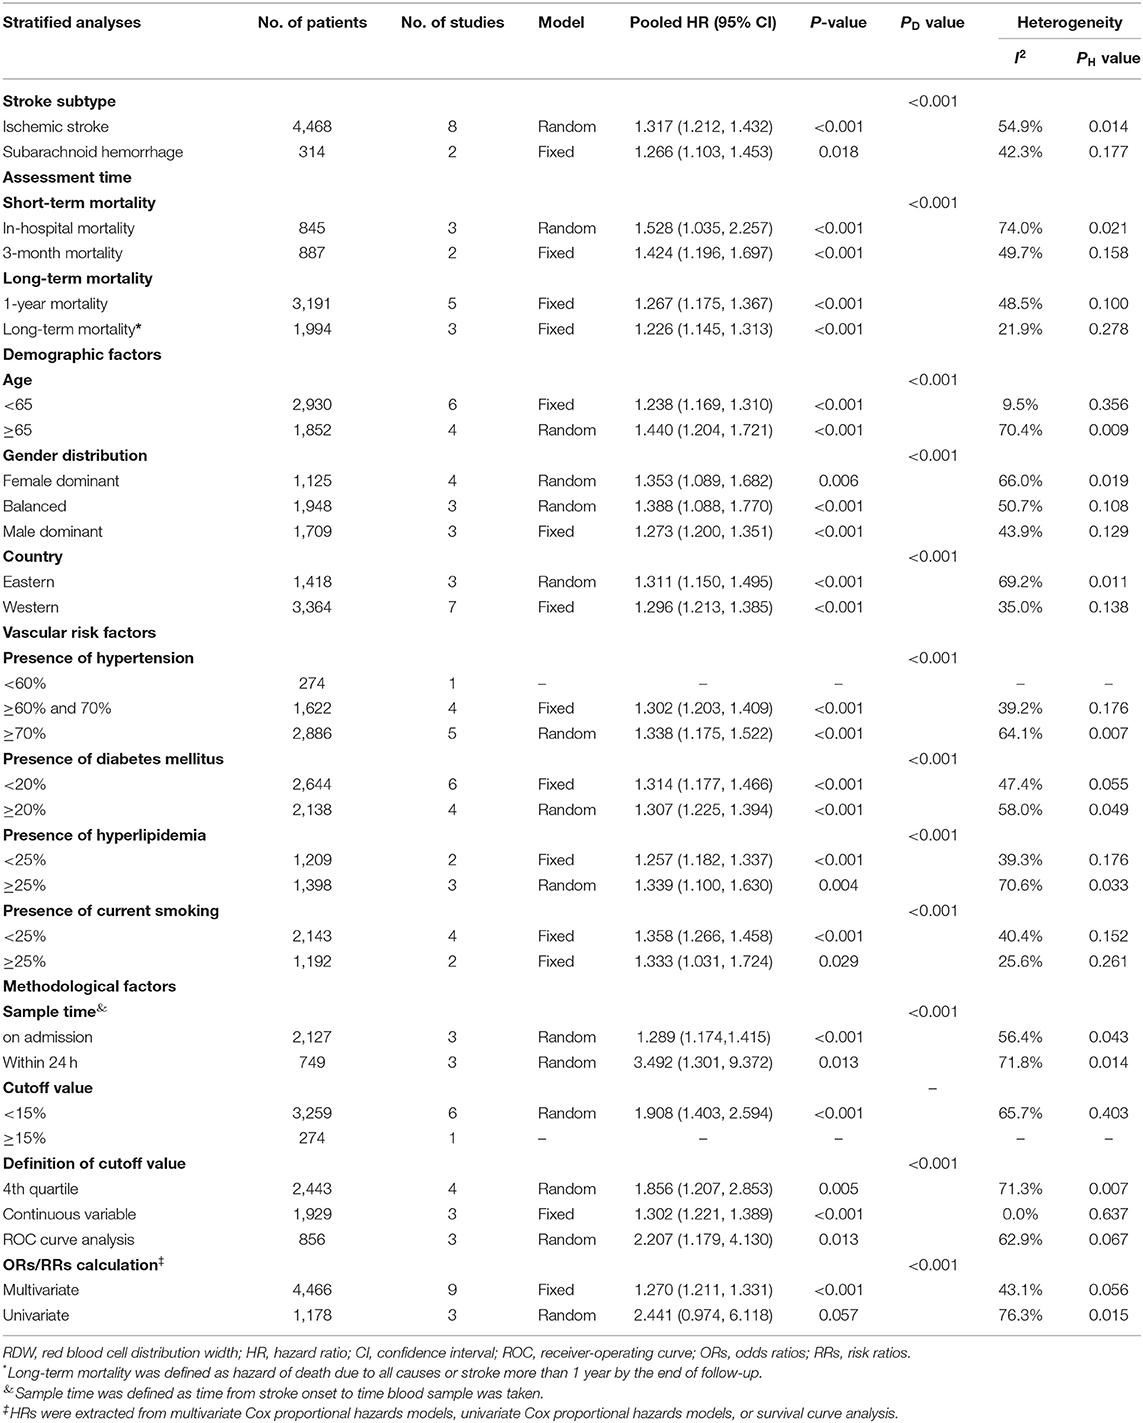
Table 3. Subgroup analyses of the associations between RDW and mortality in stroke.
The subgroup analysis of RDW effect on mortality was performed regarding the aforementioned variables (Table 3). Higher RDW was more strongly correlated with short-term mortality (in-hospital mortality and 3-month mortality) than relatively long-term mortality (1-year mortality). The prognostic value of RDW was independent of all demographic factors. Cohorts with patients older than 65 years or from Eastern countries had higher pooled mortality OR/RR. In addition, increased mortality was observed in populations with a high presence of HTN (>70%) or hyperlipidemia (>25%). When stratified by methodological factors, combined OR/RR remained significant.
In the sensitivity analysis under “one study removed” model, estimated OR/RR was not significantly affected by the exclusion of any study (Supplementary Figure 3).
Association Between Red Blood Cell Distribution Width and Functional Outcome in Ischemic Stroke
Seven studies with 2,929 patients evaluated the relationship between RDW and functional outcome in stroke. In a pooled analysis, no significant impact on functional outcome was identified (OR/RR 1.255; 95% CI = 1.159–1.360; I2 = 0.0%; PH = 0.537; Figure 4). Increased RDW was associated with unfavorable functional outcome both at discharge (OR/RR = 1.220; 95% CI = 1.070–1.39) and at 3-month follow-up (OR/RR = 1.277; 95% CI = 1.155–1.413). The subgroup analysis was not conducted owing to the low heterogeneity and sample size.
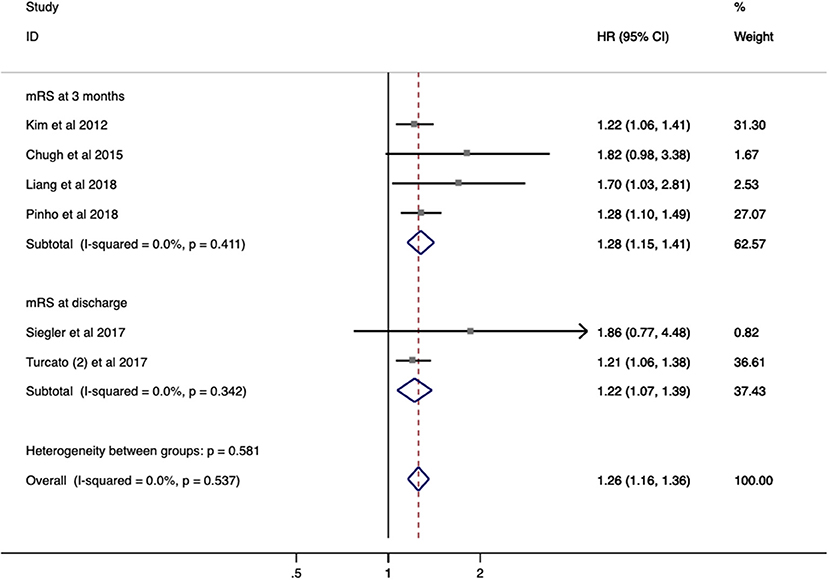
Figure 4. Meta-analysis of the association between RDW and modified Rankin scale (mRS) functional outcome in patients. Results are presented as individual and pooled risk ratios (RRs) with 95% confidence intervals (CIs). RDW, red blood cell distribution width.
Publication Bias
Evidence of publication bias in studies evaluating RDW as a risk factor (Supplementary Figure 1) and as a prognostic factor (Supplementary Figure 2) was observed for mortality in stroke by Egger's test. All combined OR/RR remained significant after the trim-and-fill method (Supplementary Table 4). Increased RDW was still associated with a higher risk of stroke and poor prognosis after stroke following adjustment for publication bias.
Discussion
RDW is a conventional parameter, which can be easily acquired with a complete blood count (CBC) test. However, its role in reflecting inflammation has only attracted attention recently (1, 4, 7, 8). Inflammation is known to be closely related to stroke occurrence and recurrence (6, 45), and the relationship between baseline RDW and stroke has been previously assessed in other studies, albeit with variable results. This meta-analysis provides a panoramic assessment of RDW as a risk factor for stroke in various cohorts and as a negative predictor of functional outcomes. Higher RDW was found to be associated with an increased risk of IS, not only in patients with AF or DM but also in community cohorts. Further, an unfavorable functional outcome and elevated short-term mortality after stroke was identified in patients with higher baseline RDW.
Despite robust results in this analysis that higher RDW correlates with an increased risk of IS and serves as a negative prognostic factor in stroke outcome, the underlying mechanism remains unclear. Given that patients with nutritional deficiency, hematological disease, and blood transfusion were excluded from the presented analysis, the majority of patients had RDW values within the normal range, albeit on the upper limit of normal. This may suggest accelerated red blood cell destruction or, more commonly, ineffective erythropoiesis (46). In either case, there is an increased number of immature red blood cells presented in peripheral blood, resulting in elevated RDW.
It has been well-documented that inflammation is associated with the process of IS, from initial ischemia to infarction and secondary repair (6, 45). During stroke-induced inflammation, various cytokines are released and affect erythropoiesis, erythropoietin (EPO) production (47, 48), inhibition of erythroid progenitors (49), and reduction in iron release (50, 51). Further, RDW has been previously found to have a positive association with plasma inflammatory biomarkers, such as C-reactive protein (CRP) (7, 8), erythrocyte sedimentation rate (ESR) (52), and interleukin (IL)-6 (53, 54). Higher RDW, even within the normal range, may worsen the inflammatory state in stroke, leading to worse outcomes following IS. Furthermore, inflammation is known to precipitate a thrombotic state, which may underlie the increased incidence of stroke in patients with elevated baseline RDW levels (55, 56). Taken all together, elevated RDW serves as a marker for increased inflammation, whether stroke induced, leading to poor outcomes after stroke, or marking a pro-thrombotic state, resulting in increased incidence of IS.
Recent studies have shown that RDW value is influenced by demographic factors (57), including age, gender, and race. A gradual increase in RDW with age has been reported in healthy controls (1), whereas the relationship between gender and RDW is still controversial. Some studies have suggested that females have a slightly higher RDW than have males (58, 59), whereas others indicate no significant gender-based difference in RDW values (60, 61). Studies evaluating the impact of race have found that the relationship between RDW and stroke is weaker in blacks than that in whites (62). The subgroup analysis in this study was used to stratify the results by demographic factors. The results revealed that elevated RDW could predict stroke occurrence and poor survival outcome, independent of age, gender, and race. However, the clinical significance of RDW was statistically more significant in populations from Eastern countries. RDW also showed a slightly different predictive value on risk and prognosis when stratified by age and gender. Cohorts of patients younger than 65 years had a higher risk of IS but had lower mortality than do the elderly subgroup. This result may be due to the fact that the majority of studies only assessed all-cause death, rather than stroke-related death. For this reason, future studies should evaluate short-term mortality or long-term stroke-related mortality as clinical outcomes. Concerning gender, increasing incidence of IS was observed in male-dominant subsets, whereas female-dominant cohorts with higher RDW were inversely associated with survival.
Baseline RDW was evaluated as both continuous and categorical (quartiles) variables. The fourth quartile was often used to define cutoff values, ranging from 13.8 to 18.1%. However, studies utilizing a ROC analysis to identify cutoffs had more negative pooled OR/RR and lower heterogeneity. Additionally, assessing RDW as a continuous variable was more likely to have lower combined OR/RR and narrower 95% confidence intervals. The cutoff value of 14.6% has conventionally been used for anemia in the past (63). This review found that most studies chose a cutoff under 15%, which was predictive of poorer clinical outcomes. These results remained significant after a sensitivity analysis. As such, future studies could empirically use 15% as a cutoff value, conduct an individual ROC analysis, or consider RDW as a continuous variable in patients with stroke.
Several limitations should be mentioned. First, RDW could be combined with other hematological parameters, such as neutrophil-to-lymphocyte ratio (NLR), platelet-to-lymphocyte ratio (PLR), and platelet distribution width (PDW), to systematically and globally reflect the inflammatory and thrombotic state. Second, there remains controversy regarding whether an original RDW value at a certain time point or a calculated RDW value within a certain period after stroke would better predict prognosis. A calculated RDW could include mean, median, maximum, or delta RDW to encompass the dynamic nature of the inflammatory state. Future studies should follow this dynamic change of RDW in the post-stroke window, similar to that seen in Siegler et al. (36), Chugh et al. (13), and Saliba et al. (28). Third, no study has evaluated the role of RDW in predicting stroke recurrence. Long-term follow-up is suggested to study the association between RDW and stroke recurrence. Finally, there was mild heterogeneity among the included studies owing to varying populations, sample times, and methodologies to define the cutoff value of RDW. However, heterogeneity by a subgroup analysis and a sensitivity analysis (under “one study removed” model) was explored. In the subgroup analysis, heterogeneity in most of the subgroups was reduced from high-to-medium level to medium-to-low level (including subgroups of age, cutoffs of RDW, and methodologies). In the sensitivity analysis, the pooled OR/RR was significantly affected by the exclusion of Tonelli et al. as detailed above (Supplementary Table 3). Heterogeneity reduced by 5%, but the result remained statistical significant (OR/RR = 1.641; 95% CI = 1.448–1.859). To further eliminate confounding, multivariate-adjusted OR/RR was preferentially selected, and univariate OR/RR was only included in the meta-analysis if no multivariate-adjusted OR/RR existed. The majority of the included studies utilized multivariate analysis (n = 24), meaning that individual studies had already adjusted for potential confounding factors (gender, age, and other inflammatory markers) prior to this meta-analysis.
Conclusions
Baseline RDW is a promising predictor of IS occurrence and outcome, independent of demographic and methodological factors. Notably, in the subgroup analysis, male-dominant cohorts with higher RDW tend to have a higher risk of stroke, and elevated RDW in the elderly population is strongly associated with mortality. Further investigation into the underlying etiology between this association between RDW and stroke risk and prognosis is certainly warranted.
Data Availability Statement
The datasets generated for this study are available on request to the corresponding author.
Author Contributions
RM: manuscript drafting and revision and study concept and design. S-YS: manuscript drafting and revision, study concept and design, collection, assembly, and interpretation of the data. CH and RK: collection, assembly, and interpretation of the data. RM, S-YS, CH, RK, X-XZ, XD, and WH: manuscript writing and final approval of manuscript. DD and YD deeply edited the revised version and contributed critical revision.
Funding
This study was sponsored by the National Key R&D Program of China (2017YFC1308400), the National Natural Science Foundation (81371289), and the Project of Beijing Municipal Top Talent for Healthy Work of China (2014-2-015).
Conflict of Interest
The authors declare that the research was conducted in the absence of any commercial or financial relationships that could be construed as a potential conflict of interest.
Acknowledgments
We would like to thank all authors who reported their relevant data on PMC and EMBASE.
Supplementary Material
The Supplementary Material for this article can be found online at: https://www.frontiersin.org/articles/10.3389/fneur.2019.01237/full#supplementary-material
References
1. Salvagno GL, Sanchis-Gomar F, Picanza A, Lippi G. Red blood cell distribution width: a simple parameter with multiple clinical applications. Crit Rev Clin Lab Sci. (2015) 52:86–105. doi: 10.3109/10408363.2014.992064
2. Felker GM, Allen LA, Pocock SJ, Shaw LK, McMurray JJ, Pfeffer MA, et al. Red cell distribution width as a novel prognostic marker in heart failure: data from the CHARM Program and the Duke Databank. J Am Coll Cardiol. (2007) 50:40–7. doi: 10.1016/j.jacc.2007.02.067
3. Montagnana M, Cervellin G, Meschi T, Lippi G. The role of red blood cell distribution width in cardiovascular and thrombotic disorders. Clin Chem Lab Med. (2011) 50:635–41. doi: 10.1515/cclm.2011.831
4. Tonelli M, Sacks F, Arnold M, Moye L, Davis B, Pfeffer M, et al. Relation between red blood cell distribution width and cardiovascular event rate in people with coronary disease. Circulation. (2008) 117:163–8. doi: 10.1161/CIRCULATIONAHA.107.727545
5. Tonelli M, Wiebe N, James MT, Naugler C, Manns BJ, Klarenbach SW, et al. Red cell distribution width associations with clinical outcomes: a population-based cohort study. PLoS ONE. (2019) 14:e0212374. doi: 10.1371/journal.pone.0212374
6. Anrather J, Iadecola C. Inflammation and stroke: an overview. Neurotherapeutics. (2016) 13:661–70. doi: 10.1007/s13311-016-0483-x
7. Ridker PM, Rifai N, Clearfield M, Downs JR, Weis SE, Miles JS, et al. Measurement of C-reactive protein for the targeting of statin therapy in the primary prevention of acute coronary events. N Engl J Med. (2001) 344:1959–65. doi: 10.1056/NEJM200106283442601
8. Sesso HD, Buring JE, Rifai N, Blake GJ, Gaziano JM, Ridker PM. C-reactive protein and the risk of developing hypertension. JAMA. (2003) 290:2945–51. doi: 10.1001/jama.290.22.2945
9. Chen PC, Sung FC, Chien KL, Hsu HC, Su TC, Lee YT. Red blood cell distribution width and risk of cardiovascular events and mortality in a community cohort in Taiwan. Am J Epidemiol. (2009) 171:214–20. doi: 10.1093/aje/kwp360
10. Lappegård J, Ellingsen TS, Skjelbakken T, Mathiesen EB, Njølstad I, Wilsgaard T, et al. Red cell distribution width is associated with future risk of incident stroke. The Tromso Study. Thromb Haemost. (2016) 115:126–34. doi: 10.1160/TH15-03-0234
11. Fan L, Gui L, Chai EQ, Wei CJ. Routine hematological parameters are associated with short- and long-term prognosis of patients with ischemic stroke. J Clin Lab Anal. (2018) 32:e22244. doi: 10.1002/jcla.22244
12. Pinho J, Marques SA, Freitas E, Araújo J, Taveira M, Alves JN, et al. Red cell distribution width as a predictor of 1-year survival in ischemic stroke patients treated with intravenous thrombolysis. Thromb Res. (2018) 164:4–8. doi: 10.1016/j.thromres.2018.02.002
13. Chugh C, Nyirjesy SC, Nawalinski KP, Sandsmark DK, Frangos S, Maloney-Wilensky E, et al. Red blood cell distribution width is associated with poor clinical outcome after subarachnoid hemorrhage: a pilot study. Neurocritical Care. (2015) 23:217–24. doi: 10.1007/s12028-015-0117-x
14. Higgins JP, Thompson SG, Deeks JJ, Altman DG. Measuring inconsistency in meta-analyses. BMJ. (2003) 327:557–60. doi: 10.1136/bmj.327.7414.557
15. Begg CB, Mazumdar M. Operating characteristics of a rank correlation test for publication bias. Biometrics. (1994) 50:1088–101. doi: 10.2307/2533446
16. Stuck AE, Rubenstein LZ, Wieland D. Bias in meta-analysis detected by a simple, graphical test. Asymmetry detected in funnel plot was probably due to true heterogeneity. BMJ. (1998) 316:469; author reply 470–1. doi: 10.1136/bmj.316.7129.469
17. Duval S, Tweedie R. Trim and fill: a simple funnel-plot-based method of testing and adjusting for publication bias in meta-analysis. Biometrics. (2000) 56:455–63. doi: 10.1111/j.0006-341X.2000.00455.x
18. Hayden JA, Cote P, Bombardier C. Evaluation of the quality of prognosis studies in systematic reviews. Ann Intern Med. (2006) 144:427–37. doi: 10.7326/0003-4819-144-6-200603210-00010
19. Mei ZB, Duan CY, Li CB, Cui L, Ogino S. Prognostic role of tumor PIK3CA mutation in colorectal cancer: a systematic review and meta-analysis. Ann Oncol. (2016) 27:1836–48. doi: 10.1093/annonc/mdw264
20. Altman DG. Systematic reviews of evaluations of prognostic variables. BMJ. (2001) 323:224–8. doi: 10.1136/bmj.323.7306.224
21. Ani C, Ovbiagele B. Elevated red blood cell distribution width predicts mortality in persons with known stroke. J Neurol Sci. (2009) 277:103–8. doi: 10.1016/j.jns.2008.10.024
22. Kim J, Kim YD, Song TJ, Park JH, Lee HS, Nam CM, et al. Red blood cell distribution width is associated with poor clinical outcome in acute cerebral infarction. Thromb Haemost. (2012) 108:349–56. doi: 10.1160/TH12-03-0165
23. Malandrino N, Wu WC, Taveira TH, Whitlatch HB, Smith RJ. Association between red blood cell distribution width and macrovascular and microvascular complications in diabetes. Diabetologia. (2012) 55:226–35. doi: 10.1007/s00125-011-2331-1
24. Providência R, Ferreira MJ, Gonçalves L, Faustino A, Paiva L, Fernandes A, et al. Mean corpuscular volume and red cell distribution width as predictors of left atrial stasis in patients with non-valvular atrial fibrillation. Am J Cardiovasc Dis. (2013) 3:91–102. doi: 10.1186/1471-2261-13-40
25. Furer A, Finkelstein A, Halkin A, Revivo M, Zuzut M, Berliner S, et al. High red blood cell distribution width and preclinical carotid atherosclerosis. Biomarkers. (2015) 20:376–81. doi: 10.3109/1354750X.2015.1096304
26. Lee KH, Park HW, Cho JG, Yoon NS, Kim SS, Kim MR, et al. Red cell distribution width as a novel predictor for clinical outcomes in patients with paroxysmal atrial fibrillation. Europace. (2015) 17(Suppl 2):ii83–8. doi: 10.1093/europace/euv210
27. Jia H, Li H, Zhang Y, Li C, Hu Y, Xia C. Association between red blood cell distribution width (RDW) and carotid artery atherosclerosis (CAS) in patients with primary ischemic stroke. Arch Gerontol Geriatr. (2015) 61:72–5. doi: 10.1016/j.archger.2015.04.005
28. Saliba W, Barnett-Griness O, Elias M, Rennert G. The association between red cell distribution width and stroke in patients with atrial fibrillation. Am J Med. (2015) 128:192.e11–8. doi: 10.1016/j.amjmed.2014.09.020
29. Söderholm M, Borné Y, Hedblad B, Persson M, Engström G. Red cell distribution width in relation to incidence of stroke and carotid atherosclerosis: a population-based cohort study. PLoS ONE. (2015) 10:e0124957. doi: 10.1371/journal.pone.0124957
30. Vayá A, Hernández V, Rivera L, Hernández JL, Lago A, España F, et al. Red blood cell distribution width in patients with cryptogenic stroke. Clin Appl Thromb Hemost. (2015) 21:241–5. doi: 10.1177/1076029614547262
31. Wang F, Yu Q, Wu X, Ju X, Wang L, Hu S. Correlation between the red blood cell distribution width and prognosis in elderly patients with cerebral infarction and severe hemiplegia. Chin J Cerebrovasc Dis. (2015) 12:287–91. doi: 10.3969/j.issn.1672-5921.2015.06.002
32. Miller PE, Houston BA, Schneider AL, Bush AL, Whitman GJ, Stevens GR, et al. Associations of preimplant red blood cell distribution width with clinical outcomes among individuals with left ventricular assist devices. ASAIO J. (2016) 62:677–83. doi: 10.1097/MAT.0000000000000431
33. Akboga YE, Bektas H, Anlar O. Usefulness of platelet to lymphocyte and neutrophil to lymphocyte ratios in predicting the presence of cerebral venous sinus thrombosis and in-hospital major adverse cerebral events. J Neurol Sci. (2017) 380:226–9. doi: 10.1016/j.jns.2017.07.036
34. Al-Kindi SG, Refaat M, Jayyousi A, Asaad N, Al Suwaidi J, Abi Khalil C. Red cell distribution width is associated with all-cause and cardiovascular mortality in patients with diabetes. BioMed Res Int. (2017) 2017:5843702. doi: 10.1155/2017/5843702
35. Duchnowski P, Hryniewiecki T, Kusmierczyk M, Szymanski P. Red cell distribution width is a prognostic marker of perioperative stroke in patients undergoing cardiac valve surgery. Interact Cardiovasc Thoracic Surg. (2017) 25:925–9. doi: 10.1093/icvts/ivx216
36. Siegler JE, Marcaccio C, Nawalinski K, Quattrone F, Sandsmark DK, Maloney-Wilensky E, et al. Elevated red cell distribution width is associated with cerebral infarction in aneurysmal subarachnoid hemorrhage. Neurocrit Care. (2017) 26:26–33. doi: 10.1007/s12028-016-0306-2
37. Turcato G, Cappellari M, Follador L, Dilda A, Bonora A, Zannoni M, et al. Red blood cell distribution width is an independent predictor of outcome in patients undergoing thrombolysis for ischemic stroke. Semin Thromb Hemost. (2017) 43:30–5. doi: 10.1055/s-0036-1592165
38. Turcato G, Cervellin G, Cappellari M, Bonora A, Zannoni M, Bovi P, et al. Early function decline after ischemic stroke can be predicted by a nomogram based on age, use of thrombolysis, RDW and NIHSS score at admission. J Thromb Thromb. (2017) 43:394–400. doi: 10.1007/s11239-016-1456-y
39. Liang A, Tang Y. Predictive effect of red blood cell distribution width on the prognosis of intravenous thrombolysis in patients with acute ischemic stroke. Chin J Cerebrovasc Dis. (2018) 15:68–72. doi: 10.3969/j.issn.1672-5921.2018.02.003
40. Lee KH, Cho JG, Park HW, Yoon NS, Jeong HK, Lee N. Role of red cell distribution width in the relationship between clinical outcomes and anticoagulation response in patients with atrial fibrillation. Chonnam Med J. (2018) 54:113–20. doi: 10.4068/cmj.2018.54.2.113
41. Mo L, Chen Y, Li Z, Xu L, Dong W, Zhang L, et al. Red blood cell distribution width as a marker of cerebral infarction in hemodialysis patients. Ren Fail. (2017) 39:712–8. doi: 10.1080/0886022X.2017.1398664
42. Pilling LC, Atkins JL, Kuchel GA, Ferrucci L, Melzer D. Red cell distribution width and common disease onsets in 240,477 healthy volunteers followed for up to 9 years. PLoS ONE. (2018) 13:e0203504. doi: 10.1371/journal.pone.0203504
43. Khongkhatithum C, Kadegasem P, Sasanakul W, Thampratankul L, Chuansumrit A, Sirachainan N. Abnormal red blood cell indices increase the risk of arterial ischemic stroke in children. J Clin Neurosci. (2019) 62:117–20. doi: 10.1016/j.jocn.2018.12.005
44. Huang YL, Han ZJ, Hu ZD. Red blood cell distribution width and neutrophil to lymphocyte ratio are associated with outcomes of adult subarachnoid haemorrhage patients admitted to intensive care unit. Ann Clin Biochem. (2017) 54:696–701. doi: 10.1177/0004563216686623
45. Deb P, Sharma S, Hassan KM. Pathophysiologic mechanisms of acute ischemic stroke: an overview with emphasis on therapeutic significance beyond thrombolysis. Pathophysiology. (2010) 17:197–218. doi: 10.1016/j.pathophys.2009.12.001
46. SD M. Introduction to anemia. In: McKenzie SD, editor. Clinical Laboratory Hematology. Saddle River, NJ: Pearson Prentice-Hall (2003). p. 161–88.
47. Pavese I, Satta F, Todi F, Di Palma M, Piergrossi P, Migliore A, et al. High serum levels of TNF-alpha and IL-6 predict the clinical outcome of treatment with human recombinant erythropoietin in anaemic cancer patients. Ann Oncol. (2010) 21:1523–8. doi: 10.1093/annonc/mdp568
48. Means RT Jr, Krantz SB. Inhibition of human erythroid colony-forming units by tumor necrosis factor requires beta interferon. J Clin Invest. (1993) 91:416–9. doi: 10.1172/JCI116216
49. Faquin WC, Schneider TJ, Goldberg MA. Effect of inflammatory cytokines on hypoxia-induced erythropoietin production. Blood. (1992) 79:1987–94. doi: 10.1182/blood.V79.8.1987.bloodjournal7981987
50. Nemeth E, Rivera S, Gabayan V, Keller C, Taudorf S, Pedersen BK, et al. IL-6 mediates hypoferremia of inflammation by inducing the synthesis of the iron regulatory hormone hepcidin. J Clin Invest. (2004) 113:1271–6. doi: 10.1172/JCI20945
51. Pietrangelo A, Trautwein C. Mechanisms of disease: the role of hepcidin in iron homeostasis–implications for hemochromatosis and other disorders. Nat Clin Pract Gastroenterol Hepatol. (2004) 1:39–45. doi: 10.1038/ncpgasthep0019
52. Meng S, Ma Z, Lu C, Liu H, Tu H, Zhang W, et al. Prognostic value of elevated red blood cell distribution width in Chinese patients with multiple myeloma. Ann Clin Lab Sci. (2017) 47:282–90.
53. Förhécz Z, Gombos T, Borgulya G, Pozsonyi Z, Prohászka Z, Jánoskuti L. Red cell distribution width in heart failure: prediction of clinical events and relationship with markers of ineffective erythropoiesis, inflammation, renal function, and nutritional state. Am Heart J. (2009) 158:659–66. doi: 10.1016/j.ahj.2009.07.024
54. de Gonzalo-Calvo D, de Luxán-Delgado B, Rodríguez-González S, García-Macia M, Suárez FM, Solano JJ, et al. Interleukin 6, soluble tumor necrosis factor receptor I and red blood cell distribution width as biological markers of functional dependence in an elderly population: a translational approach. Cytokine. (2012) 58:193–8. doi: 10.1016/j.cyto.2012.01.005
55. Meisel C, Schwab JM, Prass K, Meisel A, Dirnagl U. Central nervous system injury-induced immune deficiency syndrome. Nat Rev Neurosci. (2005) 6:775–86. doi: 10.1038/nrn1765
56. Macrez R, Ali C, Toutirais O, Le Mauff B, Defer G, Dirnagl U, et al. Stroke and the immune system: from pathophysiology to new therapeutic strategies. Lancet Neurol. (2011) 10:471–80. doi: 10.1016/S1474-4422(11)70066-7
57. Lippi G, Plebani M. Red blood cell distribution width (RDW) and human pathology. One size fits all. Clin Chem Lab Med. (2014) 52:1247–9. doi: 10.1515/cclm-2014-0585
58. Lippi G, Salvagno GL, Guidi GC. Red blood cell distribution width is significantly associated with aging and gender. Clin Chem Lab Med. (2014) 52:e197–9. doi: 10.1515/cclm-2014-0353
59. Alis R, Fuster O, Rivera L, Romagnoli M, Vaya A. Influence of age and gender on red blood cell distribution width. Clin Chem Lab Med. (2015) 53:e25–8. doi: 10.1515/cclm-2014-0756
60. Qiao R, Yang S, Yao B, Wang H, Zhang J, Shang H. Complete blood count reference intervals and age- and sex-related trends of North China Han population. Clin Chem Lab Med. (2014) 52:1025–32. doi: 10.1515/cclm-2012-0486
61. Hoffmann JJ, Nabbe KC, van den Broek NM. Effect of age and gender on reference intervals of red blood cell distribution width (RDW) and mean red cell volume (MCV). Clinical Chem Lab Med. (2015) 53:2015–9. doi: 10.1515/cclm-2015-0155
62. Patel KV, Semba RD, Ferrucci L, Newman AB, Fried LP, Wallace RB, et al. Red cell distribution width and mortality in older adults: a meta-analysis. J Gerontol A Biol Sci Med Sci. (2010) 65:258–65. doi: 10.1093/gerona/glp163
Keywords: red blood cell distribution width, stroke, risk factor, mortality, functional outcome, meta-analysis
Citation: Song S-Y, Hua C, Dornbors D III, Kang R, Zhao X-X, Du X, He W, Ding Y and Meng R (2019) Baseline Red Blood Cell Distribution Width as a Predictor of Stroke Occurrence and Outcome: A Comprehensive Meta-Analysis of 31 Studies. Front. Neurol. 10:1237. doi: 10.3389/fneur.2019.01237
Received: 11 June 2019; Accepted: 06 November 2019;
Published: 26 November 2019.
Edited by:
Yannick Béjot, Centre Hospitalier Regional Universitaire De Dijon, FranceReviewed by:
Linxin Li, University of Oxford, United KingdomMaurice Giroud, Centre Hospitalier Regional Universitaire De Dijon, France
Copyright © 2019 Song, Hua, Dornbors, Kang, Zhao, Du, He, Ding and Meng. This is an open-access article distributed under the terms of the Creative Commons Attribution License (CC BY). The use, distribution or reproduction in other forums is permitted, provided the original author(s) and the copyright owner(s) are credited and that the original publication in this journal is cited, in accordance with accepted academic practice. No use, distribution or reproduction is permitted which does not comply with these terms.
*Correspondence: Ran Meng, ranmeng2011@pku.org.cn