 Jussi P. Posti1*
 Riikka S. K. Takala2
 Rahul Raj3†
 Teemu M. Luoto4†
 Leire Azurmendi5
 Linnéa Lagerstedt5
 Mehrbod Mohammadian6
 Iftakher Hossain6,7
 Jessica Gill8
 Janek Frantzén1
 Mark van Gils9Peter J. Hutchinson7Ari J. Katila2Pia Koivikko2Henna-Riikka Maanpää1David K. Menon10
 Virginia F. Newcombe10Jussi Tallus6
 Kaj Blennow11,12‡Olli Tenovuo6‡
 Henrik Zetterberg11,12,13,14‡
 Jean-Charles Sanchez5‡
- 1Clinical Neurosciences, Department of Neurosurgery, Turku Brain Injury Centre, Turku University Hospital, University of Turku, Turku, Finland
- 2Perioperative Services, Intensive Care Medicine and Pain Management, Department of Anesthesiology and Intensive Care, Turku University Hospital, University of Turku, Turku, Finland
- 3Department of Neurosurgery, Helsinki University Hospital, University of Helsinki, Helsinki, Finland
- 4Department of Neurosurgery, Tampere University Hospital, Tampere University, Tampere, Finland
- 5Department of Specialities of Internal Medicine, Faculty of Medicine, University of Geneva, Geneva, Switzerland
- 6Turku Brain Injury Centre, Turku University Hospital, University of Turku, Turku, Finland
- 7Neurosurgery Unit, Department of Clinical Neurosciences, Addenbrooke's Hospital, University of Cambridge, Cambridge, United Kingdom
- 8National Institute of Nursing Research, National Institutes of Health, Bethesda, MD, United States
- 9VTT Technical Research Centre of Finland Ltd., Tampere, Finland
- 10Division of Anaesthesia, Addenbrooke's Hospital, University of Cambridge, Cambridge, United Kingdom
- 11Department of Psychiatry and Neurochemistry, Institute of Neuroscience and Physiology, The Sahlgrenska Academy, University of Gothenburg, Gothenburg, Sweden
- 12Clinical Neurochemistry Laboratory, Sahlgrenska University Hospital, Gothenburg, Sweden
- 13Department of Neurodegenerative Disease, University College London Institute of Neurology, London, United Kingdom
- 14The United Kingdom Dementia Research Institute at University College London, University College London, London, United Kingdom
Background: Blood biomarkers may enhance outcome prediction performance of head computed tomography scores in traumatic brain injury (TBI).
Objective: To investigate whether admission levels of eight different protein biomarkers can improve the outcome prediction performance of the Helsinki computed tomography score (HCTS) without clinical covariates in TBI.
Materials and methods: Eighty-two patients with computed tomography positive TBIs were included in this study. Plasma levels of β-amyloid isoforms 1–40 (Aβ40) and 1–42 (Aβ42), glial fibrillary acidic protein, heart fatty acid-binding protein, interleukin 10 (IL-10), neurofilament light, S100 calcium-binding protein B, and total tau were measured within 24 h from admission. The patients were divided into favorable (Glasgow Outcome Scale—Extended 5–8, n = 49) and unfavorable (Glasgow Outcome Scale—Extended 1–4, n = 33) groups. The outcome was assessed 6–12 months after injury. An optimal predictive panel was investigated with the sensitivity set at 90–100%.
Results: The HCTS alone yielded a sensitivity of 97.0% (95% CI: 90.9–100) and specificity of 22.4% (95% CI: 10.2–32.7) and partial area under the curve of the receiver operating characteristic of 2.5% (95% CI: 1.1–4.7), in discriminating patients with favorable and unfavorable outcomes. The threshold to detect a patient with unfavorable outcome was an HCTS > 1. The three best individually performing biomarkers in outcome prediction were Aβ40, Aβ42, and neurofilament light. The optimal panel included IL-10, Aβ40, and the HCTS reaching a partial area under the curve of the receiver operating characteristic of 3.4% (95% CI: 1.7–6.2) with a sensitivity of 90.9% (95% CI: 81.8–100) and specificity of 59.2% (95% CI: 40.8–69.4).
Conclusion: Admission plasma levels of IL-10 and Aβ40 significantly improve the prognostication ability of the HCTS after TBI.
Introduction
Traumatic brain injury (TBI) is a highly heterogeneous disease (1) and a leading cause of long-term disability globally (2). It is clear that outcome after TBI solely does not depend only on the given care in the acute and late phases, but also on the injury type and severity, patient's clinical characteristics, and eventual brain tissue fate (3, 4). Improved outcome models may help better stratify patients for different treatment and monitoring strategies and provide information about expected gross outcomes to clinicians, patients, and their families.
TBI is classically divided into mild, moderate, and severe based on the initial assessment using the Glasgow Coma Scale (GCS) score upon admission (5). The GCS score is one of the strongest clinical outcome predictors (3) but does not consider the complex pathophysiological characteristics of TBI. Furthermore, GCS assessment may be confounded by subjective interrater variability and patient's intoxication or sedation (6, 7).
Early structural intracranial abnormalities detected on head computed tomography (CT) have been suggested as complementary or independent outcome predictors. The Marshall CT classification (8) was not originally designed to be an outcome measure tool, but its features have been successfully incorporated into the International Mission for Prognosis and Analysis of Clinical Trials in TBI (IMPACT) (9) and the Corticosteroid Randomization After Significant Head injury (10) prognostication models, which have been comprehensively validated (11). After the Marshall CT classification, outcome prediction-weighted CT classifications have emerged. Rotterdam CT score (12), Helsinki CT Score (HCTS), (13) and Stockholm CT score (14) have shown promise in prognostication of patients with CT-positive findings. The latter two reportedly provide more information on the structural pathology and more accurate outcome prediction than earlier models (15).
Several brain-enriched protein biomarkers have been studied in combination and isolation as tools for predicting TBIs of different severities (16–18). Biomarkers may offer incremental value in outcome prediction when used in combination with neuroimaging scores. We recently studied eight biomarkers [β-amyloid isoforms 1–40 [Aβ40] and 1–42 [Aβ42], glial fibrillary acidic protein [GFAP], heart fatty acid-binding protein [H-FABP], interleukin 10 [IL-10], neurofilament light chain [NF-L], S100 calcium-binding protein B [S100B], and total tau [t-tau]] and their ability to discriminate CT-negative and CT-positive patients with TBIs of different severities. We found that panels of biomarkers significantly outperformed individual biomarkers in this setting (19).
The overall aim of this study was to see whether the biomarkers listed earlier improved the prediction of outcome using an admission head CT score. As these biomarkers are of different cellular origins, we planned to investigate each separately as well as combined. The HCTS was chosen due to its ability to be reliably implemented, and it has an extensive validation background (15, 20–23). We hypothesized that the prognostic performance of the HCTS would improve after adding blood-based biomarkers.
Methods
Study Population and Clinical Characteristics
This prospective study was part of the European Union-funded TBIcare (Evidence-Based Diagnostic and Treatment Planning Solution for Traumatic Brain Injuries) project, where we recruited patients with acute TBIs at the Turku University Hospital, Finland, from November 2011 to October 2013. All patients were treated according to the local protocols based on existing international guidelines and recommendations at that time (24).
The total available cohort of patients with head injury consisted of 620 patients. Of these, 203 patients met the following inclusion criteria: (i) age ≥ 18 years and (ii) clinical diagnosis of TBI and indications for acute head CT according to the National Institute for Health and Care Excellence criteria (25), and did not meet the following exclusion criteria: (i) blast-induced or penetrating injury, (ii) chronic subdural hematoma, (iii) inability to live independently due to a preexisting brain disease, (iv) TBI or suspected TBI not needing head CT, (v) more than 2 weeks from the injury, (vi) not living in the hospital district thereby preventing follow-up visits, (vii) not speaking the native language (Finnish), or (viii) no consent received.
In this study, we included those patients who had admission levels of plasma Aβ40, Aβ42, GFAP, H-FABP, IL-10, NF-L, S100B, and t-tau obtained within 24 h after hospital admission available (n = 160). From these patients, we included those who had Glasgow Outcome Scale—Extended (GOSE) scores assessed 4–16 months after injury [assessed by an experienced neurologist [OT], n = 137, the average time between injury and GOSE was 7.82 months, ±3.33]. Outcomes were defined as favorable (GOSE 5–8), and unfavorable (GOSE 1–4), complete recovery (GOSE 8), and incomplete recovery (GOSE <8) (17). Traditionally, the first categorization is used in terms of moderate to severe TBI and the latter in mild TBI. As the patients were not classified according to their initial GCS scores but according to their HCTS scores in the current study, we used both categorizations. The admission head CT scans were blindly evaluated by three senior neurotrauma researchers (neurosurgeons) as described later. The patients were divided into the main study cohort (CT-positive, n = 82, 60%) and comparison cohort (CT-negative, n = 55, 40%). Data on TBI-related deaths were collected up to 12 months after injury.
The GCS scores were assessed by paramedics at the scene of the accident or during transport and/or by an emergency physician at the time of admission. The lowest recorded post-resuscitation GCS was used in the demographic data (16, 26). Hypoxia was defined as any event of oxygen saturation of <90% and hypotension as any period of systolic blood pressure level of <100 mmHg in patients aged 50–69 years and <110 mmHg in patients aged 18–49 years and ≥70 years (24). Anemia was defined as a hemoglobin concentration of <100 g/L. Hypoglycemia was defined as a glucose level of <4.4 mmol/L. These thresholds were based on the latest international recommendation (24). Injury Severity Score (ISS) (27) was used to evaluate the overall injury load.
The ethical review board of the Hospital District of Southwest Finland approved the study protocol (decision 68/180/2011). All patients or their next of kin were informed about the study in both oral and written forms. Written informed consent was obtained according to the World Medical Association's Declaration of Helsinki.
Biomarker Analyses
Blood samples for plasma Aβ40, Aβ42, GFAP, H-FABP, IL-10, NF-L, S100B, and t-tau were drawn within 24 h from admission. Plasma H-FABP and IL-10 were analyzed using the K151HTD and K151QUD kits, respectively, from Meso Scale (Meso Scale Diagnostics, Rockville, MD, USA), and S100B was measured using EZHS100B-33K kit from Millipore (Millipore, Billerica, MA, USA) according to the manufacturers' recommendations in a research laboratory in Geneva, Switzerland. The plasma levels of GFAP, NF-L, and t-tau were assessed using the Human Neurology 4-Plex A assay on an HD-1 Single molecule array (Simoa) instrument according to the instructions from the manufacturer (Quanterix, Billerica, MA, USA) in the Clinical Neurochemistry Laboratory, Sahlgrenska University Hospital, Mölndal, Sweden. Plasma Aβ40 and Aβ42 concentrations were measured using a duplex Simoa immunoassay (Quanterix, Billerica, MA, USA) in a research laboratory in Bethesda, MD, USA.
The lower limits of detection, the lower limits of quantification, and the calibration ranges for the blood-based biomarkers are shown in Supplementary Table 1. One patient had an S100B level below the lower limit of detection range, and therefore, the concentration of 1 pg/ml was applied, permitting statistical analysis. This applied concentration did not affect the statistics results. All biomarker measurements were performed by board-certified laboratory technicians who were blinded to clinical data.
Computed Tomography Scan Grading
Three senior neurotrauma researchers (JP, RR, and TL) evaluated 137 head CT scans and classified them according to the HCTS (13). First, two researchers (JP and RR) independently and blindly analyzed the scans and coded the findings, and the third (TL) evaluated the results. Next, the third evaluated all the scans, emphasizing the cases with conflicting results provided by the two independent researchers. Last, the cases with disagreement were assessed in a joint meeting.
Statistical Analysis
The normality of distribution of the biomarker levels was assessed with the Kolmogorov–Smirnov test and by visually inspecting histograms. The demographic data on age, sex, pupil reactivity, extracerebral injuries, events of hypoxia, events of hypotension, events of hypoglycemia, anemia, hospital admission/discharge, and outcome were normally distributed and are presented as mean ± standard deviation. Differences between groups were analyzed with t-tests. There were patients with missing data on pupil reactivity, events of hypoxia, hypotension, and hypoglycemia, and these were excluded from the comparative analysis. Data on GCS, ISS, (27), and HCTS sum are presented in medians and ranges. Differences between groups are analyzed with the Mann–Whitney U-test. The levels of the biomarkers were not normally distributed and are presented as medians with interquartile ranges (IQRs). Differences in biomarker levels between the two outcome groups were analyzed with the Mann–Whitney U-test.
The partial area under the curve (pAUC) of the receiver operating characteristic (ROC) was used to compare only a portion of the biomarkers AUC curves, which here was set to the clinically relevant range of 90–100% sensitivity. Panels were developed by the iterative combination of biomarkers and thresholds method using the Panelomix toolbox (28). For each biomarker, several cutoffs were selected, and the best combination of markers and thresholds was selected to give the best panel performance. The size of the panels was set to a maximum of (i) first two and then (ii) three covariates (from the pool of the biomarkers and the HCTS) and was evaluated when sensitivity was set at 90–100%. Hence, an optimal predictive panel means combining covariates that yields a set of the best specificity, sensitivity, and pAUC. P < 0.05 were considered significant.
The first round of the head CT scan review included reviews by RR and JP. The inter-rater reliability was assessed with Cohen's kappa statistic. The overall inter-rater reliability between the three reviewers was assessed with the intraclass correlation coefficient (two-way mixed-effects).
Excluding the Panelomix toolbox analysis, the statistical analysis was carried out using the IBM SPSS Statistics version 25 (IBM Corp, New York).
Results
Demographics, Computed Tomography Findings, Outcomes, and Blood Samples
The number of eligible patients was 137. Out of these, 82 patients (60%) were CT-positive, and 55 patients (40%) were CT-negative (Figure 1). The CT-positive patients constituted the main study group. Differences in baseline characteristics between CT-positive (main study group) and CT-negative patients (comparison study group) are shown in Supplementary Material. Briefly, patients in the CT-positive group were older (mean age 50 vs. 44 years), more often male (78 vs. 62%), had lower GCS scores (median 14 vs. 15), more often abnormal pupillary light reactions (15 vs. 4%), higher ISSs (median 18 vs. 6), and less frequently had a favorable outcome (60 vs. 93%) compared with patients in the CT-negative group. The main study group differed from the total potential head injury population (n = 620) only in terms of sex: in the main study group, 78% were males and in the total available cohort 71%.
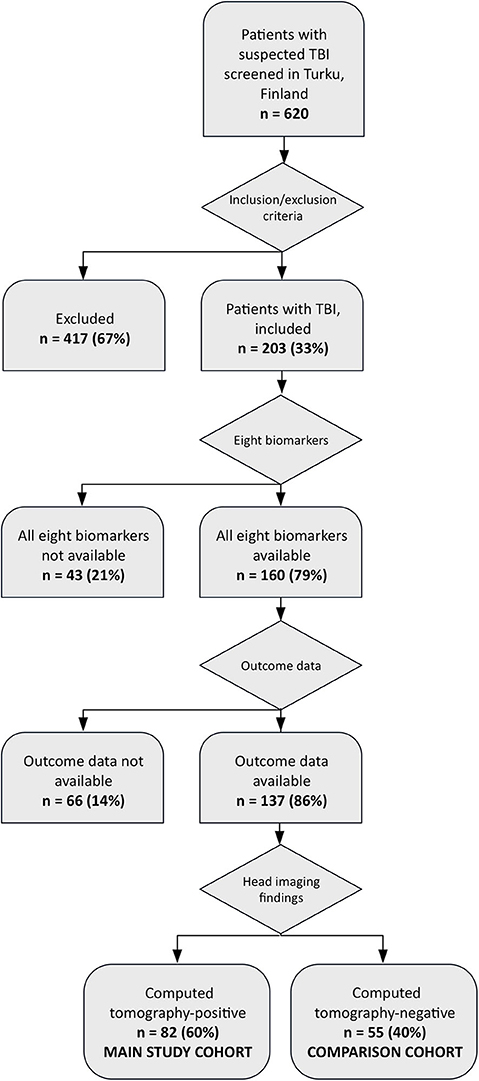
Figure 1. Study recruitment flow chart.
In the CT-positive group, the mean age was 50.5 years (SD ±20.4), 78% were male, the median GCS score was 14 and 60% had a favorable outcome. The CT-positive patients with a favorable outcome were younger, had higher GCS scores, lower ISSs, and underwent less mass lesion evacuations compared with the CT-positive patients with an unfavorable outcome (Tables 1, 2). In the CT-positive group, there were no differences in time elapsed between injury date and outcome assessment date when a patient had favorable and unfavorable outcomes (p = 0.584) and when complete and incomplete recovery (p = 0.320) were compared.
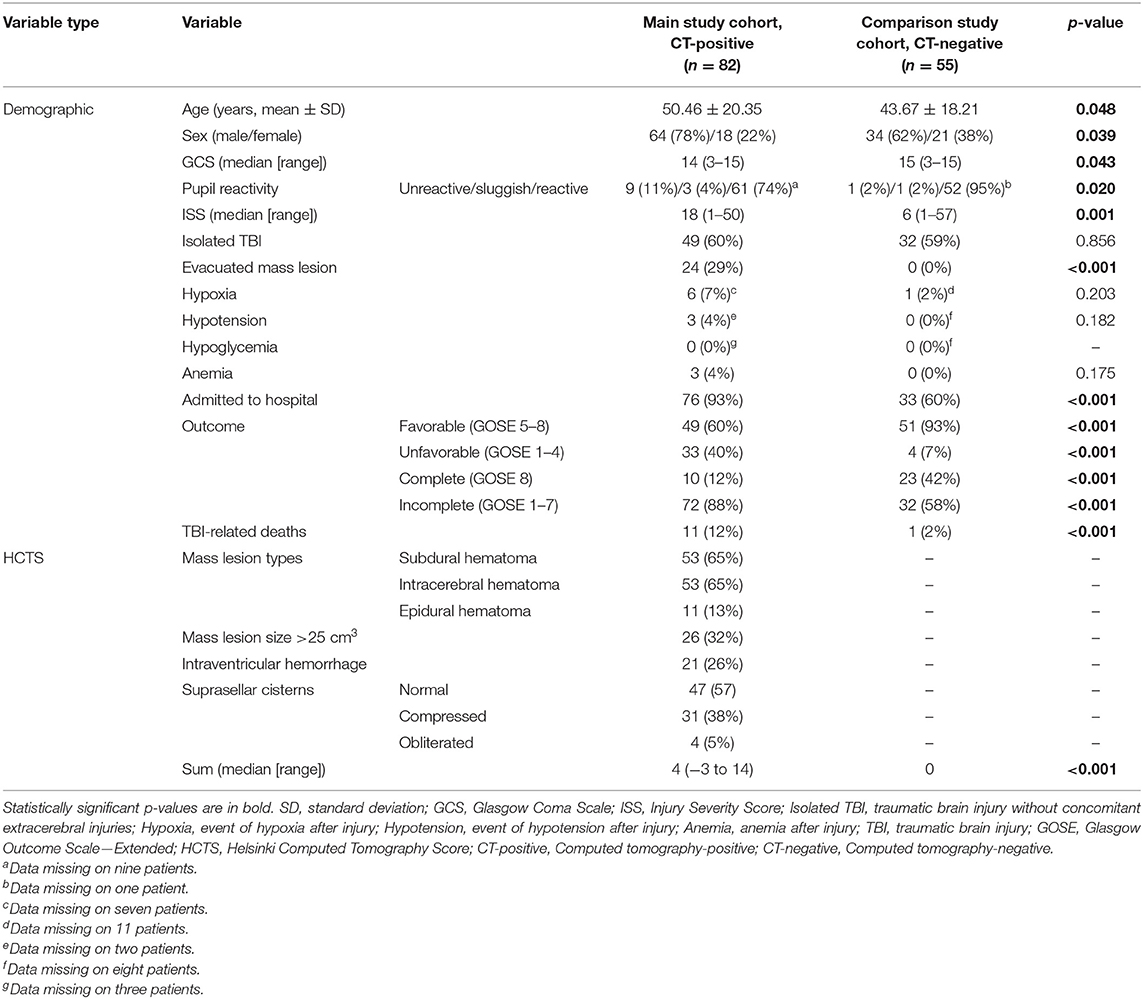
Table 1. Demographics of the whole study cohort—all patients.
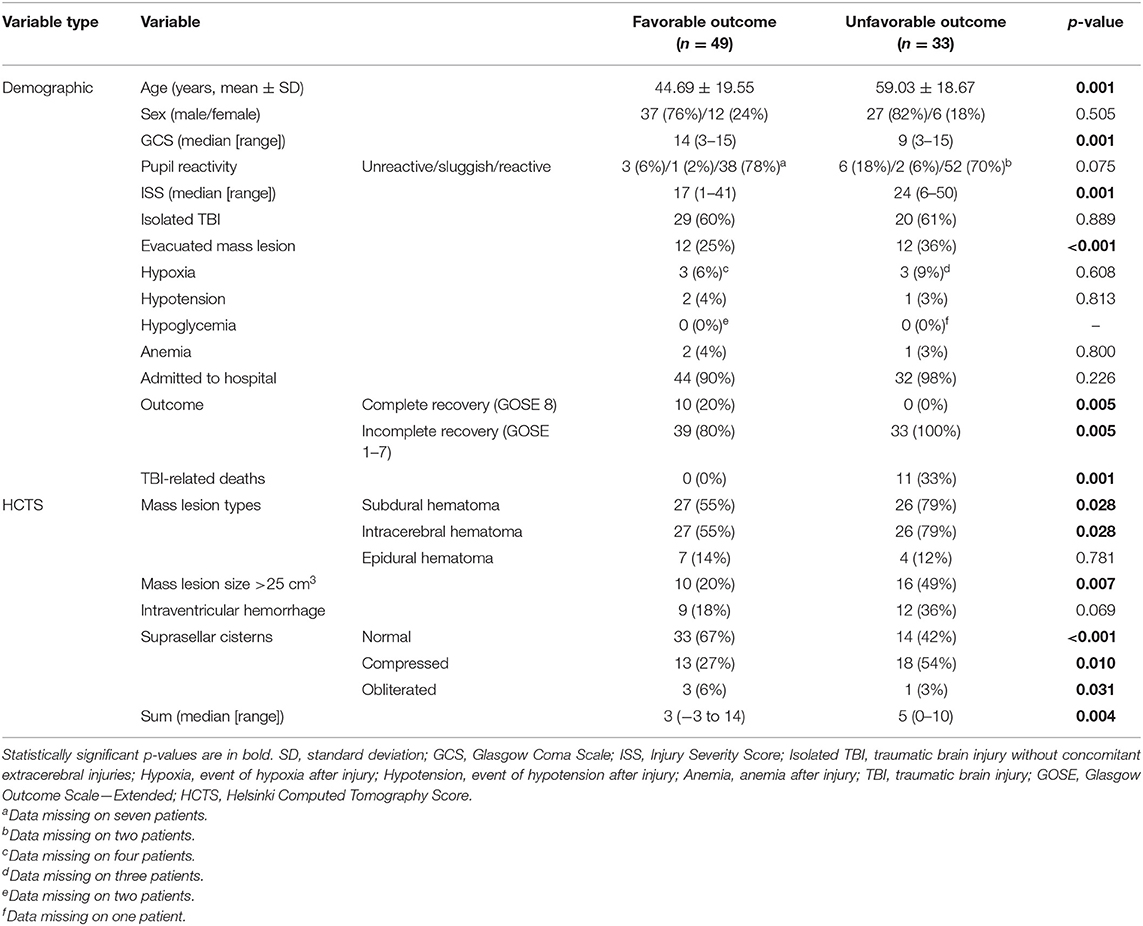
Table 2. Demographics of the main study cohort—Computed tomography-positive patients divided into patients with favorable outcome (Glasgow Outcome Scale—Extended 5–8) and unfavorable outcome (Glasgow Outcome Scale—Extended 1–4).
Utilizing the HCTS classification, the first two head CT scan reviewers reached a substantial agreement in terms of subdural hematoma, intracerebral hematoma, mass lesions (size > 25 cm3), and intraventricular hemorrhage, whereas the agreement was moderate in terms of epidural hematoma and suprasellar cistern features as assessed according to Cohen (29) (Supplementary Table 2). The overall agreement reliability between the reviewers RR, JP, and TL was excellent in terms of subdural hematoma, intracerebral hematoma, mass lesions (size > 25 cm3), and intraventricular hemorrhage, whereas the agreement reliability was good in terms of epidural hematoma and suprasellar cistern features as assessed according to Koo and Li (30) (Supplementary Table 3).
The blood samples of all the patients were obtained within 24 h from admission. In those patients for whom the exact time of injury was available, the time elapse from injury to blood sampling was 13.1 ± 10.4 h (n = 62). Among those patients in whom the exact injury time was unavailable, the time of injury was estimated based on the best available information. Among these patients, 26 patients were sampled within 24 h, and 49 patients were sampled after 24 h from the injury.
The biomarker levels in different outcome groups are presented in Supplementary Tables 4, 5.
Helsinki Computed Tomography Scale Alone in Outcome Prediction
The HCTS alone yielded a pAUC of the ROC of 2.5% (1.1–4.7) with a sensitivity of 97.0% (95% CI 90.9–100) and a specificity of 22.4% (95% CI 10.2–32.7) in detecting patients with unfavorable outcome. The threshold to detect a patient with unfavorable outcome was an HCTS sum of >1 (Table 3). In terms of discriminating patients with complete recovery and incomplete recovery, the HCTS did not reach clinically relevant sensitivity and specificity (Table 4).
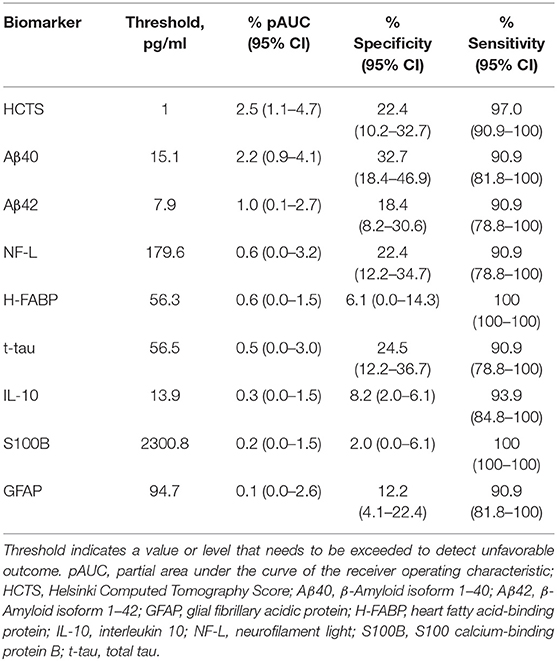
Table 3. Individual abilities of the Helsinki Computed Tomography Score and eight different biomarkers in discriminating patients with favorable and unfavorable outcomes sorted by partial area under the curve of the receiver operating characteristic (all, n = 82; favorable outcome, n = 49; unfavorable outcome, n = 33).
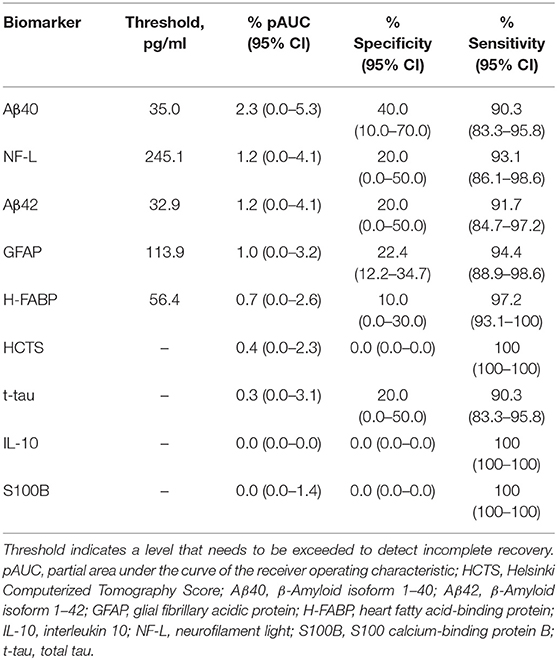
Table 4. Individual abilities of the Helsinki Computerized Tomography Score and eight different biomarkers in discriminating patients with complete and incomplete recovery sorted by partial area under the curve of the receiver operating characteristic (all, n = 82; complete recovery, n = 10; incomplete recovery, n = 72).
Biomarkers Alone in Outcome Prediction
In discriminating patients with favorable and unfavorable outcomes, the three best individually performing biomarkers in outcome prediction were Aβ40, Aβ42, and NF-L (Table 3). Patients with unfavorable outcome had significantly higher levels of Aβ42 (unfavorable outcome: median 21.9 pg/ml, IQR 40.6 pg/ml; favorable outcome: median 16.9 pg/mL, IQR 16.4 pg/ml; p = 0.040) and NF-L (unfavorable outcome: median 99.9 pg/ml, IQR 120.0 pg/ml; favorable outcome: median 36.9 pg/ml, IQR 57.6 pg/ml; p = 0.001) compared with those with favorable outcome, whereas levels of Aβ40 were not different between the groups (p = 0.490).
In terms of discriminating patients with complete and incomplete recovery, the three best individually performing biomarkers in outcome prediction were Aβ40, NF-L, and Aβ42 (Table 4).
Patients with incomplete recovery had significantly higher levels of NF-L (incomplete recovery: median 66.9 pg/ml, IQR 87.0 pg/ml; complete recovery: median 9.2 pg/ml, IQR 13.5 pg/ml; p = 0.001) compared with those with complete recovery, whereas levels of Aβ40 and Aβ42 were not different between the groups (p = 0.436 and p = 0.257, respectively).
Biomarkers Improve the Outcome Predictive Performance of the Helsinki Computed Tomography Scale
We studied if combinations of biomarkers could improve the predictive performance of the HCTS in distinguishing patients with unfavorable outcome from patients with a favorable outcome. The best panel consisting of HCTS and a single biomarker included IL-10, and it yielded a pAUC of 3.0% (95% CI 1.3–6.0) with a sensitivity of 90.9% (95% CI 78.8–100) and a specificity of 55.1% (95% CI 40.8–69.4). In this panel, the threshold for the HCTS was >4 and for IL-10 <0.48 mg/ml (Table 5A, Figure 2). A corresponding analysis was conducted with HCTS and a combination of two biomarkers. The optimal panel included IL-10 and Aβ40, and it reached a pAUC of 3.4% (95% CI 1.7–6.2) with a sensitivity of 90.9% (95% CI 81.8–100) and a specificity of 59.2% (95% CI 40.8–69.4). In this panel, the threshold for the HCTS was >4, for Aβ40 >7.38 pg/ml, and for IL-10 <0.48 pg/ml (Table 5B, Figure 3).
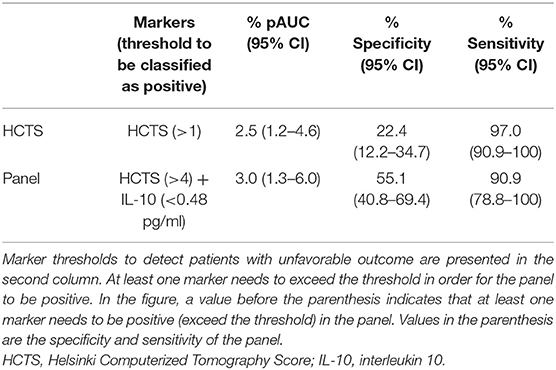
Table 5A. Ability of the Helsinki Computed Tomography Score alone and a panel consisting of the Helsinki Computed Tomography and interleukin 10 in distinguishing patients with unfavorable outcome from patients with favorable outcome.
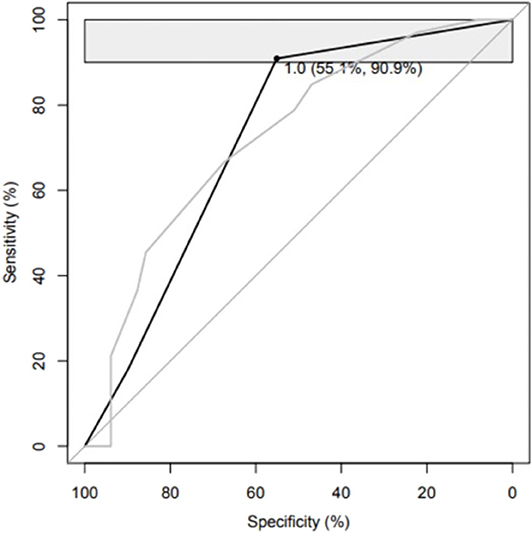
Figure 2. Please see Table 5A.
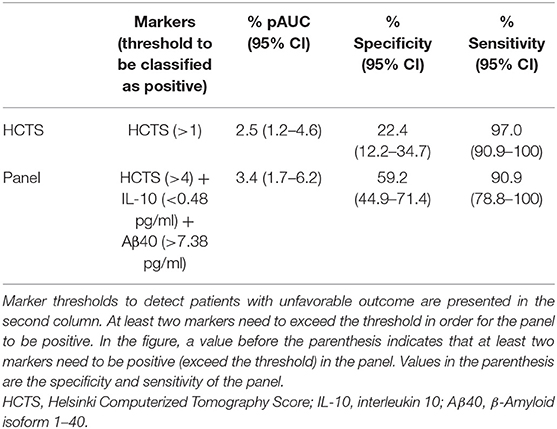
Table 5B. Abilities of the Helsinki Computed Tomography Score alone and a panel consisting of the Helsinki Computed Tomography, interleukin 10, and β-Amyloid isoform 1–40 in distinguishing patients with unfavorable outcome from patients with favorable outcome.
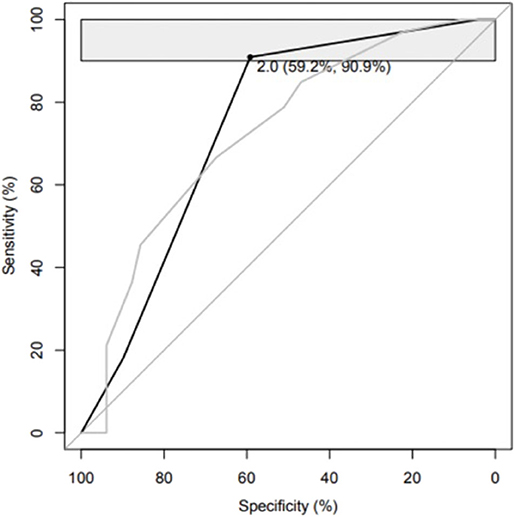
Figure 3. Please see Table 5B.
Panel analysis for outcome prediction of incomplete recovery was not conducted because the HCTS did not have a clinically meaningful outcome prediction performance in this setting (Table 4).
Biomarkers in Outcome Prediction in Patients With Normal Head Computed Tomography Findings
To further elucidate the outcome prediction performance of the biomarkers, we also studied patients with CT-negative TBIs (comparison study cohort). The three best individually performing biomarkers in discriminating patients with a favorable outcome and an unfavorable outcome were Aβ40, GFAP, and NF-L (Table 6). The three best individually performing biomarkers in discriminating patients with complete and incomplete recovery were NF-L, Aβ40, and IL-10 (Table 7).
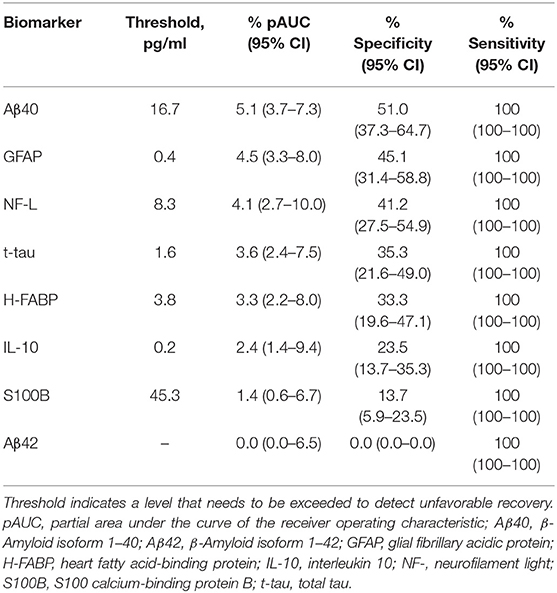
Table 6. Individual abilities of eight different biomarkers in discriminating patients with favorable and unfavorable outcomes without head imaging abnormalities sorted by partial area under the curve of the receiver operating characteristic (all, n = 55; favorable outcome, n = 51; unfavorable outcome, n = 4).
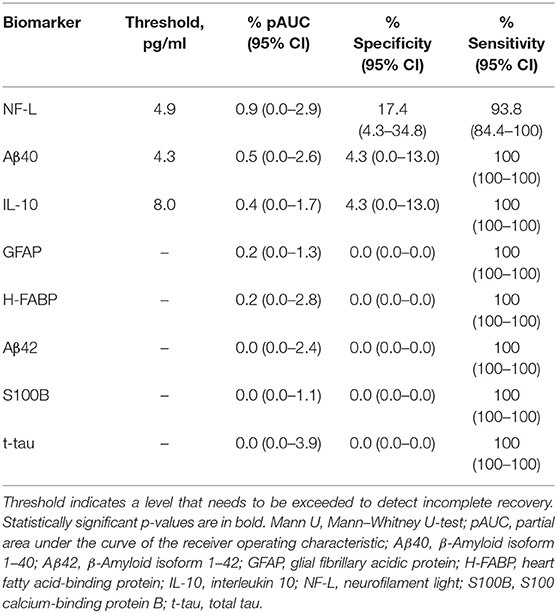
Table 7. Individual abilities of the eight different biomarkers in discriminating patients with complete and incomplete recovery without head imaging abnormalities sorted by partial area under the curve of the receiver operating characteristic (all, n = 55; complete recovery, n = 32; incomplete recovery, n = 23).
Discussion
This prospective, observational study of patients with acute TBI investigated whether admission levels of eight different plasma protein biomarkers obtained from CT-positive patients can improve the outcome prediction ability of the HCTS without clinical covariates in a well-characterized cohort. We also studied the prognostic ability of the biomarkers without the HCTS in discriminating complete recovery and incomplete recovery in CT-positive patients and CT-negative patients. The main finding of the study is that the admission levels of IL-10 and Aβ40 improve the ability of the HCTS in discriminating patients with unfavorable and favorable outcomes with increasing the specificity by 27% points (from 22 to 59%) while maintaining a sensitivity above 90%. In other words, when using only the HCTS, 11 patients out of the 49 with favorable outcomes were correctly detected, and when using the HCTS together with biomarkers, 29 patients with favorable outcomes were correctly detected. When studied alone, the HCTS had the highest pAUCs of the tested covariates, followed by Aβ40 and Aβ42. The individual specificities of the HCTS and biomarkers remained low (2–33%) in isolation, but the optimal combination panel yielded a specificity of 59% when the sensitivity was set above 90%.
Most modern TBI biomarker studies have investigated the individual prediction abilities of different molecules. The studies show that single biomarkers tend to have low specificities when sensitivity is set above 90%. Therefore, individual blood-based biomarkers may not be applicable for clinical practice as stand-alone tools (19, 28, 31), which is expected due to the complexity of TBI. Combining several biomarkers or combining biomarkers with clinical characteristics have been suggested to improve diagnostic and predictive abilities (31, 32). Thus, biomarkers may provide additional value in outcome prediction of TBI when used in combination with predictive neuroimaging scores. However, studies on blood-based biomarkers complementing head imaging scores are scarce. The results presented here suggest that protein biomarkers IL-10 and Aβ40 provide incremental value in outcome prediction when used in combination with the HCTS. Intriguingly, in both panels in the panel analysis, the thresholds for IL-10 (many patients with lower GCS scores—indicating a more severe TBI—have relatively low levels of IL-10) and Aβ40 are considerably lower and for the HCTS higher compared to analyses where the parameters are studied in isolation. In line with this finding, it has been previously reported that most of the clinical studies have not identified a correlation between blood IL-10 levels and GCS scores (33). These results suggest that the best diagnostic value in discriminating patient outcomes after TBI is achieved by utilizing biomarkers in combination, which echoes our other recent findings in the acute diagnostics of TBI (19) and outcome prediction (34). A possible explanation for the higher HCTS threshold in the panel analysis is that biomarkers provide additional accuracy to the predictive power of the HCTS permitting patients with a favorable outcome to have some traumatic intracranial findings. We have recently reported IL-10 thresholds of 0.38 and 0.44 pg/ml depending on other markers included in the panels for predicting unfavorable outcomes. Correspondingly, when the HCTS is included in the panels, IL-10 thresholds need to be lower to capture patients with low IL-10 levels, low GCS scores, and unfavorable outcomes.
To better illuminate the predictive power of biomarkers in patients with CT-positive findings, we also investigated their abilities in distinguishing between patients with complete and incomplete recovery. The best-performing biomarkers were the same as in discrimination of patients with favorable and unfavorable outcomes, but the predictive performance of the HCTS was low. The HCTS was designed to predict functional outcome according to the GOS (13). Thus, unsurprisingly, the HCTS does not provide enough information to clinically meaningfully discriminate between patients with complete and incomplete recovery.
We also conducted a comparative analysis of CT-negative patients. In discriminating CT-negative patients with favorable and unfavorable outcomes, the best performing biomarkers were Aβ40, GFAP, and NF-L. However, these results should be interpreted with caution due to the small number of patients with unfavorable outcomes among CT-negative patients. In predicting a full recovery in CT-negative patients, only NF-L, Aβ40, and IL-10 showed a modest predictive power, whereas the other proteins did not have any prognostic value.
We utilized the pAUC instead of the conventional AUC test. The AUC indexes diagnostic performance summarizing the entire ROC curve, including regions that might not be relevant to a certain clinical application (e.g., regions with low levels of sensitivity or specificity). To overcome this disadvantage, we used the pAUC that summarizes a portion of the ROC curve over the prespecified range of interest (35)—in the context of the current study, sensitivity >90%. Thus, the pAUC yields more information regarding the predictive information provided by the HCTS and biomarkers than, for example, overall median value comparison using the Mann–Whitney U-test. This explains the finding that median levels of Aβ40 were not different between the favorable and unfavorable outcome groups, but the biomarkers still yield a good pAUC and specificity when studied in panels within a fixed sensitivity area. This also applies to the finding why Aβ40 and Aβ42 are not different between the complete and incomplete recovery groups.
Clinical features are known to contribute to explaining outcome variance (3). However, given the primary purpose of the current analysis was to explore the prognostic and diagnostic performance of the biomarker studied as an adjunct to CT imaging, they were not integrated into the overall prognostic models. In the main study cohort, there were no differences in sex distribution, pupil reactivity, events of hypoxia, events of hypotension, hypoglycemia, anemia, and the proportion of hospital admissions. Extracranial injuries may affect the levels of GFAP, H-FABP, IL-10, NF-L, S100B, and t-tau (18, 19, 26), but in terms of patient group comparisons in the main study cohort, this effect can be considered negligible because the proportion of patients with concomitant extracranial injuries was similar. Moreover, we have previously demonstrated that the levels of IL-10 and Aβ40—the proteins included in the outcome prediction panels in the current study—are not affected by the presence of extracranial injuries in patients with TBIs of all severities and CT-positive findings (19). The differences in the HCTS features reflect more serious lesion load in patients with unfavorable outcomes. The patients were also older in the unfavorable outcome group.
We studied several biomarkers that are known to be correlated with TBI prognosis, but we also selected biomarkers less investigated in the literature due to their recent promising results in acute TBI diagnostics (19, 36, 37). Astroglial marker S100B is the most studied TBI biomarker to date (38–40). Acutely (12–36 h) measured blood S100B levels are associated with outcome (41). An earlier study reported that levels of S100B and GFAP in combination are correlated with unfavorable outcome in patients with severe TBI (42). S100B is expressed in many bodily tissues outside the central nervous system, and its levels increase, e.g., after extracranial injuries (43) and physical exercise (44), which may complicate interpretation of the results if the patient has significant extracranial injuries and if the levels are assessed in polytrauma patients immediately after injury (45, 46). After S100B, the astroglial marker GFAP, which is expressed in the cytoskeleton of glial cells (47), is probably the most studied TBI biomarker. Many studies have shown a significant association between increased GFAP levels and unfavorable outcome (16, 17, 42, 48). NF-L and tau have been mostly studied in the subacute after TBI. NF-L is abundantly expressed in the long myelinated subcortical axons (49). NF-L has been reported to be significantly correlated with late outcome after TBI by three studies (17, 50, 51). Tau is a microtubule-associated protein expressed in the axonal cytoskeleton (52, 53). Significant increases in tau levels have been reported in concussed professional ice hockey players (54), and tau levels have been correlated with outcome after severe TBI (55). Aβ40 and Aβ42 (52, 56) are associated with amyloidogenic amyloid precursor protein metabolism and have been suggested as potential biomarkers of axonal damage in TBI (57). However, it has been reported that especially in the case of mild TBI, Aβ40 and Aβ42 do not exhibit prognostic value (58–60). Cytosolic trafficking protein H-FABP and anti-inflammatory mediator protein IL-10 are related to traumatic intracranial findings (19, 36, 37). The outcome prediction ability of IL-10 after TBI has been controversial, although it has shown some potential in predicting mortality (33). However, a recent study utilizing partially same cohort as in this study demonstrated that both IL-10 and H-FABP improved outcome prediction abilities of panels consisting of more studied biomarkers and clinical covariates in both mild TBI and TBIs of all severities (34).
Previous studies suggest that biomarkers may perform in the outcome prediction of TBI better in combination than in isolation (50, 61, 62). Czeiter et al. (63) have reported that GFAP has an added value when combined with a modified IMPACT model consisting of age, GCS motor score, and pupil status. Both Gradisek and Vos have reported that GFAP and S100B improve the performance of clinical parameters in outcome prediction (61, 62). These findings are consistent with a recent study by Thelin et al. (18), where they reported that GFAP and NF-L enhanced the predictive ability of the IMPACT model combined with the Stockholm CT findings. With regard to current results, there was no benefit to combining HCTS, GFAP, and S100B with HCTS.
Currently, the most widely used CT scores are the Marshall CT classification and Rotterdam CT score. The Marshall CT classification grades injuries—in non-ordinal fashion—as different levels of diffuse injuries or mass lesions in case hematoma volume exceeds 25 cm3 (8). Although the Marshall CT classification was not designed to be used as an outcome prediction tool, the Rotterdam CT score was developed based on the Marshall CT classification features adding traumatic subarachnoid and intraventricular hemorrhage (12). The most recent additions to the outcome prediction-weighted CT classifications are the HCTS and Stockholm CT score. The Stockholm CT score includes a separate traumatic subarachnoid hemorrhage score and a tally comprising midline shift as a continuous variable, epidural hematoma, dual-sided subdural hematoma, diffuse axonal injury, and the traumatic subarachnoid hemorrhage score (14). The HCTS focuses on the types of intracranial gross pathologies (13). It has been reported that the Stockholm CT score and HCTS outperform the older scores in outcome prediction (15). We chose the HCTS because its implementation is reliable, it is widely validated, and it takes into account different types of intracranial injuries that may be associated with differently elevated biomarker levels.
The strengths of this study are the use of several biomarkers of different cellular origins in the same cohort, the use of sensitive advanced analytics, and a prospectively recruited well-characterized study population. Although a minority of the screened patients were included in the current analyses, the patient selection did not introduce a significant bias, as the only difference was sex distribution.
The main limitation of the study is the variable delays between injuries and blood sampling. This may have affected biomarkers with a short half-life in blood, such as H-FABP, IL-10, and S100B. Furthermore, for NF-L, the sampling time-points might have been too close to the injury (64). Earlier mean sampling time would probably have resulted in different sensitivities and specificities for the panels. In addition, we could not use the levels of UCH-L1 from the Human Neurology 4-Plex assay in the current analyses because the coefficients of variation were at a level where the results are not reliable. We also used the National Institute for Health and Care Excellence criteria for head CT imaging, and the results might not be applicable for other head CT rules due to differences in case selection. The fairly small study cohort also increases the risk of over-fitting bias, and therefore, the results should be verified and validated in a larger cohort. Moreover, the assays utilized in this study are developed for research purposes, limiting the generalizability of the results. However, this limitation also concerns most of the current TBI biomarker studies because there is a paucity of commercialized assays for clinical TBI diagnostics. The possibility of some degree of selection bias should be noted, as only a third of the patients treated at the recruiting hospital were eventually enrolled in the study. The current cohort is somewhat less severely injured than those in which the HCTS has been earlier validated. The HCTS was originally designed using a neurocritical care cohort. Finally, these results specifically speak to the additional ability of the biomarkers studied to improve on the ability of the Helsinki CT Score to explain outcome variance. Integration into well-established TBI outcome prediction schemes such as IMPACT (9) and Corticosteroid Randomization After Significant Head injury (10) will require further study. The authors acknowledge the limitations of the GOSE in detecting subtle functional and cognitive deficits, especially in patients with higher GOSE scores. However, the main aim of the study was slightly grosser in terms of prognostication, as we studied whether different protein biomarkers can improve the outcome prediction performance of the HCTS in discriminating patients with favorable and unfavorable outcomes. The variability in the time interval between injury and GOSE assessment may have affected the results.
Conclusion
Admission levels of IL-10 and Aβ40 improve the prognostic performance of the HCTS in discriminating patients with unfavorable and favorable outcomes. When studied alone, HCTS had the highest pAUCs of the tested covariates, followed by Aβ40 and Aβ42. Although the individual specificities of the HCTS and biomarkers remained low (2–33%) in isolation, the optimal combination panel yielded a specificity of 59% when the sensitivity was set above 90%. The current results suggest that outcome prediction ability of the HCTS could be significantly enhanced with rapid point-of-care measurement of plasma levels of IL-10 and Aβ40. This may allow the identification of initially neurologically stable patients who, however, are developing severe secondary brain injury that significantly impairs their recovery.
Data Availability Statement
The datasets generated for this study are available on request to the corresponding author.
Ethics Statement
The studies involving human participants were reviewed and approved by the ethical review board of the Hospital District of Southwest Finland. The patients/participants provided their written informed consent to participate in this study.
Author Contributions
JP, RT, RR, and TL conceived and designed the current study. JP, RT, AK, H-RM, JT, and OT recruited the patients. JP, RT, AK, MM, IH, H-RM, JT, PK, and OT collected and curated the data. LA, LL, J-CS, and JP conducted the statistical analyses. JG, HZ, KB, and J-CS supervised the biomarker analyses. MG, PH, DM, VN, and OT supervised the TBIcare study. JP drafted the manuscript with critical contributions from RT, RR, and TL. JP takes the responsibility for the paper as a whole. All authors substantially contributed to the revision of the manuscript.
Funding
This work was partially funded by the European Commission under the 7th Framework Programme (FP7-270259-TBIcare), Academy of Finland—Grant # 17379, Government's Special Financial Transfer tied to academic research in Health Sciences (Finland) (JP), the Maire Taponen foundation (JP), the Integra EANS Research Grant (IH), the Finnish Medical Foundation (IH), University of Turku Graduate School funding (MM), the Royal College of Surgeons (PH), NIHR Research Professorship and the NIHR Cambridge BRC (PH), NIHR Research UK (through a Senior Investigator Award and the Cambridge Biomedical Research Centre) (DM), Academy of Medical Sciences/The Health Foundation Clinician Scientist Fellowship (VN), Swedish Research Council (#2017-00915) (KB), the Alzheimer Drug Discovery Foundation (ADDF) (KB), USA (#RDAPB-201809-2016615) (KB), the Swedish Alzheimer Foundation (#AF-742881) (KB), Hjärnfonden, Sweden (#FO2017-0243) (KB), the Swedish state under the agreement between the Swedish government and the County Councils (KB), the ALF-Agreement (#ALFGBG-715986) (KB), and European Union Joint Program for Neurodegenerative Disorders (JPND2019-466-236) (KB), and Wallenberg Academy Fellowship and grants from the Swedish and European Research Councils (HZ).
Conflict of Interest
JP has received a speaker's fee from the Finnish Medical Association. KB has served as a consultant or at advisory boards for Abcam, Axon, Biogen, Lilly, MagQu, Novartis, and Roche Diagnostics and is a co-founder of Brain Biomarker Solutions in Gothenburg AB, a GU Venture-based platform company at the University of Gothenburg.
The remaining authors declare that the research was conducted in the absence of any commercial or financial relationships that could be construed as a potential conflict of interest.
The handling editor is currently organizing a Research Topic with some of the authors OT and J-CS.
Supplementary Material
The Supplementary Material for this article can be found online at: https://www.frontiersin.org/articles/10.3389/fneur.2020.549527/full#supplementary-material
References
1. Werner C, Engelhard K. Pathophysiology of traumatic brain injury Biomechanical and neuropathological classification of injury. Br J Anaesth. (2007) 99:4–9. doi: 10.1093/bja/aem131
2. WHO. Neurological Disorders: Public Health Challenges. (2006). Available online at: http://www.who.int/mental_health/neurology/neurological_disorders_report_web.pdf (accessed October 14, 2020).
3. Lingsma HF, Roozenbeek B, Steyerberg EW, Murray GD, Maas AI. Early prognosis in traumatic brain injury: from prophecies to predictions. Lancet Neurol. (2010) 9:543–54. doi: 10.1016/S1474-4422(10)70065-X
4. Wang KK, Yang Z, Zhu T, Shi Y, Rubenstein R, Tyndall JA, et al. An update on diagnostic and prognostic biomarkers for traumatic brain injury. Expert Rev Mol Diagn. (2018) 18:165–80. doi: 10.1080/14737159.2018.1428089
5. Teasdale G, Jennett B. Assessment of coma and impaired consciousness. A practical scale. Lancet. (1974) 2:81–4. doi: 10.1016/S0140-6736(74)91639-0
6. Steyerberg EW, Bleeker SE, Moll HA, Grobbee DE, Moons KGM. Internal and external validation of predictive models: a simulation study of bias and precision in small samples. J Clin Epidemiol. (2003) 56:441–7. doi: 10.1016/S0895-4356(03)00047-7
7. Steyerberg EW, Schemper M, Harrell FE. Logistic regression modeling and the number of events per variable: selection bias dominates. J Clin Epidemiol. (2011) 64:1464–5. doi: 10.1016/j.jclinepi.2011.06.016
8. Marshall LF, Marshall SB, Klauber MR, van Berkum Clark M, Eisenberg HM, Jane JA, et al. A new classification of head injury based on computerized tomography. J Neurosurg. (1991) 75:S20. doi: 10.3171/sup.1991.75.1s.0s14
9. Steyerberg EW, Mushkudiani N, Perel P, Butcher I, Lu J, McHugh GS, et al. Predicting outcome after traumatic brain injury: development and international validation of prognostic scores based on admission characteristics. PLoS Med. (2008) 5:e165. doi: 10.1371/journal.pmed.0050165
10. Collaborators MRCCT, Perel P, Arango M, Clayton T, Edwards P, Komolafe E, et al. Predicting outcome after traumatic brain injury: practical prognostic models based on large cohort of international patients. BMJ. (2008) 336:425–9. doi: 10.1136/bmj.39461.643438.25
11. Roozenbeek B, Lingsma HF, Lecky FE, Lu J, Weir J, Butcher I, et al. Prediction of outcome after moderate and severe traumatic brain injury: external validation of the international mission on prognosis and analysis of clinical trials (IMPACT) and corticoid randomisation after significant head injury (CRASH) prognostic mod. Crit Care Med. (2012) 40:1609–17. doi: 10.1097/CCM.0b013e31824519ce
12. Maas AI, Hukkelhoven CW, Marshall LF, Steyerberg EW. Prediction of outcome in traumatic brain injury with computed tomographic characteristics: a comparison between the computed tomographic classification and combinations of computed tomographic predictors. Neurosurgery. (2005) 57:1173–82. doi: 10.1227/01.NEU.0000186013.63046.6B
13. Raj R, Siironen J, Skrifvars MB, Hernesniemi J, Kivisaari R. Predicting outcome in traumatic brain injury: development of a novel computerized tomography classification system (Helsinki computerized tomography score). Neurosurgery. (2014) 75:632–46. doi: 10.1227/NEU.0000000000000533
14. Nelson DW, Nyström H, MacCallum RM, Thornquist B, Lilja A, Bellander BM, et al. Extended analysis of early computed tomography scans of traumatic brain injured patients and relations to outcome. J Neurotrauma. (2010) 27:51–64. doi: 10.1089/neu.2009.0986
15. Thelin EP, Nelson DW, Vehviläinen J, Nystrom H, Kivisaari R, Siironen J, et al. Evaluation of novel computerized tomography scoring systems in human traumatic brain injury: an observational, multicenter study. PLoS Med. (2017) 14:e1002368. doi: 10.1371/journal.pmed.1002368
16. Takala RSK, Posti JP, Runtti H, Newcombe VF, Outtrim J, Katila AJ, et al. Glial fibrillary acidic protein and ubiquitin C-terminal hydrolase-L1 as outcome predictors in traumatic brain injury. World Neurosurg. (2016) 87:8–20. doi: 10.1016/j.wneu.2015.10.066
17. Hossain I, Mohammadian M, Takala RSK, Tenovuo O, Lagerstedt L, Ala-Seppala H, et al. Early levels of glial fibrillary acidic protein and neurofilament light protein in predicting the outcome of mild traumatic brain injury. J Neurotrauma. (2019) 36:1551–60. doi: 10.1089/neu.2018.5952
18. Thelin E, Al Nimer F, Frostell A, Zetterberg H, Blennow K, Nystrom H, et al. A serum protein biomarker panel improves outcome prediction in human traumatic brain injury. J Neurotrauma. (2019) 36:2850–62. doi: 10.1089/neu.2019.6375
19. Posti JP, Takala RSK, Lagerstedt L, Dickens AM, Hossain I, Mohammadian M, et al. Correlation of blood biomarkers and biomarker panels with traumatic findings on computed tomography after traumatic brain injury. J Neurotrauma. (2019) 36:2178–89. doi: 10.1089/neu.2018.6254
20. Hale AT, Stonko DP, Brown A, Lim J, Voce DJ, Gannon SR, et al. Machine-learning analysis outperforms conventional statistical models and CT classification systems in predicting 6-month outcomes in pediatric patients sustaining traumatic brain injury. Neurosurg Focus. (2018) 45:E2. doi: 10.3171/2018.8.FOCUS17773
21. Yao S, Song J, Li S, Cao C, Fang L, Wang C, et al. Helsinki computed tomography scoring system can independently predict long-term outcome in traumatic brain injury. World Neurosurg. (2017) 101:528–33. doi: 10.1016/j.wneu.2017.02.072
22. Pargaonkar R, Kumar V, Menon G, Hegde A. Comparative study of computed tomographic scoring systems and predictors of early mortality in severe traumatic brain injury. J Clin Neurosci. (2019) 66:100–6. doi: 10.1016/j.jocn.2019.05.011
23. Lindfors M, Lindblad C, Nelson DW, Bellander BM, Siironen J, Raj R, et al. Prognostic performance of computerized tomography scoring systems in civilian penetrating traumatic brain injury: an observational study. Acta Neurochir. (2019) 161:2467–78. doi: 10.1007/s00701-019-04074-1
24. Carney N, Totten AM, O'Reilly C, Ullman JS, Hawryluk GWJ, Bell MJ, et al. Guidelines for the management of severe traumatic brain injury, fourth edition. Neurosurgery. (2017) 80:6–15. doi: 10.1227/NEU.0000000000001432
25. National Institute for Health and Care Excellence. Head Injury: Assessment and Early Management | Guidance and Guidelines. London: NICE Guidelines (2019).
26. Posti JP, Takala RSK, Runtti H, Newcombe VF, Outtrim J, Katila AJ, et al. The levels of glial fibrillary acidic protein and ubiquitin C-terminal hydrolase-L1 during the first week after a traumatic brain injury: correlations with clinical and imaging findings. Neurosurgery. (2016) 79:456–64. doi: 10.1227/NEU.0000000000001226
27. Baker SP, O'Neill B, Haddon W Jr, Long WB. The injury severity score: a method for describing patients with multiple injuries and evaluating emergency care. J Trauma. (1974) 14:187–96. doi: 10.1097/00005373-197403000-00001
28. Robin X, Turck N, Hainard A, Tiberti N, Lisacek F, Sanchez JC, et al. PanelomiX: a threshold-based algorithm to create panels of biomarkers. Transl Proteomics. (2013) 1:57–64. doi: 10.1016/j.trprot.2013.04.003
29. Cohen J. A coefficient of agreement for nominal scales. Educ Psychol Meas. (1960) 20:37–46. doi: 10.1177/001316446002000104
30. Koo TK, Li MY. A guideline of selecting and reporting intraclass correlation coefficients for reliability research. J Chiropr Med. (2016) 15:155–63. doi: 10.1016/j.jcm.2016.02.012
31. Robin X, Turck N, Hainard A, Lisacek F, Sanchez JC, Müller M. Bioinformatics for protein biomarker panel classification: what is needed to bring biomarker panels into in vitro diagnostics? Expert Rev Proteomics. (2009) 6:675–89. doi: 10.1586/epr.09.83
32. Azurmendi L, Degos V, Tiberti N, Kapandji N, Sanchez P, Sarrafzadeh A, et al. Measuring serum amyloid a for infection prediction in aneurysmal subarachnoid hemorrhage. J Proteome Res. (2015) 14:3948–56. doi: 10.1021/acs.jproteome.5b00391
33. Garcia JM, Stillings SA, Leclerc JL, Phillips H, Edwards NJ, Robicsek SA, et al. Role of interleukin-10 in acute brain injuries. Front Neurol. (2017) 8:244. doi: 10.3389/fneur.2017.00244
34. Lagerstedt L, Azurmendi L, Tenovuo O, Katila AJ, Takala RSK, Blennow K, et al. Interleukin 10 and heart fatty acid-binding protein as early outcome predictors in patients with traumatic brain injury. Front Neurol. (2020) 11:376 doi: 10.3389/fneur.2020.00376
35. Ma H, Bandos AI, Rockette HE, Gur D. On use of partial area under the ROC curve for evaluation of diagnostic performance. Stat Med. (2013) 32:3449–58. doi: 10.1002/sim.5777
36. Lagerstedt L, Egea Guerrero J, Bustamante A, Montaner J, Rodriguez-Rodriguez A, Rahal AE, et al. H-FABP: a new biomarker to differentiate between CT-positive and CT-negative patients with mild traumatic brain injury. PLoS ONE. (2017) 12:e0175572. doi: 10.1371/journal.pone.0175572
37. Lagerstedt L, Egea-Guerrero JJ, Rodriguez-Rodriguez A, Bustamante A, Montaner J, Rahal AE, et al. Early measurement of interleukin-10 predicts the absence of CT scan lesions in mild traumatic brain injury. PLoS ONE. (2018) 13:e0193278. doi: 10.1371/journal.pone.0193278
38. Thelin E, Johannesson L, Nelson D, Bellander B-M. S100B is an important outcome predictor in traumatic brain injury. J Neurotrauma. (2013) 30:519–28. doi: 10.1089/neu.2012.2553
39. Schulte S, Podlog LW, Hamson-Utley JJ, Strathmann FG, Strüder HK. A systematic review of the biomarker S100B: implications for sport-related concussion management. J Athl Train. (2014) 49:830–50. doi: 10.4085/1062-6050-49.3.33
40. Thelin EP, Nelson DW, Bellander BM. A review of the clinical utility of serum S100B protein levels in the assessment of traumatic brain injury. Acta Neurochir. (2017) 159:209–25. doi: 10.1007/s00701-016-3046-3
41. Thelin E, Nelson D, Bellander B-M. Secondary peaks of S100B in serum relate to subsequent radiological pathology in traumatic brain injury. Neurocrit Care. (2014) 20:217–29. doi: 10.1007/s12028-013-9916-0
42. Vos PE, Jacobs B, Andriessen TMJC, Lamers KJB, Borm GF, Beems T, et al. GFAP and S100B are biomarkers of traumatic brain injury: an observational cohort study. Neurology. (2010) 75:1786–93. doi: 10.1212/WNL.0b013e3181fd62d2
43. Ohrt Nissen S, Friis Hansen L, Dahl B, Stensballe J, Romner B, Rasmussen L. How does extracerebral trauma affect the clinical value of S100B measurements? Emerg Med J. (2011) 28:941–4. doi: 10.1136/emj.2010.091363
44. Hasselblatt M, Mooren FC, von Ahsen N, Keyvani K, Fromme A, Schwarze-Eicker K, et al. Serum S100beta increases in marathon runners reflect extracranial release rather than glial damage. Neurology. (2004) 62:1634–36. doi: 10.1212/01.WNL.0000123092.97047.B1
45. Pelinka LE, Kroepfl A, Schmidhammer R, Krenn M, Buchinger W, Redl H, et al. Glial fibrillary acidic protein in serum after traumatic brain injury and multiple trauma. J Trauma. (2004) 57:1006–12. doi: 10.1097/01.TA.0000108998.48026.C3
46. Thelin E, Jeppsson E, Frostell A, Svensson M, Mondello S, Bellander B, et al. Utility of neuron-specific enolase in traumatic brain injury; relations to S100B levels, outcome, and extracranial injury severity. Crit Care. (2016) 20:285. doi: 10.1186/s13054-016-1450-y
47. Missler U, Wiesmann M, Wittmann G, Magerkurth O, Hagenstrom H. Measurement of glial fibrillary acidic protein in human blood: analytical method and preliminary clinical results. Clin Chem. (1999) 45:138–41. doi: 10.1093/clinchem/45.1.138
48. Diaz-Arrastia R, Wang KK, Papa L, Sorani MD, Yue JK, Puccio AM, et al. Acute biomarkers of traumatic brain injury: relationship between plasma levels of ubiquitin C-terminal hydrolase-L1 and glial fibrillary acidic protein. J Neurotrauma. (2014) 31:19–25. doi: 10.1089/neu.2013.3040
49. Ljungqvist J, Zetterberg H, Mitsis M, Blennow K, Skoglund T. Serum neurofilament light protein as a marker for diffuse axonal injury: results from a case series study. J Neurotrauma. (2017) 34:1124–7. doi: 10.1089/neu.2016.4496
50. Al Nimer F, Thelin E, Nyström H, Dring AM, Svenningsson A, Piehl F, et al. Comparative assessment of the prognostic value of biomarkers in traumatic brain injury reveals an independent role for serum levels of neurofilament light. PLoS ONE. (2015) 10:e0132177. doi: 10.1371/journal.pone.0132177
51. Shahim P, Zetterberg H, Tegner Y, Blennow K. Serum neurofilament light as a biomarker for mild traumatic brain injury in contact sports. Neurology. (2017) 88:1788–94. doi: 10.1212/WNL.0000000000003912
52. Bogoslovsky T, Wilson D, Chen Y, Hanlon D, Gill J, Jeromin A, et al. Increases of plasma levels of glial fibrillary acidic protein, tau, and amyloid beta up to 90 days after traumatic brain injury. J Neurotrauma. (2017) 34:66–73. doi: 10.1089/neu.2015.4333
53. Rubenstein R, Chang B, Yue J, Chiu A, Winkler EA, Puccio AM, et al. Comparing plasma phospho tau, total tau, and phospho tau-total tau ratio as acute and chronic traumatic brain injury biomarkers. JAMA Neurol. (2017) 74:1063–72. doi: 10.1001/jamaneurol.2017.0655
54. Shahim P, Tegner Y, Wilson DH, Randall J, Skillback T, Pazooki D, et al. Blood biomarkers for brain injury in concussed professional ice hockey players. JAMA Neurol. (2014) 71:684–92. doi: 10.1001/jamaneurol.2014.367
55. Liliang PC, Liang CL, Weng HC, Lu K, Wang KW, Chen HJ, et al. Tau proteins in serum predict outcome after severe traumatic brain injury. J Surg Res. (2010) 160:302–7. doi: 10.1016/j.jss.2008.12.022
56. Bazarian JJ, Blyth BJ, He H, Mookerjee S, Jones C, Kiechie K, et al. Classification accuracy of serum Apo A-I and S100B for the diagnosis of mild traumatic brain injury and prediction of abnormal initial head computed tomography scan. J Neurotrauma. (2013) 30:1747–54. doi: 10.1089/neu.2013.2853
57. Johnson VE, Stewart W, Smith DH. Axonal pathology in traumatic brain injury. Exp Neurol. (2013) 246:35–43. doi: 10.1016/j.expneurol.2012.01.013
58. Zetterberg H, Smith DH, Blennow K. Biomarkers of mild traumatic brain injury in cerebrospinal fluid and blood. Nat Rev. (2013) 9:201–10. doi: 10.1038/nrneurol.2013.9
59. Shahim P, Tegner Y, Gustafsson B, Gren M, Arlig J, Olsson M, et al. Neurochemical aftermath of repetitive mild traumatic brain injury. JAMA Neurol. (2016) 73:1308–15. doi: 10.1001/jamaneurol.2016.2038
60. Tsitsopoulos PP, Marklund N. Amyloid-ß peptides and tau protein as biomarkers in cerebrospinal and interstitial fluid following traumatic brain injury: a review of experimental and clinical studies. Front Neurol. (2013) 4:79. doi: 10.3389/fneur.2013.00079
61. Vos PE, Lamers KJ, Hendriks JCM, van Haaren M, Beems T, Zimmerman C, et al. Glial and neuronal proteins in serum predict outcome after severe traumatic brain injury. Neurology. (2004) 62:1303–10. doi: 10.1212/01.WNL.0000120550.00643.DC
62. Gradisek P, Osredkar J, Korsic M, Kremzar B. Multiple indicators model of long-term mortality in traumatic brain injury. Brain Inj. (2012) 26:1472–81. doi: 10.3109/02699052.2012.694567
63. Czeiter E, Mondello S, Kovacs N, Sandor J, Gabrielli A, Schmid K, et al. Brain injury biomarkers may improve the predictive power of the IMPACT outcome calculator. J Neurotrauma. (2012) 29:1770–8. doi: 10.1089/neu.2011.2127
Keywords: traumatic brain injury, biomarkers, outcome prediction, Helsinki CT score, interleukin 10 (IL10), beta amyloid 1–40, panel analysis
Citation: Posti JP, Takala RSK, Raj R, Luoto TM, Azurmendi L, Lagerstedt L, Mohammadian M, Hossain I, Gill J, Frantzén J, van Gils M, Hutchinson PJ, Katila AJ, Koivikko P, Maanpää H-R, Menon DK, Newcombe VF, Tallus J, Blennow K, Tenovuo O, Zetterberg H and Sanchez J-C (2020) Admission Levels of Interleukin 10 and Amyloid β 1–40 Improve the Outcome Prediction Performance of the Helsinki Computed Tomography Score in Traumatic Brain Injury. Front. Neurol. 11:549527. doi: 10.3389/fneur.2020.549527
Received: 06 April 2020; Accepted: 28 September 2020;
Published: 30 October 2020.
Edited by:
Damir Janigro, Case Western Reserve University, United StatesReviewed by:
Mårten Risling, Karolinska Institutet (KI), SwedenStuart J. McDonald, Monash University, Australia
Copyright © 2020 Posti, Takala, Raj, Luoto, Azurmendi, Lagerstedt, Mohammadian, Hossain, Gill, Frantzén, van Gils, Hutchinson, Katila, Koivikko, Maanpää, Menon, Newcombe, Tallus, Blennow, Tenovuo, Zetterberg and Sanchez. This is an open-access article distributed under the terms of the Creative Commons Attribution License (CC BY). The use, distribution or reproduction in other forums is permitted, provided the original author(s) and the copyright owner(s) are credited and that the original publication in this journal is cited, in accordance with accepted academic practice. No use, distribution or reproduction is permitted which does not comply with these terms.
*Correspondence: Jussi P. Posti, jussi.posti@utu.fi
†These authors have contributed equally to this work and share third authorship
‡These authors have contributed equally to this work and share last authorship