Listening for recollection: a multi-voxel pattern analysis of recognition memory retrieval strategies
- 1 Department of Psychology, Grand Valley State University, Allendale, MI, USA
- 2 Department of Computer and Information Science, University of Pennsylvania, Philadelphia, PA, USA
- 3 Department of Psychology and Princeton Neuroscience Institute, Princeton University, Princeton, NJ, USA
Recent studies of recognition memory indicate that subjects can strategically vary how much they rely on recollection of specific details vs. feelings of familiarity when making recognition judgments. One possible explanation of these results is that subjects can establish an internally directed attentional state (“listening for recollection”) that enhances retrieval of studied details; fluctuations in this attentional state over time should be associated with fluctuations in subjects’ recognition behavior. In this study, we used multi-voxel pattern analysis of fMRI data to identify brain regions that are involved in listening for recollection. We looked for brain regions that met the following criteria: (1) Distinct neural patterns should be present when subjects are instructed to rely on recollection vs. familiarity, and (2) fluctuations in these neural patterns should be related to recognition behavior in the manner predicted by dual-process theories of recognition: Specifically, the presence of the recollection pattern during the pre-stimulus interval (indicating that subjects are “listening for recollection” at that moment) should be associated with a selective decrease in false alarms to related lures. We found that pre-stimulus activity in the right supramarginal gyrus met all of these criteria, suggesting that this region proactively establishes an internally directed attentional state that fosters recollection. We also found other regions (e.g., left middle temporal gyrus) where the pattern of neural activity was related to subjects’ responding to related lures after stimulus onset (but not before), suggesting that these regions implement processes that are engaged in a reactive fashion to boost recollection.
Introduction
Dual-process theories of recognition propose that recognition judgments are made on the basis of two processes: the assessment of undifferentiated stimulus familiarity, and the recollection of specific details about a previous event (for a review, see Yonelinas, 2002). While there is general agreement that recollection and familiarity can contribute to recognition judgments, there is still extensive debate over how pervasively recollection contributes to recognition judgments. Some researchers have argued that subjects routinely draw on both processes (Yonelinas, 2002), whereas others (such as Malmberg and Xu, 2007; Malmberg, 2008) have argued that subjects strategically decide to rely on recollection when the perceived benefits of using recollection outweigh the costs (such as increased expenditure of effort and slower responses; Hintzman and Curran, 1994; Grupposo et al., 1997). Some recent work on the neural basis of episodic memory has framed the latter idea in terms of internally-directed attention to memory representations (Wagner et al., 2005; Buckner et al., 2008; Cabeza, 2008; Cabeza et al., 2008; Ciaramelli et al., 2008). Intuitively, just as we have the ability to carefully listen for faint noises, we can also expend effort carefully “listening” for recollected details. The goal of this study was to use neural data to explore this process of “listening for recollection”: Are there behaviorally meaningful fluctuations in how much subjects are listening for recollection, and (if so) which brain systems implement this process?
Recent neuroimaging studies have highlighted a number of prefrontal and parietal regions that are sensitive to whether subjects are responding based on recollection vs. familiarity (for reviews, see Wagner et al., 2005; Skinner and Fernandes, 2007; Vilberg and Rugg, 2008). For example, areas of left lateral parietal and mid-dorsolateral prefrontal cortex are differentially activated when subjects are orienting to recollected details (e.g., judging the source of an item) vs. responding based on item familiarity (Dobbins et al., 2003; Kahn et al., 2004). Importantly, however, the mere finding of a difference in activity across these conditions does not allow us to infer how a region is contributing to subjects’ use of recollection vs. familiarity. As discussed by Wagner et al. (2005), there are at least two reasons why a brain region might activate more strongly when subjects are trying to recollect details: One possibility is that the region helps to establish a top-down, internally-directed attentional state (“listening for recollection”) that amplifies the amount of recollection coming from the hippocampus. Another possibility is that activity in that region may directly reflect the increase in recollected information, rather than reflecting the top-down processes that gave rise to the increase in recollection in the first place.
Resolving this ambiguity is crucial to understanding how we make recognition decisions. Researchers have attempted to address this issue using the cue-probe paradigm, where subjects are explicitly cued to use recollection or familiarity prior to the presentation of the test word (e.g., Dobbins and Han, 2006); activity elicited by the recollection/familiarity cue necessarily reflects top-down processes (since the test word was not yet presented, activity elicited by the cue can not reflect recollection triggered by that word). However, this paradigm has one key shortcoming: By explicitly telling subjects which strategy to use on each trial, the cue-probe paradigm deprives us of the opportunity to study how subjects adjust internally-directed attention when left to their own devices. The brain regions (and cognitive processes) that are engaged by explicit cues to use recollection vs. familiarity may not be engaged when subjects “listen for recollection” on their own. Addressing this problem poses a major challenge: How do we measure neural activity associated with listening for recollection, while still allowing subjects to adjust their use of recollection vs. familiarity on their own? In our study, we used multi-voxel pattern analysis (MVPA) of fMRI activity (Haynes and Rees, 2006; Norman et al., 2006) to address this problem. Specifically, we trained a classifier to discriminate between time periods where subjects were instructed to use recollection vs. familiarity. The key benefit of MVPA is that, once the classifier has been trained, we can apply it to parts of the experiment where subjects are allowed to choose (on their own) how much they want to listen for recollection, and we can use the classifier to covertly track how much subjects are listening for recollection.
In our MVPA analysis, we used three criteria to identify regions involved in listening for recollection. First, we looked for brain regions where the distributed pattern of activity within the region was different when subjects were instructed to rely on recollection vs. familiarity. Second, to further winnow down the set of relevant regions, we looked for regions where fluctuations in the recollection and familiarity patterns (across trials) were related to behavioral memory performance. For this part of the experiment, we used the plurality recognition paradigm developed by Hintzman et al. (1992), in which subjects are asked to discriminate between studied words and closely related switched- plurality lures (e.g., study “rats”, test with “rat”). Prior work using this paradigm has established that responding to switched-plurality lures depends critically on subjects’ use of recollection: Related lures are familiar because they resemble studied items closely, but they can be rejected if subjects recollect studied plurality information. The role of recollection in rejecting switched-plurality lures has been established using time-course data (Hintzman and Curran, 1994; but see Rotello and Heit, 1999), ROC analysis (Rotello et al., 2000), ERPs (Curran, 2000), and computational modeling (Malmberg et al., 2004). Based on these results, we expected that the pattern of brain activity associated with subjects relying on recollection would be associated with correct rejections of related lures, whereas the pattern of brain activity associated with relying on familiarity would be associated with false alarms to related lures.
Finally, to specifically identify regions involved in listening for recollection, we looked at when (relative to stimulus onset) activity in a particular region was related to recognition behavior. If a region is involved in listening for recollection, it should be possible to measure activity in that region prior to stimulus onset (to see if the subject is “listening”) and then use that measure to predict subjects’ response to the memory test probe. The principle here is the same as in the cue-probe paradigm: Looking at pre-stimulus activity is especially diagnostic with regard to top-down processing (because it can not be affected by bottom-up recollection triggered by the test item). The key difference is that, in our study, we looked at pre-stimulus activity during a standard recognition paradigm (where subjects were not explicitly cued regarding strategy use) as opposed to activity elicited by a pre-stimulus cue to use recollection vs. familiarity.
In summary: In the absence of specific instructions regarding strategy use, subjects can make strategic, on-line adjustments in how much they are listening for recollection, but existing studies do not address the question of which neural mechanisms are involved in this process. The concrete goal of this study was to use MVPA to answer this question. To identify brain regions that were involved in listening for recollection, we looked for regions where fluctuations in neural activity patterns during the pre-stimulus interval predicted responding to related lures.
Materials and Methods
Overview of the Study
The experiment was conducted in two phases. This section provides a brief description of the two phases and our analysis methods; further details are provided in the following sections.
The goal of Phase 1 (Figure 1, left-hand side) was to find regions where the pattern of activity was different when subjects were instructed to use recollection vs. familiarity. During this phase, subjects studied singular and plural nouns, and they were given recognition memory tests where they discriminated between studied items and unrelated lures (i.e., words that were not previously studied in either singular or plural form). Subjects’ strategic use of recollection or familiarity was manipulated across test blocks: For some test blocks, subjects were asked to make their judgment based on recollection, and for other blocks subjects were asked to make their judgment based on familiarity. To analyze the fMRI data, we used a local pattern mapping approach (Kriegeskorte et al., 2006). This procedure involves sweeping a spherical searchlight (radius = 2 voxels; volume = 33 voxels) around the entire brain. For each location of the searchlight, we applied a classifier to the pattern of activity within the sphere (Kriegeskorte et al., 2006). For the Phase 1 data, we trained a pattern classifier (for each sphere location) to discriminate between individual brain scans (corresponding to 2 s of fMRI data) acquired during recollection and familiarity test blocks. Once trained, the classifier can be used to read out the extent to which subjects are using recollection vs. familiarity at a given point in time.
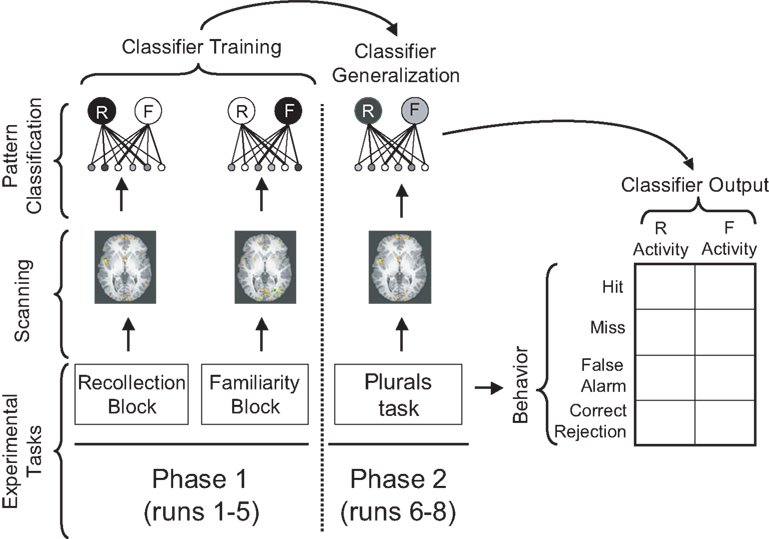
Figure 1. Schematic overview of the experiment. Different experimental tasks were performed in Phase 1 and Phase 2 of the experiment. Scanning was performed in both phases. The classifier was trained on Phase 1 data to distinguish between brain activity from recollection blocks vs. familiarity blocks. Next, the trained classifier was applied to Phase 2 data, in order to estimate the subject’s use of recollection vs. familiarity at each time point during the plurals recognition task. Classifier outputs were then related to the subject’s behavior in the plurals task.
The goal of Phase 2 (Figure 1, right-hand side) was to assess whether the localized patterns identified in Phase 1 were behaviorally relevant: That is, were fluctuations in these patterns (over time) related to subjects’ recognition behavior in a theoretically meaningful way? During Phase 2, subjects studied singular and plural nouns, and afterward were given a recognition test consisting of studied items, switched-plurality related lures (e.g., study “rats”, test with “rat”), and unrelated lures. Subjects were instructed to say “old” to studied items and “new” to both related lures and unrelated lures. Importantly, during Phase 2, subjects were not given explicit instructions regarding whether they should use recollection or familiarity. We expected that the instructions to discriminate between studied items and switched-plurality lures would bring about some use of recollection, but we also expected that the degree to which subjects were listening for recollection would fluctuate over the course of the memory test.
For each sphere location, we took the classifier that we trained on Phase 1 data, and applied the trained classifier to each of the individual fMRI scans acquired during Phase 2. This procedure yields an estimate, for each Phase 2 scan, of how strongly subjects were focusing on recollection vs. familiarity at each point in time. We expected that “listening for recollection” during the pre-stimulus interval would be associated with correct rejections of related lures, whereas the absence of this state would be associated with false alarms to related lures. Furthermore, we expected that subjects’ responses to studied items would be relatively insensitive to whether subjects were focusing on recollection or familiarity during the pre-stimulus interval: Studied items can be called “old” based on either familiarity or (plurality-consistent) recollection. Because subjects can rely on either process to make a correct “old” response, hit rates should be similar regardless of whether subjects are listening for recollection. Put another way: If subjects decide to rely on familiarity instead of recollection, this will boost false alarms to related lures, but it may not affect responding to studied items (since these items can still be called “old” based on familiarity). Importantly, we are not claiming that responding to studied items will be totally unaffected by subjects’ relying on recollection vs. familiarity; our key claim is that relying on recollection vs. familiarity will have more of an effect on responding to related lures than it does on responding to studied items.
In addition to examining the relationship between pre-stimulus classifier activity and recognition behavior, we also looked at the relationship between post-stimulus classifier activity and behavior. Just as there are top-down “listening” processes that subjects can deploy prior to stimulus onset to foster recollection, there are top-down processes that subjects can deploy after stimulus onset to foster recollection. For example, one way to boost recollection is to perform the encoding task from the study phase on the test stimulus. Insofar as retrieval success is a function of the match between mental activity at study and at test (Tulving and Thomson, 1973), performing the same task at study and at test should boost the odds of recollection. We address this idea in more detail in the Discussion section. Importantly, the brain regions involved in deliberately performing the encoding task again at test may differ from the brain regions involved in listening for recollected information during the pre-stimulus period; examining the relationship between classifier activity and behavior during both pre-stimulus and post-stimulus time windows should give us a chance of detecting both types of brain regions.
Subjects
Twenty-eight individuals recruited from the Princeton University community participated in the experiment. Data from two individuals were removed from the analysis because of scanner artifacts, and data from two others were removed for missing responses. All subjects were paid $52 for participating in the scanning session and a behavioral practice phase.
Materials
Four hundred seventy-four four- to eight-letter nouns with Imageability and Concreteness scores above 400 were selected from the MRC psycholinguistic database (Coltheart, 1981). Only nouns for which the plural form was created by adding “–s” to the end were included. Half of the nouns were presented in their singular form and half in their plural form. One set of 240 words was used in Phase 1 and a different set of 234 words was used in Phase 2. Words in Phase 1 were randomly assigned to recollection and familiarity blocks within each run, and appeared in a random order for each subject within each block. Words in Phase 2 were counterbalanced across subjects with respect to the three test conditions (studied-item, related lure, and unrelated lure) and the three runs. For both phases, whether the word was presented in singular or plural form at test was also counterbalanced across subjects.
Behavioral Procedure
Phase 1 procedure
The first phase consisted of five study-test cycles (where each study-test cycle corresponded to a scanner run). Figure 2 illustrates the time-course of a single study-test cycle from Phase 1. In each of the five study-test cycles, the subjects studied a list of 24 words, followed by four recognition tests in which six studied words and six new words were presented. During presentation of the study list, items appeared one at a time for 1800 ms each, and subjects were asked to judge whether the item or items represented by the word would fit into a shoebox. Specifically, subjects were instructed to form a mental image linking the objects to a shoebox, and to make their judgments based on this image. Subjects were explicitly instructed that if the word was singular, they should imagine a single object (e.g., “Yacht” should elicit an image of one yacht), and if the word was plural, they should form an image of multiple objects (e.g., “Fleas” should elicit an image containing more than one flea). We used this form-an-image encoding task because, at test, it yields robust recollection of whether the item was studied as a singular or plural word (i.e., if subjects remember an image containing multiple objects, they can deduce that the item was studied as a plural word). Four non-tested items at the beginning and end of each list were added as primacy and recency buffers.
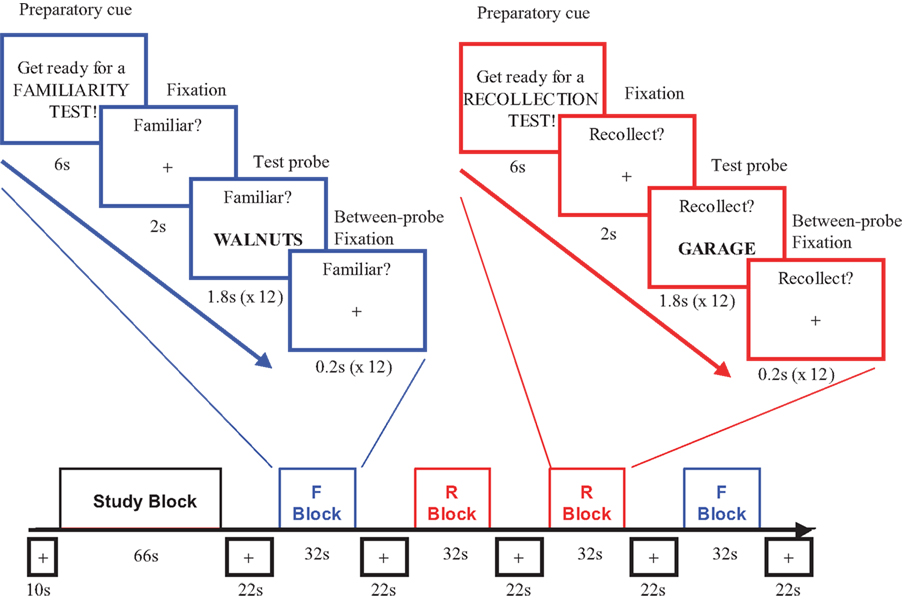
Figure 2. The block and event sequence for one Phase 1 study-test run. Each run began with 10 s of fixation followed by a 66-s study phase. The study phase was followed by an alternating sequence of 22-s fixation periods and 32-s recognition test blocks performed under either familiarity or recollection instructions. In each run, one of the two block-types (recollection or familiarity test instructions) appeared as the first and fourth block, and the other type appeared as the second and third. The arrangements of recollection and familiarity blocks varied between these two sets of positions across runs. Within each block, the first 6 s consisted of a cue indicating the condition, followed by a 2-s fixation before the 12 consecutive test trials with onsets every 2 s.
Test instructions were manipulated within each study-test cycle. For two of the four tests within each study-test cycle, subjects were given instructions to judge the familiarity of the stimulus; for the other two tests, subjects were given instructions to judge whether they recollected the image they formed at study. The two test conditions (judge familiarity and judge recollection) were presented in an ABBA order within each cycle. The familiarity condition appeared first during the first and fourth study-test cycles, and the recollection test appeared first during the second, third, and fifth study-test cycles. In the familiarity condition, subjects were instructed to judge, as quickly as possible, whether the item seemed familiar, and were told not to be concerned with whether they remembered seeing the item or forming an image of it previously on the study phase. Subjects were told to make their judgments as soon as they had a sense of the familiarity of the item. If they recollected details about the procedure they should try to ignore them, and if the found themselves recollecting a lot, they should try responding more quickly [these instructions were based on instructions used previously by Montaldi et al. (2006) and Quamme et al. (2007)]. In the recollection condition, subjects were instructed to focus specifically on trying to recollect whether they formed an image of the item at study. They were instructed to respond “no” if they failed to recollect an image, even if they remembered something else about the item. Accuracy and response time were collected for each test trial. Importantly, the goal of the instructional manipulation was not to completely eliminate the influence of recollection during familiarity blocks (or vice-versa). Rather, our goal was to manipulate the relative extent to which subjects were internally directing attention to recollection vs. familiarity in the two conditions (see Section “MVPA Step 1: Classifier Training” for further discussion of this point).
During the recollection and familiarity test blocks, each stimulus appeared for 1800 ms followed by 200 ms of fixation. Blocks were separated by a 22-s fixation period, and each block was preceded by a 6-s cue period telling subjects to “get ready for a recollection test” or “get ready for a familiarity test”. In each block, a banner was shown continuously above the words telling subjects to “recollect” or judge “familiarity”. Each of the Phase 1 study-test cycles lasted 5 min, 30 s.
Phase 2 procedure
During Phase 2, subjects completed three study-test cycles of yes/no recognition in which they had to distinguish studied items from new items and switched-plurality related lures. Study and test procedures were conducted in separate scanner runs. Figure 3 illustrates the time-course of a single Phase 2 test run. Study runs contained 52 singular and plural words. Twenty-six words appeared later on the recognition test in the same form, and other 26 appeared in switched-plural form. Four non-tested buffer items appeared at the beginning and end of each study list, for a total of 60 study trials. The study procedure for Phase 2 was otherwise identical to that of Phase 1.
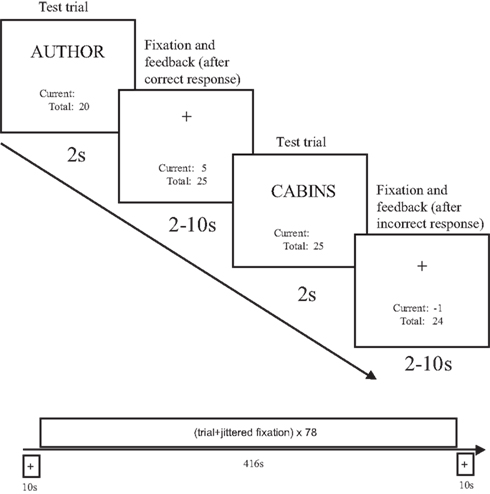
Figure 3. Event sequence during two sample trials of a Phase 2 test run (the timeline for the entire test run is shown at the bottom of the figure). Test trials were presented for 2 s, followed by a response feedback and fixation period of jittered duration, varying between 2 and 10 s. A running point total was visible at all times during the test period. After subjects entered their response, the current award or penalty was shown (along with a fixation cross) and the total was updated.
The test runs in Phase 2 were conducted using an event-related design. Each test consisted of 26 studied words, 26 new words (unrelated lures), and 26 switched-plurality related lures. Each test trial was presented for 2 s, and the subject had to respond in this time interval. Pilot studies indicated that, without incentives, subjects responded conservatively and they did not generate a sufficient number of switched-plurality false alarms. To encourage a more liberal response bias in this task, we instituted a payoff matrix whereby subjects earned or lost points depending on how they responded. Subjects were told they should respond in such a way as to earn as many points as possible on the task. Subjects earned five points for every hit, and lost one point for every false alarm and miss. They did not gain or lose any points for a correct rejection. Thus, it was in subjects’ best interest to respond “yes” when unsure, because “yes” responses potentially led to large payoffs if they were correct, and only a low penalty if they were incorrect, whereas “no” responses received the same low penalty if incorrect and no reward if correct. Pilot studies showed this balance of payoff and penalty led to higher false alarm rate, but had no substantive effect on overall recognition accuracy. The maximum total points possible on each test was 130. A running point total was displayed continuously below the stimulus, along with the points earned or lost on the previous trial. Following each stimulus trial a fixation cross was presented for 2 s with the feedback. Stimulus trials were jittered by interspersing 26 null fixation trials with a timing and sequence determined by Dale’s (1999) optseq algorithm. The interval between the offset of the previous item and the onset of the subsequent test item was always between 2 and 10 s, and was always filled with previous and total points information below a fixation cross. The study-test cycles in Phase 2 each lasted approximately 10 min, with a 3-min study run and a 7-min test run.
Practice session procedure
Either 1 or 2 days prior to the scan, all subjects completed a 1-h practice phase on both the Phase 1 and Phase 2 procedures. This was done to ensure subjects were familiar with the procedures and that they performed the task correctly. The practice focused on (1) making vivid mental images during the shoebox study task, (2) differentiating recollection and familiarity mental task sets, and (3) earning points on the Phase 2 test. Subjects were first given a description of recollection and familiarity adapted from the remember-know instructions used by Gardiner and Java (1988). Then they were asked to form detailed mental images in an unpaced fashion for eight singular and plural words, and to describe these images. Subjects were probed with questions by the experimenter to ensure they understood the level of detail needed. For example, if they were shown the word “stool”, subjects were asked to indicate how many legs it had, what it was made out of, and where the shoebox was in the image if this information was not spontaneously provided. Then subjects were given a practice study phase with 54 items (none of these practice items were used in the main experiment). Following the practice study phase, they practiced the familiarity task, a recollection task, a second familiarity task, and a second recollection task. For the recollection tasks, subjects were asked to justify their yes responses by describing the image they recollected. All subjects reported being comfortable with both procedures (i.e., they were able to attend to recollected details during recollection test blocks and ignore recollected details during familiarity test blocks).
fMRI Procedure
fMRI data acquisition
Scanning was performed on a Siemens Allegra 3 Tesla scanner at the Scully Center for the Neuroscience of Mind and Behavior at Princeton University. Anatomic images were obtained first with a sagittal magnetization preparation-rapid acquisition gradient echo (MP-RAGE) T1-weighted sequence (TR = 2500 ms; TE = 4.38 ms; voxel size = 1.0 mm × 1.0 mm × 1.0 mm; flip angle = 78; FOV = 256 mm). Following the structural scan, 11 runs of functional BOLD sensitive T2* weighted scans were obtained (TR = 2000 ms; TE = 30 ms; 3.0 mm × 3.0 mm × 3.7 mm in-plane resolution; 64 × 64 × 34 sagittal slices; flip angle = 75; FOV = 192). For Phase 1 (recollection vs. familiarity block design), 159 images were acquired in each of five runs. For Phase 2 (event-related recognition memory with the plurals task), 217 images were acquired in each of three test runs (there were also three Phase 2 study runs, but fMRI data from these runs were not analyzed). The first five images in each run were discarded to allow for stabilization of magnetization. Foam pads were used to minimize head movement and earplugs were used to reduce scanner noise.
Preprocessing of fMRI data
fMRI preprocessing was performed in AFNI (Cox, 1996). The first three scans were removed from the beginning of each run and slice times were aligned to 1 s after the onset of each 2-s scan (i.e., the middle of the scan). AFNI’s 3dDespike was used to remove signal spikes in the time-course of each voxel. All functional volumes were co-registered to the first scan of the experiment, and were corrected for motion artifacts based on co-registration parameters.
The EPI data were smoothed with full width, half max of one voxel. We used one-voxel smoothing because we found in our prior MVPA work (e.g., Polyn et al., 2005) that this level of smoothing strikes a good balance between the benefits of smoothing (averaging out noise) and the costs of smoothing (loss of high-spatial-frequency signal), especially for relatively coarse-grained cognitive distinctions like the one being investigated here. Detrending was performed using Legendre polynomials of order 1 (linear) for the Phase 1 runs (runs 1–5), and of order 2 for the Phase 2 runs (runs 6–8). For the Phase 1 runs, study-period scans were removed before detrending; quadratic detrending was not performed because (for Phase 1) the quadratic trend correlates with the ABBA structure of the recollection/familiarity manipulation. EPI data were z-scored separately for each voxel and each run, to ensure that we had a normalized activation value across runs. Finally, between-block rest periods were removed from the analysis.
Multi-voxel pattern analysis methods
We used MVPA to decode subjects’ use of recollection vs. familiarity on a trial-by-trial basis. The MVPA approach to analyzing fMRI data involves training a pattern classifier to detect multi-voxel patterns of fMRI data corresponding to particular cognitive states (for reviews, see Haynes and Rees, 2006; Norman et al., 2006; for examples of how MVPA has been used to study memory, see Polyn et al., 2005; Johnson et al., 2009; McDuff et al., 2009). By aggregating the information that is present in multiple voxels’ responses, MVPA can achieve a higher level of sensitivity to the subject’s cognitive state than univariate approaches (although this is not always the case; see Section “Results” for details). As is typical for MVPA analyses, our main pattern-classification analysis was run within subjects (i.e., the classifier was trained on a particular subject’s data, and then tested on data from the same subject).
Our MVPA analysis procedure involved the following steps: First, we trained a classifier to discriminate between fMRI patterns acquired during Phase 1 recollection and familiarity blocks. Second, we used a cross-validation procedure to assess how reliably the classifier could discriminate between Phase 1 recollection and familiarity blocks. Third, we used the trained classifier to estimate the subject’s use of recollection during Phase 2, and we related these classifier estimates to the subject’s recognition behavior; the relationship between classifier activity and behavior was computed for multiple time intervals relative to stimulus onset. Fourth, we ran a non-parametric analysis to assess the statistical reliability (across subjects) of the relationship between classifier output and behavior. As mentioned earlier, we used a local pattern mapping procedure (Kriegeskorte et al., 2006) whereby we swept a spherical searchlight (radius = 2 voxels; volume = 33 voxels) around the brain. For each searchlight location, we applied the four steps described above to the pattern of activity within the searchlight. The net result of this procedure is a brain map showing searchlight locations where (1) the pattern of activity was reliably different for recollection vs. familiarity blocks in Phase 1, and (2) fluctuations in these patterns were reliably related to subjects’ recognition behavior during Phase 2, in the manner predicted by our theory (i.e., the classifier’s estimate of “use of recollection” was related to subjects’ responding to related lures, and the relationship between classifier output and behavior was stronger for related lures than for studied items). The following sections describe each of the four steps outlined above; for additional details, see Supplementary Material.
MVPA step 1: classifier training. All of our classification analyses used a regularized logistic regression classifier (see the Supplementary Material for additional technical details regarding the classifier). The classifier was given, as input, the voxel activity values from a particular sphere (acquired during a single 2-s scan). Only time points corresponding to recollection and familiarity blocks were used to train the classifier. To account for the hemodynamic response, we used the waver function from AFNI (Cox, 1996) to convolve the boxcar regressors corresponding to recollection and familiarity blocks with a gamma-variate hemodynamic response function. Next, we took the hemodynamically convolved regressors, rescaled the regressors into the 0 to 1 range, and then binarized them such that values above 0.5 were set to 1 and values below 0.5 were set to 0. The net effect of this convolve-then-binarize process is to shift the recollection and familiarity boxcar regressors three scans (6 s) forward in time.
The preprocessed fMRI data and the shifted regressors were loaded into MATLAB (Mathworks, Natick, MA, USA) using the Princeton MVPA Toolbox (Detre et al., 2006; http://www.csbmb.princeton.edu/mvpa). All of the subsequent logistic regression analyses were implemented using the MVPA Toolbox. The regularized logistic regression classifier was trained to produce output = 1.0 for patterns that were labeled as coming from recollection blocks in Phase 1, and it was trained to produce output = 0.0 for patterns were labeled as coming from familiarity blocks in Phase 1. Like standard logistic regression, regularized logistic regression computes a weighted combination of voxel activity values, and it adjusts the (per-voxel) regression weights to minimize the discrepancy between the predicted output value and the correct output value. Unlike standard logistic regression, our regularized logistic regression classifier also includes an L2 regularization term that biases it to find a solution that minimizes the sum of the squared weights; this regularization term helps to guard against overfitting (Hastie et al., 2001). After the classifier has been trained, it can be applied to new patterns of voxel activity from within the sphere, and it will generate (for each new pattern) an estimate of how well the new pattern matches the “recollection” and “familiarity” patterns that were presented at training.
Importantly, although our classifier procedure labels training patterns dichotomously as either coming from recollection blocks or familiarity blocks, the classifier training procedure does not assume that recollection and familiarity are mutually exclusive. The only assumption that we are making is that subjects rely relatively more on recollection during recollection blocks vs. familiarity blocks. The output of a classifier trained using this procedure indicates the relative extent to which subjects are relying on recollection vs. familiarity (i.e., does the pattern of brain activity more closely resemble the pattern associated with relatively high use of recollection, or does it more closely resemble the pattern associated with relatively low use of recollection).
MVPA step 2: cross-validation testing on Phase 1 data. The next step was to assess (for each sphere) how well the classifier could discriminate between the Phase 1 recollection and familiarity patterns. To accomplish this goal, we used a leave-one-out cross-validation procedure. As mentioned earlier, Phase 1 was composed of five study-test cycles (each corresponding to a different scanner run). We trained the classifier on recognition-test data from four out of the five study-test cycles; then we measured how well the classifier was able to discriminate between recollection and familiarity blocks from the fifth (“left out”) study-test cycle. We repeated this procedure five times, each time leaving out a different study-test cycle. For each of the brain scans collected during the memory-test part of Phase 1, we obtained a classifier output value; values >0.5 signify brain states closer to the “recollection” training condition, whereas values <0.5 signify brain states closer to the “familiarity” training condition. We operationalized classifier accuracy in terms of percent correct (i.e., the proportion of trials where the classifier’s “guess” as to the recollection/familiarity status of a pattern was correct; on recollection trials, classifier output values ≥0.5 were labeled as being correct; on familiarity trials, classifier output values <0.5 were labeled as being correct).
MVPA step 3: applying the trained classifier to Phase 2 data. To assess whether a particular region carried behaviorally relevant information about use of recollection, we trained a classifier on all five runs of Phase 1 data, and we applied the pattern classifier to all of the individual brain scans that we collected during Phase 2. For each of the brain scans collected during the plurality-memory-test part of Phase 2, we obtained a classifier output value. We separately computed the average classifier output for four different trial types (studied-item hits, studied-item misses, related lure false alarms, and related lure correct rejections) at four different time windows relative to stimulus onset (uncorrected for hemodynamic lag). Time Window 1 is meant to capture pre-trial activity; it encompasses the two-scan (4-s) period immediately preceding the onset of the trial (i.e., if we label the scan where the test word appeared as “scan 0”, Window 1 consists of classifier output from scan −2 and scan −1). Window 2 (scans 0 and 1) encompasses the 4-s period beginning with the onset of the trial. Window 3 (scans 2 and 3) and Window 4 (scans 4 and 5) reflect the time periods occurring from 4 to 8 s and from 8 to 12 s after trial onset, respectively. Note that results from unrelated-lure trials were not included in the analysis because subjects did not make enough unrelated-lure false alarms to permit an analysis of how classifier output predicts unrelated-lure responses.
For each sphere location and for each time window, we computed two metrics that reflect the relationship between classifier output and subjects’ responses on studied-item and related lure trials. First, we computed DRL = classifier output for related-lure correct rejections – classifier output for related-lure false alarms. As discussed earlier, attentional states that foster the use of recollection should be associated with related-lure correct rejections, and the absence of these states should be associated with related-lure false alarms. As such, if the classifier is veridically tracking these attentional states, classifier output should be different for related-lure correct rejections vs. false alarms. Specifically, DRL should be positive, since we expect “listening for recollection” to be greater for related-lure correct rejections vs. false alarms.
Second, we computed DSTUDIED = classifier output for studied-item misses – classifier output for studied-item hits. As discussed earlier, attentional states that foster the use of recollection should have a greater impact on responding to related lures than studied items. If this is the case, then the absolute value of the related lure difference, |DRL|, should be larger than the absolute value of the studied-item difference, |DSTUDIED|. We used absolute values in this analysis because numerically small values of DSTUDIED (indicating a weak or non-existent relationship between classifier output and studied-item behavior) are more compatible with our theory than large negative values of DSTUDIED (indicating a strong relationship between classifier output and studied-item behavior). Computing the difference between |DRL| and |DSTUDIED| ensures that areas showing a large negative DSTUDIED value are penalized (i.e., deemed to be less relevant) instead of being favored.
MVPA step 4: evaluating across-subject reliability. The next step in the analysis was to identify, for each time window, sphere locations that were reliably informative (across subjects) about subjects’ use of recollection. Each subject contributed nine sphere-based brain maps to the analysis: one cross-validation map (showing Phase 1 cross-validation accuracy for each sphere); four maps (one per time window) showing values of DRL for each sphere; and four maps (one per time window) showing values of DSTUDIED for each sphere. Each voxel value in each map reflects the performance of a whole sphere, centered at that voxel. To combine results across subjects, we first co-registered subjects’ anatomical volumes to Talairach space (Talairach and Tournoux, 1988). Next, individual subject maps of the nine sphere-based metrics were aligned to the Talairach space template and resampled linearly to 3 mm cubic voxels (for additional details regarding the alignment procedure, see Supplementary Material).
We then set up a series of statistical tests to assess whether a given sphere was reliably informative regarding subjects’ use of recollection. The first test focused on the Phase 1 data: If a sphere is informative regarding subjects’ use of recollection, then it should show different patterns of activity during Phase 1 recollection and familiarity blocks, which (in turn) should result in above-chance Phase 1 cross-validation accuracy. We assessed whether Phase 1 cross-validation accuracy in each sphere was reliably above chance using a t-test, with subjects as a random effect. All sphere locations that failed to meet this test with a p < 0.05 significance threshold were removed from further consideration; spheres with p < 0.05 were subjected to the tests described below (for a brain map of sphere locations meeting this cross-validation threshold, see Figure S2 in the Supplementary Material). Our purpose in applying this threshold was to eliminate spheres that were clearly not informative regarding subjects’ use of recollection. We used a relatively liberal threshold (p < 0.05) because we were more concerned about how well spheres predicted behavior in Phase 2 than about exactly how well the spheres discriminated between blocks in Phase 1.
The remaining tests all focused on Phase 2 data. We wanted to identify spheres that reliably exhibited the predicted relationship between classifier output and behavior. We focused on two measures: DRL (positive values indicate that use of recollection, as indexed by the classifier, was greater for correct rejections vs. false alarms to related lures), and |DRL| − |DSTUDIED| (positive values indicate a stronger relationship between classifier output and behavioral responding for related lures vs. studied items). The group-wise value of DRL for each sphere was computed by averaging DRL values across subjects. The group-wise value of |DRL| − |DSTUDIED| for each sphere was computed via a three-step process: (1) compute across-subject averages of DRL and DSTUDIED; (2) compute the absolute values of these across-subject averages; (3) subtract the absolute values. We computed across-subject averages before computing absolute values because the alternative approach – computing absolute values before computing across-subject averages – leads to distortion (positive skew) in our estimates of DRL and DSTUDIED, which (in turn) reduces our power to detect differences between |DRL| and |DSTUDIED|.
For each sphere, we tested the significance of the observed DRL and |DRL| − |DSTUDIED| effects using a non-parametric resampling procedure; this procedure is described briefly here (we provide a more detailed account of this procedure in Supplementary Material). We computed an empirical null distribution by scrambling each subject’s responses within the studied-item and related-lure conditions 20,000 times (e.g., if a subject made two studied-item hits and three related-lure false alarms, the two hits would be randomly reassigned among the studied-item trials, and the three false alarms would be randomly assigned among the related-lure trials). This scrambling procedure instantiates the null hypothesis that classifier output and behavioral responses are unrelated to each other in Phase 2. For each of the 20,000 samples, we re-computed the group-wise DRL and |DRL| − |DSTUDIED| measures for each sphere. We obtained p values by computing (for each measure) the fraction of the null distribution that exceeded the observed value. Spheres were labeled as significant if DRL was positive with p < 0.001 and |DRL| − |DSTUDIED| was also positive with p < 0.001.
We corrected for multiple comparisons using the non- parametric cluster-based procedure described in Nichols and Hayasaka (2003) (see Supplementary Material for details). This procedure involves clustering the actual data (where a cluster was defined as a set of significant spheres with adjacent center voxels) and then running additional scrambles to assess the probability of observing a cluster of a given size under the null hypothesis. In the result section, we report clusters that passed the multiple comparisons correction with family-wise error rate <0.05.
Average activity analyses
Several studies have demonstrated that MVPA can detect cognitive state fluctuations that univariate methods fail to detect (e.g., Polyn et al., 2005; Haynes et al., 2007). This is what motivated us to use MVPA in the present study. However, it is an empirical question whether (in this particular study) MVPA will prove to be more sensitive to fluctuations in “listening for recollection” than univariate methods. To address this question, we ran a variant of our main analysis where, instead of looking at the pattern of activity in a sphere, we computed the average level of activity (AVG) within the sphere and fed that single value into the classifier. If the use of recollection vs. familiarity affects the pattern of activity in the region, but not the average level of activity, then the MVPA analysis will be more sensitive than the AVG analysis. If, on the other hand, the average level of activity in a sphere is affected by subjects’ use of recollection vs. familiarity, then the AVG analysis should do just as well as MVPA (and perhaps even better, since MVPA is a more complex model and thus is more prone to overfitting the training data; we return to this issue in the discussion section).
The MVPA vs. AVG comparison is meant to shed light on the relative strengths (and weaknesses) of multivariate vs. univariate approaches. However, we should note that both variants of our primary analysis (MVPA and AVG) are quite different from the standard sorts of recollection vs. familiarity comparisons that have been performed in existing studies (see, e.g., Skinner and Fernandes, 2007; Vilberg and Rugg, 2008). To facilitate comparison with other fMRI studies of recollection vs. familiarity, we also ran standard general linear model (GLM) analyses. The results of these analyses are presented in Supplementary Material.
Results
Behavioral Performance
The behavioral data for Phase 1 are shown in Table 1. Both hit and false alarm rates in Phase 1 data were higher for familiarity blocks than recollection blocks; accordingly, response bias, measured using c (Macmillan and Creelman, 2005), was significantly more liberal in familiarity blocks, t(23) = 5.04, p < 0.001. However, recognition sensitivity as measured by d′ did not significantly differ between blocks, t(23) = 1.45, p = 0.14. Responses to both studied items and lures were also significantly faster in familiarity blocks than recollection blocks, t(23) = 7.89, p < 0.001 and t(23) = 7.25, p < 0.001 respectively. This result is consistent with previous results showing that the time-course of familiarity is faster than the time-course of recollection (Gronlund and Ratcliff, 1989; Hintzman and Curran, 1994; Rotello and Heit, 2000). During Phase 2, subjects responded “old” most often to studied items (M = 0.86, SEM = 0.01), next-most-often to related lures (M = 0.29, SEM = 0.01), and least-often to unrelated lures (M = 0.08, SEM = 0.03). This is the typical pattern of results for the plurals paradigm (see, e.g., Hintzman et al., 1992; Curran, 2000).
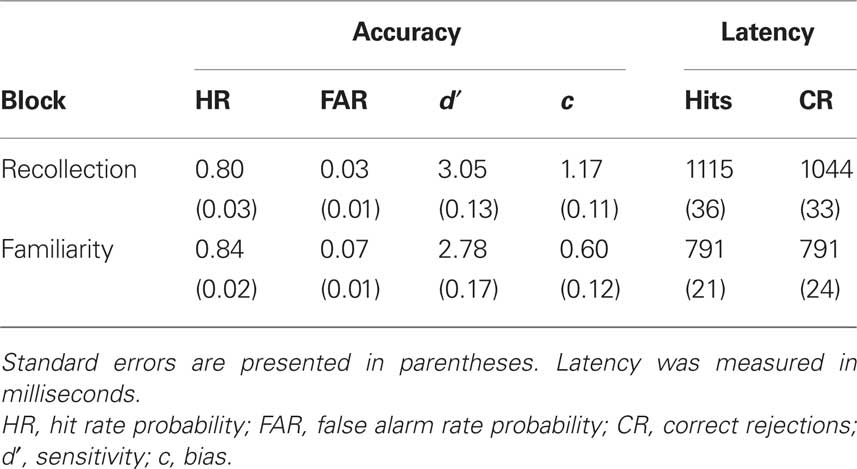
Table 1. Mean behavioral performance on recollection and familiarity blocks in Phase 1.
fMRI Results
The locations of significant sphere clusters (i.e., sphere clusters meeting all of our statistical criteria) are shown in Figure 4 (for MVPA) and Figure 5 (for AVG) for each of four time windows. The figures show, for each voxel, the average number of significant spheres that included that voxel. That is, the figures indicate the density of significant spheres rather than degree of significance; lighter colors indicate higher density (see Supplementary Material for a detailed description of how these density maps were created). The locations and extent of the significant sphere clusters are summarized in Table 2 for MVPA and Table 3 for AVG analyses. As is evident from the Figures 4 and 5 and Tables 2 and 3, there were differences in the patterns observed across time windows and analysis methods (MVPA vs. AVG).
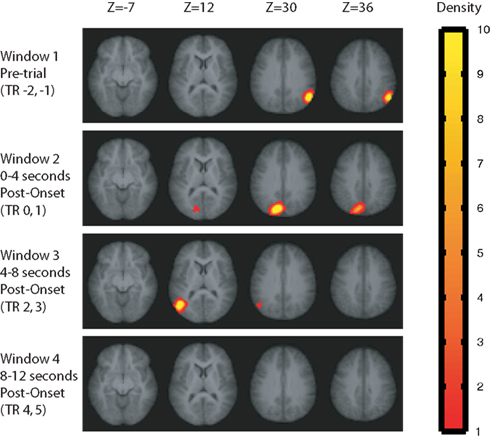
Figure 4. Sphere clusters passing our statistical tests for the MVPA analysis at family-wise error rate <0. 05. Values plotted at each voxel are the average number of significant spheres in which the voxel was included, scaled from red to yellow, with yellow regions indicating that a voxel appeared in an average of 10 or more significant spheres. Sphere results were computed separately for four time windows relative to the test stimulus onset.
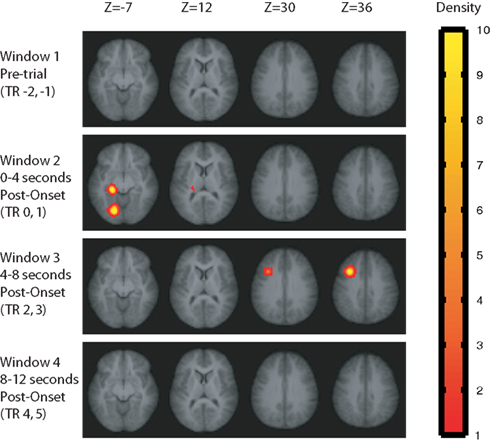
Figure 5. Sphere clusters passing our statistical tests for the AVG analysis at family-wise error rate <0. 05. Values plotted at each voxel are the average number of significant spheres in which the voxel was included, scaled from red to yellow, with yellow regions indicating that a voxel appeared in an average of 10 or more significant spheres. Sphere results were computed separately for four time windows relative to the test stimulus onset.
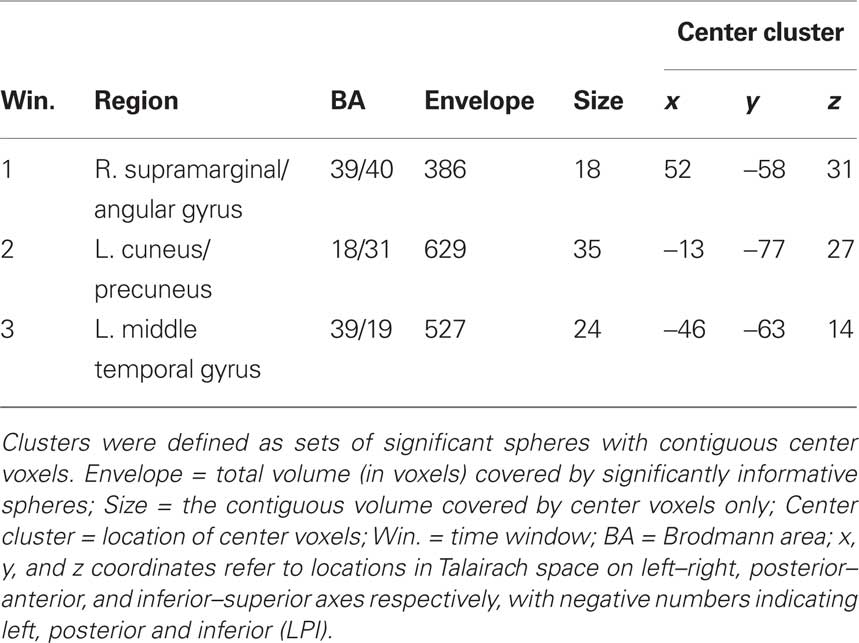
Table 2. Sphere clusters from MVPA analysis passing cross-validation, DRL, and |DRL| − |DSTUDIED| thresholds at family-wise error rate <0.05.
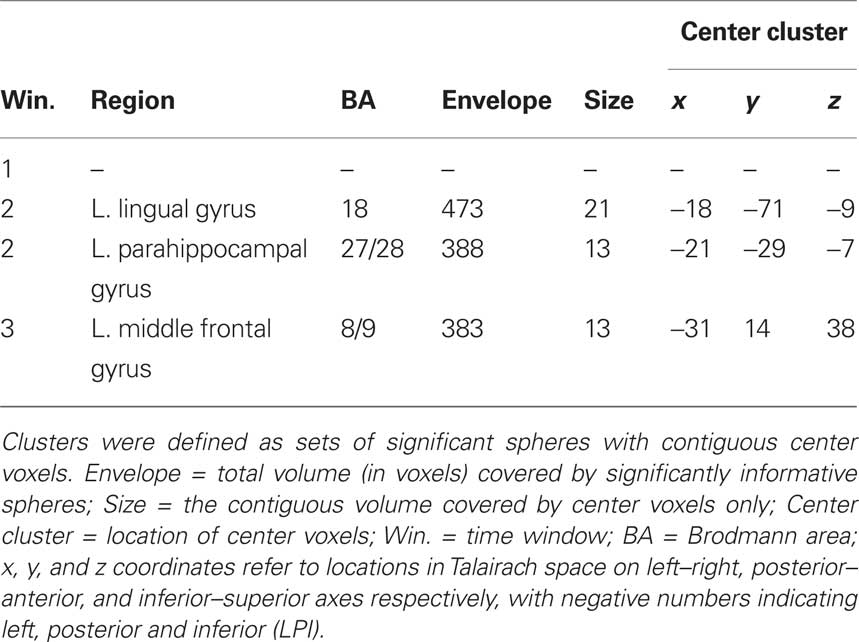
Table 3. Sphere clusters from AVG analysis passing cross-validation, DRL, and |DRL| − |DSTUDIED| thresholds at family-wise error rate <0.05.
Window 1: pre-trial activity (0–4 s before stimulus onset)
For the Window 1 time frame, the MVPA analysis procedure identified a significant region in the right temporal–parietal junction (TPJ) centered on supramarginal gyrus (BA 40) and the angular gyrus (BA 39). By contrast, the AVG analysis procedure did not identify any significant regions for this time window.
The significant MVPA effect in the right supramarginal gyrus is illustrated in Figure 6. The figure consists of two panels, with MVPA on the left and AVG analysis on the right. Each panel plots the mean DRL value (the difference in classifier output for related lure correct rejections and false alarms) and DSTUDIED value (the difference in classifier output for misses and hits) across spheres in the significant cluster. All metrics are plotted across each of the four time windows. The figure shows that, for the Window 1 MVPA analysis, DRL was well above 0 (indicating that use of recollection, as indexed by the classifier, was greater for related-lure correct rejections than false alarms) but DSTUDIED was close to 0 (indicating that use of recollection, as indexed by the classifier, was similar for misses and hits). The same qualitative pattern was also present for Window 2 in the MVPA analysis, but it did not reach significance.
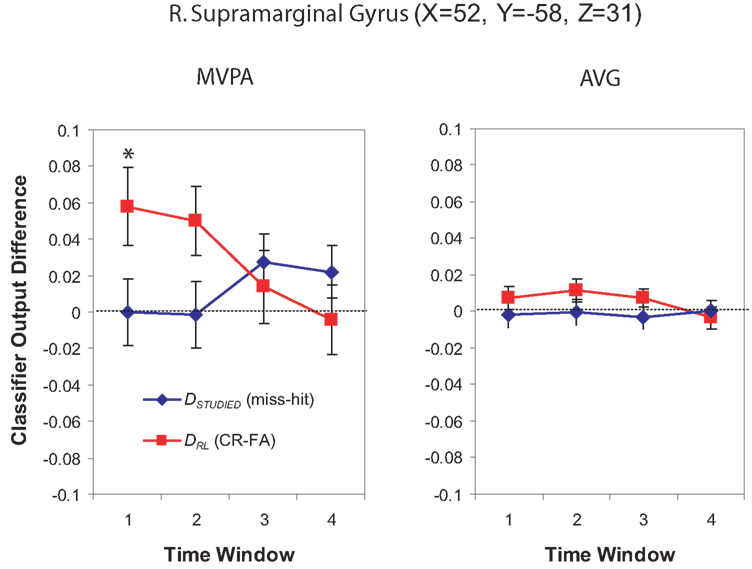
Figure 6. Classifier output as a function of recognition behavior in the right supramarginal gyrus/BA 40 for four time windows around the trial onset. The values shown here were computed by averaging classifier output from all of the spheres belonging to the cluster. The left panel shows MVPA results and the right panel shows AVG results. Each panel shows DRL (the classifier output difference for related-lure correct rejections vs. false alarms) in red and DSTUDIED (the classifier output difference for studied-item misses vs. hits) in blue. For both measures, positive values indicate greater use of recollection (according to the classifier) for “no” responses (correct rejections and misses) than for “yes” responses (false alarms and hits). Asterisks indicate time windows where the relationship between classifier output and behavior was significant (according to the non-parametric statistical tests described in the text). Error bars show the standard error of the mean across subjects.
Window 2: 0–4 s post-stimulus-onset
Multi-voxel pattern analysis revealed a different significant region for Window 2 in the medial parietal–occipital junction, centered on the left cuneus/BA 18 and extending into the precuneus and posterior cingulate/BA 31 (see Figure 7). There were also two regions that were identified as significant by the AVG procedure but not MVPA. The AVG analysis revealed a significant cluster of spheres in left posterior medial temporal lobe centered on the left parahippocampal gyrus, and covering the left posterior hippocampus and caudate (see Figure 8). The AVG analysis also identified a significant cluster of spheres in left lingual gyrus/BA 19 (see Figure 9); the MVPA analysis showed a similar trend in this region, but the effect did not reach significance.
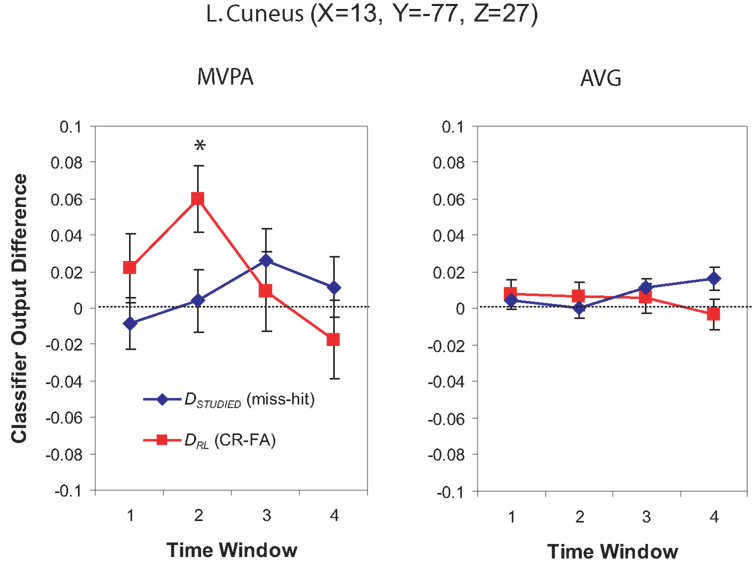
Figure 7. Classifier output as a function of recognition behavior in the left cuneus/precuneus region for four time windows around the trial onset, for the MVPA and AVG analyses. See the caption of Figure 6 for explanation of the plots.
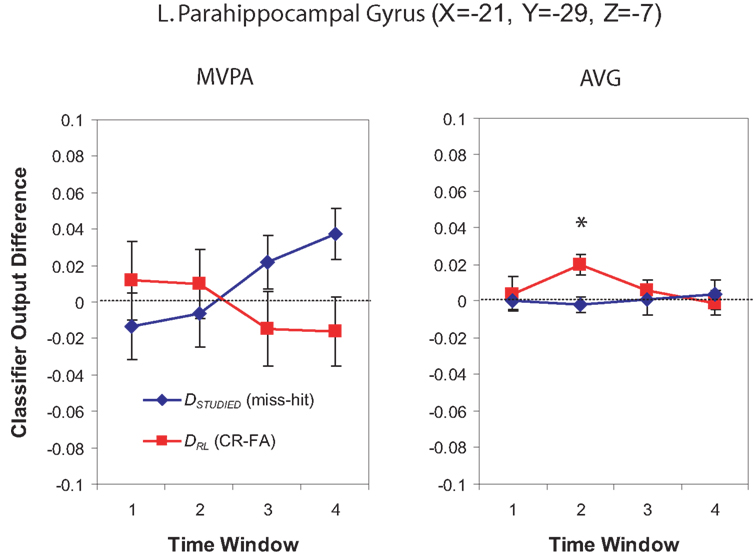
Figure 8. Classifier output as a function of recognition behavior in the left posterior parahippocampal region for four time windows around the trial onset, for the MVPA and AVG analyses. See the caption of Figure 6 for explanation of the plots.
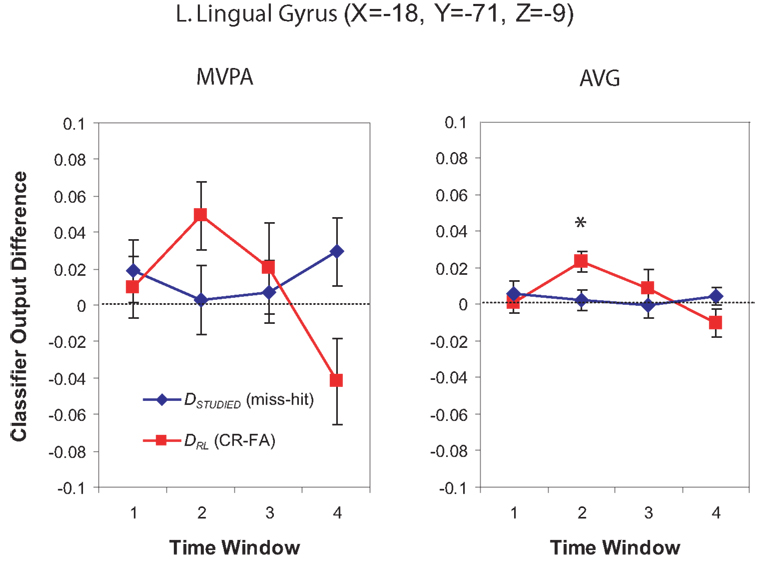
Figure 9. Classifier output as a function of recognition behavior in the left lingual gyrus for four time windows around the trial onset, for the MVPA and AVG analyses. See the caption of Figure 6 for explanation of the plots.
Window 3: 4–8 s post-stimulus-onset
For Window 3, MVPA revealed a significant cluster of spheres centered on the posterior end of the left middle temporal gyrus and extending into the parietal angular gyrus/BA 39 (see Figure 10). A visual inspection of the brain maps in Figure 4 reveals that this area is contralateral and inferior to the right temporal–parietal region found in the MVPA analysis in Window 1. The AVG analysis revealed a significant cluster of spheres for Window 3 in the middle frontal gyrus, across BA9 and BA8 (see Figure 11); the MVPA analysis showed a similar trend in this region, but the effect did not reach significance.
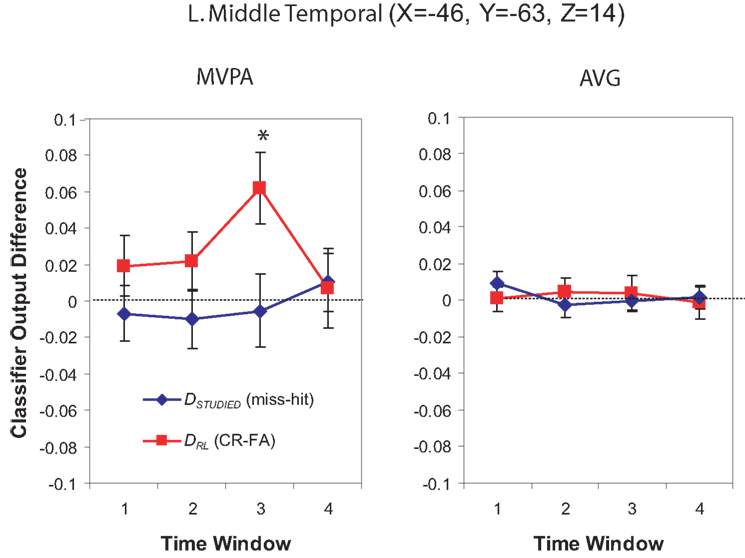
Figure 10. Classifier output as a function of recognition behavior in the left middle temporal gyrus for four time windows around the trial onset, for the MVPA and AVG analyses. See the caption of Figure 6 for explanation of the plots.
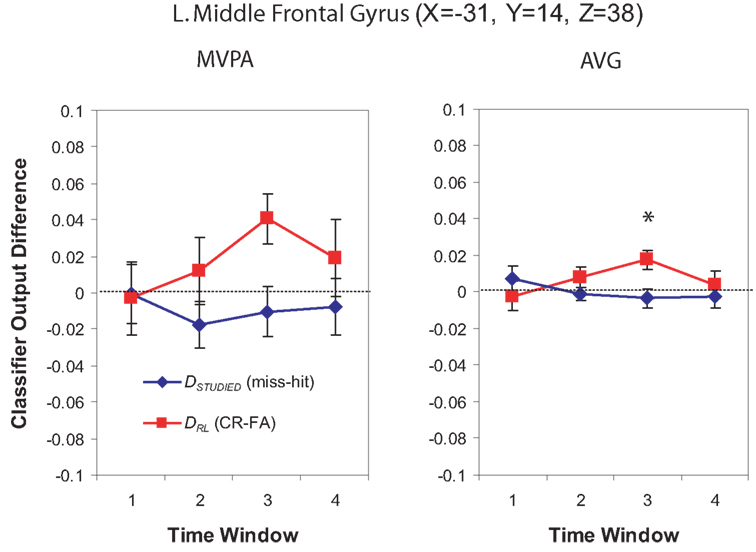
Figure 11. Classifier output as a function of recognition behavior in the left middle frontal gyrus for four time windows around the trial onset, for the MVPA and AVG analyses. See the caption of Figure 6 for explanation of the plots.
There were no significant results for Window 4 (8–12 s post-stimulus-onset).
Discussion
The goal of this study was to shed light on the neural mechanisms that support subjects’ strategic use of recollection vs. familiarity on recognition memory tests. In particular, we were interested in the idea that subjects could establish a top-down attentional state (“listening for recollection”) that fosters retrieval of studied details; we hypothesized that the intensity of this attentional state would fluctuate over the course of a recognition memory test, and that these fluctuations would be consequential for subjects’ recognition behavior. To localize brain regions involved in listening for recollection, we outlined two very specific criteria: First, the region should show different patterns of activity during Phase 1 when subjects were instructed to rely on recollection vs. familiarity; second, pre-stimulus fluctuations in these neural patterns during Phase 2 (indicating whether or not the subject was “listening for recollection” at that particular moment) should predict subjects’ responding to related lures, more so than responding to studied items. Our main result is that we found a region in the right TPJ (supramarginal gyrus/BA 40) that met both of these criteria in a statistically reliable fashion. To our knowledge, this is the first fMRI study to relate non-cued pre-stimulus activity to recognition behavior, and it is certainly the first to find regions where pre-stimulus activity selectively predicted responding to related lures.
Our use of MVPA methods was essential for finding this novel result, for two reasons: First, as discussed in the Section “Differences Between MVPA and AVG Analyses,” MVPA can detect subtle differences in the pattern of activity even when the average level of activity does not vary. In this experiment, it turns out that this extra sensitivity to pattern-wise differences was necessary to find the pre-stimulus effect. Second, MVPA allowed us to move beyond the confines of the cue-probe paradigm and study (in more natural circumstances) how subjects’ strategies vary. Instead of telling subjects which strategy to pursue on each trial during Phase 2 (as is the case in cue-probe paradigms), we let subjects choose how to strategically manage the plurals task on their own, and we used a pattern classifier (trained on Phase 1 data) to decode when subjects were trying to use recollection or familiarity. Put simply: MVPA helped us to gain insight into what subjects were thinking in situations where we were not telling them what to think.
In addition to the right supramarginal region that predicted behavior prior to stimulus onset, we also identified distinct sets of regions where activity after stimulus onset (but not before) was related to recognition behavior in the manner specified above. Interpreting activity in these regions is more complex – post-stimulus activity can be driven either by bottom-up recollection or top-down processes. One interpretation that fits with the observed data is that (at least some of) these regions are involved in deliberately performing the encoding task again at test. In this study, the encoding task involved forming a mental image of the studied item and judging whether it would fit into a shoebox; at test, subjects can perform this same mental imagery task on the test word. Retrieval success is a function of the match between mental activity at study and at test (Tulving and Thomson, 1973); as such, performing the same mental imagery task at study and at test should boost the odds of recollection (for additional discussion of this idea, see Jacoby et al., 2005; McDuff et al., 2009). The behavioral signature of using this kind of mental imagery strategy should be the same as the behavioral signature of “listening for recollection” in the pre-stimulus interval: That is, use of this strategy should have a large effect on responding to related lures (insofar as it influences the probability of recollection, and recollection is needed to reject these lures), and it should have a much smaller effect on responding to studied items (insofar as studied items can often be called “old” based on familiarity if recollection does not occur). Notably, the areas identified in our Windows 2 and 3 analyses (both MVPA and AVG) have all been linked to mental imagery in prior work. Imagery-sensitive activity has been reported in left precuneus, dorsal occipital cortex and middle frontal gyrus (e.g., Ishai et al., 2000; Ganis et al., 2004). Also, recent studies have found activity in the parahippocampal gyrus when subjects generated episodic autobiographical images (Gardini et al., 2006) and when subjects were instructed to think about just-seen (but no longer present) scenes (Johnson et al., 2007).
Parietal Lobe Contributions to Memory
Several researchers have argued that ventral parietal regions play a key role in supporting recollection (see Vilberg and Rugg, 2008 for a review). Our results provide general support for this claim: We identified ventral parietal regions that were significantly informative regarding subjects’ use of recollection in both our Windows 1 and 3 MVPA analyses. The right TPJ region that we identified in Window 1 is close to the center of mass of the recollection-related regions reviewed by Vilberg and Rugg. However, as Vilberg and Rugg point out, left-lateralized recollection activations are more commonly found than right-lateralized activations. The regions identified by our Window 3 MVPA analysis (left middle temporal gyrus, extending to the angular gyrus) are somewhat more ventral than the center of mass of the left-lateralized recollection regions identified by Vilberg and Rugg (2008), but they fall within the spatial distribution of regions identified in previous studies. For example, Yonelinas et al. (2005), Daselaar et al. (2006), and Montaldi et al. (2006) all reported temporal–parietal activity for recollection-related contrasts that appear to overlap with the Window 3 MVPA region we report here.
Another prominent account of parietal contributions to memory is the attention to memory hypothesis set forth by Cabeza et al. (2008). This theory makes the specific claim that dorsal parietal cortex subserves top-down attention to memory signals, whereas ventral parietal regions are involved in bottom-up attention to recollected information. Our results appear to be inconsistent with a strict version of this hypothesis: The Window 1 right supramarginal region that we associated with top-down “listening for recollection” is located inferior to regions implicated by Cabeza et al. (2008) as participating in top-down attention to memory (intraparietal sulcus and superior parietal lobule). When interpreting this discrepancy, it is important to note that none of the fMRI studies reviewed by Cabeza et al. (2008) used a plurality recognition paradigm, and none of them used MVPA. Most importantly, none of these prior studies looked for the specific relationship between neural activity and behavior that we were looking for in our study (i.e., brain areas where pre-stimulus activity was more informative regarding related-lure responses than studied-item responses). Any one of the aforementioned differences in task characteristics and analysis procedures may account for our finding a different set of parietal regions than those specified by Cabeza et al. (2008). In the Supplementary Material, we report the results of standard GLM contrasts applied to Phase 1 and Phase 2 data; these analyses show canonical parietal recollection effects (e.g., when comparing hits to unrelated-lure correct rejections in Phase 2). The fact that we obtained standard parietal effects when we used standard GLM contrasts suggests that there is nothing unusual about our data per se, and that novel aspects of our results are most likely attributable to novel aspects of our analysis procedure.
Medial Temporal Lobe Regions
We did not observe any significant sphere clusters in the medial temporal lobe in our MVPA analysis; however, in Window 2, the AVG variant of the analysis procedure detected a significant sphere cluster in left posterior MTL (for discussion of why this was detected by AVG but not MVPA methods, see Section “Differences Between MVPA and AVG Analyses”). Our Phase 2 GLM analysis (described in the Supplementary Material) also identified this area as showing a greater stimulus-evoked BOLD response to both hits and related-lure correct rejections than to related-lure false alarms. These results fit with Kirwan and Stark’s (2007) finding that left posterior parahippocampal cortex showed greater responding to related-lure correct rejections (and hits) than related-lure false alarms. Note that, if activity in this region purely reflected bottom-up recollection, we would also expect greater activity for hits than misses, but this is not what we found – the average level of activity was similar for hits and misses (see Figure 8, right-hand panel). As discussed earlier, our preferred interpretation of these results is that left posterior parahippocampal cortex was engaged when subjects deliberately attempted to reinstate mental images from the study phase in an attempt to foster recollection. This interpretation explains why activity in this region was related to subjects’ responses in the related lure condition (where correct responding depends critically on recollection) but not subjects’ responses in the studied-item condition (where correct responding can be based on either familiarity or recollection).
Prefrontal Cortex
Several studies have found that PFC is engaged when subjects are preparing to recollect specific details and also when recollection actually occurs (for a review, see Simons, 2009). For example, Dobbins and Han (2006) used a cue-probe paradigm where (on each trial) they cued subjects as to whether they would be performing a recollection-based source memory task or a simple recency judgment that could be supported by familiarity; this cue was followed (a few seconds later) by the to-be-judged stimuli. Dobbins and Han (2006) found a set of frontal regions that were differentially activated by the source memory task cue (vs. the recognition task cue), and another set of frontal regions that showed a greater response to the probe (to-be-judged) stimuli on source vs. recognition trials. In our study, we observed an informative region in PFC post-stimulus-onset (in Window 3) that overlaps with the probe-related PFC activation observed by Dobbins and Han (2006). However, in our study, there were no significantly informative PFC regions in the pre-stimulus window. Thus, our results confirm prior work showing stimulus-evoked PFC responses related to recollection, but they do not confirm prior findings showing anticipatory PFC activation (Dobbins and Han, 2006). One way to reconcile these findings is to posit that PFC plays a more important role in “listening for recollection” when subjects are specifically cued to use recollection on a particular trial, compared to situations (like Phase 2 of our paradigm) where subjects are not given specific cues regarding which strategy to use.
Differences Between MVPA and AVG Analyses
The MVPA and AVG variants of our analysis procedure give us an opportunity to assess the advantages and disadvantages of looking at multi-voxel patterns (vs. averaging across voxels in a region). MVPA was more successful at detecting meaningful patterns of pre-trial (i.e., Window 1) activity than the AVG analysis. This difference in sensitivity is not an artifact of our choice of sphere size – we ran follow-up analyses where we varied the size of the spheres used in the AVG analysis (see Supplementary Material for results using 1-voxel-radius spheres and single voxels) and these follow-up analyses also did not show any significant regions during Window 1. As another follow-up, we ran a mass-univariate analysis that directly contrasted average Window 1 activity for related-lure false alarms vs. correct rejections (and also for studied-item hits vs. misses) – this analysis, like the AVG analysis, failed to find a relationship between pre-trial activity and behavior (see Supplementary Material for details).
Importantly, MVPA was not uniformly more sensitive than the AVG analysis; there were several regions that were significant in the AVG analysis but not in the MVPA analysis (left MTL and occipital regions during Window 2 and left dorsolateral prefrontal cortex during Window 3). The main benefit of MVPA is that it can discriminate between complex high-spatial-frequency patterns within a region, even if the overall level of activity is the same. However, the added complexity of MVPA makes it more prone to (over-)fit noise in the training set, which can hurt the classifier’s ability to generalize to Phase 2 data. If the cognitive process of interest affects the overall level of activity in a region, and the spatial extent of the neural effect is well-matched to the size of the AVG sphere, then the AVG analysis variant should do better than MVPA at generalizing to Phase 2 data (because the AVG variant has fewer degrees of freedom, and thus is less likely to overfit the data).
We can gain additional insight into differences between the AVG and MVPA analyses by comparing the significant AVG effects shown in Figures 8, 9, and 11 to the significant MVPA effects shown in Figures 6, 7, and 10. On the whole, the AVG effects were associated with smaller mean values of DRL and less variability (smaller error bars) than the MVPA effects. This pattern illustrates two key points that were made by Kriegeskorte et al. (2006) and Norman et al. (2006): Averaging across nearby voxels reduces noise in the output of the classifier, but it also eliminates signal that is present in high-spatial-frequency patterns. The reduction in noise explains why error bars were smaller in the AVG analysis, and the loss of signal explains why DRL values were smaller in the AVG analysis.
Alternative Interpretations
Our preferred interpretation of the pre-stimulus supramarginal gyrus effect is that – in this region – the classifier is tracking an internally directed attentional state (“listening for recollection”). Here, we consider alternative explanations for this result – are there other cognitive states that the classifier might be tracking, instead of internally directed attention? Any alternative explanation must meet the following criteria: (1) The cognitive state in question should differ in strength across recollection and familiarity blocks during Phase 1, so the classifier can learn to detect the cognitive state; (2) pre-stimulus fluctuations in the cognitive state should selectively predict responding to related lures (not to studied items) during Phase 2.
It is not difficult to think of factors, other than use of recollection per se, that differed across the recollection and familiarity blocks in Phase 1. As reported in the results section, there were differences in response bias: Subjects responded more liberally (i.e., they were more likely to say “old”) in familiarity blocks than in recollection blocks during Phase 1. There were also differences in reaction time; subjects spent less time generating their responses in familiarity blocks. Finally, several researchers have argued that use of recollection is more effortful than use of familiarity (e.g., Grupposo et al., 1997); as such, it seems likely that subjects were expending more mental effort overall in recollection blocks than in familiarity blocks. In principle, when we trained the classifier to discriminate between recollection and familiarity blocks in Phase 1, the classifier could have learned to detect one of these factors (response bias, reaction time, or generalized mental effort) instead of factors related more directly to recollection.
To evaluate these alternative explanations, we can assess how well they can account for the observed relationship between classifier activity and behavior in Phase 2. With regard to the response bias hypothesis: If the classifier is tracking response bias, then fluctuations in classifier activity should be associated with fluctuations in the subject’s overall tendency to call items “old” (regardless of stimulus condition). Contrary to this view, classifier activity in the supramarginal gyrus region (and all of the other regions listed in Tables 2 and 3) was selectively associated with behavioral responding to related lures, and not to studied items – the selectivity of this association allows us to rule out a simple response bias interpretation of classifier activity in these regions.
With regard to the reaction time hypothesis: The proposal here is that the classifier is somehow tracking the process of responding to the stimulus. This hypothesis can not explain the relationship between pre-stimulus activity and behavior in Phase 2 (since the pre-stimulus interval comes before subjects initiate their response).
The mental effort hypothesis is more difficult to rule out. If (as hypothesized above) attention to recollected information covaries strongly with generalized mental effort in this experiment, then these factors can not be teased apart using the current design. The only way to definitively tease apart “attention to memory” from generalized mental effort would be to run follow-up experiments where we contrast memory-related mental effort with other (non-mnemonic) types of mental effort. Importantly, this interpretive issue does not impugn our basic claim that – in this experiment – pre-stimulus fluctuations in the activity of supramarginal regions were associated with fluctuations in subjects’ use of recollection (the only question is whether we interpret these fluctuations as changes in mental effort or changes in internally-directed attention).
As a final note, we should acknowledge that the concept of internally-directed attention (as we have used it in this paper) requires further specification. We have described internally-directed attention as a process that amplifies the recollective signal coming out of the hippocampus, but we have not described the precise mechanism that would give rise to this outcome. One possibility is that internally-directed attention acts directly on the hippocampus to increase the likelihood that the hippocampus will generate a recollective signal; another possibility is that internally-directed attention increases the gain in other regions that are “downstream” of the hippocampus (so they are more likely to respond if the hippocampus generates a recollective signal). Further experimentation is needed to tease apart these different accounts.
Summary
Using MVPA, we found a right supramarginal brain region that met our detailed criteria for being involved in “listening for recollection”: Activity in this region during the pre-stimulus period selectively predicted responding to related lures. We also found other regions where activity during the post-stimulus period (but not the pre-stimulus period) was related to subjects’ responding to related lures. These results illustrate how MVPA can shed new light on the neural mechanisms that support the strategic use of recollection vs. familiarity.
Conflict of Interest Statement
The authors declare that the research was conducted in the absence of any commercial or financial relationships that could be construed as a potential conflict of interest.
Acknowledgment
This research was supported by NIH R01 MH069456 awarded to Kenneth A. Norman.
Supplementary Material
The Supplementary Material for this article can be found online at http://www.frontiersin.org/humanneuroscience/paper/10.3389/fnhum.2010.00061
References
Buckner, R. L., Andrews-Hanna, J. R., and Schacter, D. L. (2008). The brain’s default network: anatomy, function, and relevance to disease. Ann. N. Y. Acad. Sci. 1124, 1–38.
Cabeza, R. (2008). Role of parietal regions in episodic memory retrieval: the dual attentional processes hypothesis. Neuropsychologia 7, 1813–1827.
Cabeza, R., Ciaramelli, E., Olson, I. R., and Moscovitch, M. (2008). The parietal cortex and episodic memory: an attentional account. Nat. Rev. Neurosci. 9, 613–625.
Ciaramelli, E., Grady C. L., and Moscovitch M. (2008). Top-down and bottom-up attention to memory: a hypothesis (AtoM) on the role of the posterior parietal cortex in memory retrieval. Neuropsychologia 46, 1828–1851.
Cox, R. W. (1996). AFNI: software for analysis and visualization of functional magnetic resonance neuroimages. Comput. Biomed. Res. 29, 162–173.
Dale, A. M. (1999). Optimal experimental design for event-related fMRI. Hum. Brain Mapp. 8, 109–114.
Daselaar, S. M., Fleck, M. S., and Cabeza, R. (2006). Triple dissociation in the medial temporal lobes: recollection, familiarity and novelty. J. Neurophys. 96, 1902–1911.
Detre, G. J., Polyn, S. M., Moore, C. D., Natu, V. S., Singer, B. D., Cohen, J. D., Haxby, J. V., and Norman, K. A. (2006). “The multi-voxel pattern analysis (MVPA) toolbox,” in Annual Meeting of the Organization of Human Brain Mapping, June 11–15, 2006, Florence, Italy.
Dobbins, I., and Han, S. (2006). Cue- versus probe-dependent prefrontal cortex activity during contextual remembering. J. Cogn. Neurosci. 18, 1439–1452.
Dobbins, I. G., Rice, H. J., Wagner, A. D., and Schacter, D. L. (2003). Memory orientation and success: separable neurocognitive components underlying episodic recognition. Neuropsychologia 41, 318–333.
Ganis, G., Thompson, W. L., and Kosslyn, S. M. (2004). Brain areas underlying visual mental imagery and visual perception: an fMRI study. Cogn. Brain Res. 20, 226–241.
Gardiner. J. M., and Java, R. (1988). Functional aspects of recollective experience. Mem. Cogn. 16, 309–313.
Gardini, S., Cornoldi, C. De Beni, R., and Venneri, A. (2006). Left mediotemporal structures mediate the retrieval of episodic autobiographical mental images. Neuroimage 30, 645–655.
Gronlund, S., and Ratcliff, R. (1989). Time course of item and associative information: implications for global memory models. J. Exp. Psychol. Learn. Mem. Cogn. 15, 846–858.
Grupposo, V., Lindsey, D. S., and Kelley, C. M. (1997). The process-dissociation procedure and similarity: defining and estimating recollection and familiarity in recognition memory. J. Exp. Psychol. Learn. Mem. Cogn. 23, 259–278.
Hastie, R., Tibshirani, R., and Friedman, J. (2001). The Elements of Statistical Learning. New York: Springer.
Haynes, J., and Rees, G. (2006). Decoding mental states from brain activity in humans. Nat. Rev. Neurosci. 7, 523–534.
Haynes, J., Sakai, K., Rees, G., Gilbert, S., Frith, C., and Passingham, R. E. (2007). Reading hidden intentions in the human brain. Curr. Biol. 17, 323–328.
Hintzman, D. L., and Curran, T. (1994). Retrieval dynamics of recognition and frequency judgments – evidence for separate processes of familiarity and recall. J. Mem. Lang. 33, 1–18.
Hintzman, D. L., Curran, T., and Oppy, B. (1992). Effects of similarity and repetition on memory: registration without learning? J. Exp. Psychol. Learn. Mem. Cogn. 18, 667–680.
Ishai, A., Ungerleider, L. G., and Haxby, J. V. (2000). Distributed neural systems for the generation of visual images. Neuron 28, 979–990.
Jacoby, L. L., Shimizu, Y., Daniels, K. A., and Rhodes, M. G. (2005). Modes of cognitive control in recognition and source memory: depth of retrieval. Psychon. Bull. Rev. 12, 852–857.
Johnson, J. D., McDuff. S. G. R., Rugg, M. D., and Norman. K. A. (2009). Recollection, familiarity, and cortical reinstatement: a multivoxel pattern analysis. Neuron 63, 697–708.
Johnson, M. R., Mitchell, K. J., Raye, C. L., D’Esposito, M., and Johnson, M. K. (2007). A brief thought can modulate activity in extrastriate visual areas: top-down effects of refreshing just-seen visual stimuli. Neuroimage 37, 290–299.
Kahn, I., Davachi, L., and Wagner, A. D. (2004). Functional-neuroanatomic correlates of recollection: implications for models of recognition memory. J. Neurosci. 24, 4172–4180.
Kirwan, C. B., and Stark C. E. L. (2007). Overcoming interference: an fMRI investigation of pattern separation in the medial temporal lobe. Learn. Mem. 14, 625–633.
Kriegeskorte, N., Goebel, R., and Bandettini, P. (2006). Information-based functional brain mapping. Proc. Natl. Acad. Sci. U.S.A. 103, 3863–3868.
Macmillan, N. A., and Creelman, D. C. (2005). Detection Theory: A User’s Guide, 2nd Edn. Mahwah, NJ: Lawrence Erlbaum Associates.
Malmberg, K. J. (2008). Recognition memory: a review of the critical findings and an integrated theory for relating them. Cogn. Psychol. 57, 335–384.
Malmberg, K. J., Holden, J. E., and Shiffrin, R. M. (2004). Modeling the effects of repetitions, similarity, and normative word frequency on old-new recognition and judgments of frequency. J. Exp. Psychol. Learn. Mem. Cogn. 30, 319–331.
Malmberg, K. J., and Xu, J. (2007). On the flexibility and the fallibility of associative memory. Mem. Cogn. 35, 545–556.
McDuff, S. G. R., Frankel, H. C., and Norman, K. A. (2009). Multivoxel pattern analysis reveals increased memory targeting and reduced use of retrieved details during single-agenda source monitoring. J. Neurosci. 29, 508–516.
Montaldi, D., Spencer, T. J., Roberts, N., and Mayes, A. R. (2006). The neural system that mediates familiarity memory. Hippocampus 16, 504–520.
Nichols, T., and Hayasaka, S. (2003). Controlling the familywise error rate in functional neuroimaging: a comparative review. Stat. Methods Med. Res. 12, 419–446.
Norman, K. A, Polyn, S. M., Detre G. J., and Haxby, J. V. (2006). Beyond mind-reading: multi-voxel pattern analysis of fMRI data. Trends Cogn. Sci. 10, 424–430.
Polyn, S. M., Natu, V. S., Cohen, J. D., and Norman, K. A. (2005). Category-specific cortical activity precedes retrieval during memory search. Science 310, 1963–1966.
Quamme, J. R., Yonelinas, A. P., and Norman, K. A. (2007). Effect of unitization on associative recognition in amnesia. Hippocampus 17, 192–200.
Rotello, C., and Heit, E. (1999). Two-process models of recognition memory: evidence for recall-to-reject? J. Mem. Lang. 40, 432–453.
Rotello, C., and Heit, E. (2000). Associative recognition: a case of recall-to-reject processing. Mem. Cogn. 28, 907–922.
Rotello, C., Macmillan, N. A., and Van Tassel, G. (2000). Recall-to-reject in recognition: evidence from ROC curves. J. Mem. Lang. 43, 67–88.
Simons, J. S. (2009). “Constraints on cognitive theory from neuroimaging studies of source memory,” in Neuroimaging of Human Memory: Linking Cognitive Process to Neural Systems, eds F. Roesler, C. Ranganath, B. Roder, and R. H. Kluwe (New York: Oxford University Press), 405–426.
Skinner. E. I., and Fernandes, M. A. (2007). Neural correlates of recollection and familiarity: a review of neuroimaging and patient data. Neuropsychologia 45, 2163–2179.
Talairach, J., and Tournoux, P. (1988). Co-Planar Stereotaxic Atlas of the Human Brain: 3-Dimensional Proportional System – An Approach to Cerebral Imaging. New York: Thieme.
Tulving, E., and Thomson, D. M. (1973). Encoding specificity and retrieval processes in episodic memory. Psychol. Rev. 80, 352–373.
Vilberg, K. L., and Rugg, M. D. (2008). Memory retrieval and the parietal cortex: a review of evidence from a dual-process perspective. Neuropsychologia 46, 1787–1799.
Wagner, A. D., Shannon, B. J., Kahn, I., and Buckner. R. L. (2005). Parietal lobe contributions to episodic memory retrieval. Trends Cogn. Sci. 9, 445–453.
Yonelinas, A. P. (2002). The nature of recollection and familiarity: a review of 30 years of research. J. Mem. Lang. 46, 441–517.
Keywords: episodic memory, fMRI, pattern classification, long-term memory
Citation: Quamme JR, Weiss DJ and Norman KA (2010) Listening for recollection: a multi-voxel pattern analysis of recognition memory retrieval strategies. Front. Hum. Neurosci. 4:61. doi: 10.3389/fnhum.2010.00061
Received: 30 March 2010;
Paper pending published: 23 April 2010;
Accepted: 13 July 2010;
Published online: 13 August 2010
Edited by:
Neal J. Cohen, University of Illinois, USAReviewed by:
Alison Preston, The University of Texas at Austin, USACraig Stark, University of California at Irvine, USA
Copyright: © 2010 Quamme, Weiss and Norman. This is an open-access article subject to an exclusive license agreement between the authors and the Frontiers Research Foundation, which permits unrestricted use, distribution, and reproduction in any medium, provided the original authors and source are credited.
*Correspondence: Kenneth A. Norman, Department of Psychology, Princeton University, Green Hall, Washington Road, Princeton, NJ 08540, USA. e-mail: knorman@princeton.edu