Neural correlates of learning to attend
- 1 Center for Mind and Brain, University of California at Davis, Davis, CA, USA
- 2 Department of Psychological and Brain Sciences, Johns Hopkins University, Baltimore, MD, USA
Recent work has shown that training can improve attentional focus. Little is known, however, about how training in attention and multitasking affects the brain. We used functional magnetic resonance imaging (fMRI) to measure changes in cortical responses to distracting stimuli during training on a visual categorization task. Training led to a reduction in behavioral distraction effects, and these improvements in performance generalized to untrained conditions. Although large regions of early visual and posterior parietal cortices responded to the presence of distractors, these regions did not exhibit significant changes in their response following training. In contrast, middle frontal gyrus did exhibit decreased distractor-related responses with practice, showing the same trend as behavior for previously observed distractor locations. However, the neural response in this region diverged from behavior for novel distractor locations, showing greater activity. We conclude that training did not change the robustness of the initial sensory response, but led to increased efficiency in late-stage filtering in the trained conditions.
Introduction
Though the study of attention is as old as modern psychology (James, 1890), there has been comparatively little examination of the effects of learning on attention. Previous studies have focused on tasks that produced strong memories for, and automatic identification of, target objects and locations (e.g., Schneider and Shiffrin, 1977; Shiffrin and Schneider, 1977; Chun, 2000), and so did not investigate improvements in attentional processes per se (though see Brown and Fera, 1994, for an early example). Interest in learning to attend has increased recently (Tang and Posner, 2009), and studies have revealed that learning can lead to enhanced temporal allocation of attention (Makovski et al., 2008) and increased efficiency in filtering task-irrelevant visual features (Dixon et al., 2009). Attentional learning can also come about through experience with outside tasks, such as video games (e.g., Dye et al., 2009).
We recently reported that training can reduce the behavioral cost of distraction (Kelley and Yantis, 2009). Subjects performed an attentionally demanding visual categorization task. Response times (RTs) were initially slowed when an abrupt onset distractor (Yantis and Jonides, 1990) was also present; this slowing was dramatically attenuated after repeated exposure to the distracting items. These practice effects developed quickly when the distractors were highly regular in appearance, but did not transfer to new task conditions. In contrast, practice effects developed more slowly when distractors were highly variable in appearance, but transferred more effectively to new conditions. Dixon et al. (2009) reported similar results for learning to ignore specific object features. These findings corroborate earlier studies of skill learning showing that conditions producing sub-optimal performance during practice also led to more general improvements in post-training performance (reviewed in Schmidt and Bjork, 1992).
There are several possible neural mechanisms that might underlie this improvement in performance. It is possible that sensory adaptation could lead to reduced activity in visual processing regions, leading to reduced interference (though the task parameters make this unlikely, as discussed in the previous study; Kelley and Yantis, 2009). Alternately, observers’ ability to voluntarily down-regulate the early sensory representation of the distracting stimuli may improve with learning. Several studies have shown that the allocation of visuospatial attention modulates activity in early visual cortex without regard to the specific stimulus content (e.g., Moran and Desimone, 1985; Kastner and Ungerleider, 2001; Giesbrecht et al., 2003; Serences et al., 2004; Kelley et al., 2008). Such changes in visual cortex would most like co-occur with changes in fronto-parietal cortex associated with visuospatial attention.
Improved allocation of spatial attention could result in different changes in activity across the brain. A network of dorsal (e.g., Kastner and Ungerleider, 2000; Culham and Kanwisher, 2001; Corbetta and Shulman, 2002; Moore et al., 2003; Serences and Yantis, 2006) and ventral (de Fockert et al., 2004; Kincade et al., 2005; Serences et al., 2005) brain regions in parietal and frontal cortex are thought to be responsible for goal-directed and stimulus-driven attentional control, respectively. If attention is more successfully focused on the main task so that distractors were not noticed, visual cortex activity would decrease, leading to a reduced response from ventral fronto-parietal regions. But if behavior improved due to improved re-allocation following stimulus-driven capture, then changes in activity might be limited to the dorsal network. Similarly, improvements in performance resulting from a reduction in late-stage processing by stimulus-driven ventral regions might only manifest as changes in these regions, with visual regions and dorsal fronto-parietal regions showing unchanged activity.
We measured changes in cortical activity using functional magnetic resonance imaging (fMRI) while participants carried out an attentionally demanding behavioral task in which they learned to ignore distraction (Kelley and Yantis, 2009). We observed changes in activity related to reductions in distractor interference in middle frontal gyrus (MFG), but not in early retinotopically organized regions of visual cortex. This result suggests that performance improvements arose due to changes in the ventral attentional control network.
Materials and Methods
Subjects
Twenty subjects (11 male, aged 18–31) were recruited from the Johns Hopkins community. All subjects provided informed consent as approved by the Johns Hopkins Medicine Institutional Review Board. Three subjects (1 male) were excluded from the final analysis because of excessive head motion during the scanning session. Subjects were compensated for their participation at a flat rate plus a bonus based on their performance during the scan.
Stimuli
The stimuli and task were the same as those described in Experiment 4 of Kelley and Yantis (2009), and are depicted in Figure 1. Experiments were run on Intel-based computers running Windows 2000 or Windows XP. Stimuli were generated using Matlab software (MathWorks, Natick, Massachusetts) running the Psychophysics Toolbox (v 2.54; Peli, 1997; Brainard, 1997; ). Stimuli consisted of a 5 × 5 array of red and green dots, centered in the middle of the display. Each dot was ∼0.6° in diameter, and the entire array subtended a square of ∼5.2° by 5.2°. The dots could either be red (Matlab RGB value: 255 0 0) or green (Matlab RGB value: 0 225 0) in color; there were always 10 dots of one color and 15 of the other. On half of all trials a distractor appeared in a variable location around the dot array, adjacent to one of the four corners of the array. The distractors were scaled to fit within a square that was 10.4° per side; the center to center distance between the distractors and the array was 11.7°. These distractors consisted of color and grayscale images of faces, animals, buildings, objects and abstract patterns. On each trial, the array was presented for 100 ms, and was followed by a 2.4 s response interval. On trials where the distractor was present, it appeared 100 ms prior to the array onset, and remained visible for as long as the dot array. During practice sessions prior to scanning, stimuli were shown on an LCD display screen from an approximate distance of 40 cm. During imaging sessions, stimuli were projected onto a screen mounted at the end of the scanner bore and viewed using a mirror mounted above the head coil. Viewing distance was 67.5 cm.
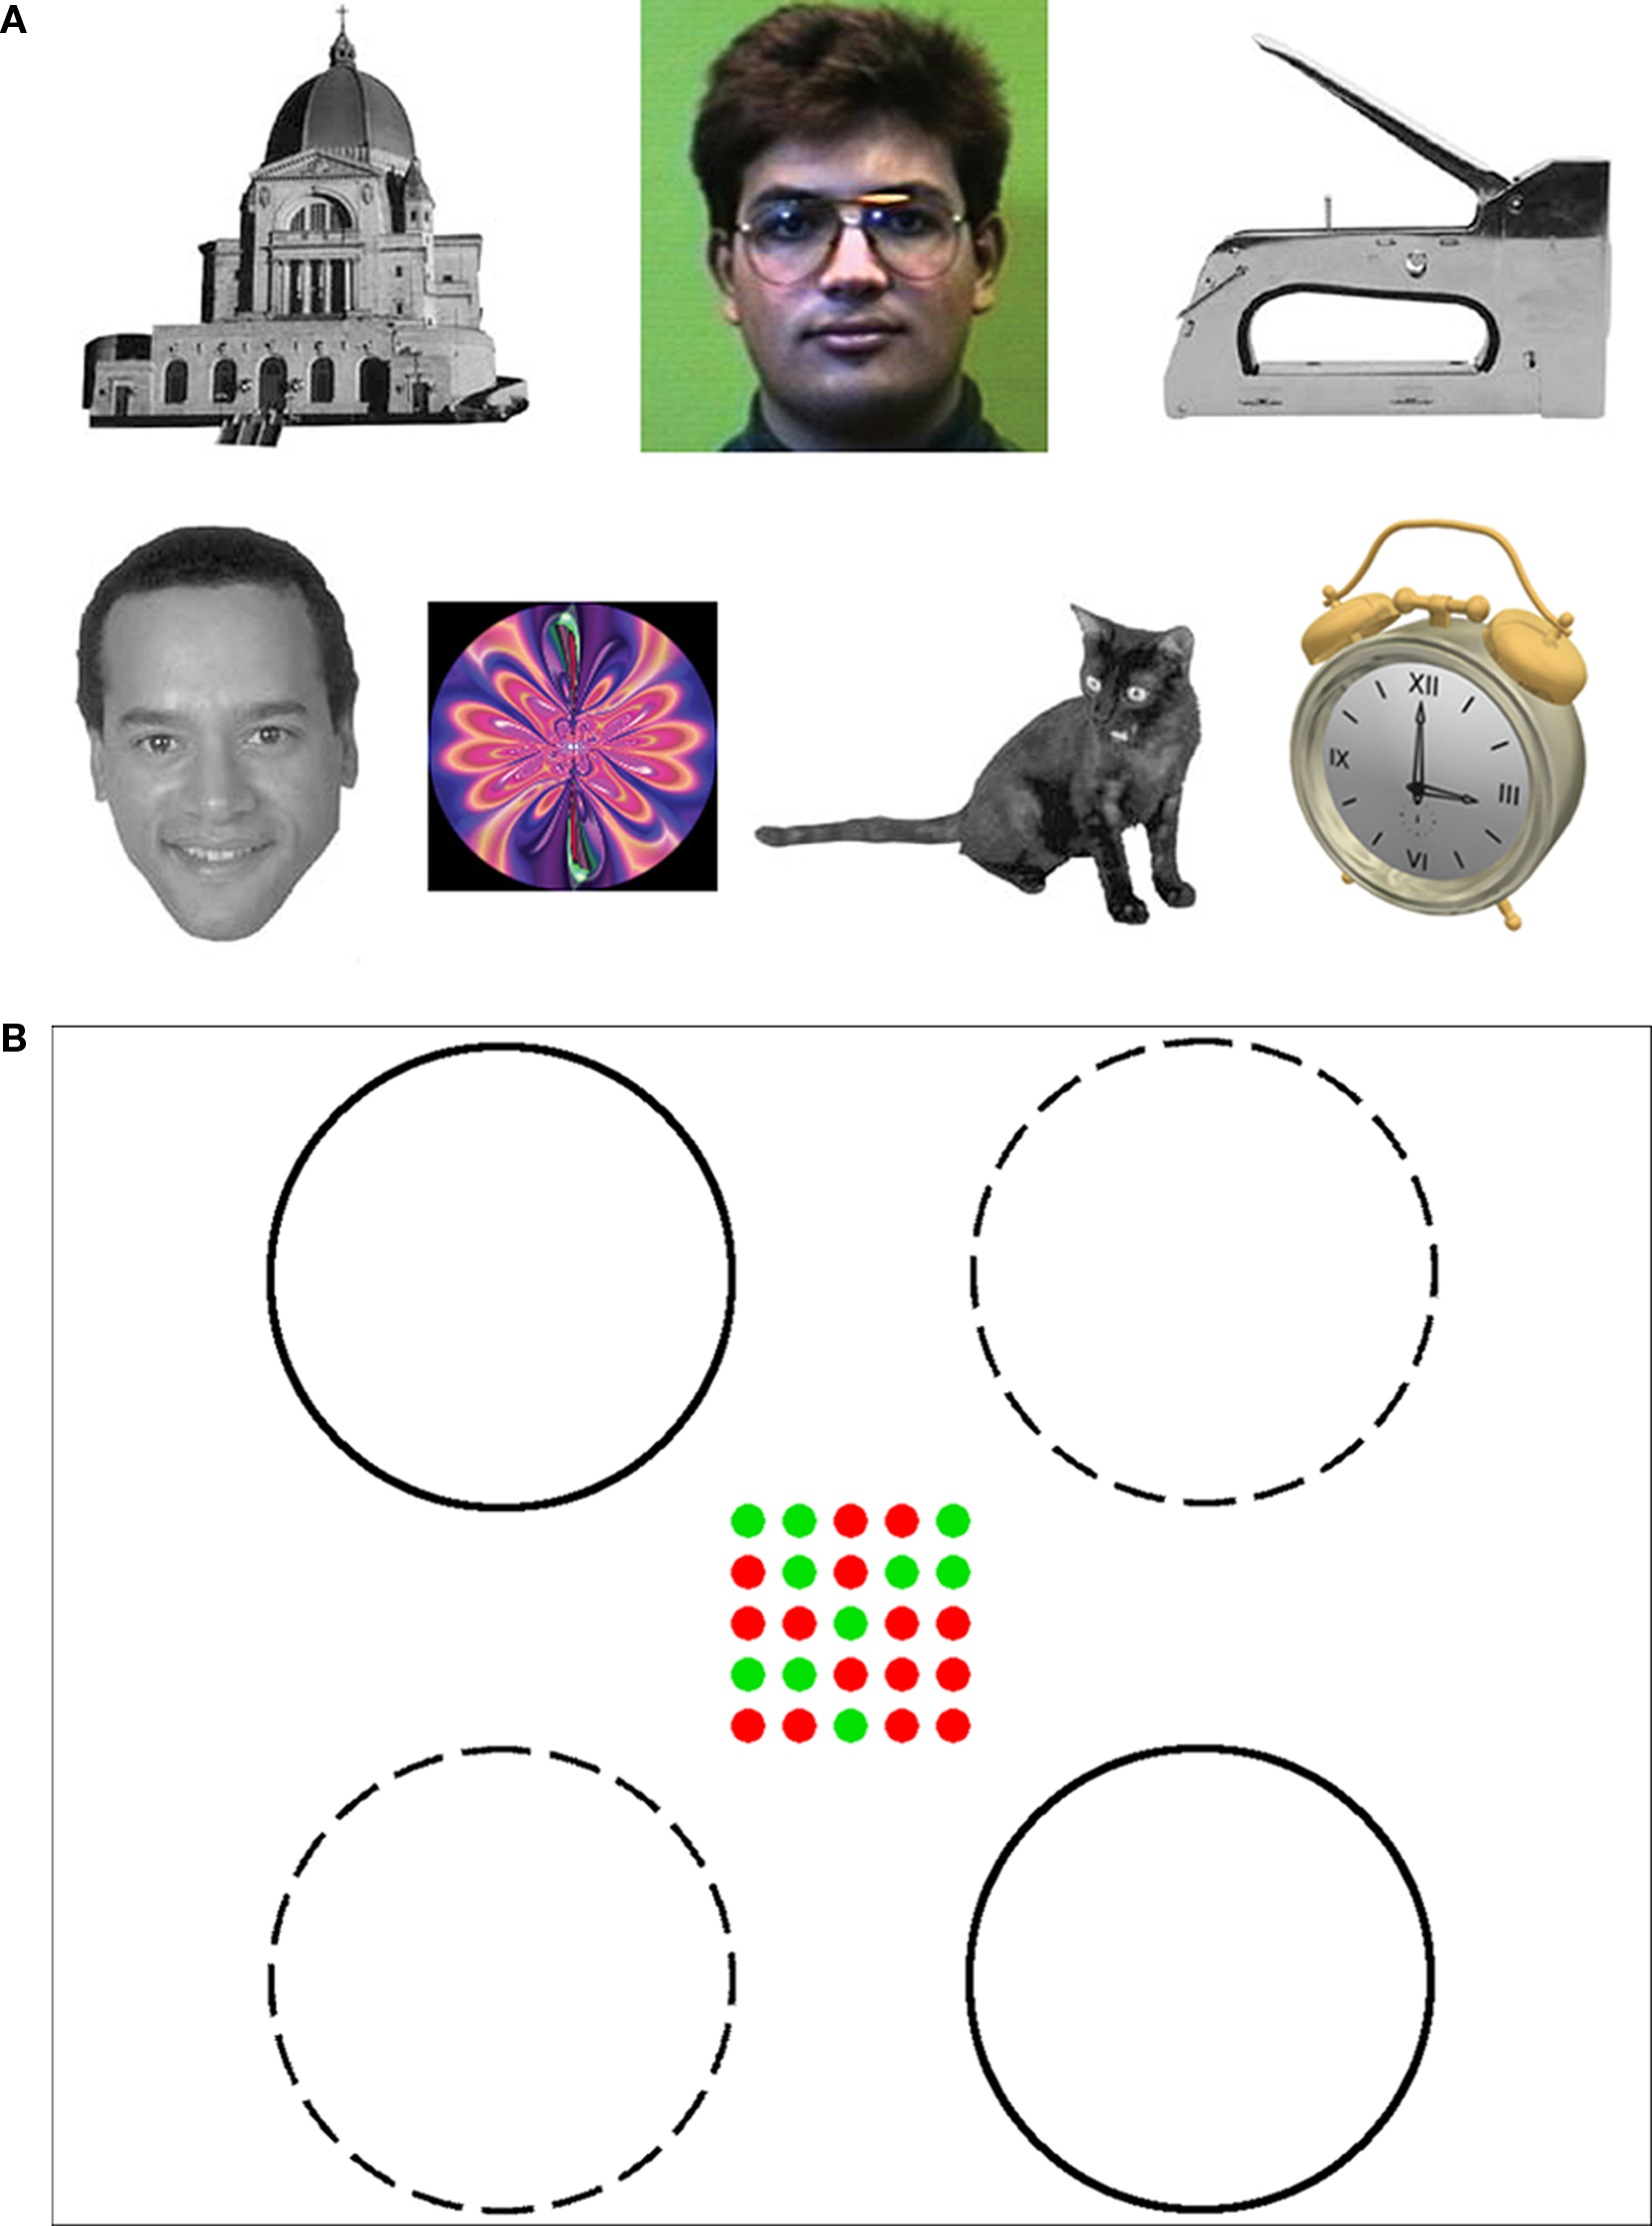
Figure 1. (A) Examples of the images used as distractors. (B) Task stimuli and locations in which the distractors could appear (circles were not present in the display during the experiment). Subjects were asked to identify whether there were more red or green dots in the 5 × 5 grid. Distractors appeared on 50% of the trials. For Blocks 1–6, distractors could appear in one of the two locations indicated by solid circles (old locations). For Blocks 7 and 8, distractors could appear in one of the old locations, or in one of the locations indicated by the dashed circles (new locations).
The distractor images came from the following sources: Grayscale faces, buildings, objects and animals taken from Hemera Photo-Objects 50,000, vol. II (Dundas Software, Ltd., 2000); Color faces taken from the faces94 set provided by Dr. Libor Spacek as part of the Computer Vision Science Research Project1; Color objects taken from The Object Databank provided by Dr. Michael Tarr2; Fractals taken from stimulus set used by Dr. Joseph Sala and colleagues (Sala and Courtney, 2007).
The stimuli for the retinotopic mapping procedure, described below, consisted of horizontal and vertical wedges arranged in a “bowtie” pattern. The wedges were black and white checkerboards oscillating at a rate of 8 Hz, presented on a gray background. The wedges constituted an arc of 30 radial degrees through a circle with a radius of 12.5° of visual angle, centered at fixation. The functional localizer stimuli were disks that subtended roughly the same area as the distractor images; two disks would appear alternately in “old” distractor locations and “new” distractor locations. These disks were presented on a gray background and contained black and white quarters which oscillated at a rate of 5 Hz. Figure 2 shows examples of both types of stimuli.
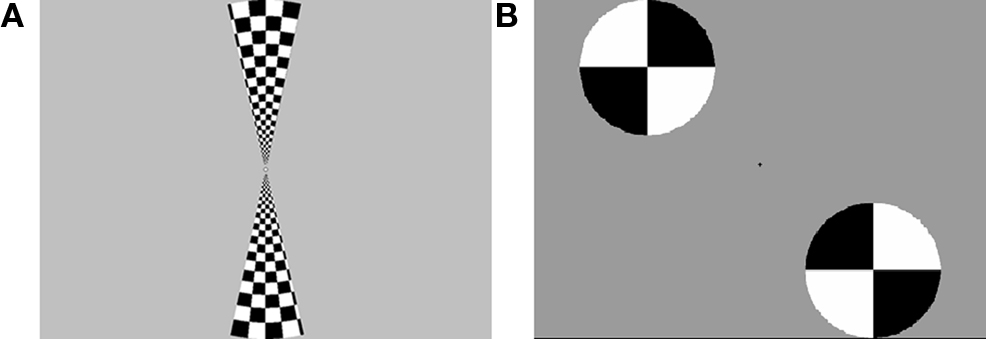
Figure 2.(A) Bowtie stimuli used for retinotopic mapping. (B) Disc stimuli used for functional localization of regions processing the distractor locations.
Procedure
Prior to the scanning session, subjects participated in a training session in the lab. During this session, the task and the procedure were explained to the subjects, and they completed the equivalent of a full scan session of the primary task (without distractors), which consisted of eight blocks. Each block contained 80 trials. The trials were separated by a jittered inter-trial interval (ITI) of 3–7 s (this allowed for estimation of the event-related time courses, described below). A blank period of 10 s was presented prior to the first trial and immediately following the final trial; the total length of each block was 420 s.
Before the training session the scoring system was explained to the subjects: they earned points based on their performance in the task. Each trial was worth a base rate of 100 points. This value decayed by 1 point for every 10 ms it took the subject to respond. On a correct response, subjects were awarded the remaining point value for that trial (this could never be less than zero). On an error, 200 points were deducted from the total score. In between blocks of the task subjects were shown a breakdown of their score for that block, including mean RT and points earned and total points lost due to errors. Subjects were paid a bonus based on their score at the end of the scanning session. During both the training and scanning sessions subjects received feedback on their performance between blocks. No distractors were presented during the training session.
During the scanning session subjects again completed eight blocks of the main task. A single distractor was presented on half of all trials. In Blocks 1–6 the distractor could appear in one of two locations adjacent to the upper-left and lower-right corners of the dot array (solid circles in Figure 1B); for the purposes of the analysis, these will be considered the “old locations.” In Blocks 7 and 8 the distractor could appear in one of the old locations or in locations adjacent to the lower-left and upper-right of the dot array (the “new locations,” dashed circles in Figure 1B). Distractors appeared equally often in all possible locations (i.e., in the two old locations during Blocks 1–6, or in any of the four old and new locations in Blocks 7 and 8). Subjects used two button boxes to enter responses for the main task.
Following the main task scans an anatomical scan was carried out, followed by two retinotopic mapping scans and two functional localizer scans. The retinotopic mapping scans lasted 288 s and consisted of vertical and horizontal checkerboard wedges being presented sequentially for 18 s each. The full 36 s vertical-horizontal cycle was repeated eight times for each scan. The purpose of the functional localizer scans was to identify the portions of visual cortex that were most active when distractors were presented in each of the four possible distractor locations. These scans lasted 360 s and consisted of black and white disks being presented in either both of the old or both of the new locations for 20 s. Each 40 s old location-new location cycle was repeated eight times, with 20 s of fixation at the start and the end of each run. During both the retinotopic mapping and the functional localizer runs subjects were instructed to maintain fixation at the center of the display. Following these scans, subjects were removed from the scanner, debriefed and paid based on their performance during the scanning session.
Data Collection and Analyses
Imaging data were collected on a Philips 3T Intera scanner equipped with a 6-channel SENSE (MRI Devices, Inc., Waukesha, Wisconsin) parallel-imaging head coil. Anatomical images were acquired using a T1-weighted MPRAGE sequence optimized for gray-white matter contrast, yielding images with a 1 mm isotropic resolution (TR = 8.1 ms, TE = 3.7 ms, flip angle = 8°, acquisition matrix = 200 × 200, 256 slices, SENSE factor = 2). Whole brain echo-planar functional images (EPI) were acquired in 38 transverse slices aligned to the AC-PC line (TR = 2 s, TE = 30 ms, flip angle = 70°, acquisition matrix = 64 × 64, FOV = 192 × 192 mm, slice thickness = 3 mm, gap = 0 mm, SENSE factor = 2). Data were analyzed using Brain Voyager QX (Brain Innovation, Maastricht, the Netherlands) and Matlab 7.1 software (Mathworks, Natick, Massachusetts).
Functional images were slice-time and motion corrected and filtered with a high-pass (3 cycles/scan) temporal filter (the retinotopic mapping and functional localizer data were also filtered with a 2.8 s/cycle low-pass temporal filter). Following this, the images were smoothed using a 4 mm (FWHM) Gaussian kernel. All images were then warped into Talairach space and resampled into 3 mm isotropic voxels.
For the main task, separate model time series were created for each subject by convolving a 1 s boxcar marking the temporal location of trial onset with a gamma function (delta = 2.5, τ = 1.25, Boynton et al., 1996). These model time series were then used to compute a random effects general linear model (GLM) of the BOLD time course in each voxel. The GLM produced beta weights for each voxel that represent the estimated magnitude of the BOLD response evoked by each of the event types. A minimum individual voxel threshold of p < 0.001 was adopted and a minimum cluster size of 19 contiguous voxels (513 mL) was used to correct for multiple comparisons (determined using the program AlphaSim (B.D. Ward3), which was used to run 2000 Monte Carlo simulations that took into account the entire EPI acquisition matrix). Group-average statistical maps were generated by defining contrasts of the beta weights for different event types (e.g., trials where distractors were present vs. trials where distractors were absent). These statistical maps were then used to define clusters of activation in different regions of cortex that were identified as functional regions of interest (ROIs). Distractor Absent trials were always modeled as such; Distractor Present trials were modeled separately based either on location or on the type of distractor item presented on a given trial, as described in the Results.
Retinotopic mapping was used to map the boundaries of the different regions in retinotopic visual cortex, using periods of stimulation at the horizontal and vertical meridians (Slotnick and Yantis, 2003; Qiu et al., 2006). For these runs and the functional localizer runs the gamma function was convolved with a boxcar function corresponding to the length of each segment of the stimulus cycle (16 s for retinotopic mapping, 20 s for functional localizer). Separate GLMs were then run individually for each subject. The data from these GLMs were projected onto inflated representations of each subject’s cortical surface to aid in visualization of the region boundaries. These data were used to define the borders between visual areas (Sereno et al., 1994; Tootell et al., 1996). Once these boundaries were defined, the functional localizer data were overlaid on the cortical representation to identify which segments of the various visual areas were most active for a distractor appearing at a given location.
Time course analyses were carried out within all of the functionally defined regions by computing the percent signal change for each data point within a functional run compared to the mean of the run. The time course for different event types was calculated by taking the mean of all instances of a given event across all subjects for the time points from 6 s before event onset to 16 s after event onset. To examine differences in the BOLD response to Distractor Present vs. Distractor Absent trials, we calculated the difference in the peak of the time course between these two event types for all ROIs. Based on examination of the time courses from all event types and all areas, the peak of the time course (i.e., the point of maximal percent signal change of the BOLD signal) was determined to be 4 s after the event onset. This was consistent for both Distractor Present and Distractor Absent trials in all regions (with the exception of Precuneus where the peak was 6 s after event onset; this time point was used for analyses in this region). An example of this is shown in Figure 3.
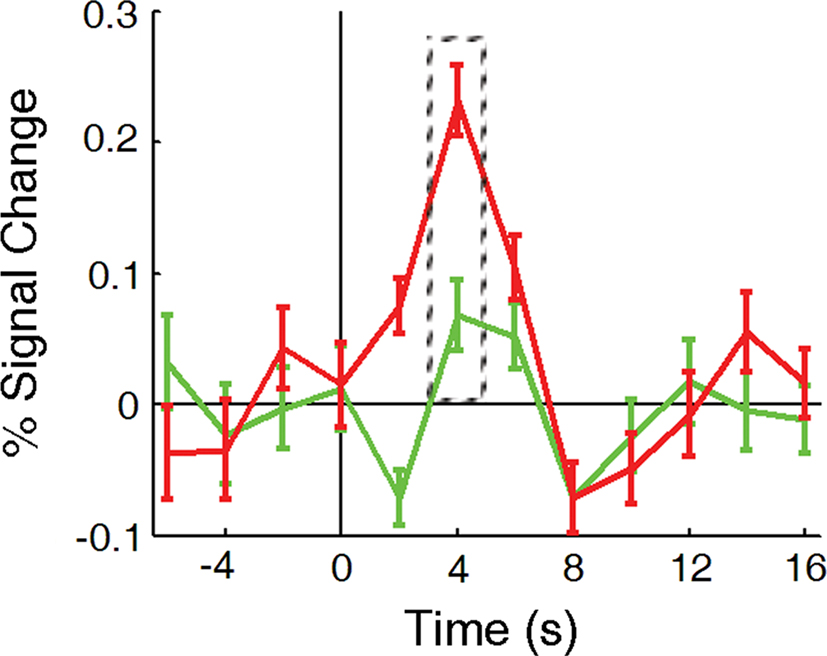
Figure 3. Event-related time course, measured in percent signal change, for Distractor Present (red line) and Distractor Absent (green line) trials, taken from area V1. The dashed box around the time points at 4 s indicate the points used to calculate the difference in the peak response to the various events within different cortical regions.
Orthogonal contrasts were used in conjunction with repeated-measures ANOVAs in the analysis of the behavioral and functional data. These contrasts are defined by assigning weights to the different levels of the independent variable, creating a set of non-overlapping comparisons that completely account for the effect variance in the ANOVA (see Table 1). In this way, direct comparisons can be made between task blocks to assess when and how performance (and BOLD response) changes with practice.
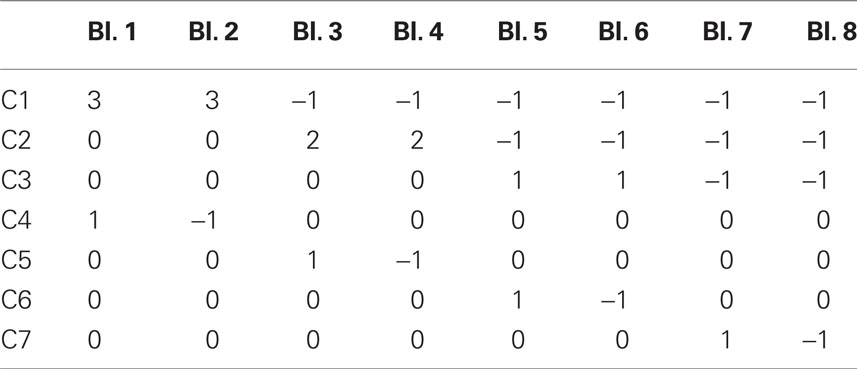
Table 1. Orthogonal Contrasts used to describe differences between block.
Results
Behavioral Data
Mean accuracy on the task across all subjects was 92% (Distractor Absent: 91.7%; Distractor Present: 92.2%). The mean RT was 754 ms (Distractor Absent: 748 ms; Distractor Present: 759 ms). The analysis will focus on RT as the main indicator of practice effects, but the effects were mirrored in accuracy which showed a smaller difference in errors on distractor trials compared to no distractor trials over time.
Figure 4 shows the RT difference between Distractor Present and Distractor Absent trials as a function of block. This pattern is similar to that observed previously (Kelley and Yantis, 2009): an initial cost for the presence of distractors which eventually approached zero. Distractors appearing in new locations in the transfer conditions of Blocks 7 and 8 (black triangles) did not produce any greater RT cost than distractors appearing in old locations in the same blocks (red circles), indicating effective transfer of learning to new locations. Although an ANOVA examining the effect of Block on RT difference, averaged across all locations, was not significant (F(7,112) = 1.61, p < 0.14), a set of orthogonal contrasts (see Table 1) revealed that the difference in RT for distractor present vs. absent was larger in Blocks 1–2 than the subsequent six blocks (C1) (F(1,112) = 7.82, p < 0.01), accounting for 69% of the variance due to block. No other contrasts reached significance (C2: F(1,112) = 2.16, p < 0.15; all other F’s < 1). Thus, subjects were slower to respond when distractors were present in the first two blocks, but were able to overcome this interference for the remainder of the trials, indicating improved performance with practice. A factorial ANOVA examining the effects of Block and Distractor Location for Blocks 7 and 8 was not significant for either factor, nor was the interaction (all F’s < 1), showing that the practice effects transferred to the new distractor locations.
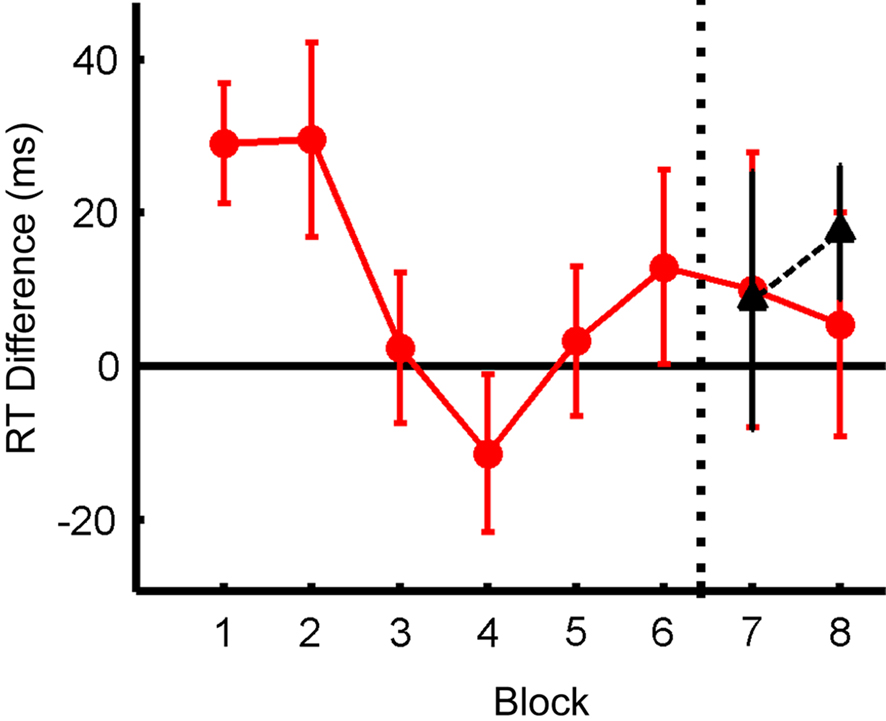
Figure 4. Behavioral effect of distractor across blocks, measured as difference in RT; positive values indicate increased RT in the presence of distractors. Dashed black line indicates point at which new distractor locations were introduced in this figure and all later figures. Red: data for old distractor locations; black: data for new distractor locations.
Functional Imaging Data
Retinotopic cortex
We identified the locations within retinotopically mapped striate and extrastriate cortex that responded to a stimulus in each of the four distractor locations (individually for each subject). Within these regions, the mean time course of the BOLD signal for the different trial types was calculated for each run. Distractor trials were divided into four groups of trials based on the location in which the distractor appeared (e.g., upper-left, lower-right, etc.). To determine the level of neural activity evoked by the distractors, the peak of the average time course for the Distractor Absent trials was subtracted from the peak of the time course for each of the four Distractor Present trial types, as described in the Methods (see Figure 3). For regions corresponding to both old (upper-left, lower-right) and new (lower-left, upper-right) distractor locations, a Location × Block (2 × 8 and 2 × 2, respectively) repeated-measures ANOVA was carried out to determine whether the effect of Block differed between distractor locations. No interactions were significant (all F’s < 1). Therefore, the following analyses collapsed across distractor location.
Figure 5 shows the difference in the peak BOLD signal for distractor present vs. distractor absent trials, averaged across all subjects, as a function of Block. This figure shows that there was no difference in distractor-related activity as a function of block within early retinotopic cortex. A series of ANOVA’s (for the old distractor locations) and t-tests (for the new distractor locations) was carried out to examine the effect of Block on the difference in peak BOLD response. ANOVA’s were used for the old locations as the change in response was being measured across eight blocks; in contrast, the change in response for the new locations was only measured across two blocks, and so a t-test was used in these cases. In all cases, the effect of Block was not significant (for old locations in V3/Vp: F(7,112) = 1.40, p > 0.2; all other F’s < 1; all t’s < 1). These results indicate that practice does not lead to a consistent change in the sensory response to distracting items in early visual cortex.
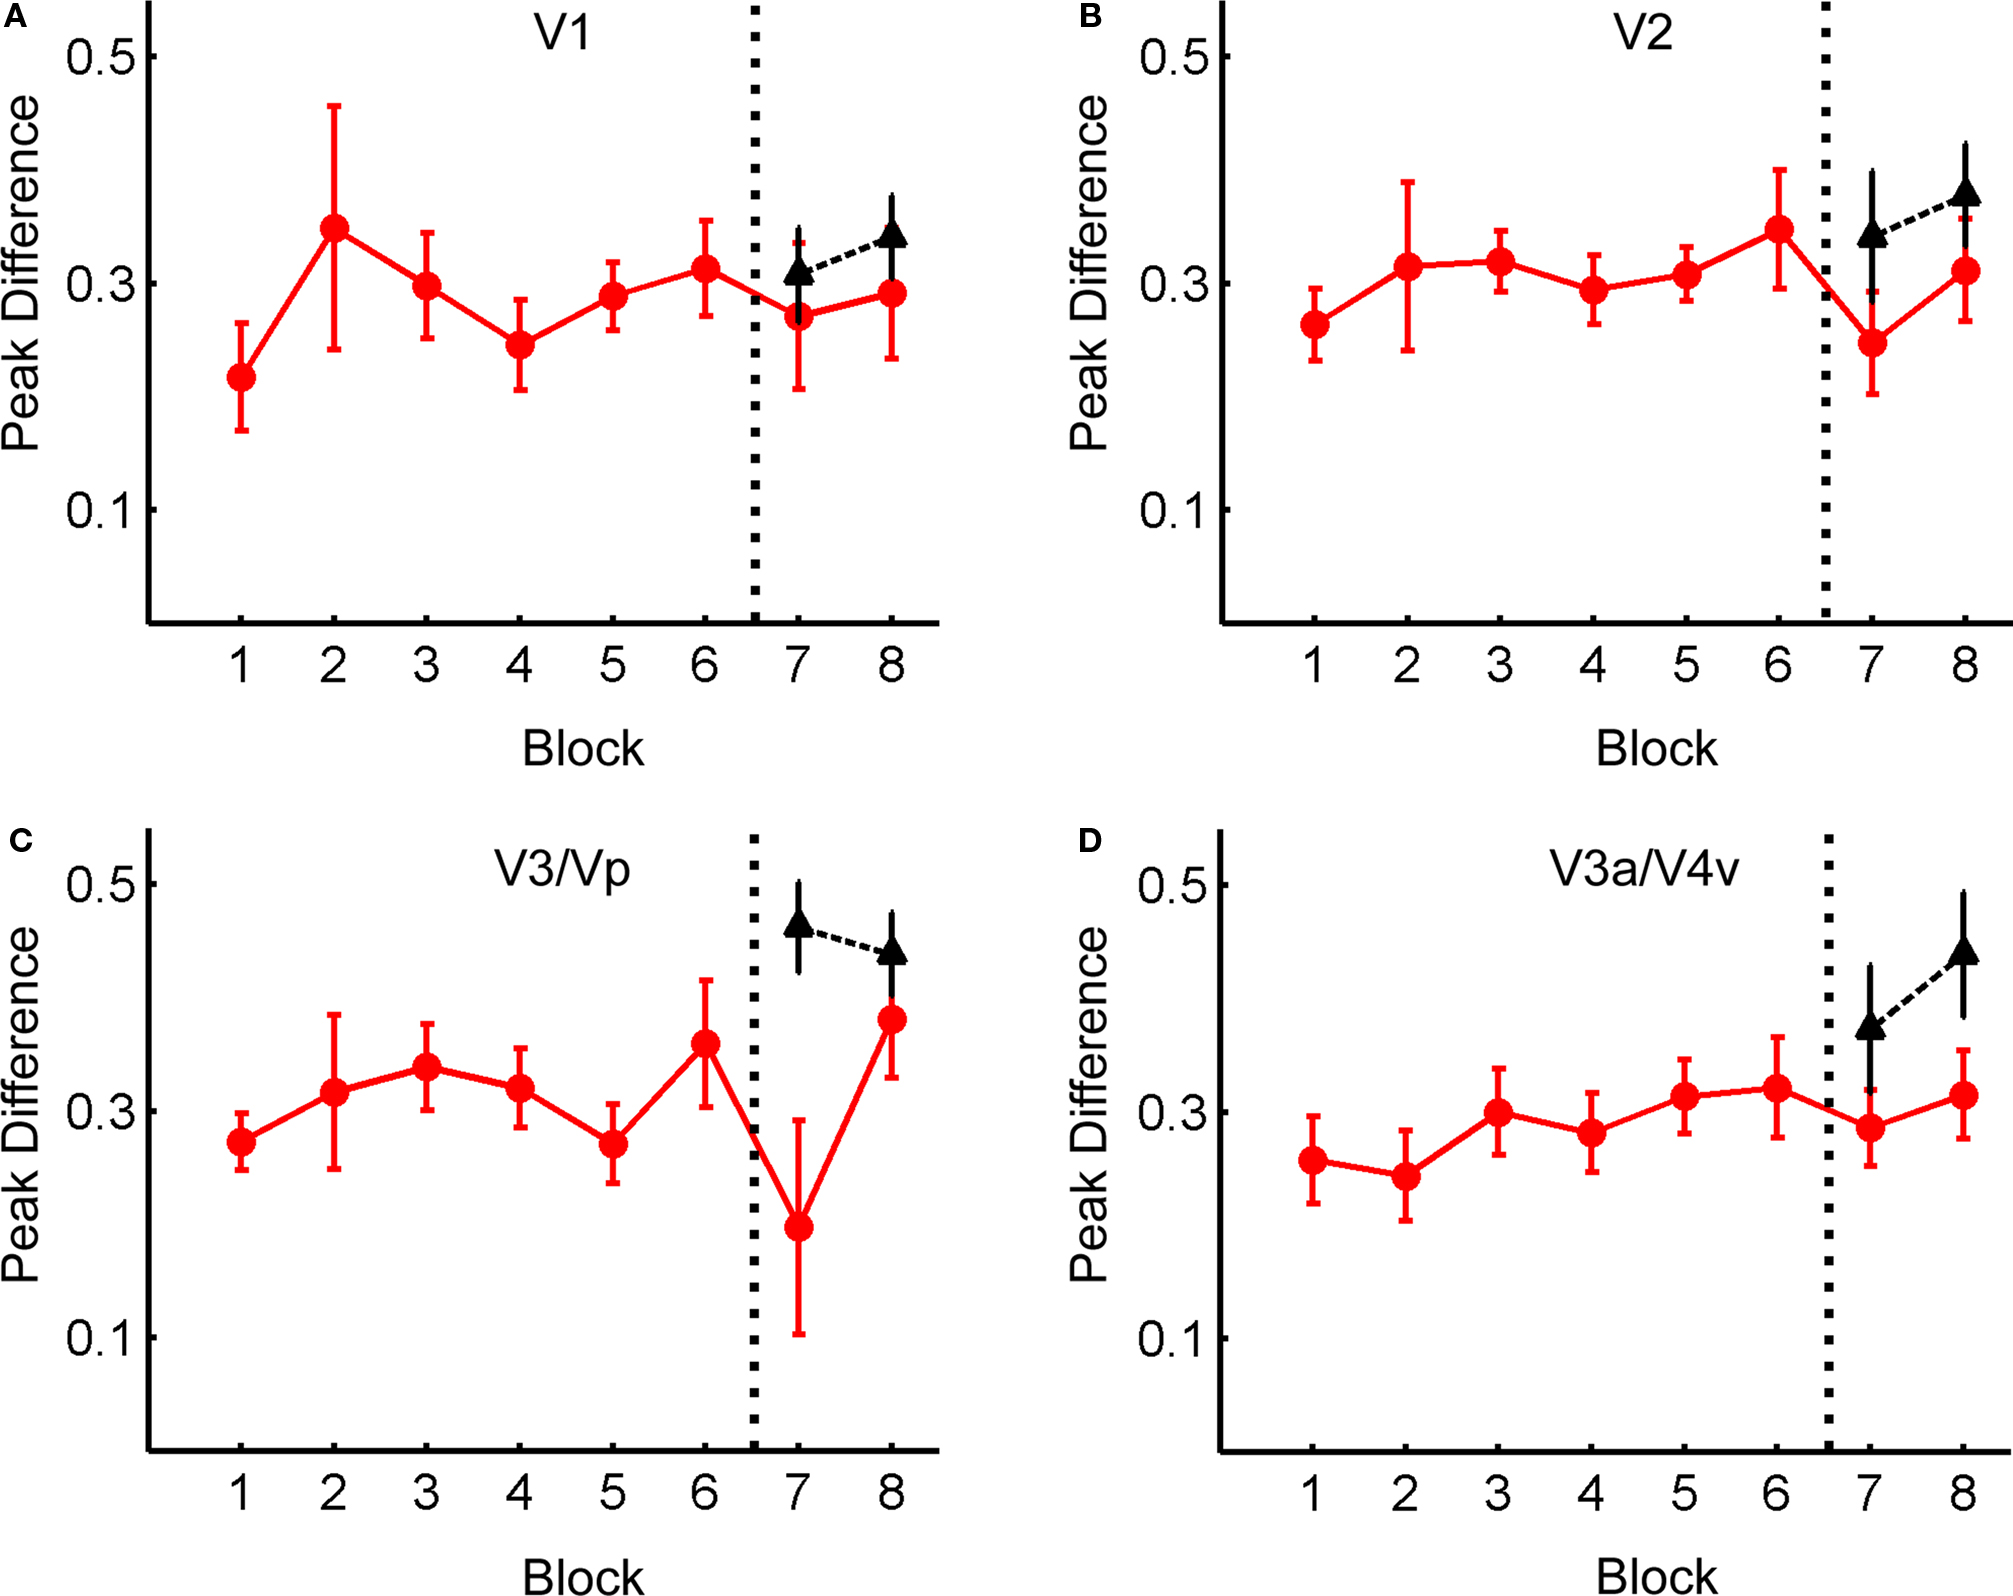
Figure 5. Change in BOLD response to distractors as a function of Block in early visual cortex. Data points represent difference in peak BOLD response (measured as percent signal change) between Distractor Present trials and Distractor Absent trials taken from areas V1 (A), V2 (B), V3/Vp (C), and V3a/V4v (D). Red: data for old distractor locations; black: data for new distractor locations. The data presented are taken from those areas of cortex responding maximally to a stimulus appearing in the in a given location (e.g., Upper-Left distractor responses are taken from areas that respond most to a stimulus appearing in the upper-left distractor location, etc), then averaged across locations. Positive value indicates a greater BOLD response when a distractor was present.
Additionally, the effect of Location (old or new) on the response to distractors was examined with respect to Block (7 or 8) using a 2 × 2 ANOVA. As expected given the previous results, there was no main effect of Block (V2: F(1,16) = 1.47, p > 0.24; all other F’s < 1). However, for all regions except V1 (F < 1), there was a significant effect of Location (V2: F(1,16) = 5.40, p < 0.05; V3/Vp: F(1,14) = 5.48, p < 0.05; V3a/V4v: F(1,12) = 10.97, p < 0.01). There was also a marginal trend toward an interaction in V3/Vp (F(1,14) = 4.08, p < 0.07; all other F’s < 1). This indicates there was a generally larger BOLD response to distractors appearing in new locations compared to old locations.
Category-selective cortex (fusiform face area)
Though there was no learning-related modulation in early visual areas, it is possible that category-selective visual areas, which are responsible for processing the identity of the different distractor items, exhibited a change in cortical response. One such area is the fusiform face area (FFA), which has been shown to be particularly responsive to face stimuli (see Kanwisher and Yovel, 2006, for a review). Because many of the distractor images were faces, learning-related changes in activity in FFA were examined.
FFA was localized bilaterally in the group by performing a contrast between Face Distractor trials vs. Non-Face Distractor trials, using the data from the random effects GLM. Table 2 shows the coordinates of these regions. The voxel-wise threshold for this contrast was an uncorrected value of p < 0.01; this more liberal threshold was used to insure that a large enough cluster of voxels corresponding to FFA could be identified.
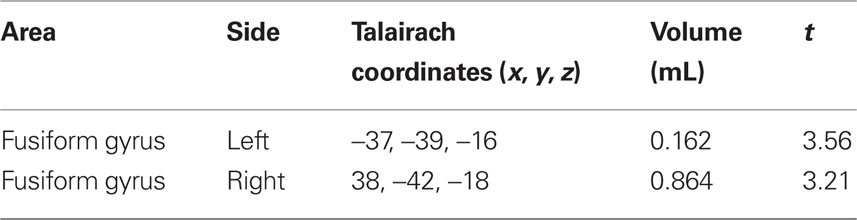
Table 2. Regions of cortex identified as being more active for the contrast Face Distractors > Non-Face Distractors, p < 0.01 (uncorrected).
Figure 6 shows the difference in the peak BOLD response for distractor present vs. distractor absent trials in left (Figure 6A) and right (Figure 6B) FFA. The data are plotted separately for face (solid lines) and non-face (dashed lines) distractors in both old and new locations. The specific distractor location (e.g., upper-left or lower-right) was not considered here, owing to the relatively low number of face distractors at each location and the fact that FFA is located outside retinotopically oriented visual cortex (Halgren et al., 1999). As expected, the response to face distractors is greater than non-face distractors (as they must be based on the contrast used to identify these regions). This face selectivity, and the magnitude of the responses to the stimuli, does not change over blocks. For each region, an ANOVA was conducted to analyze the effects of Block and Distractor Type on peak response difference, collapsed across old and new locations. In both regions there was a significant effect of Distractor Type (Left: F(1,16) = 22.74, p < 0.001; Right: F(1,16) = 15.39, p < 0.001); no other effects were significant (all F’s < 1). For data from Blocks 7 and 8, we examined the interaction of Distractor Type, Block and Location (old or new). Again, the effects of Distractor Type were significant; also, there was a marginal effect of Location in right FFA (F(1,16) = 3.77, p < 0.07). No other main effects or interactions were significant. Thus, even in areas concerned with processing the identity of distractor objects, there was no effect of learning on cortical activity.
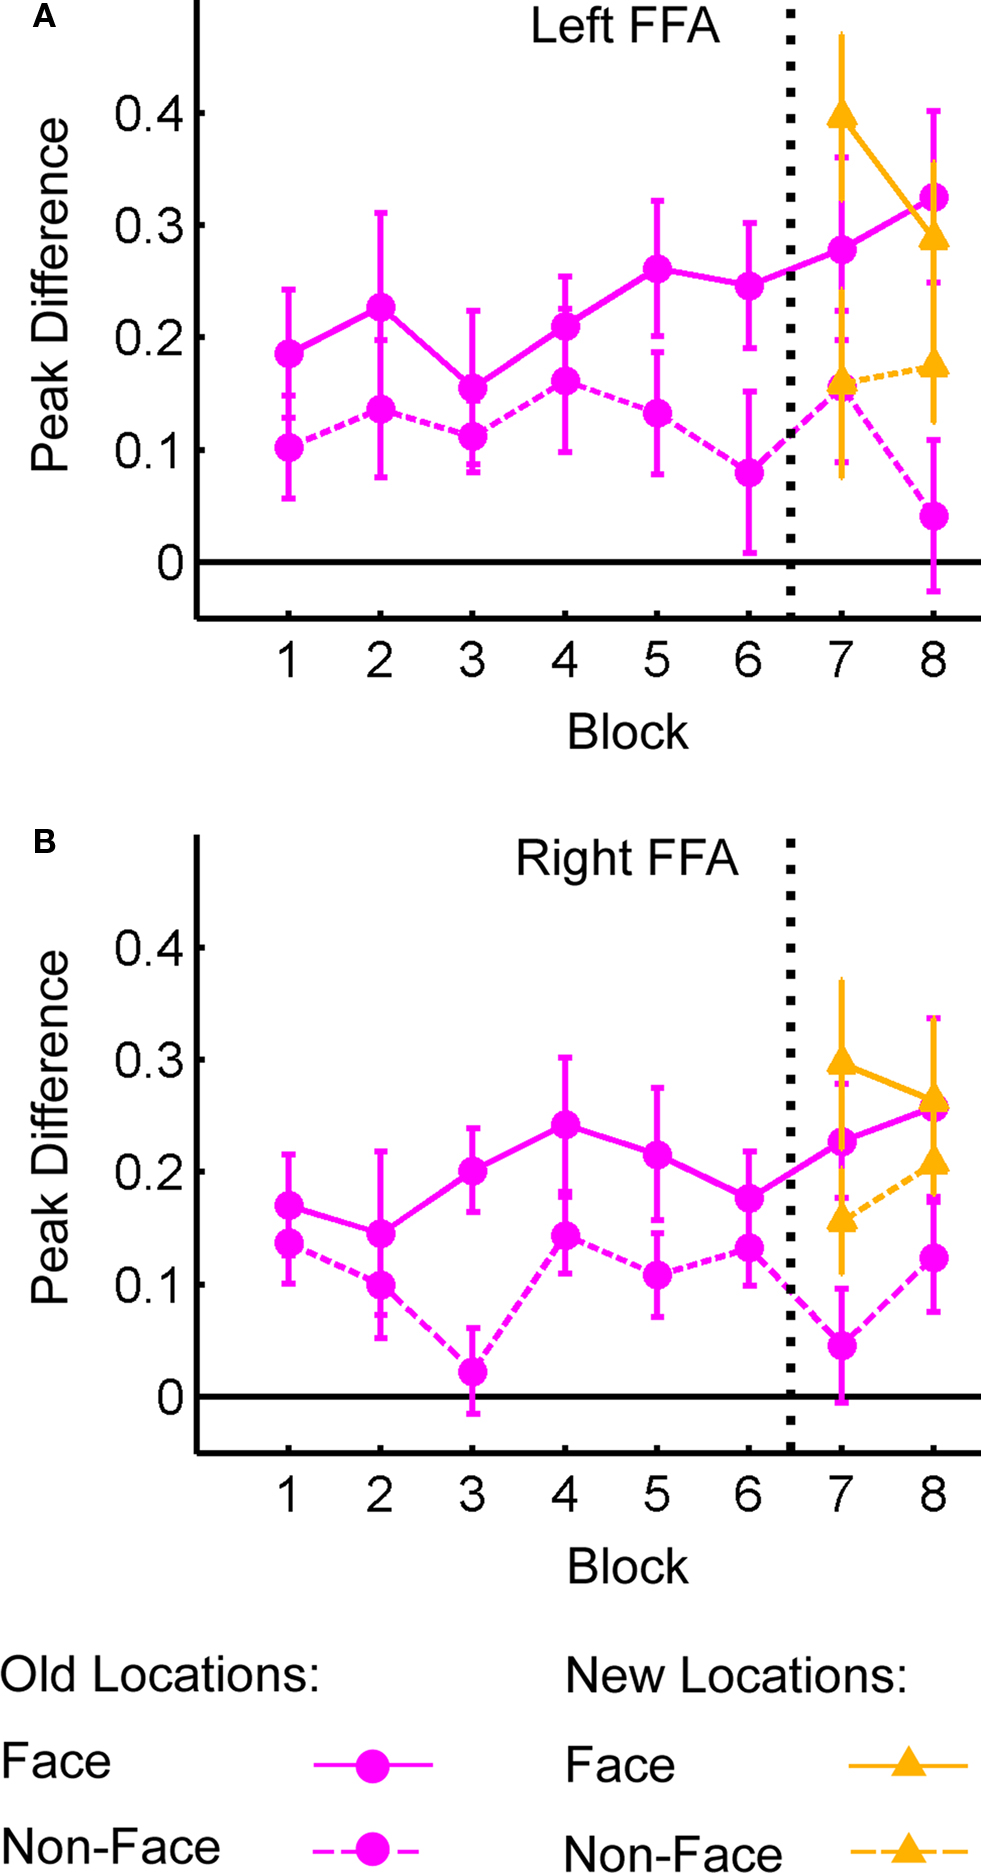
Figure 6. Difference in peak BOLD response for distractor present vs. distractor absent trials as a function of Block in fusiform face area (FFA). Peak distractor signal shown for face and non-face distractors presented in old and new distractor locations. (A) Left FFA. (B) Right FFA.
Full brain analysis
To examine how the brain responded to the presence of distractors while engaging in the main task, a contrast was computed between Distractor Present trials and Distractor Absent trials. This contrast isolated cortical regions that responded more to the presence than the absence of a distractor, as both event types involved performance of the main task. The areas that were most active for this contrast are shown in Table 3 and Figure 7; they include left MFG, a portion of the right superior temporal gyrus corresponding to temporo-parietal junction (TPJ), bilateral intraparietal sulcus (IPS) and precuneus. This contrast also revealed substantial activity in ventral occipito-temporal cortex, areas that are recruited for visual object processing. The inverse contrast (Distractor Absent > Distractor Present) produced no significant clusters.
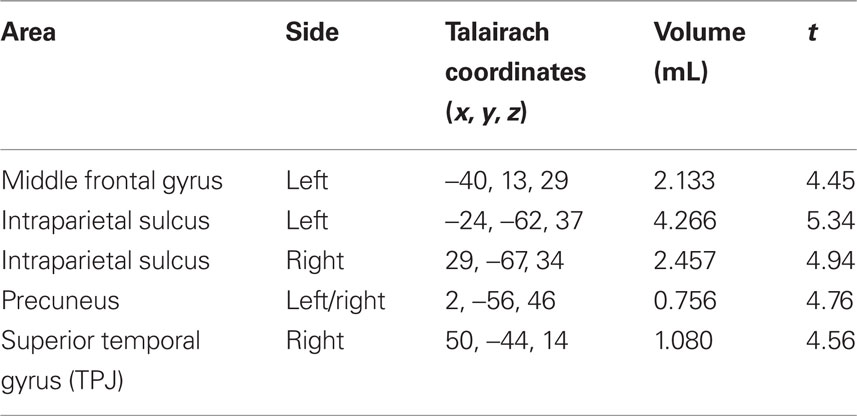
Table 3. Regions of cortex that are active for the contrast Distractor Present trials > Distractor Absent trials, p < 0.001, corrected using a cluster threshold of 19 contiguous voxels.
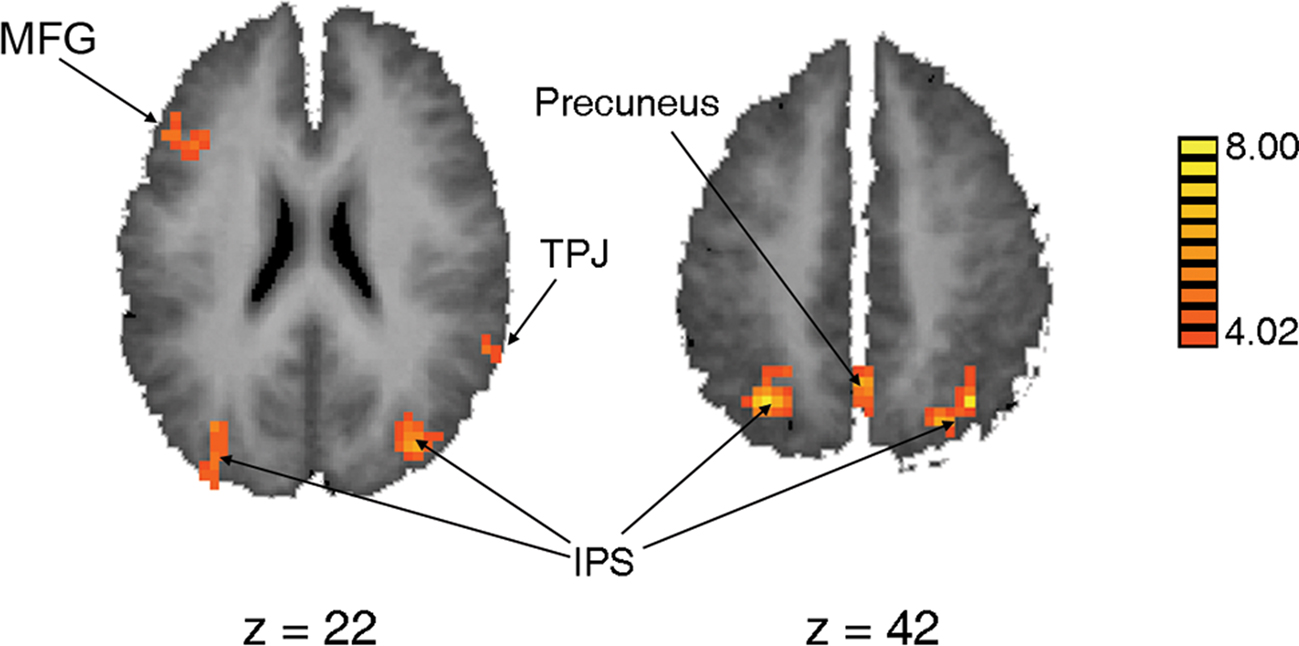
Figure 7. Statistical map of regions that are more active for Distractor Present trials than Distractor Absent trials, projected onto a group-average Talairach brain; see Table 3 for size and coordinates.
For each of the regions listed above, the difference in the peak response between Distractor Present and Distractor Absent trials was calculated and then averaged within each block, as described previously. These differences are plotted as a function of Block in Figure 8.
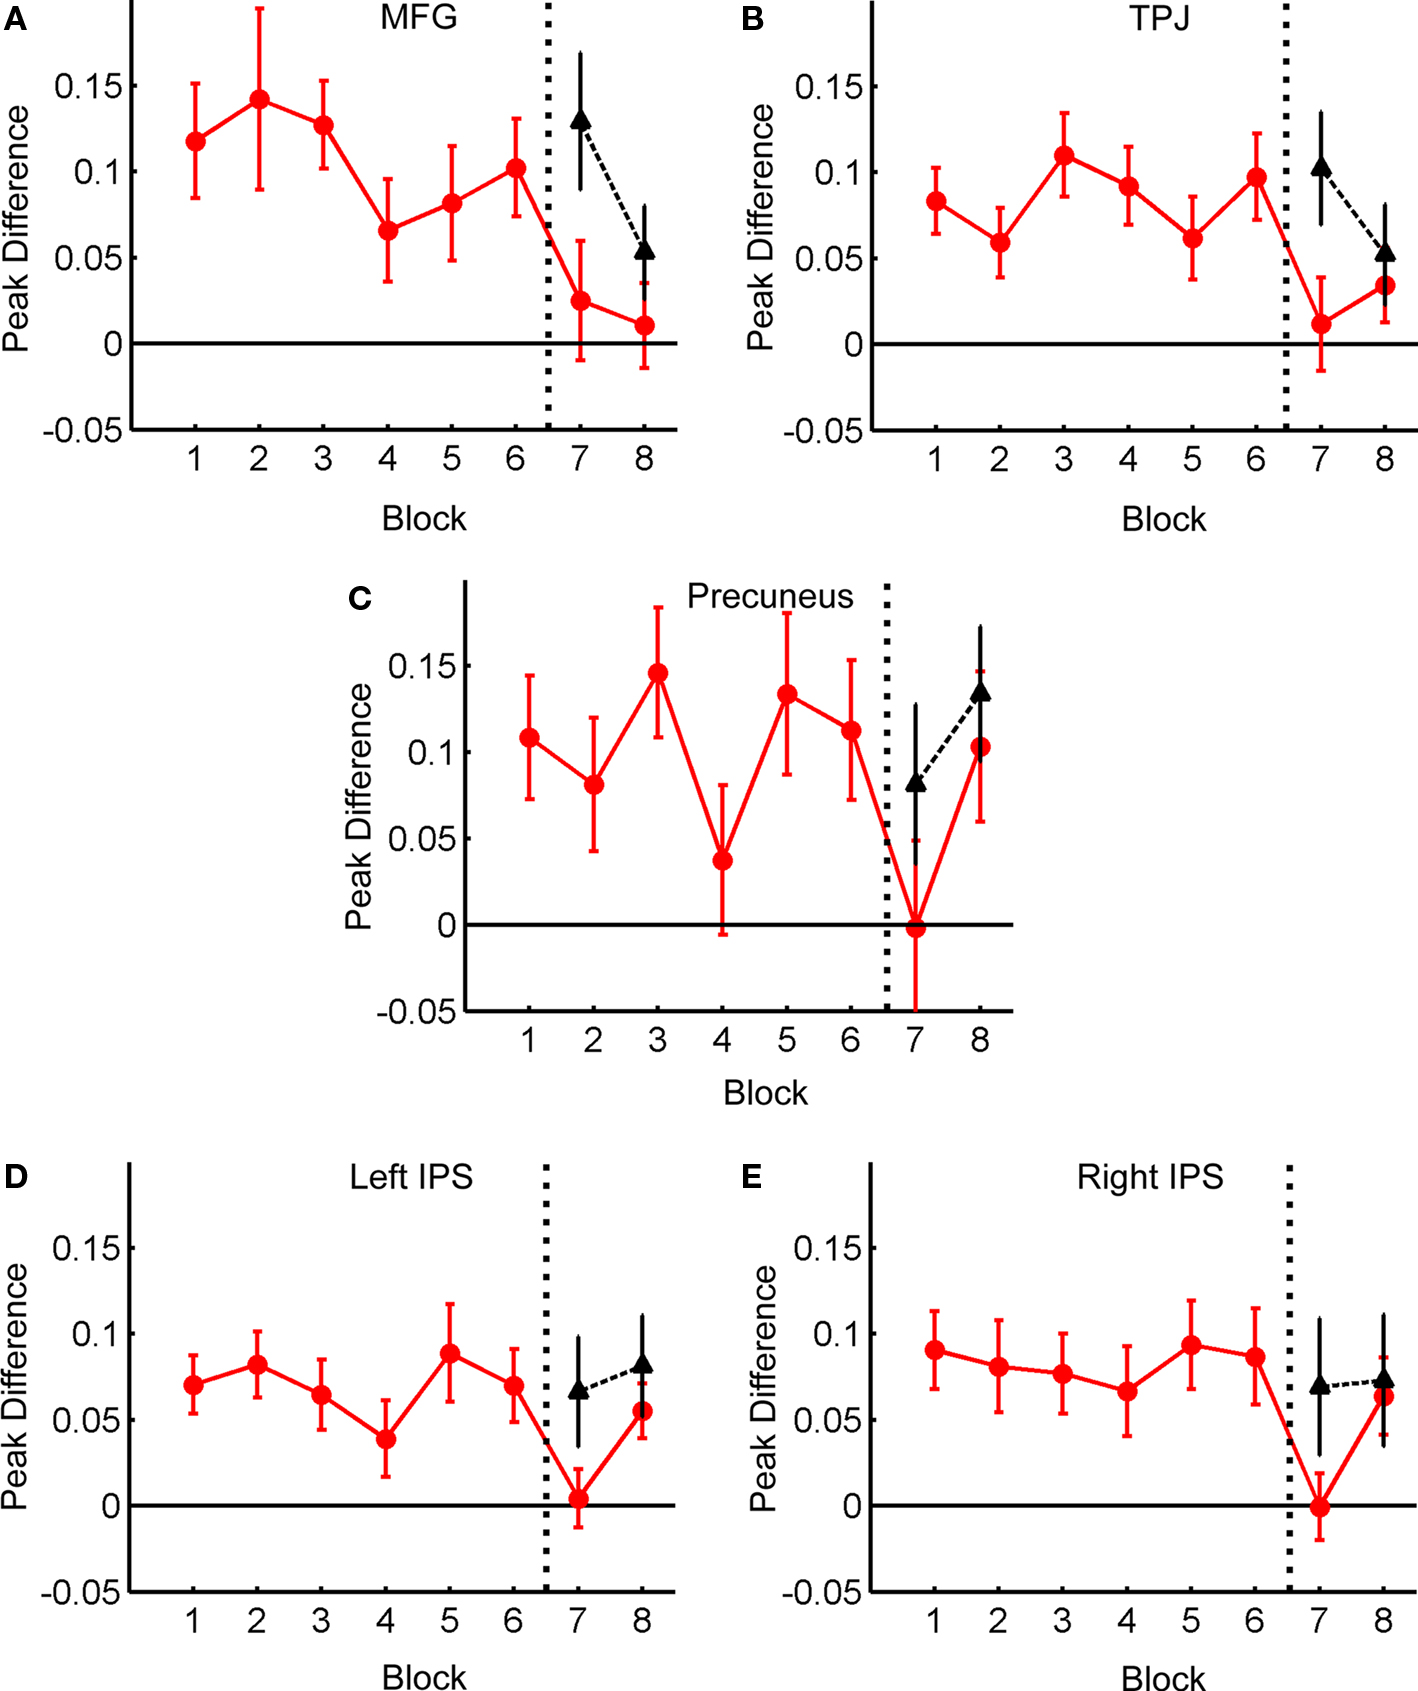
Figure 8. Difference in BOLD response for Distractor Present vs. Distractor Absent trials as a function of Block. Red line: old distractor locations; black line: new distractor locations. Data for the plots extracted from the following regions: Left MFG (A); Right TPJ (B); Precuneus (C); Left IPS (D); Right IPS (E).
Considering the BOLD response to distractors in old locations, there was a trend toward an effect of Block in left MFG (F(7,112) = 2.03, p = 0.057), and a significant effect in right TPJ (F(7,112) = 2.34, p < 0.029); no other regions showed significant effects of Block (all p’s > 0.1). The data from all regions were also analyzed with the same set of orthogonal contrasts used for the behavioral data (see Table 1). Only MFG showed a significant effect for Contrast 1 (F(1,112) = 5.02, p < 0.05), reflecting the pattern observed in the behavioral data. TPJ did show a significant effect of Contrast 2 (F(1,112) = 7.03, p < 0.01), indicating a reduced distractor-evoked BOLD response following Blocks 3 and 4. A significant effect of Contrast 3 (Blocks 5 and 6 > Blocks 7 and 8) was observed for MFG (F(1,112) = 4.94, p < 0.05), TPJ (F(1,112) = 6.77, p < 0.011), Left IPS (F(1,112) = 5.97, p < 0.05) and Right IPS (F(1,112) = 5.83, p < 0.05). This reflects the reduction in the BOLD response to Distractor Present trials over the last two blocks, though this is isolated to Block 7 for bilateral IPS, and in all cases may be related to the appearance of distractors in new locations (see below). No other contrasts were significant in any region.
In contrast to the behavioral data, several regions showed effects of Old vs. New distractor location, as seen in Figure 8. Again, the data from Blocks 7 and 8 was submitted to a 2 × 2 (Location vs. Block) ANOVA. For this analysis, no region showed a significant effect of Block (all p’s > 0.1). However, TPJ (F(1,16) = 5.71, p < 0.03) and Left IPS (F(1,16) = 7.75, p < 0.02) showed significant effects of location, and all other regions showed at least marginal trends (MFG: F(1,16) = 3.94, p = 0.065; Right IPS: F(1,16) = 3.52, p = 0.079; Precuneus: F(1,16) = 3.28, p = 0.089). Additionally, MFG (F(1,16) = 3.99, p = 0.063) and Right IPS (F(1,16) = 4.36, p = 0.053) showed marginal trends for the interaction (all other p’s > 0.19). These data indicate that, contrary to the behavioral effects, distractors appeared to elicit a greater BOLD response when they first appeared in new locations.
Discussion
After repeated exposure to distracting information, impairments in behavioral performance on the primary task can be almost completely overcome, and this learning-dependent improvement can generalize to new conditions (Kelley and Yantis, 2009). The present study investigated the neural basis of the behavioral improvements in attention during perceptual learning. The MFG exhibited a decrease in its response to a distracting object over time, mirroring the reduction in distractor interference as measured by changed in behavioral RT.
In contrast, visual cortex and IPS failed to show any change in response to the distractors during learning. Thus, there was no observable change in the sensory processing of the distracting objects, or a change in the extent to which the distractor evoked a stimulus-driven shift of visuospatial attention (or reorienting of attention post-capture). Instead, the observed changes were most evident in the ventral attentional control network, presumably reflecting a change in how distractors were filtered before they could affect behavior.
The temporal pattern of activity observed in the various cortical regions constrains the possible explanations of the behavioral effects observed here and in our previous study (Kelley and Yantis, 2009). The lack of change in response to the distractors in retinotopic visual cortex rules out improvements both in distractor suppression (Serences et al., 2004) and in the preventative allocation of attention away from the distractor locations (Yantis et al., 2002; Kelley et al., 2008). Along with the absence of change in category-selective cortex (e.g., FFA), these results also argue against stimulus adaptation as a principal mechanism (e.g., Grill-Spector et al., 2006; Krekelberg et al., 2006).
The increased BOLD response in IPS on distractor present trials is consistent with this region’s role in orienting visuospatial attention (Corbetta and Shulman, 2002; Serences et al., 2005; Serences and Yantis, 2006; Kelley et al., 2008). The lack of change in this response during the course of learning suggests that there was neither a decrease in the rate of orienting to the distractors, nor an increase in the speed or effectiveness of reorienting attention away from them. This is consistent with the data from visual cortex: a reduction in the degree to which attention was oriented to the distractors would have produced a corresponding decrease in distractor-evoked responses in sensory cortex, but this did not occur. These data suggest that behavioral improvements were not the result of improved allocation of spatial attention away from the distractors. They also provide strong evidence against explanations based on habituation of the orienting response (Sokolov, 1963; Bradley, 2009), as this would also have led to reduced activity in one of the key cortical areas for attentional orienting (e.g., IPS, FEF).
MFG is a key component of the ventral attention network, which is active when surprising and potentially task relevant stimuli appear in the environment (Corbetta et al., 2008). Its activation in this study is consistent with previous experiments that have shown similar activity related to the presence of distracting stimuli (de Fockert et al., 2004; Kincade et al., 2005; Serences et al., 2005; Leber, 2010). The decrease in response to the distractors in this region suggests that during attentional learning, the distractors became less effective in eliciting responses in the MFG. Such a change may have resulted not in reduced sensory orienting to the distractors (indeed, the parietal and occipital data suggest that sensory responses were unchanged), but in a reduction in the extent to which the identity of the distractor items was processed, examined in relation to the task, and potentially consolidated into memory.
de Fockert et al. (2004) reported that a portion of the precentral gyrus exhibited activity that was negatively correlated with the behavioral effects of a singleton distractor (i.e., when it was more active, subjects’ behavioral responses reflected less distraction). Leber (2010) reported that increased pre-trial activity in MFG led to reduced interference by singleton distractors. These findings suggest that the prefrontal portions of the ventral attention network do not simply respond to surprising stimuli, but dictate the extent to which they interfere with current tasks by gauging behavioral relevance. Thus, the MFG plays a role in overcoming distraction by preventing irrelevant information from siphoning cognitive resources needed for task performance. This would have implications for how the observed changes in activity may have affected behavior. Potentially, the decrease in MFG activity could reflect increased efficiency in the distractor filtering process, leading to the reduced recruitment of this region and so a reduced BOLD response. This would be consistent with studies that have shown that practice on working memory tasks produces a decrease in the BOLD response in prefrontal cortex (Garavan et al., 2000; Landau et al., 2004; Kelly et al., 2006; Sayala et al., 2006). Given that other portions of the ventral network (e.g., TPJ) did not show a change in activity similar to the change in RT, the efficient filtering account is more likely than an account based on reduced stimulus-driven orienting of attention.
Though the above explanations assume a causal role for MFG in the observed behavioral changes, the correlational nature of fMRI cannot support strong claims about causality. Future studies could address this issue through the use of transcranial magnetic stimulation (TMS) to selectively and temporarily deactivate these regions. Previous work along similar lines has shown that TMS stimulation of TPJ interferes with detection of stimuli (Meister et al., 2006). Stimulation of MFG might prevent the filtering of distracting information, which could prevent the development of practice effects, as MFG activity would not be allowed to improve in efficiency.
While the present data implicate MFG as being a critical component in improved distractor filtering, it is likely that other regions are also involved in this process. Indeed, one curious aspect of the present findings is that none of the identified regions match precisely the pattern of the behavioral data. In particular, there was a larger response to distractors in new positions, compared to old positions, in Blocks 7 and 8 that was not reflected in the RT data. One possibility for this is that the improved performance observed for this task was the product of improvements in not one neural process, but several overlapping processes. Thus the improvements in filtering in MFG could have been coupled with changes in spatial orienting processes, even though such changes were not observable here (as discussed above). Furthermore, these changes might have manifested as improved efficiency (i.e., decreased BOLD signal/decreased cluster size) in some regions, and increased recruitment (increased signal) in other regions. This combination of factors could explain why the lack of behavioral response to distractors in new locations was not reflected in the neural response.
In order to overcome this complication, future studies will have to carefully control how task performance is disrupted. For example, visual search tasks that require precise target localization but minimal effort for identification might be well suited to testing improvements in visuospatial orienting mechanisms. In contrast, flanker studies could be useful in isolating changes in distractor interference effects. Such studies will help to build a more complete picture of how attentional selection can be made to operate more efficiently, which would in turn having wide-ranging consequences for a variety of teaching and training practices.
Conflict of Interest Statement
The authors declare that the research was conducted in the absence of any commercial or financial relationships that could be construed as potential conflicts of interest.
Acknowledgments
This research was supported by National Institutes of Health Grant R01-DA13165 to Steven Yantis. The authors would like to thank Howard Egeth, Charles Connor and Amy Shelton for helpful suggestions.
Footnotes
References
Boynton, G. M., Engel, S. A., Glover, G. H., and Heeger, D. J. (1996). Linear systems analysis of functional magnetic resonance imaging in human V1. J. Neurosci. 16, 4207–4221.
Bradley, M. M. (2009). Natural selective attention: orienting and emotion. Psychophysiology 46, 1–11.
Brown, P., and Fera, P. (1994). Turning selective attention failure into selective attention success. Can. J. Exp. Psychol. 48, 25–57.
Corbetta, M., and Shulman, G. L. (2002). Control of goal-directed and stimulus-driven attention in the brain. Nat. Rev. Neurosci. 3, 201–215.
Corbetta, M., Patel, G., and Shulman, G. L. (2008). The reorienting system of the human brain: from environment to theory of mind. Neuron 58, 306–324.
Culham, J. C., and Kanwisher, N. G. (2001). Neuroimaging of cognitive functions in human parietal cortex. Curr. Opin. Neurobiol. 11, 157–163.
de Fockert, J., Rees, G., Frith, C., and Lavie, N. (2004). Neural correlates of attentional capture in visual search. J. Cogn. Neurosci. 16, 751–759.
Dixon, M. L., Ruppel, J., Pratt, J., and De Rosa, E. (2009). Learning to ignore: acquisition of sustained attentional suppression. Psychon. Bull. Rev. 16, 418–423.
Dye, M. W., Green, C. S., and Bavelier, D. (2009). The development of attention skills in action video game players. Neuropsychologia 47, 1780–1789.
Garavan, H., Kelley, D., Rosen, A., Rao, S. M., and Stein, E. A. (2000). Practice-related functional activation changes in a working memory task. Microsc. Res. Tech. 51, 54–63.
Giesbrecht, B., Woldorff, M. G., Song, A. W., and Mangun, G. R. (2003). Neural mechanisms of top-down control during spatial and feature attention. Neuroimage 19, 496–512.
Grill-Spector, K., Henson, R., and Martin, A. (2006). Repetition and the brain: neural models of stimulus-specific effects. Trends Cogn. Sci. 10, 14–23.
Halgren, E., Dale, A. M., Sereno, M. I., Tootell, R. B., Marinkovic, K., and Rosen, B. R. (1999). Location of human face-selective cortex with respect to retinotopic areas. Hum. Brain Mapp. 7, 29–37.
James, W. (1890). Chapter XI. “Attention,” in The Principles of Psychology, Vol. 1 (New York: Henry Holt & Company), 402–458. Available at http://www.archive.org/details/theprinciplesofp01jameuoft
Kanwisher, N., and Yovel, G. (2006). The fusiform face area: a cortical region specialized for the perception of faces. Philos. Trans. R. Soc. Lond. B Biol. Sci. 361, 2109–2128.
Kastner, S., and Ungerleider, L. (2000). Mechanisms of the visual attention in the human cortex. Annu. Rev. Neurosci. 23, 315–341.
Kastner, S., and Ungerleider, L. (2001). The neural basis of biased competition in human visual cortex. Neuropsychologia 39, 1263–1276.
Kelley, T. A., Serences, J. T., Giesbrecht, B., and Yantis, S. (2008). Cortical mechanisms for shifting and holding visuospatial attention. Cereb. Cortex 18, 114–125.
Kelley, T. A., and Yantis, S. (2009). Learning to attend: effects of practice on information selection. J. Vis. 9, 1–18.
Kelly, A. M. C., Hester, R., Fox, J. J., Shpaner, M., and Garavan, H. (2006). Flexible cognitive control: effects of individual differences and brief practice on a complex cognitive task. Neuroimage 31, 866–886.
Kincade, J. M., Abrams, R. A., Astafiev, S. V., Shulman, G. L., and Corbetta, M. (2005). An event-related functional magnetic resonance imaging study of voluntary and stimulus-driven orienting of attention. J. Neurosci. 25, 4593–4604.
Krekelberg, B., Boynton, G. M., and van Wezel, R. J. A. (2006). Adaptation: from single cells to BOLD signals. Trends Neurosci. 29, 250–256.
Landau, S. M., Schumacher, E. H., Garavan, H., Druzgal, T. J., and D’Esposito, M. (2004). A functional MRI study on component processes of working memory. Neuroimage 22, 211–221.
Leber, A. (2010). Neural predictors of within-subject fluctuations in attentional control. J. Neurosci. 30, 11458–11465.
Makovski, T., Vázquez, G. A., and Jiang, Y. V. (2008). Visual learning in multiple-object tracking. PLoS ONE 3, e2228. doi: 10.1371/journal.pone.0002228.
Meister, I. G., Wienemann, M., Buelte, D., Grünewald, C., Sparing, R., Dambeck, N., and Boroojerdi, B. (2006). Hemiextinction induced by transcranial magnetic stimulation over the right temporo-parietal junction. Neuroscience 142, 119–123.
Moore, T., Armstrong, K. M., and Fallah, M. (2003). Visuomotor origins of covert spatial attention. Neuron 40, 671–683.
Moran, J., and Desimone, R. (1985). Selective attention gates visual processing in the extrastriate cortex. Science 229, 782–784.
Pelli, D. G. (1997). The VideoToolbox software for visual psychophysics: transforming numbers into movies. Spatial Vision 10, 437–442.
Qiu, A., Rosenau, B. J., Greenberg, A. S., Hurdal, M. K., Barta, P., Yantis, S., and Miller, M. I. (2006). Estimating linear cortical magnification in human primary visual cortex via dynamic programming. Neuroimage 15, 125–138.
Sala, J. B., and Courtney, S. M. (2007). Binding of what and where during working memory maintenance. Cortex 43, 5–21.
Sayala, S., Sala, J. B., and Courtney, S. M. (2006). Increased neural efficiency with repeated performance of a working memory task is information-type dependent. Cereb. Cortex 16, 609–617.
Schmidt, R. A., and Bjork, R. A. (1992). New conceptualizations of practice: common principles in three paradigms suggest new concepts for training. Psychol. Sci. 3, 207–218.
Schneider, W., and Shiffrin, R. (1977). Controlled and automatic human information processing: I. Detection, search and attention. Psychol. Rev. 84, 1–66.
Serences, J. T., Shomstein, S., Leber, A. B., Golay, X., Egeth, H. E., and Yantis, S. (2005). Coordination of voluntary and stimulus-driven attentional control in human cortex. Psychol. Sci. 16, 114–122.
Serences, J. T., and Yantis, S. (2006). Selective visual attention and perceptual coherence. Trends Cogn. Sci. 10, 38–45.
Serences, J. T., Yantis, S., Culberson, A., and Awh, E. (2004). Preparatory activity in visual cortex indexes distractor suppression during covert spatial orienting. J. Neurophysiol. 92, 3538–3545.
Sereno, M. I., McDonald, C. T., and Allman, J. M. (1994). Analysis of retinotopic maps in extrastriate cortex. Cereb. Cortex 4, 601–620.
Shiffrin, R., and Schneider, W. (1977). Controlled and automatic human information processing: II. Perceptual learning, automatic attending and a general theory. Psychol. Rev. 84, 127–190.
Slotnick, S. D., and Yantis, S. (2003). Efficient acquisition of human retinotopic maps. Hum. Brain Mapp. 18, 22–29.
Tang, Y.-Y., and Posner, M. I. (2009). Attention training and attention state training. Trends Cogn. Sci. 13, 222–227.
Tootell, R. B. H., Dale, A. M., Sereno, M. I., and Malach, R. (1996). New images from human visual cortex. Trends Neurosci. 19, 481–489.
Yantis, S., and Jonides, J. (1990). Abrupt visual onsets and selective attention: voluntary vs. automatic allocation. J. Exp. Psychol. Hum. Percept. Perform. 16, 121–134.
Keywords: fMRI, ventral attention network, distraction, vision, practice, filtering
Citation: Kelley TA and Yantis S (2010) Neural correlates of learning to attend. Front. Hum. Neurosci. 4:216. doi: 10.3389/fnhum.2010.00216
Received: 29 April 2010;
Accepted: 19 October 2010;
Published online: 11 November 2010
Edited by:
Silvia A. Bunge, University of California Berkeley, USAReviewed by:
Daphne Bavelier, University of Rochester, USAEve De Rosa, University of Toronto, Canada
Copyright: © 2010 Kelley and Yantis. This is an open-access article subject to an exclusive license agreement between the authors and the Frontiers Research Foundation, which permits unrestricted use, distribution, and reproduction in any medium, provided the original authors and source are credited.
*Correspondence: Todd A. Kelley, Center for Mind and Brain, University of California at Davis, 267 Cousteau Place, Davis, CA 95618, USA. e-mail: toddakelley1@gmail.com