Aberrant effective connectivity in schizophrenia patients during appetitive conditioning
- 1 Rotman Research Institute, Baycrest Centre, Toronto, ON, Canada
- 2 Department of Psychology, University of Toronto, Toronto, ON, Canada
- 3 Schizophrenia Program and Positron Emission Tomography Centre, Centre for Addiction and Mental Health, Toronto, ON, Canada
- 4 Department of Psychiatry and Psychotherapy, Charité Universitätsmedizin, Berlin, Germany
- 5 Department of Biological Psychiatry, Medical University of Vienna, Vienna, Austria
- 6 Institute of Psychiatry, King’s College London, London, UK
It has recently been suggested that schizophrenia involves dysfunction in brain connectivity at a neural level, and a dysfunction in reward processing at a behavioral level. The purpose of the present study was to link these two levels of analyses by examining effective connectivity patterns between brain regions mediating reward learning in patients with schizophrenia and healthy, age-matched controls. To this aim, we used functional magnetic resonance imaging and galvanic skin recordings (GSR) while patients and controls performed an appetitive conditioning experiment with visual cues as the conditioned (CS) stimuli, and monetary reward as the appetitive unconditioned stimulus (US). Based on explicit stimulus contingency ratings, conditioning occurred in both groups; however, based on implicit, physiological GSR measures, patients failed to show differences between CS+ and CS− conditions. Healthy controls exhibited increased blood-oxygen-level dependent (BOLD) activity across striatal, hippocampal, and prefrontal regions and increased effective connectivity from the ventral striatum to the orbitofrontal cortex (OFC BA 11) in the CS+ compared to the CS− condition. Compared to controls, patients showed increased BOLD activity across a similar network of brain regions, and increased effective connectivity from the striatum to hippocampus and prefrontal regions in the CS− compared to the CS+ condition. The findings of increased BOLD activity and effective connectivity in response to the CS− in patients with schizophrenia offer insight into the aberrant assignment of motivational salience to non-reinforced stimuli during conditioning that is thought to accompany schizophrenia.
Introduction
The name “schizophrenia” was first introduced by Bleuler (1911) as a splitting and disintegration of conscious experience. The large spectrum of symptoms underlying the disorder gave rise to the hypothesis that the pathology results from dysfunctional connectivity between distributed brain areas rather than from localized deficits (Friston and Frith, 1995; McIntosh, 1999; Bressler, 2003; Stephan et al., 2009). Recent studies examined the hypothesis of “disconnectivity” in schizophrenia by investigating temporally coherent brain activity derived from functional magnetic resonance imaging (fMRI) data (for a review, see Calhoun et al., 2009).
Schizophrenia has been associated with reduced functional connectivity across fronto-temporal networks supporting verbal encoding (Lawrie et al., 2002; Wolf et al., 2007), superior temporal, and anterior cingulate cortices during speech perception (Mechelli et al., 2007), hippocampal–prefrontal (Meyer-Lindenberg et al., 2001, 2005), and prefrontal–cerebellar networks during working memory tasks (Schlosser et al., 2003; Honey et al., 2005; Kim et al., 2009), occipito-temporal and fronto-temporal networks supporting semantic processing (Jennings et al., 1998; Kim et al., 2005), and cingulate and prefrontal cortices during rest (Bluhm et al., 2007; Garrity et al., 2007; Zhou et al., 2007).
Patients with schizophrenia also show deficits in reward learning (Sears et al., 2000; Hofer et al., 2001), and increased responses to non-reinforced stimuli (Murray et al., 2008). Indeed, Jensen et al. (2008) suggested that, based on the implicit physiological measure of skin conductance, patients with schizophrenia demonstrated abnormal aversive learning patterns, and could not reliably distinguish between neutral stimuli and stimuli linked to aversive outcomes. Accompanying these behavioral deficits, patients with schizophrenia also exhibited increased blood-oxygen-level dependent (BOLD) activity in the ventral striatum (VS; Juckel et al., 2006; Jensen et al., 2008; Schlagenhauf et al., 2009) and hippocampus (Schmajuk, 2001; Meyer-Lindenberg et al., 2005) in response to non-reinforced stimuli.
In the present fMRI study, we investigated reward learning and group differences in effective connectivity employing an appetitive conditioning paradigm in which visual stimuli were associated with rewards and, as a consequence, became imbued with motivational salience. Galvanic skin recordings (GSR) were acquired as an index of learning while medicated schizophrenia patients and age-matched controls were presented with visual cues that were selectively paired with monetary reward.
Based on the previous findings of dysfunctional connectivity and abnormal reward learning patterns, we hypothesized that patients with schizophrenia will inappropriately perceive neutral stimuli as motivationally salient showing increased GSR and BOLD activity in response to the non-reinforced visual cues. Furthermore, based on neuroimaging studies demonstrating disruptions in functional connectivity across medial temporal, anterior cingulate, and prefrontal regions (Calhoun et al., 2009), we posited that patients will show decreased effective connectivity between the striatum, hippocampus, and prefrontal cortex in response to the relevant visual cues. In light of recent fMRI studies that demonstrated increased BOLD responses to non-reinforced stimuli (cf. Jensen et al., 2008), we also predicted that patients with schizophrenia, in contrast to controls, will exhibit increased effective connectivity between striatal and prefrontal regions following visual cues not predictive of monetary reward.
Materials and Methods
Participants
Eighteen patients with schizophrenia and 18 healthy controls gave written informed consent according to the guidelines of the Human Subjects Review Committee of the University of Toronto and completed the study. Patients and healthy controls were all right handed, matched based on age, gender, education, and general cognitive estimates (see Table 1 and Appendix for details). The patients who participated in the study were medicated with atypical antipsychotics (see Table 2 for medication details). fMRI data from five patients and five controls could not be used: six scans were lost due to unsuccessful reconstruction; one participant’s structural scan indicated brain abnormalities, and three participants moved more than the allowed 3 mm.
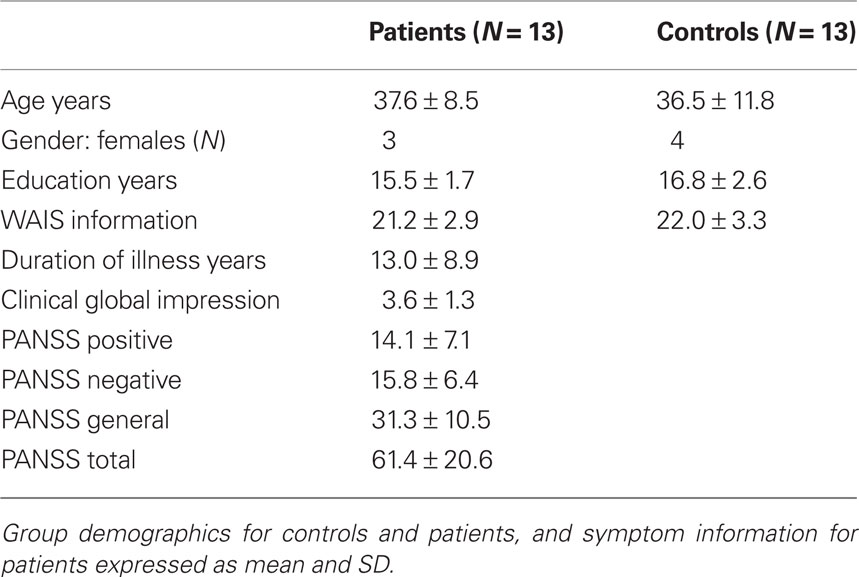
Table 1. Group description mean ± SD.
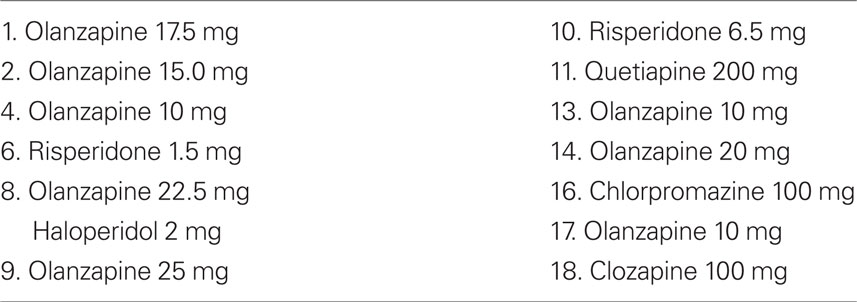
Table 2. Patient medication information.
Apparatus
Stimuli
Red and black circles were the conditioned stimuli in the appetitive session (association with reward was counterbalanced). The appetitive US consisted of visual images that pictured three 1-dollar coins, a 5-dollar bill, or a 10-dollar bill displayed for 800 ms. The images were presented at the center of fixation and indicated that participants would receive the total amount of the money during the experiment. In total, all participants received $75 extra upon completion of the appetitive conditioning session. The CS− circle was paired with a neutral visual stimulus, a centrally presented star, in 50% of the trials to ensure that the behavioral and BOLD signal response differences between the unpaired CS+ and CS− trials reflected the anticipation of the US, and not just any other stimulus temporally associated with the cues.
Galvanic skin conductance
The galvanic skin response (GSR) was measured at 10 Hz using magnetic resonance imaging MRI-compatible silver/silver chloride Ag/AgCl electrodes, which were attached to the left middle and ring fingers. The output was continuously monitored by PowerLab 2/20 (AD Instruments, Castle Hill, Australia) via long, well-isolated cables passed through an RF filter. To correct for possible MRI-induced artifacts, the GSR signal was digitally low-pass filtered using a cut-off value of 2 Hz. Peak amplitude GSR values in the period of 10 s after trial onset were compared to the values at trial onset and the frequency of differential values higher than 0.05 μs was calculated.
Procedure
The US immediately followed the offset of the CS+ circle in 50% of the trials. The visual cues used as CS+ and CS− appeared for 5 s and the appetitive US and a neutral stimulus (a star) for 800 ms. A fixation cross was presented between trials for a period of 9 s. Trials were presented in a pseudorandom order to facilitate learning, but also to not require participants to be in the scanner for lengthy time periods. In total, there were 80 randomized trials in each session: (i) 20 CS+ paired with the US, (ii) 20 CS+ alone, (iii) 20 CS− paired with a neutral stimulus, and (iv) 20 CS− alone. The E-prime software (Psychology Software Tools, Inc., Pittsburgh, PA, USA) controlled the stimulus presentation. Immediately after participants left the scanner, they also completed a post-learning subjective-state questionnaire, in which they were asked to identify which colored circle had been associated with reward, and rate the amount of “pleasantness” they attributed to each visual cue.
Image Acquisition
Magnetic resonance imaging scans were acquired with a GE Signa 1.5 T scanner (General Electric, Waukesha, WI, USA) equipped with a standard head coil. Five hundred nine volumes of 28 contiguous axial 4.4 mm thick slices covering the whole brain were acquired using a T2?-sensitive spiral in-out sequence (TR = 2240 ms; TE = 40 ms; flip angle 85°; matrix 64 × 64; FOV 200 mm × 200 mm). This sequence was chosen because it has reduced susceptibility dropout in frontal and medial temporal regions including the VS (Glover and Thomason, 2004). The first three volumes were discarded to allow for T1 equilibrium effects, and the data from the remaining 506 volumes were used in the analysis.
Data Processing
Motion correction was performed using SPM99 (Wellcome Department of Cognitive Neurology, London, UK; Friston, 2007). Additional artifacts were removed using MELODIC (Multivariate Exploratory Linear Optimized Decomposition into Independent Components), an implementation of probabilistic independent component analysis (ICA; Beckmann and Smith, 2004). Artifacts were identified following the guidelines outlined by Beckmann and colleagues. An average of 40% of components per participant were interpreted as artifactual, and removed. There were no differences between the two groups with respect to the number of ICs removed. ICA correction increased the reliability of the voxel saliences representing the condition differences as assessed by bootstrap estimation of standard errors (see below).
After ICA correction, the images were spatially normalized with SPM99 to a locally created spiral template in Montreal Neurological Institute (MNI) space. The computed transformations were applied to all functional images, interpolated to isotropic voxels of 4 mm × 4 mm × 4 mm. The resulting images were smoothed using an 8-mm full width half-maximum isotropic Gaussian kernel. Analysis of Functional Neuroimaging software (http://afni.nimh.nih.gov/, Cox, 1996) was used to display statistical maps on a standard EPI template, and anatomical labels for local maxima were obtained using the SPM5 MNI Anatomy Atlas (Friston, 2007).
PLS Analysis: Overview
The fMRI data was analyzed using partial least squares (PLS; McIntosh and Lobaugh, 2004) to capture the brain regions that maximally represented group differences in BOLD activity in response to CS+ vs. CS− conditions. PLS is similar to principal components analysis (PCA) or to canonical correlation, with the exception of one important feature: PLS solutions are constrained to the part of the covariance structure that is attributable to the experimental manipulations or that relates to a given dependent measure. As such, PLS is ideal for data sets where the dependent measures within a block are highly inter-correlated or not of full rank, such as in the case of neuroimaging data, because items within a block are not adjusted for these correlations as they are in the canonical correlation approach.
Partial least squares computes an optimal squares fit across the entire dataset in time and space simultaneously, which requires the data to be in matrix format. Every row of the matrix contains data for one subject in one condition. The rows are arranged such that subjects are nested within condition blocks for control and schizophrenia groups, respectively. With 2 groups, 13 subjects per group, and 2 conditions (i.e., CS+ and CS−), there were 13 × 2 × 2 rows in the matrix. The columns of the matrix contained BOLD signal intensity for each voxel at each timepoint.
One of the advantages of using PLS is that it makes no assumptions about the shape of the hemodynamic response functions (HRFs). The HRF for any given condition normally lasts for several scans; therefore, a “lag-window” is a short signal segment within a trial that represents the response of each voxel. In the present study, a lag-window of eight lags from stimulus onset was used, representing eight TRs or an interval of approximately 18 s.
The present application of PLS employed the within-task mean-centering approach. Here, trials within each experimental condition were averaged and expressed as a voxel-by-voxel deviation from the grand mean across the entire dataset. Singular value decomposition (SVD) was then applied to the mean-centered deviation matrix. Mathematically, SVD simply re-expresses this matrix as a set of orthogonal singular vectors or latent variables (LVs), the number of which is equivalent to the total number of tasks. The LVs are analogous to eigenvectors in PCA and account for the covariance of the original mean-centered matrix in decreasing order of magnitude. For each LV, the two vectors are linked by a singular value (equivalent to the square root of the eigenvalues). The singular value indicates the proportion of crossblock covariance (i.e., covariance between the two blocks of data: brain activity and experimental design) that is accounted for by each LV.
The two vectors reflect a symmetrical relationship between the components of the experimental design most related to the differing signals in the voxels on one hand, and the optimal, in the least squares sense, spatiotemporal pattern of voxel signals related to the identified experimental design components on the other. The numerical weights at each voxel and timepoint are called voxel saliences. Those saliences identify the collection of voxels that are most related to the condition differences expressed in the given LV. The task saliences, on the other hand, indicate the degree to which each condition is related to the identified pattern of source waveform differences expressed in the given LV.
Statistical assessment
Arbitrary decisions regarding the number of LVs to retain and which of the task or voxel saliences to consider relevant were minimized by using two complementary resampling techniques that provided statistical assessment of the LVs. First, permutation tests were performed using sampling without replacement by randomly reassigning the order of the conditions to each subject, and then calculating a new set of LVs for each re-ordering. This ensured that the condition differences identified by the given LV were significantly different from random data.
Second, the stability of the maximal voxel saliences representing the condition differences was assessed using bootstrap estimation of standard errors of the voxel saliences. The rationale for using bootstrap estimations of standard errors was the following: a salience whose value depends on which subjects are included in the sample is less precise than the one that remains stable regardless of the sample chosen. Thus, bootstrap samples were generated using sampling with replacement, keeping the assignment of experimental conditions fixed for all subjects. Importantly, by using bootstrap estimation of standard errors, no correction for multiple comparisons was necessary because the voxel saliences were calculated in a single mathematical step, on the whole brain at once (McIntosh et al., 1996). These two resampling techniques provided complementary information about the statistical strength of the contrasts identified and their reliability across participants. In the present study, 500 permutations tests and 300 bootstrap estimations were computed.
Structural Equation Modeling
Structural equation modeling (SEM) analysis is a multivariate technique based on a structural model which represents the hypothesized causal relations between several variables (see McIntosh and Gonzalez-Lima, 1994; Buchel and Friston, 1997; Bullmore et al., 2000 for methodological details). In the context of fMRI research, these variables are the measured BOLD signal change of y1 to yn brain regions, and the hypothetical causal relations are based on anatomical connections between the regions. The strength of each connection yi–yj is specified by a “path coefficient,” which indicates how the variance of yj depends on the variance of yi if all other influences on yj are held constant.
In the present study, the SEM analysis employed covariances of activity between regions of interest computed across participants and for each condition to determine path coefficients. The models were compared statistically to test for condition-specific differences in effective connectivity.
Five brain regions of interest in the right hemisphere that showed maximal task and group differences in the PLS analysis were selected based on prior knowledge of anatomical connectivity and involvement in reinforcement learning (Delgado et al., 2000; Knutson et al., 2000, 2001; Kirsch et al., 2003; Zald et al., 2004; Zink et al., 2004; Seymour et al., 2007). Furthermore, tracer studies in primates have also shown that the VS is anatomically connected to the dorsal striatum (Haber and Knutson, 2010), the hippocampus, and the medial prefrontal and orbitofrontal cortices (Haber et al., 1995; Ferry et al., 2000; Friedman et al., 2002). As the SEM analysis depends on an a priori model of anatomical connectivity, we specified only a small number of well validated connections in the right hemisphere and not across both hemispheres to exclude assumptions of commissural anatomical connectivity. The peak of the brain region activation (i.e., the BOLD signal at the third TR) was used in the analysis, averaging a neighborhood of 20 voxels around the location of the region of interest.
The selected regions were the VS [MNI (x, y, z) = 8, 4, −4], caudate (16, −4, 16), putamen (28, 8, −8), hippocampus (20, −36 −12), orbitofrontal cortex (20, 16, −24), and the superior medial frontal gyrus (16, 56, 8). Brain region amplitudes were obtained by extracting the BOLD signal from the task PLS analysis across the entire event window (i.e., eight lags) for both unpaired CS+ and CS− conditions. The peak of BOLD activity (i.e., BOLD signal from the third lag or the third TR) was used in the SEM analysis. We decided to select the time window that showed that largest differences between the CS+ and CS− conditions, because we anticipated that the fMRI data would exhibit significant temporal correlation due to low-frequency physiological fluctuation. Furthermore, we chose the third lag because, in comparison to the rest, it also showed robust and distinct functional connectivity patterns in the CS+ and CS− conditions across the two groups.
Structural equation modeling was performed using the program Amos 17.0 (SmallWaters Corp., USA) applying a maximum likelihood algorithm for estimating path coefficients. Statistical inferences about group differences were based on a hierarchical model approach. This approach compared an alternative model, in which all connections were allowed to vary between the two groups and the two conditions, to a null model in which all path coefficients were constrained to be the same across all groups and all conditions. In the null model, error variances were also set to be the same as those estimated in the alternative model.
The χ2 goodness-of-fit statistic was used to assess the model’s ability to reproduce the original correlation matrix. The difference ( ) was examined with the degrees of freedom equal to the difference between the degrees of freedom in the constrained and the free models. The
  test is a hierarchical test that determines whether a modification to the model leads to significant improvement in the goodness-of-fit of the model (McIntosh and Gonzalez-Lima, 1994; Protzner and McIntosh, 2006). Comparison of the models was done by subtracting the goodness-of-fit χ2 value for the null model (
 ) from the χ2 value for the alternative model (
 ). If the χ2 value for the null model was significantly larger than that of the alternative model, then the path coefficients that varied between conditions and groups were statistically distinct (Protzner and McIntosh, 2006).
Results
Behavioral Results
Based on the subjective-state questionnaire following the experiment, controls rated the CS+ as more pleasant than the CS− [1.92 vs. 0.69; z = 2.86; p < 0.004; for the CS+ vs. CS−, respectively]. Although patients reported awareness of stimulus associations following the experiment, they did not significantly distinguish between the CS+ and the CS− in terms of pleasantness [1.25 vs. 0.58; z = 1.72; p = 0.08; for the CS+ vs. CS−, respectively].
Galvanic skin conductance was analyzed for unpaired CS+ and CS− trial types only in which there was no subsequent outcome. The percent of trials in which GSR values significantly exceeded baseline values following the onset of either the CS+ or CS− stimuli was analyzed using repeated measures analysis of variance (ANOVA) with group assignment as the between-subject factor and the CS+ and CS− unpaired conditions as the within-subject factors. A main effect of stimulus type was detected with a larger percent of trials showing increased GSR values to the unpaired CS+ condition [F(1,21) = 16.82, p < 0.001]. As it can be seen from Figure 1, an interaction between condition and group assignment was also detected [F(1, 21) = 7.1, p < 0.015] with patients exhibiting less differentiation between the CS+ and CS− conditions, decreased GSR signal to the CS+ as compared to controls. The group by condition interaction was primarily driven by the larger percentage of trials exhibiting increased GSR values in the unpaired CS+ condition in controls compared to patients (i.e., an average of 23% in controls compared to 13.5% in patients).
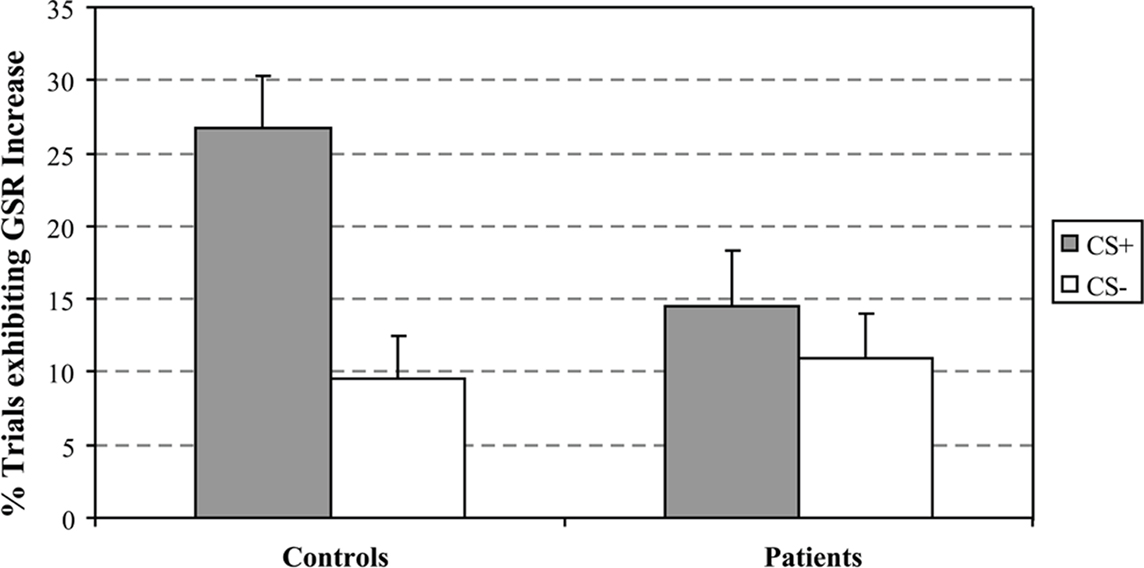
Figure 1. Percent of trials exhibiting an increase in GSR values from baseline following CS+ and CS- cues.
To further examine the GSR patterns driving the group x condition interactions, we also compared CS+ to CS− conditions within each group; this analysis was also performed on unpaired trial types. Significant differences between stimulus types were observed in the control group [t(11) = 4.25, p < 0.003] with larger GSR values to the CS+ compared to the CS− condition. No significant differences between the unpaired CS+ and CS− conditions were observed in the schizophrenia group [t(9) = 1.65, p = 0.13].
fMRI Results
The first LV, calculated using the mean-centered PLS analysis, captured group differences in the CS+ vs. CS− contrast (LV1 = 57.41% crossblock covariance, p < 0.012). Controls showed increased BOLD activity to the CS+ compared to the CS−, and patients reflected the opposite pattern, increased BOLD activity to the CS− compared to the CS+ condition. The task saliences along with the voxel saliences for LV1 are included in Figure 2. The brain scores in Figure 2 indicate how strongly individual subjects express the condition differences identified in LV1. The collection of voxels that reliably expressed the condition differences with bootstrap ratios ≥ 3 are listed in Table 3.
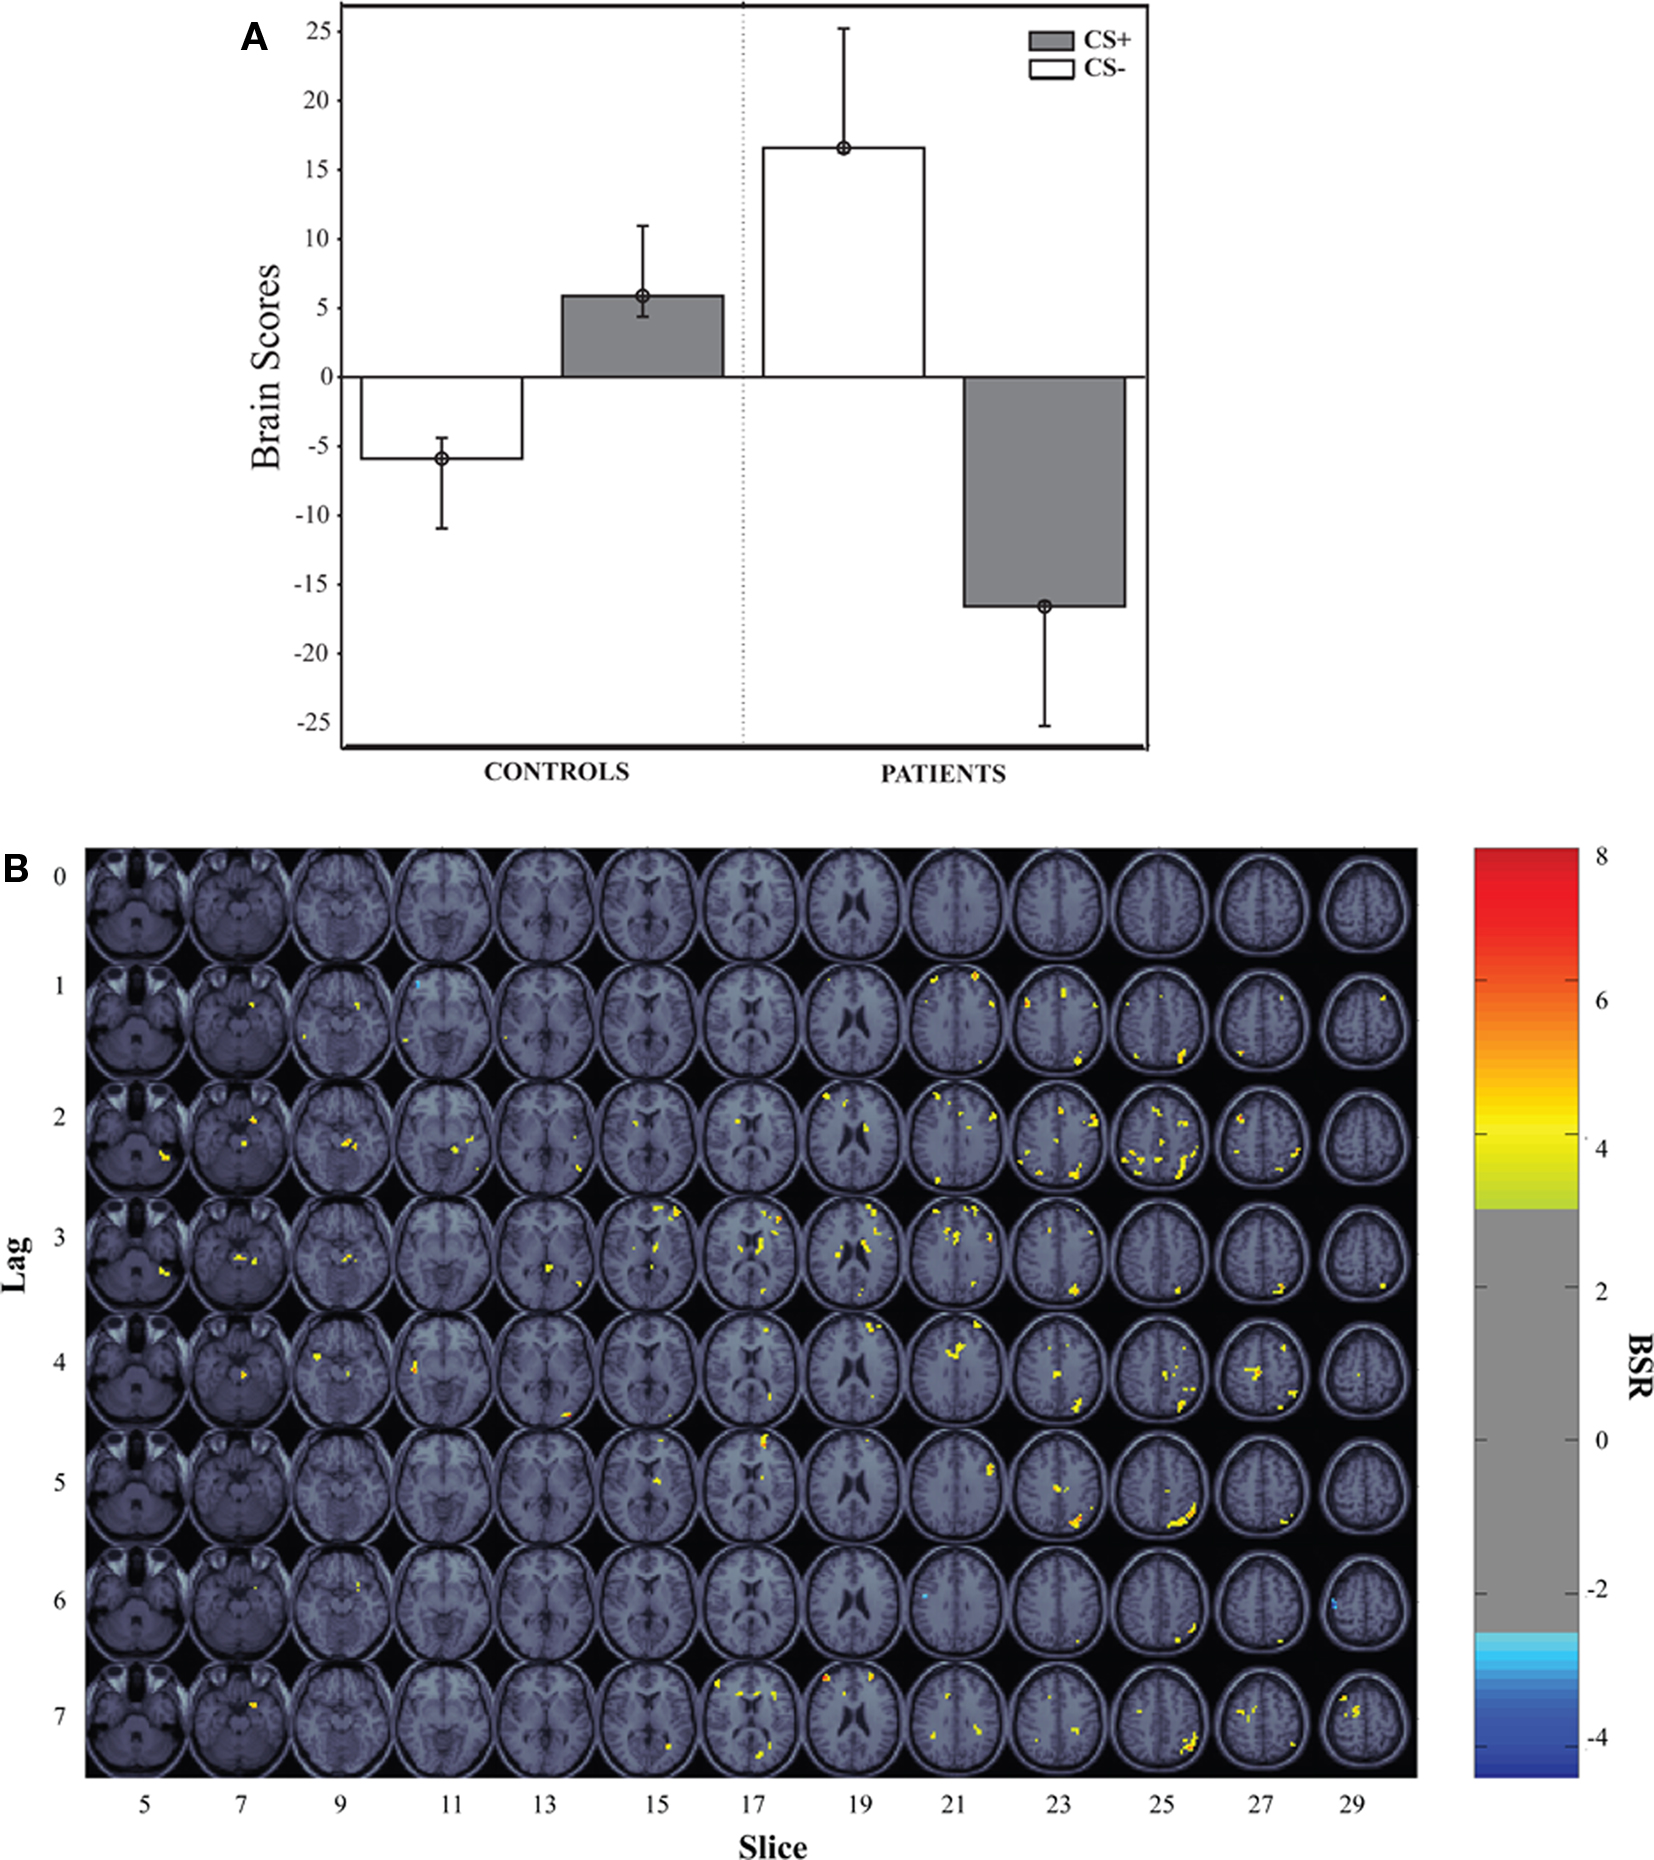
Figure 2. Mean-centered PLS results. This graph represents the task-dependent contrast for the first LV (57.41% crossblock covariance; p < 0.012, CS+ vs. CS−) from the PLS analysis for the healthy controls and patients along with its spatiotemporal distribution in the brain. (A) Brain scores illustrate the weighted average of activation patterns across all voxels and participants for the entire length of the experimental tasks pertaining to LV1. The bars represent 95% confidence intervals around the mean. Bootstrap estimation is used to derive confidence intervals around the subjects’ brain scores for each condition, in each group. (B) The regions that showed increased activity in response to the CS+ are superimposed over standard MRI template.
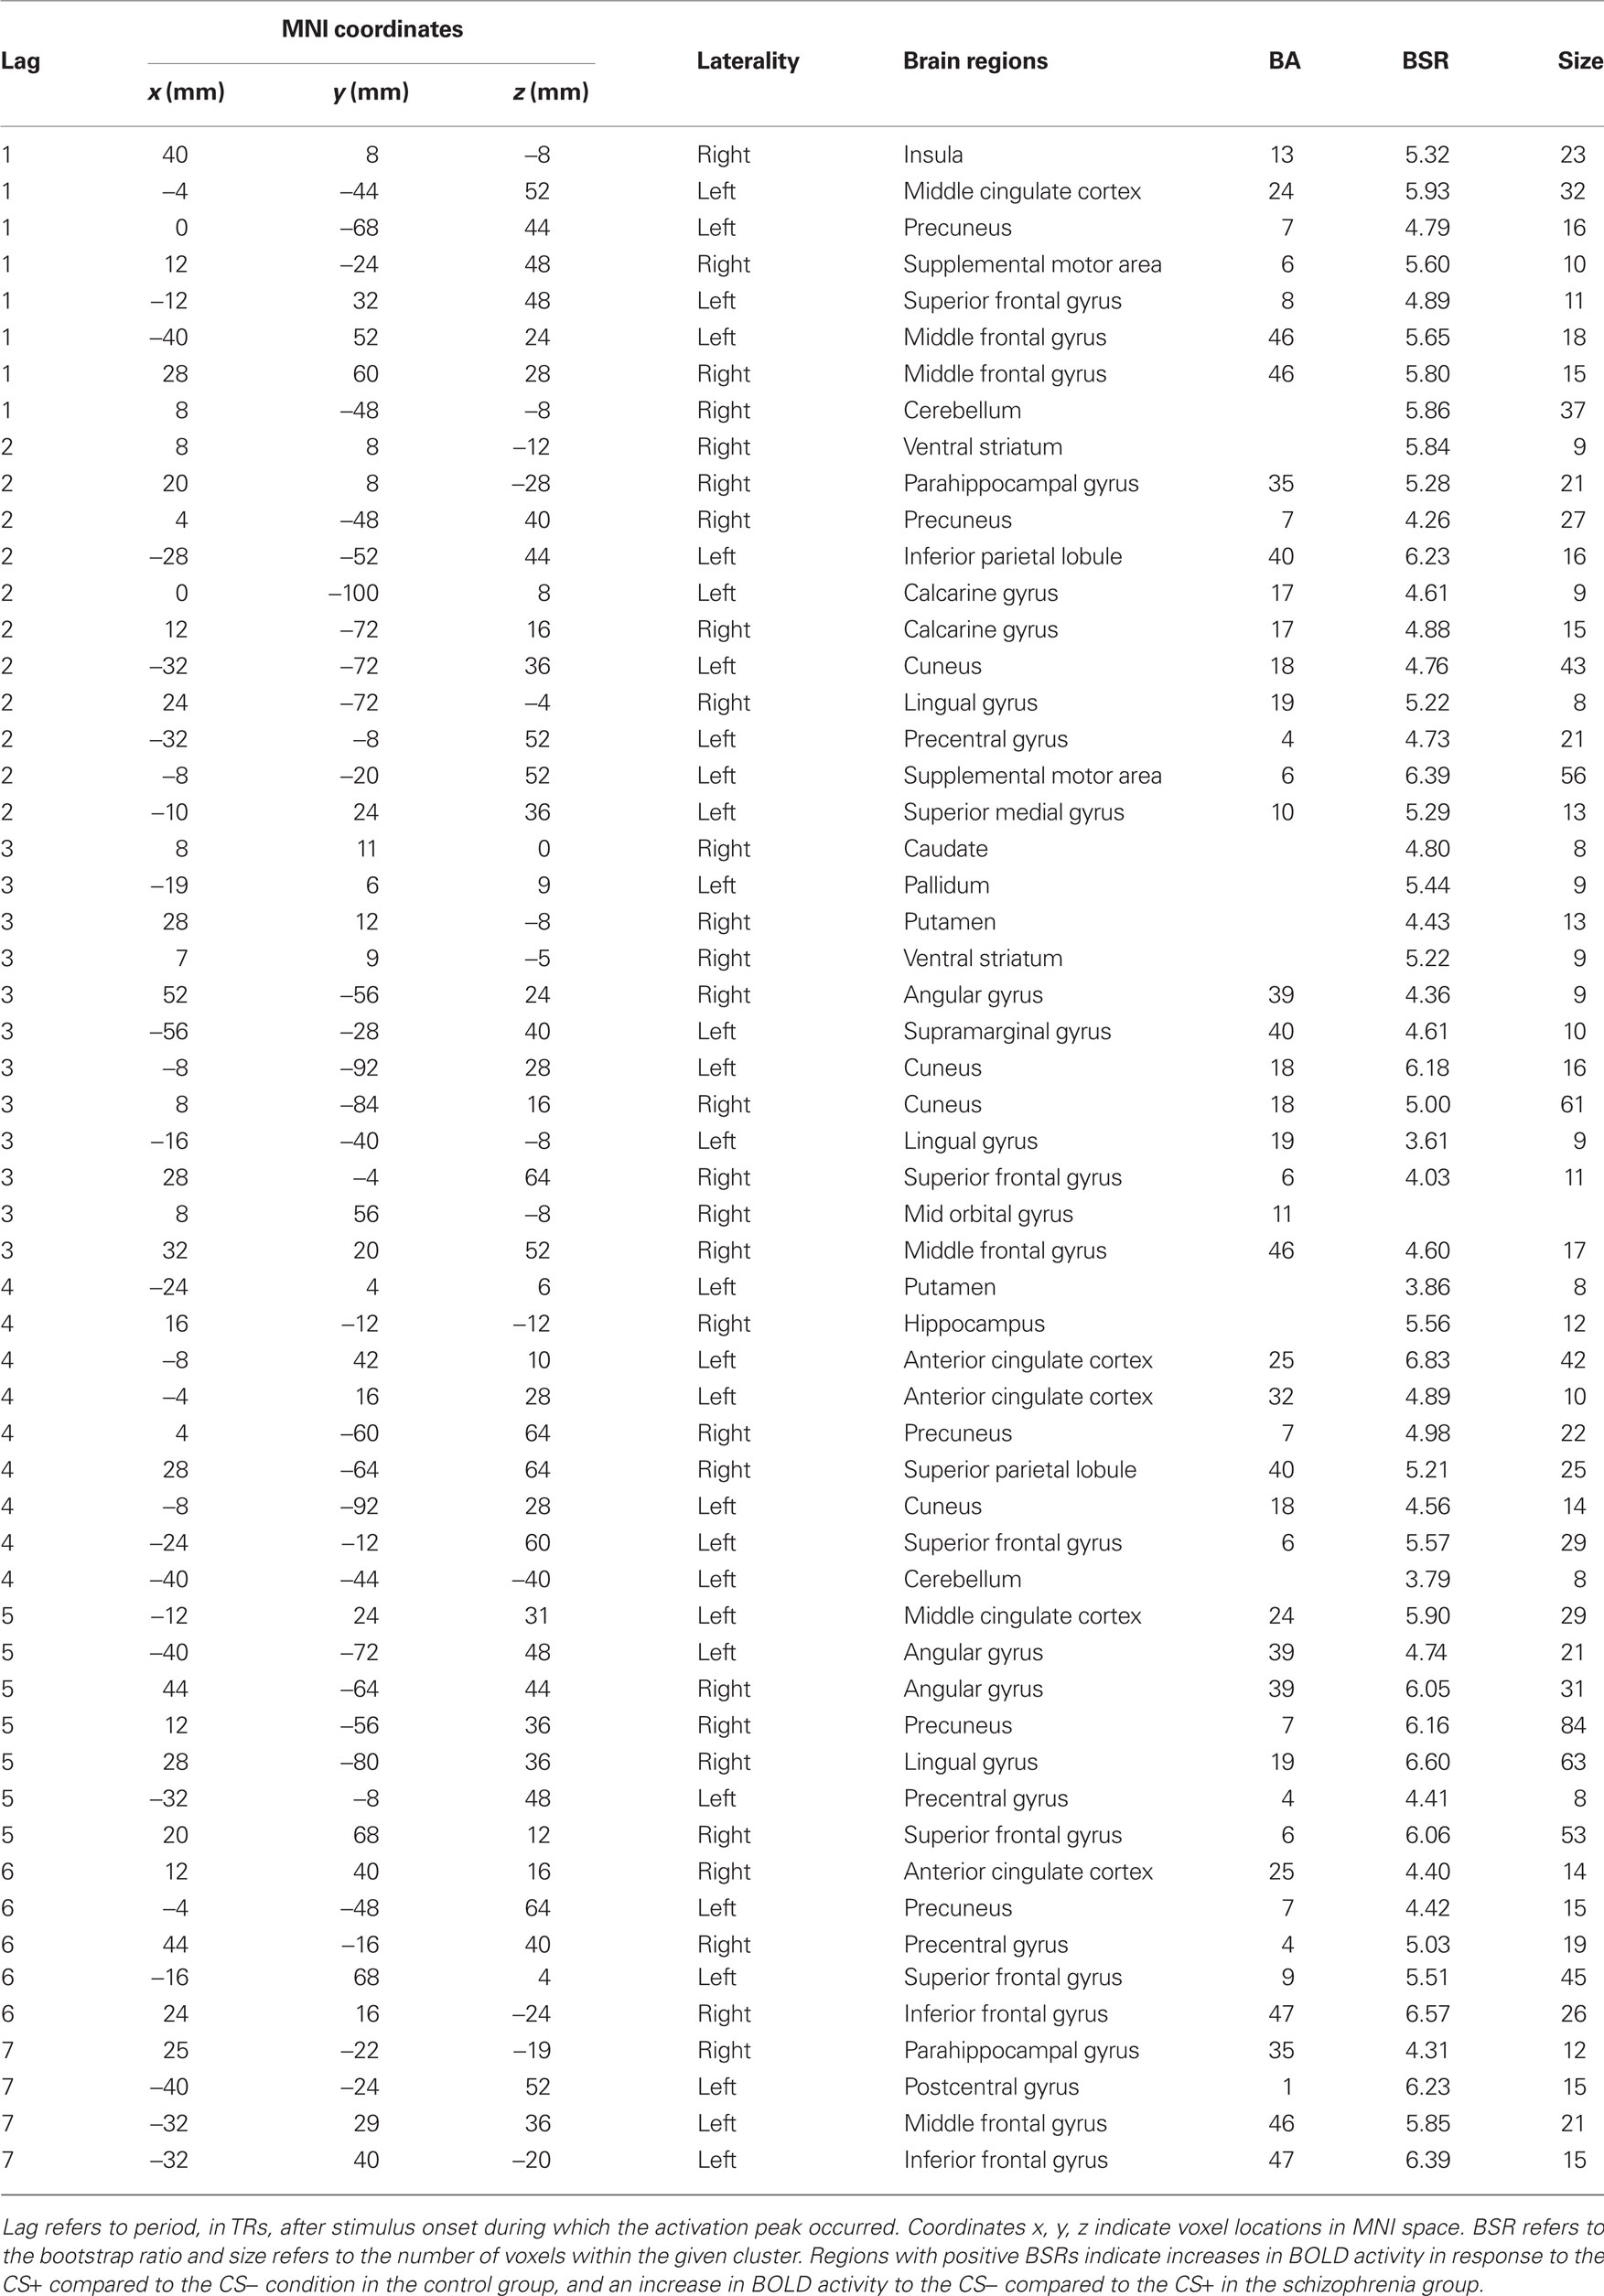
Table 3. Stable voxels from mean-centered PLS analysis in the two groups (LV1 = 57.41% crossblock covariance, p < 0.012).
Group differences in BOLD activity between CS+ and CS− conditions were observed in several brain regions including striatum, the right VS, right caudate, bilateral putamen (Figure 3), and right hippocampus, right ACC (BA 25), bilateral medial PFC (BA 10), and right orbitofrontal cortex (BA 11; Figure 4). In contrast to the control group, patients exhibited increased BOLD activity to the CS− compared to CS+ conditions in the aforementioned regions (see Figures 3 and 4).
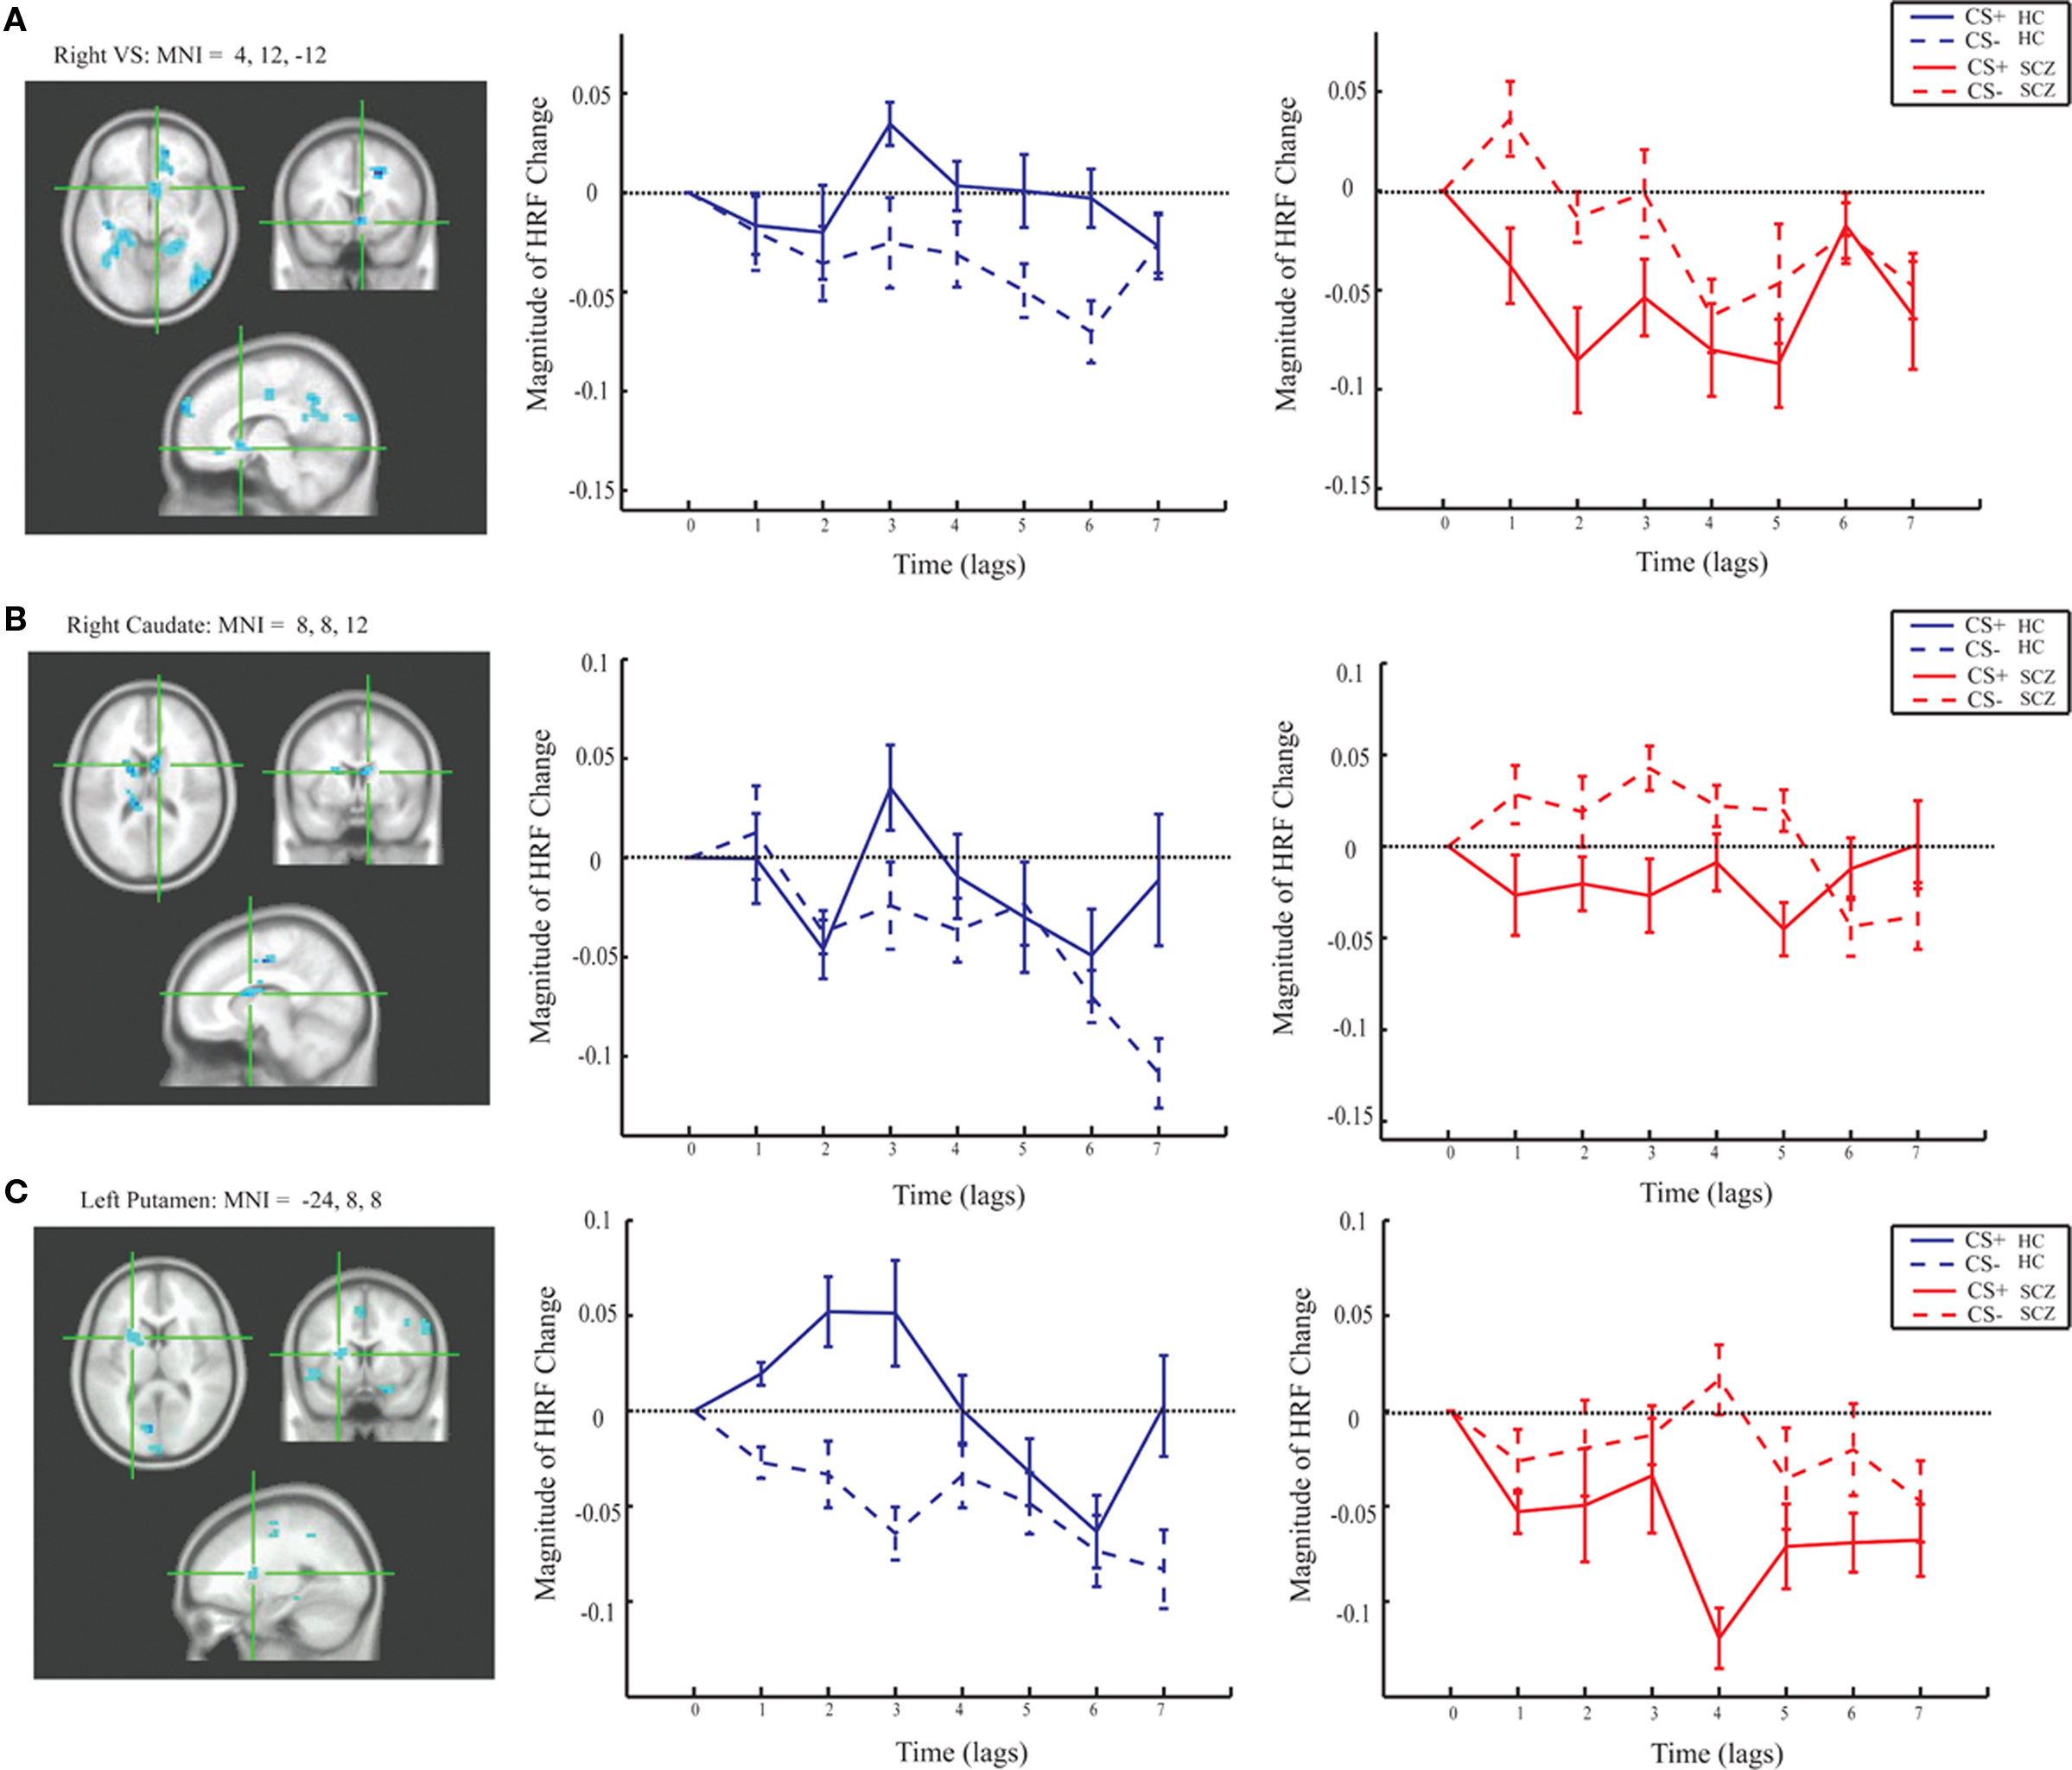
Figure 3. Magnitude HRF for the striatum from group task PLS analysis (LV 1). (A) right VS [MNI coordinates (x, y, z): 12, 10, −12]; (B) right caudate (MNI: 8, 7, 10); and (C) left putamen (MNI: −24, 8, 8) showed increased activity to the CS+ compared to the CS− in the control group, and increased activity to the CS− compared to the CS+ in the patient group.
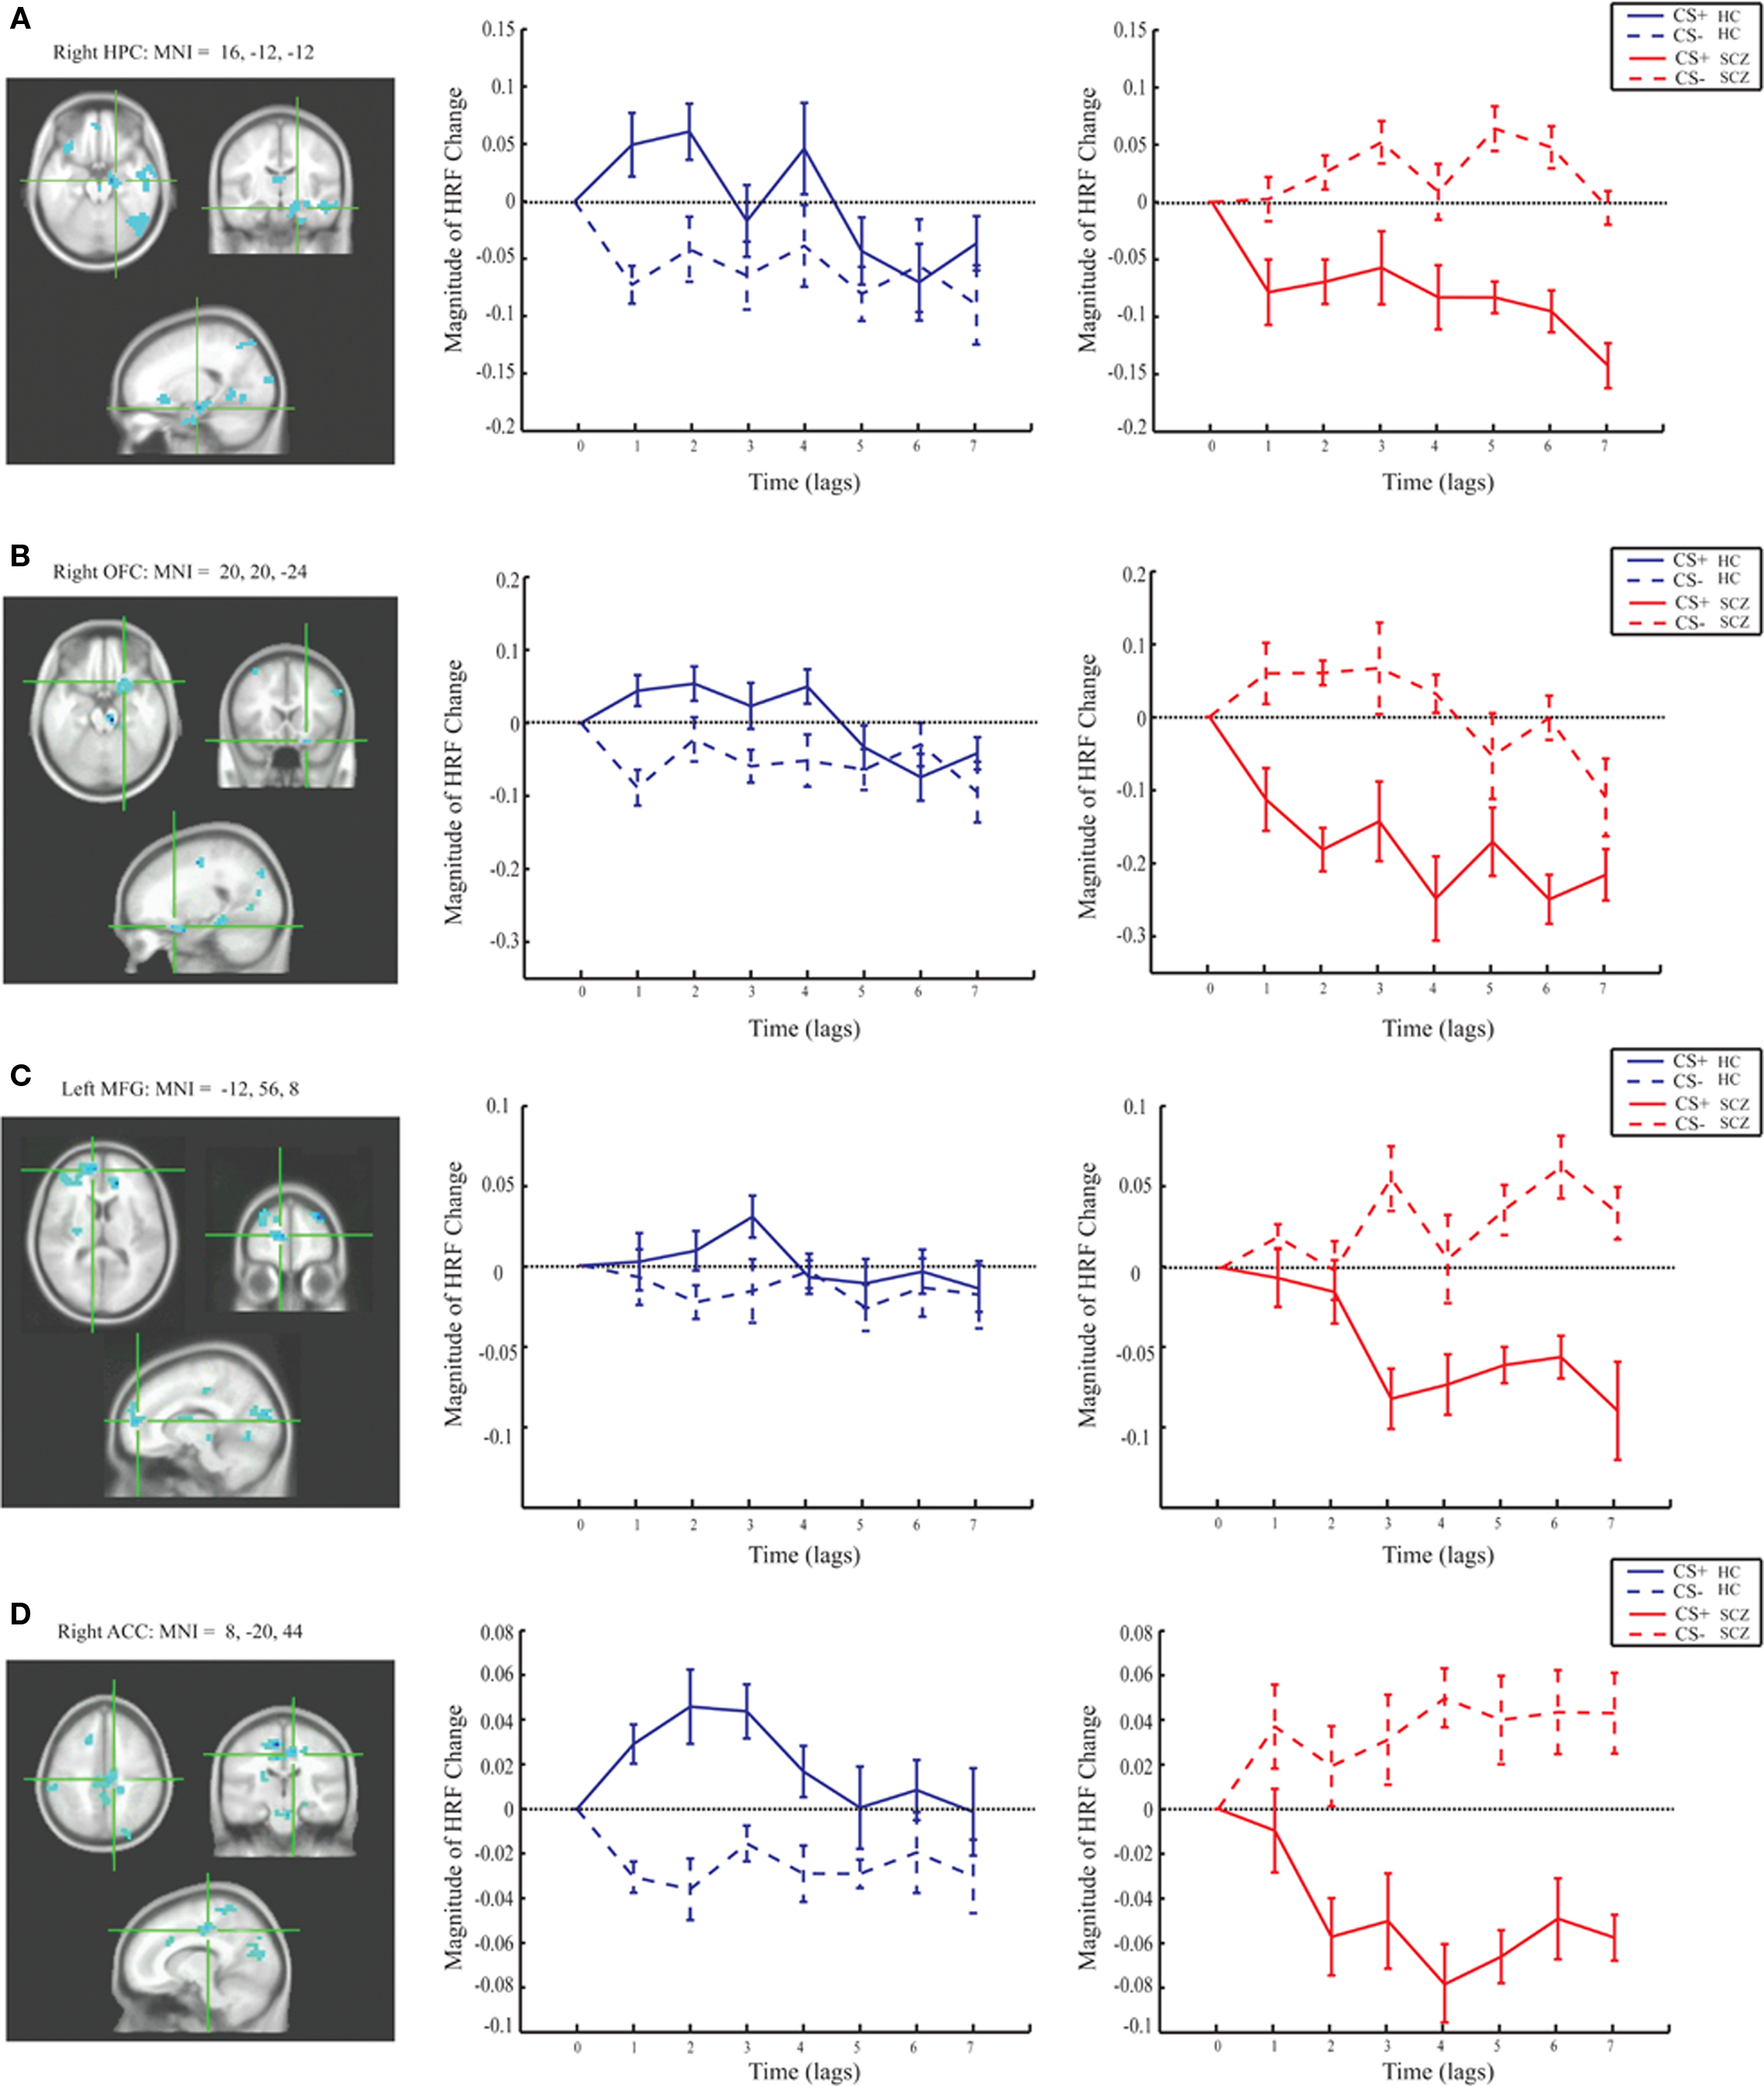
Figure 4. Magnitude HRF for the hippocampus, cingulate, and prefrontal regions from task PLS analysis (LV 1). The brain regions which showed increased activity in response to the CS+ compared to the CS− in the control group, and the opposite pattern in the patient group also included: (A) the right hippocampus [MNI coordinates (x, y, z): 24, 16, −28]; (B) right orbitofrontal cortex (BA 11; MNI: 20, 20, −24); (C) left medial frontal gyrus (BA 10; MNI: −12, 56, 8); (D) right anterior cingulate cortex (BA 32; MNI: 8, −20, 44).
SEM Results
The omnibus  (p < 0.0001) between the alternative and the null models indicated significant overall group by condition differences. Refer to Table 4 for the individual path coefficients across the two groups and two experimental conditions.
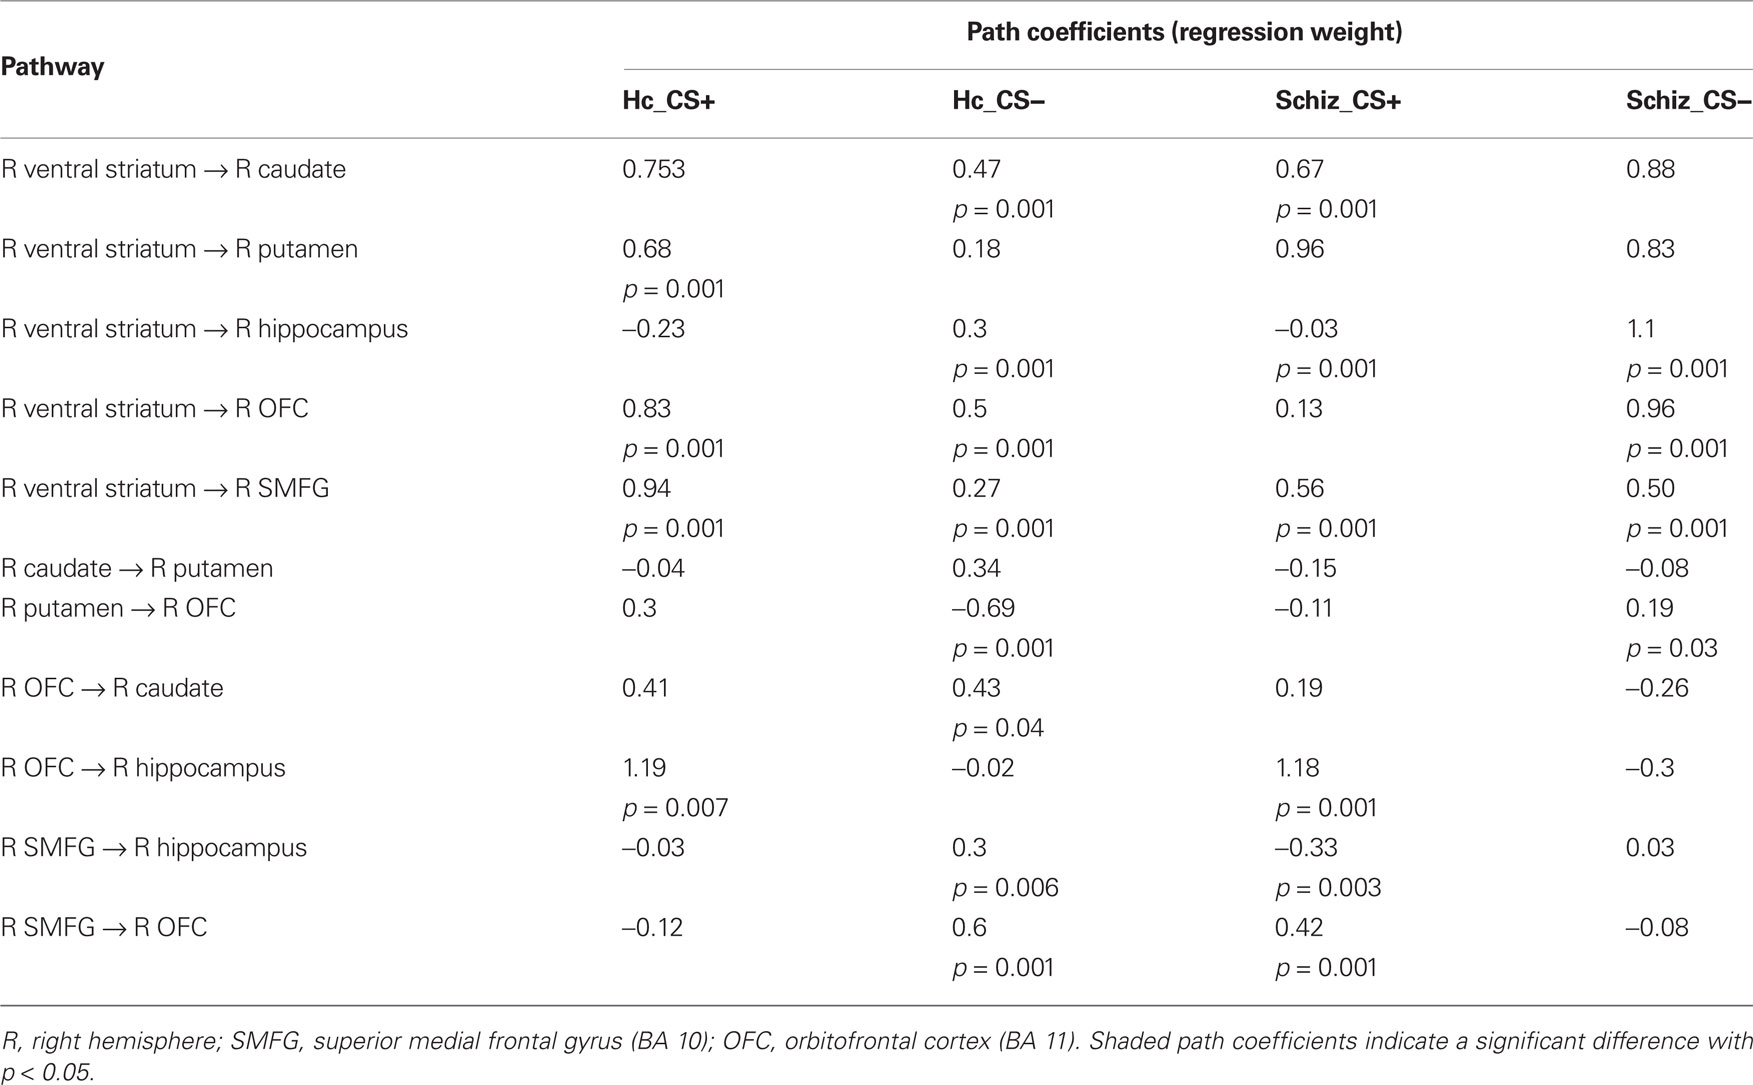
Table 4. Path coefficients and p values of the omnibus test across the two conditions and two groups.
In comparison to controls, patients exhibited significantly larger connectivity strengths from the (i) VS to the caudate, (ii) VS to the putamen, (iii) VS to the hippocampus, and (iv) VS to the OFC in the CS− condition, and from the VS to the superior medial frontal gyrus in response to both CS+ and CS− conditions. While controls showed increased connectivity from the OFC to the putamen, patients exhibited the opposite connectivity pattern in the CS− condition, from the putamen to the OFC. Increased effective connectivity from the OFC to the hippocampus was observed in the CS+ condition across both control and patient groups.
Pairwise comparisons between the two groups within each condition indicated a significant difference of model fit between the two groups in the CS− condition with  (p < 0.0001) and a difference of model fit in the CS+ condition with
  (p = 0.07) that did not exceed conventional statistical thresholds.
In the CS+ condition, path coefficients from the VS to the OFC (BA 11) were significantly lower in patients compared to healthy controls ( , p < 0.02; Table 5; Figures 5A,B).
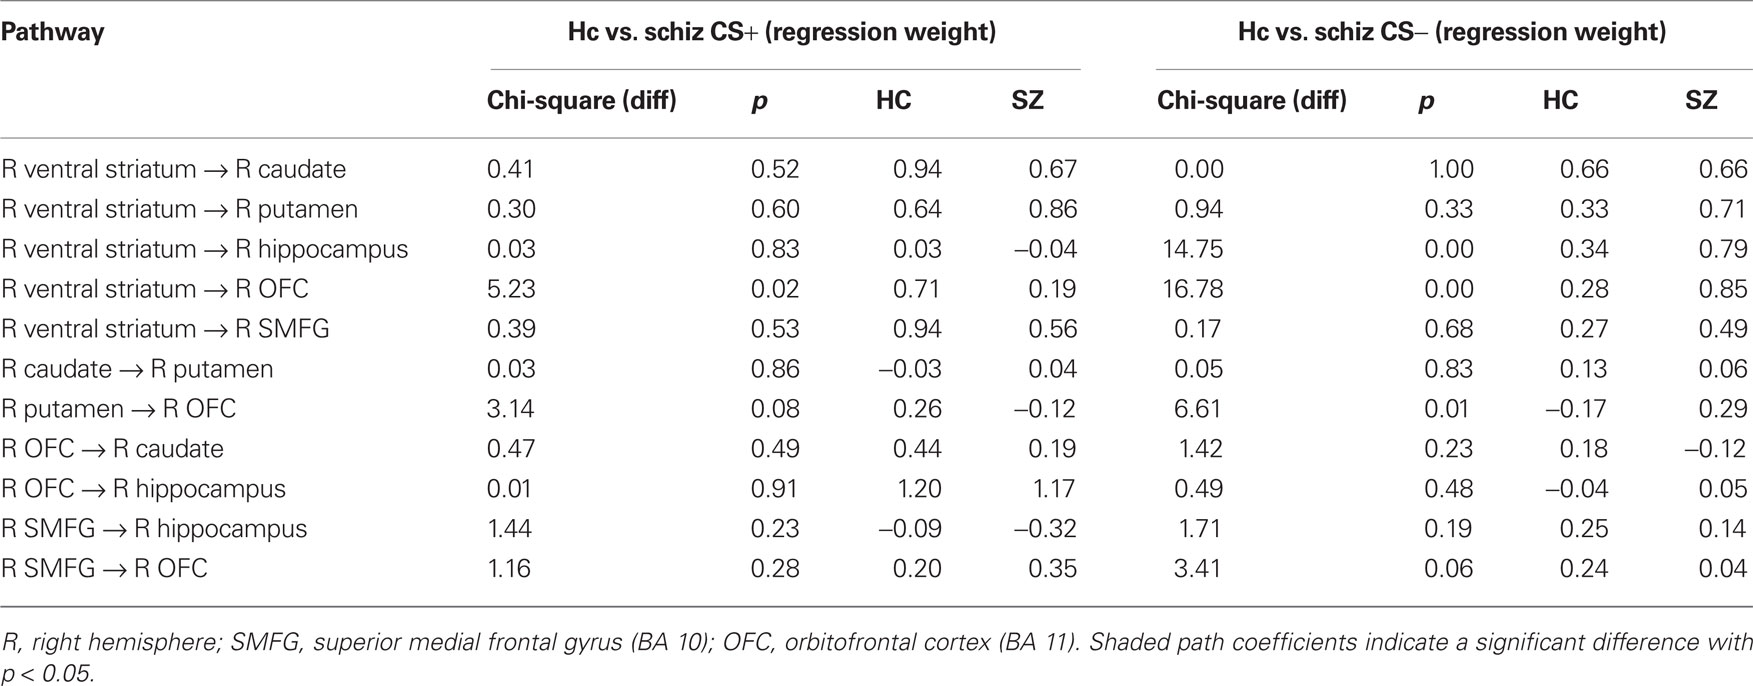
Table 5. Path coefficients,  and p values for group comparisons (hierarchical models approach) for healthy controls and schizophrenic patientsin CS+ and CS− conditions.
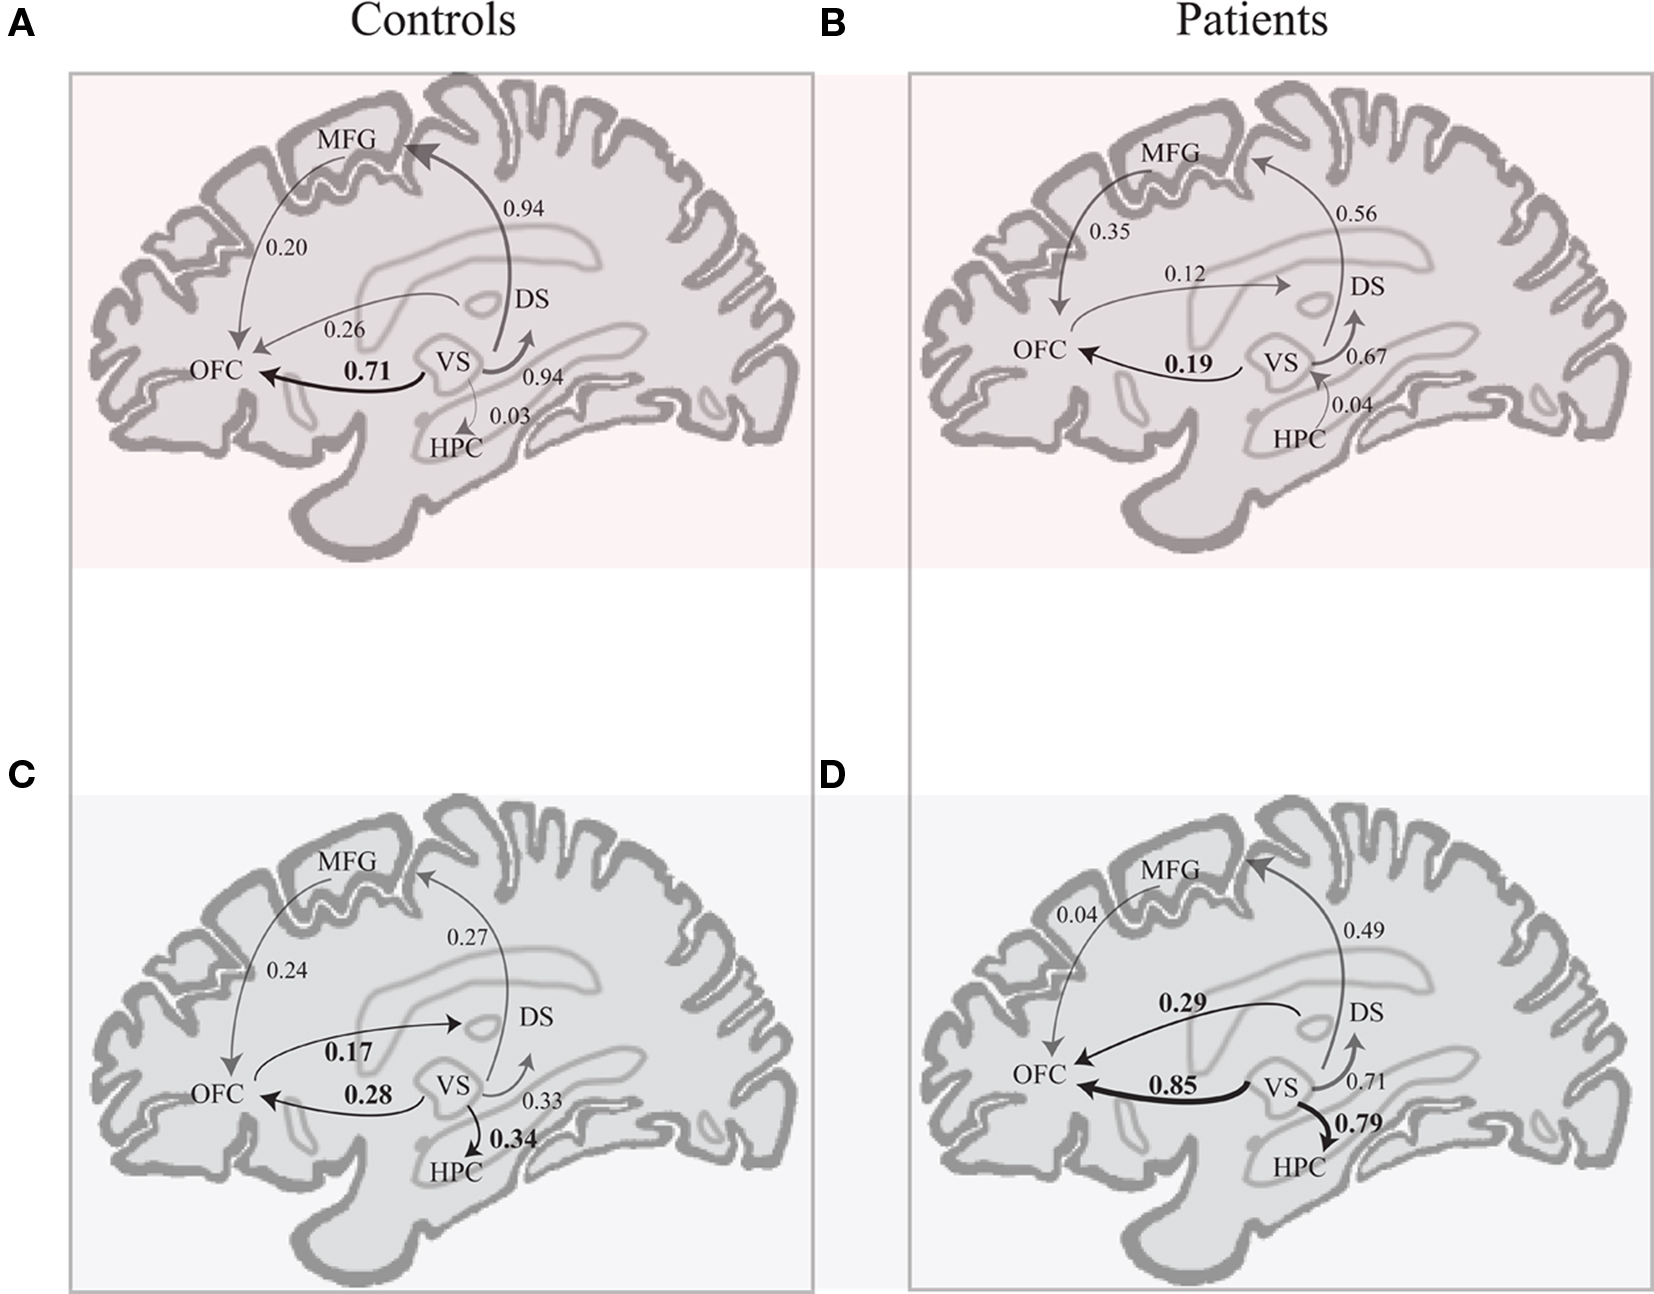
Figure 5. Schematic of effective connectivity network associated with the control and the schizophrenia patient group in the CS+ condition (A,B) and in the CS− condition (C,D). The regions illustrated in this diagram include: the ventral striatum (VS), putamen and caudate (dorsal striatum or DS), hippocampus (HPC), superior medial frontal gyrus (MFG; BA 10), and orbitofrontal cortex (OFC; BA 11).
In the CS− condition, path coefficients from the VS to the OFC and from the VS to the hippocampus were significantly larger in patients compared to healthy controls ( , p < 0.0001;
  , p < 0.0001). Larger connectivity strengths from the OFC to the putamen were observed in healthy controls and opposite connectivity strengths, from the putamen to the OFC, were detected in patients (
 , p < 0.01; Table 5; Figures 5C,D).
Discussion
Examination of group differences in the strength of effective connections provides insights into the “splitting” of functional integration between brain regions involved in reinforcement learning in patients with schizophrenia. As reported in recent neuroimaging studies (Jensen et al., 2008; Murray et al., 2008), we found that patients were unable to appropriately condition to monetary reward, and failed to appropriately distinguish rewarding from non-rewarding stimuli. Furthermore, this was associated with increases in BOLD activity in response to the CS− and abnormally larger connectivity strengths from the striatal to cortical regions in the CS− compared to the CS+ condition. These results suggest that patients processed the CS− as a motivationally salient cue, predictive of reward similar to how controls processed the CS+.
We found that abnormal learning patterns observed in patients were associated with increased activity in the ventral and dorsal striatum, hippocampus, parahippocampal gyrus (BA 35), bilateral ACC (BA 25), and medial prefrontal regions (BA 10/11) in response to the CS− compared to the CS+ conditions (Figures 2–4). The VS has been associated with both primary (Gottfried et al., 2002; O’Doherty et al., 2002; Jensen et al., 2003) and secondary reinforcement (Knutson et al., 2000, 2001; Kirsch et al., 2003; Zald et al., 2004; Zink et al., 2004; Seymour et al., 2007) across both appetitive and aversive conditioning paradigms. In schizophrenia patients, however, the VS showed abnormally larger BOLD activity to non-rewarding stimuli (cf. Hofer et al., 2001; Juckel et al., 2006; Jensen et al., 2008; Murray et al., 2008).
Using an aversive conditioning paradigm, Jensen et al. (2008) found that patients, compared to controls, showed pronounced VS activity to the CS− as compared to CS+. This task-irrelevant activation pattern was also accompanied by reduced learning as indexed by the GSR and self-report measures (Jensen et al., 2008). Furthermore, Murray et al. (2008) also found that patients with first-episode psychosis and positive schizophrenia symptoms were impaired at selectively responding to task-relevant stimuli (Murray et al., 2008). These behavioral deficits were accompanied by an attenuated BOLD response to reinforced relative to non-reinforced trials across several brain regions including the midbrain, striatum, and the ACC.
The present study also demonstrated that patients with schizophrenia exhibit aberrant effective connectivity patterns in CS+ and CS− conditions. Larger effective connectivity from the VS, dorsal striatum, and hippocampus to the OFC (BA 11) was observed in response to the CS− in patients, while controls showed a similar effective connectivity patterns, with increased connections from the VS to the OFC (BA 11), in the CS+ condition. Disruptions in hippocampal to prefrontal functional and effective connectivity have been previously shown (cf. Meyer-Lindenberg et al., 2001, 2005; Schlosser et al., 2003).
Due to the increased effective connectivity from the VS to the OFC (BA 11) in patients relative to controls, we would expect that patients with schizophrenia exhibit deficits in decision-making tasks, such as the Iowa gambling task (IGT), which measures the ability to weigh short-term rewards against long-term losses. We predict that patients would inappropriately attribute valence to stimuli that are non-predictive of reward, and select card decks of low frequency and high magnitude of punishments. Furthermore, patients would also exhibit more inconsistent or impulse choice behavior as they are not properly guided by reward information. Indeed, the literature on the IGT in schizophrenia provides evidence for such impairment in patients (cf. Shurman et al., 2005; Lee et al., 2007; Martino et al., 2007; Sevy et al., 2007; Premkumar et al., 2008).
The distinct effective connectivity patterns between the VS and the OFC between the two groups may reflect the functional network consequences of altered DA transmission in patients with schizophrenia. In a recent placebo-controlled, event-related fMRI study, we demonstrated that enhanced DA transmission via amphetamine, an indirect DA agonist, was associated with increased functional connectivity in response to the CS− condition in healthy volunteers (Diaconescu et al., 2010). Changes in the strength of functional connections following administration of DA agonists can be related to the large scale neurochemical perturbations observed in DA-related disorders such as schizophrenia.
It is important to note that the patients in this study were all medicated. Thus, we need to address the possibility that antipsychotic medication could contribute to the group differences in BOLD responses and connectivity patterns. Several neuroimaging studies demonstrated that atypical antipsychotic medication can reduce functional abnormalities in schizophrenia (Davis et al., 2005) by normalizing fronto-temporal activity (Lahti et al., 2003), and increasing functional connectivity between prefrontal, thalamic, and cerebellar regions (Stephan et al., 2001). Increased DA D2 receptor blockade with typical antipsychotic medication like haloperidol may interfere with dopaminergic neurotransmission in the VS. We also recently showed that in contrast to placebo, haloperidol administration in healthy volunteers was associated with increased functional connectivity in an alternate network which included the amygdala, the insula, the ACC (BA 24/32), middle frontal gyrus (BA 46), and supplementary motor area (SMA, BA 6) following the CS+ compared the CS− during aversive conditioning (Diaconescu et al., 2010).
The majority of the patients recruited in this study were medicated with atypical antipsychotics such as olanzapine. Previous studies that measured the effects of atypical antipsychotics on DA D2 receptor occupancy showed that atypical antipsychotics, including olanzapine which was administered in the majority of the patients recruited in this study, do not alter striatal dopaminergic transmission (Frankle et al., 2004; Kessler et al., 2005).
Investigating reward learning in schizophrenia, Murray et al. (2008) did not find any significant differences in midbrain and striatal activity between unmedicated patients and patients treated with atypical antipsychotics. With respect to VS activation in response to reward-indicating cues, Schlagenhauf et al. (2008) also found a lack of significant differences between healthy controls and patients treated with olanzapine.
The use of reinforcement learning paradigms coupled with effective connectivity measures offers insight into the relationship between abnormal reinforcement learning and disruptions in brain network connectivity across striatal, hippocampal, and prefrontal regions. The findings of abnormal GSR responses and increased BOLD activity and effective connectivity patterns during the CS− condition support the proposal that, following reward learning, non-reinforced stimuli become imbued with motivational salience in patients with schizophrenia compared to controls. The aberrant effective connectivity from the striatum and the hippocampus to the OFC in the CS− condition may also reflect the functional consequences of aberrant DA transmission and cortical plasticity in schizophrenia patients.
Conflict of Interest Statement
The authors declare that the research was conducted in the absence of any commercial or financial relationships that could be construed as a potential conflict of interest.
Acknowledgments
This research was supported by grants from the Canadian Institutes of Health Research, J. S. McDonnell Foundation (Anthony R. McIntosh), AstraZeneca (Shitij Kapur) and the Natural Sciences and Engineering Research Council of Canada (Andreea Oliviana Diaconescu).
References
Beckmann, C. F., and Smith, S. M. (2004). Probabilistic independent component analysis for functional magnetic resonance imaging. IEEE Trans. Med. Imaging 23, 137–152.
Bleuler, E. (1911). Dementia Praecox or the Group of Schizophrenias. New York: International University Press.
Bluhm, R. L., Miller, J., Lanius, R. A., Osuch, E. A., Boksman, K., Neufeld, R. W., Theberge, J., Schaefer, B., and Williamson, P. (2007). Spontaneous low-frequency fluctuations in the BOLD signal in schizophrenic patients: anomalies in the default network. Schizophr. Bull. 33, 1004–1012.
Bressler, S. L. (2003). Cortical coordination dynamics and the disorganization syndrome in schizophrenia. Neuropsychopharmacology 28(Suppl. 1), S35–S39.
Buchel, C., and Friston, K. J. (1997). Modulation of connectivity in visual pathways by attention: cortical interactions evaluated with structural equation modelling and fMRI. Cereb. Cortex 7, 768–778.
Bullmore, E., Horwitz, B., Honey, G., Brammer, M., Williams, S., and Sharma, T. (2000). How good is good enough in path analysis of fMRI data? Neuroimage 11, 289–301.
Calhoun, V. D., Eichele, T., and Pearlson, G. (2009). Functional brain networks in schizophrenia: a review. Front. Hum. Neurosci. 3:17. doi: 10.3389/neuro.09.017.2009
Cox, R. W. (1996). AFNI: software for analysis and visualization of functional magnetic resonance neuroimages. Comput. Biomed. Res. 29, 162–173.
Davis, C. E., Jeste, D. V., and Eyler, L. T. (2005). Review of longitudinal functional neuroimaging studies of drug treatments in patients with schizophrenia. Schizophr. Res. 78, 45–60.
Delgado, M. R., Nystrom, L. E., Fissell, C., Noll, D. C., and Fiez, J. A. (2000). Tracking the hemodynamic responses to reward and punishment in the striatum. J. Neurophysiol. 84, 3072–3077.
Diaconescu, A. O., Menon, M., Jensen, J., Kapur, S., and McIntosh, A. R. (2010). Dopamine-induced changes in neural network patterns supporting aversive conditioning. Brain Res. 1313, 143–161.
Ferry, A. T., Ongur, D., An, X., and Price, J. L. (2000). Prefrontal cortical projections to the striatum in macaque monkeys: evidence for an organization related to prefrontal networks. J. Comp. Neurol. 425, 447–470.
Frankle, W. G., Gil, R., Hackett, E., Mawlawi, O., Zea-Ponce, Y., Zhu, Z., Kochan, L. D., Cangiano, C., Slifstein, M., Gorman, J. M., Laruelle, M., and Abi-Dargham, A. (2004). Occupancy of dopamine D2 receptors by the atypical antipsychotic drugs risperidone and olanzapine: theoretical implications. Psychopharmacology (Berl.) 175, 473–480.
Friedman, D. P., Aggleton, J. P., and Saunders, R. C. (2002). Comparison of hippocampal, amygdala, and perirhinal projections to the nucleus accumbens: combined anterograde and retrograde tracing study in the macaque brain. J. Comp. Neurol. 450, 345–365.
Friston, K. J. (2007). Statistical Parametric Mapping: The Analysis of Functional Brain Images. London: Academic Press.
Friston, K. J., and Frith, C. D. (1995). Schizophrenia: a disconnection syndrome? Clin. Neurosci. 3, 89–97.
Garrity, A. G., Pearlson, G. D., McKiernan, K., Lloyd, D., Kiehl, K. A., and Calhoun, V. D. (2007). Aberrant “default mode” functional connectivity in schizophrenia. Am. J. Psychiatry 164, 450–457.
Glover, G. H., and Thomason, M. E. (2004). Improved combination of spiral-in/out images for BOLD fMRI. Magn. Reson. Med. 51, 863–868.
Gottfried, J. A., O’Doherty, J., and Dolan, R. J. (2002). Appetitive and aversive olfactory learning in humans studied using event-related functional magnetic resonance imaging. J. Neurosci. 22, 10829–10837.
Haber, S. N., and Knutson, B. (2010). The reward circuit: linking primate anatomy and human imaging. Neuropsychopharmacology 35, 4–26.
Haber, S. N., Kunishio, K., Mizobuchi, M., and Lynd-Balta, E. (1995). The orbital and medial prefrontal circuit through the primate basal ganglia. J. Neurosci. 15, 4851–4867.
Hofer, E., Doby, D., Anderer, P., and Dantendorfer, K. (2001). Impaired conditional discrimination learning in schizophrenia. Schizophr. Res. 51, 127–136.
Honey, G. D., Pomarol-Clotet, E., Corlett, P. R., Honey, R. A., McKenna, P. J., Bullmore, E. T., and Fletcher, P. C. (2005). Functional dysconnectivity in schizophrenia associated with attentional modulation of motor function. Brain 128, 2597–2611.
Jennings, J. M., McIntosh, A. R., Kapur, S., Zipursky, R. B., and Houle, S. (1998). Functional network differences in schizophrenia: a rCBF study of semantic processing. Neuroreport 9, 1697–1700.
Jensen, J., McIntosh, A. R., Crawley, A. P., Mikulis, D. J., Remington, G., and Kapur, S. (2003). Direct activation of the ventral striatum in anticipation of aversive stimuli. Neuron 40, 1251–1257.
Jensen, J., Willeit, M., Zipursky, R. B., Savina, I., Smith, A. J., Menon, M., Crawley, A. P., and Kapur, S. (2008). The formation of abnormal associations in schizophrenia: neural and behavioral evidence. Neuropsychopharmacology 33, 473–479.
Juckel, G., Schlagenhauf, F., Koslowski, M., Filonov, D., Wustenberg, T., Villringer, A., Knutson, B., Kienast, T., Gallinat, J., Wrase, J., and Heinz, A. (2006). Dysfunction of ventral striatal reward prediction in schizophrenic patients treated with typical, not atypical, neuroleptics. Psychopharmacology (Berl.) 187, 222–228.
Kessler, R. M., Ansari, M. S., Riccardi, P., Li, R., Jayathilake, K., Dawant, B., and Meltzer, H. Y. (2005). Occupancy of striatal and extrastriatal dopamine D2/D3 receptors by olanzapine and haloperidol. Neuropsychopharmacology 30, 2283–2289.
Kim, D. I., Manoach, D. S., Mathalon, D. H., Turner, J. A., Mannell, M., Brown, G. G., Ford, J. M., Gollub, R. L., White, T., Wible, C., Belger, A., Bockholt, H. J., Clark, V. P., Lauriello, J., O’Leary, D., Mueller, B. A., Lim, K. O., Andreasen, N., Potkin, S. G., and Calhoun, V. D. (2009). Dysregulation of working memory and default-mode networks in schizophrenia using independent component analysis, an fBIRN and MCIC study. Hum. Brain Mapp. 30, 3795–3811.
Kim, J. J., Ho Seok, J., Park, H. J., Soo Lee, D., Chul Lee, M., and Kwon, J. S. (2005). Functional disconnection of the semantic networks in schizophrenia. Neuroreport 16, 355–359.
Kirsch, P., Schienle, A., Stark, R., Sammer, G., Blecker, C., Walter, B., Ott, U., Burkart, J., and Vaitl, D. (2003). Anticipation of reward in a nonaversive differential conditioning paradigm and the brain reward system: an event-related fMRI study. Neuroimage 20, 1086–1095.
Knutson, B., Adams, C. M., Fong, G. W., and Hommer, D. (2001). Anticipation of increasing monetary reward selectively recruits nucleus accumbens. J. Neurosci. 21, RC159.
Knutson, B., Westdorp, A., Kaiser, E., and Hommer, D. (2000). FMRI visualization of brain activity during a monetary incentive delay task. Neuroimage 12, 20–27.
Lahti, A. C., Holcomb, H. H., Weiler, M. A., Medoff, D. R., and Tamminga, C. A. (2003). Functional effects of antipsychotic drugs: comparing clozapine with haloperidol. Biol. Psychiatry 53, 601–608.
Lawrie, S. M., Buechel, C., Whalley, H. C., Frith, C. D., Friston, K. J., and Johnstone, E. C. (2002). Reduced frontotemporal functional connectivity in schizophrenia associated with auditory hallucinations. Biol. Psychiatry 51, 1008–1011.
Lee, Y., Kim, Y., T., Seo, E., Park, O., Jeong, S. H., Kim, S. H., and Lee, S. J. (2007). Dissociation of emotional decision-making from cognitive decision-making in chronic schizophrenia. Psychiatry Res. 152, 113–120.
Martino, D. J., Bucay, D., Butman, J. T., and Allegri, R., F. (2007). Neuropsychological frontal impairments and negative symptoms in schizophrenia. Psychiatry Res. 152, 121–128.
McIntosh, A. R. (1999). Mapping cognition to the brain through neural interactions. Memory 7, 523–548.
McIntosh, A. R., Bookstein, F. L., Haxby, J. V., and Grady, C. L. (1996). Spatial pattern analysis of functional brain images using partial least squares. Neuroimage 3, 143–157.
McIntosh, A. R., and Gonzalez-Lima, F. (1994). Structural equation modeling and its application to network analysis in functional brain imaging. Hum. Brain Mapp. 2, 2–22.
McIntosh, A. R., and Lobaugh, N. J. (2004). Partial least squares analysis of neuroimaging data: applications and advances. Neuroimage 23(Suppl. 1), S250–S263.
Mechelli, A., Allen, P., Amaro, E. Jr., Fu, C. H., Williams, S. C., Brammer, M. J., Johns, L. C., and McGuire, P. K.(2007). Misattribution of speech and impaired connectivity in patients with auditory verbal hallucinations. Hum. Brain Mapp. 28, 1213–1222.
Meyer-Lindenberg, A., Poline, J. B., Kohn, P. D., Holt, J. L., Egan, M. F., Weinberger, D. R., and Berman, K. F. (2001). Evidence for abnormal cortical functional connectivity during working memory in schizophrenia. Am. J. Psychiatry 158, 1809–1817.
Meyer-Lindenberg, A. S., Olsen, R. K., Kohn, P. D., Brown, T., Egan, M. F., Weinberger, D. R., Berman, K. F. (2005). Regionally specific disturbance of dorsolateral prefrontal–hippocampal functional connectivity in schizophrenia. Arch. Gen. Psychiatry 62, 379–386.
Murray, G. K., Corlett, P. R., Clark, L., Pessiglione, M., Blackwell, A. D., Honey, G., Jones, P. B., Bullmore, E. T., Robbins, T. W., and Fletcher, P. C. (2008). Substantia nigra/ventral tegmental reward prediction error disruption in psychosis. Mol. Psychiatry 13, 267–276.
O’Doherty, J. P., Deichmann, R., Critchley, H. D., and Dolan, R. J. (2002). Neural responses during anticipation of a primary taste reward. Neuron 33, 815–826.
Premkumar, P., Fannon, D., Kuipers, E., Simmons, A., Frangou, S., and, Kumari, V. (2008). Emotional decision-making and its dissociable components in schizophrenia and schizoaffective disorder: a behavioural and MRI investigation. Neuropsychologia 46, 2002–2012.
Protzner, A. B., and McIntosh, A. R. (2006). Testing effective connectivity changes with structural equation modeling: what does a bad model tell us? Hum. Brain Mapp. 27, 935–947.
Schlagenhauf, F., Juckel, G., Koslowski, M., Kahnt, T., Knutson, B., Dembler, T., Kienast, T., Gallinat, J., Wrase, J., and Heinz, A. (2008). Reward system activation in schizophrenic patients switched from typical neuroleptics to olanzapine. Psychopharmacology (Berl.) 196, 673–684.
Schlagenhauf, F., Sterzer, P., Schmack, K., Ballmaier, M., Rapp, M., Wrase, J., Juckel, G., Gallinat, J., and Heinz, A. (2009). Reward feedback alterations in unmedicated schizophrenia patients: relevance for delusions. Biol. Psychiatry 65, 1032–1039.
Schlosser, R., Gesierich, T., Kaufmann, B., Vucurevic, G., Hunsche, S., Gawehn, J., and Stoeter, P. (2003). Altered effective connectivity during working memory performance in schizophrenia: a study with fMRI and structural equation modeling. Neuroimage 19, 751–763.
Sears, L. L., Andreasen, N. C., and O’Leary, D. S. (2000). Cerebellar functional abnormalities in schizophrenia are suggested by classical eyeblink conditioning. Biol. Psychiatry 48, 204–209.
Sevy, S., Burdick, K., E., Visweswaraiah, H., Abdelmessih, S., Lukin, M., Yechiam, E., and Bechara, A. (2007). Iowa gambling task in schizophrenia: a review and new data in patients with schizophrenia and co-occurring cannabis use disorders. Schizophr. Res. 92, 74–84.
Seymour, B., Daw, N., Dayan, P., Singer, T., and Dolan, R. (2007). Differential encoding of losses and gains in the human striatum. J. Neurosci. 27, 4826–4831.
Shurman, B., Horan, W. P., and Nuechterlein, K. H. (2005). Schizophrenia patients demonstrate a distinctive pattern of decision-making impairment on the Iowa gambling task. Schizophr. Res. 72, 215–224.
Stephan, K. E., Friston, K. J., and Frith, C. D. (2009). Dysconnection in schizophrenia: from abnormal synaptic plasticity to failures of self-monitoring. Schizophr. Bull. 35, 509–527.
Stephan, K. E., Magnotta, V. A., White, T., Arndt, S., Flaum, M., O’Leary, D. S., Andreasen, N. C. (2001). Effects of olanzapine on cerebellar functional connectivity in schizophrenia measured by fMRI during a simple motor task. Psychol. Med. 31, 1065–1078.
Wolf, D. H., Gur, R. C., Valdez, J. N., Loughead, J., Elliott, M. A., Gur, R. E., and Ragland, J. D. (2007). Alterations of fronto-temporal connectivity during word encoding in schizophrenia. Psychiatry Res. 154, 221–232.
Zald, D. H., Boileau, I., El-Dearedy, W., Gunn, R., McGlone, F., Dichter, G. S., and Dagher, A. (2004). Dopamine transmission in the human striatum during monetary reward tasks. J. Neurosci. 24, 4105–4112.
Zhou, Y., Liang, M., Jiang, T., Tian, L., Liu, Y., Liu, Z., Liu, H., and Kuang, F. (2007). Functional dysconnectivity of the dorsolateral prefrontal cortex in first- episode schizophrenia using resting-state fMRI. Neurosci. Lett. 417, 297–302.
Keywords: schizophrenia, appetitive conditioning, fMRI, effective connectivity
Citation: Diaconescu AO, Jensen J, Wang H, Willeit M, Menon M, Kapur S and McIntosh AR (2011) Aberrant effective connectivity in schizophrenia patients during appetitive conditioning. Front. Hum. Neurosci. 4:239. doi: 10.3389/fnhum.2010.00239
Received: 07 September 2010;
Paper pending published: 12 October 2010;
Accepted: 25 December 2010;
Published online: 17 January 2011.
Edited by:
Shuhei Yamaguchi, Shimane University, JapanCopyright: © 2011 Diaconescu, Jensen, Wang, Willeit, Menon, Kapur and McIntosh. This is an open-access article subject to an exclusive license agreement between the authors and the Frontiers Research Foundation, which permits unrestricted use, distribution, and reproduction in any medium, provided the original authors and source are credited.
*Correspondence: Andreea Oliviana Diaconescu, Rotman Research Institute, Baycrest Centre, 3560 Bathurst Street, Toronto, ON, Canada M6A 2E1.e-mail: adiaconescu@rotman-baycrest.on.ca