Visual mismatch negativity reveals automatic detection of sequential regularity violation
- 1 Institute for Psychology, Hungarian Academy of Sciences, Budapest, Hungary
- 2 Laboratory for Social and Neural Systems Research, Department of Economics, University of Zurich, Zurich, Switzerland
- 3 Institute of Psychology I, University of Leipzig, Leipzig, Germany
Sequential regularities are abstract rules based on repeating sequences of environmental events, which are useful to make predictions about future events. Here, we tested whether the visual system is capable to detect sequential regularity in unattended stimulus sequences. The visual mismatch negativity (vMMN) component of the event-related potentials is sensitive to the violation of complex regularities (e.g., object-related characteristics, temporal patterns). We used the vMMN component as an index of violation of conditional (if, then) regularities. In the first experiment, to investigate emergence of vMMN and other change-related activity to the violation of conditional rules, red and green disk patterns were delivered in pairs. The majority of pairs comprised of disk patterns with identical colors, whereas in deviant pairs the colors were different. The probabilities of the two colors were equal. The second member of the deviant pairs elicited a vMMN with longer latency and more extended spatial distribution to deviants with lower probability (10 vs. 30%). In the second (control) experiment the emergence of vMMN to violation of a simple, feature-related rule was studied using oddball sequences of stimulus pairs where deviant colors were presented with 20% probabilities. Deviant colored patterns elicited a vMMN, and this component was larger for the second member of the pair, i.e., after a shorter inter-stimulus interval. This result corresponds to the SOA/(v)MMN relationship, expected on the basis of a memory-mismatch process. Our results show that the system underlying vMMN is sensitive to abstract, conditional rules. Representation of such rules implicates expectation of a subsequent event, therefore vMMN can be considered as a correlate of violated predictions about the characteristics of environmental events.
In the absence of focal attention even large visual changes may remain unnoticed (Simons and Levin, 1997). However, an increased body of studies shows that the human brain is capable of detecting even small visual changes, especially if such changes violate established environmental regularities. An indicator of the automatic change detection is the visual mismatch negativity (vMMN) component of the event-related potentials (ERPs). VMMN is a counterpart of the auditory mismatch negativity (for reviews see Näätänen and Winkler, 1999; Näätänen et al., 2007), and typically elicited by stimuli with infrequent (deviant) features embedded in streams of identical (standard) stimuli. VMMN is elicited by deviant color (Czigler et al., 2002), orientation (Astikainen et al., 2004; Kimura et al., 2010a), movement (Pazo-Alvarez et al., 2004), spatial frequency (Heslenfeld, 2003), contrast (Stagg et al., 2004, for reviews see Pazo-Alvarez et al., 2003; Czigler, 2007, 2010). In the current study we investigated the ability of the system underlying vMMN to register conditional rules. Acquisition of such rules implicates memory for predictive relationships, i.e., expectation of a stimulus “A”, if this stimulus was preceded by a stimulus “B” with certain characteristics. Prior results showed that vMMN is elicited by stimuli violating sequential rules. Czigler et al. (2006) presented colored patterns in AABBAABB… order, where A and B refers to red-black and green-black checkerboard patterns, respectively. Infrequently, a third pattern identical to the previous two (AABBB) was presented. Such deviant repetitions elicited a vMMN-like posterior negativity. Violation of stimulus alternation rule also elicited vMMN (Kimura et al., 2010a). In these studies sequential regularities were defined by a particular pattern of short duration. It is possible, that vMMN appeared as result of mismatch between the stored and presented patterns. This possibility is supported by the results of the study by Kimura et al. (2010b) showing that regularly repeating patterns (e.g., SSSSDSSSSDSSSSD…) were automatically registered only if the duration of a pattern was no longer than approximately 1 s. Furthermore, attention to the non-sequential aspects of the visual stimuli may prevent the automatic detection of regularity violation (Kimura et al., 2010c).
The sequential rule tested in the present study cannot be represented as a single repeating pattern of sequential features. In our study two colored patterns consisting of either red or green disks were presented with equal probability. As a rule, stimuli within a pair had identical color, and this rule was violated by infrequent pairs with different colors. Accordingly, the regularity was based on the repetition of a particular feature within a pair, but this feature was not identical between all the pairs in the stimulus stream. We expected emergence of vMMN to the second member of deviant pairs with non-repeating colors. Detection of the sequential deviancy would indicate that the first member of the stimulus pair established an unconscious prediction about the color of the forthcoming stimulus. To investigate the sensitivity of the system underlying the vMMN, we presented sequences with 10 and 30% deviant pairs. We expected a more distinct vMMN response in the 10% condition compared to the 30% condition, based on known effects of probability on the auditory MMN (Sato et al., 2000).
Automatic detection of visual changes is also reflected by a posterior positive component, the so-called change-related positivity (Fu et al., 2003; Wang et al., 2003; Kimura et al., 2005, 2006a). In our first experiment we expected the emergence of change-related positivity to the second members of pairs with different colors in sequences without conditional rules, i.e., in paired stimulation with identical probability of identical and different members of the pairs. In the present study we contrasted this situation to the effect of within-pair identity rule. Our second experiment served as a control to test whether the stimuli used in Experiment 1 was feasible to elicit a typical vMMN response.
Experiment 1: Random Sequence
Methods
Participants
We recorded ERP responses from 15 healthy subjects in this experiment. Two subjects’ data were excluded from the final analysis due to low trial number or lack of canonical ERP responses. The final sample comprised 13 subjects (mean age = 21.9 years, SD = 2.5 years, six females). Both experimental protocols were approved by the Institutional Review Board of the Institute for Psychology, Hungarian Academy of Sciences. All subjects gave their written informed consent after the nature of the experiments had been fully explained. All subjects had normal or corrected-to-normal vision.
Stimuli and procedure
The stimuli consisted of eight circles at peripheral locations (3.3°upper, lower, left, and right, and 4.7°upper-left, upper-right, lower-left, and lower-right) that were either green or red on a dark gray background presented on a computer screen. Figure 1A shows a schematic illustration of the stimuli. The duration of the stimuli were 100 ms. The within-pair inter-stimulus interval (ISI) was set to 300 ms, the between-pair ISI was 800 ms. The subjects were asked to detect unpredictable changes in the length of arms of a white fixation cross, presented in the center of the visual field. From time to time, the cross became wider or longer, with the average frequency of 10 changes per minute, and 3–10 s range. The task was a speeded button-press to the changes of the cross. Participants were instructed that the disk patterns were irrelevant, and the function of this pattern was “to produce a more vivid display.”
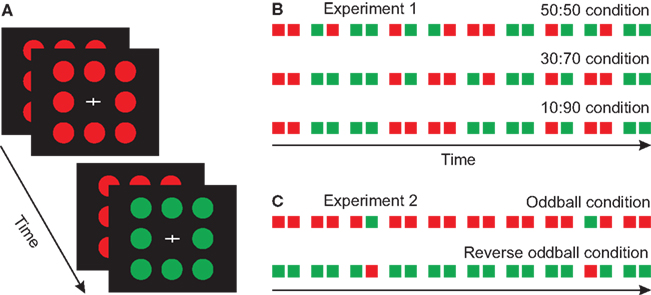
Figure 1. Stimuli and paradigms. (A) Schematic illustration of the disk pattern stimuli used in the experiments. (B) The three different probability conditions applied in Experiment 1. (C) The oddball conditions in Experiment 2.
Three stimulus conditions were used. In the 50:50 condition the probability of single-color and double-color pairs were equal, in the 30:70 condition 30%, and in the 10:90 condition 10% of the pairs had different colors. Two-hundred stimuli (100 pairs) were presented in a block. The probability of red and green stimuli was equal within the sequences. To collect a sufficient number of artifact-free trials, three blocks of the 50:50 condition, five blocks of the 30:70 condition and ten blocks of the 10:90 condition were run. A total of 18 blocks were presented. The order of these blocks (i.e., probability conditions) was randomized between the subjects. Figure 1B shows the schemata of the experimental conditions and protocol.
ERP recording
EEG was recorded from 62 electrodes (A1, AF7, Fp1, Fpz, Fp2, AF8, AF3, AFz, AF4, F7, F5, F3, F1, Fz, F2, F4, F6, F8, FT7, FC5, FC3, FC1, FCz, FC2, FC4, FC6, FT8, T7, C5, C3, C1, Cz, C2, C4, C6, T8, TP7, CP5, CP3, CP1, CPz, CP2, CP4, CP6, TP8, P7, P5, P3, P1, Pz, P2, P4, P6, P8, PO7, PO3, POz, PO4, PO8, O1, Oz, O2) covering the whole scalp (modified international 10–20 system) referred to the right mastoid and off-line re-referenced to the common average. EEG was recorded from DC with a low-pass filter at 100 Hz. The ground electrode was placed on the nose-tip. Eye movements were monitored by two horizontal and two vertical bipolar EOG electrodes. Data were digitized at 32 bit resolution and a sampling rate of 500 Hz (Neuroscan Synamp). EEG was filtered off-line between 0.1 and 30 Hz (24 dB/octave). All subsequent data analyses were off-line on PC using built-in and self-developed functions as well as the freeware EEGLAB toolbox (Delorme and Makeig, 2004) in the Matlab (MathWorks, Natick, MA) development environment.
Analysis and comparisons
For standard and deviant stimuli, epochs of 600 ms including a 100 ms pre-stimulus period were extracted from further analysis. Epochs were baseline-corrected for the -100-0 ms period and averaged separately for standards and deviants (Figure 2A). Trials occurring within an 800 ms interval after a change in the fixation cross were automatically excluded from the analysis. To avoid potential artifacts, epochs with a voltage change below 0.1 or voltage exceeding ± 75 μV on any EEG or EOG channel were rejected from the analysis.
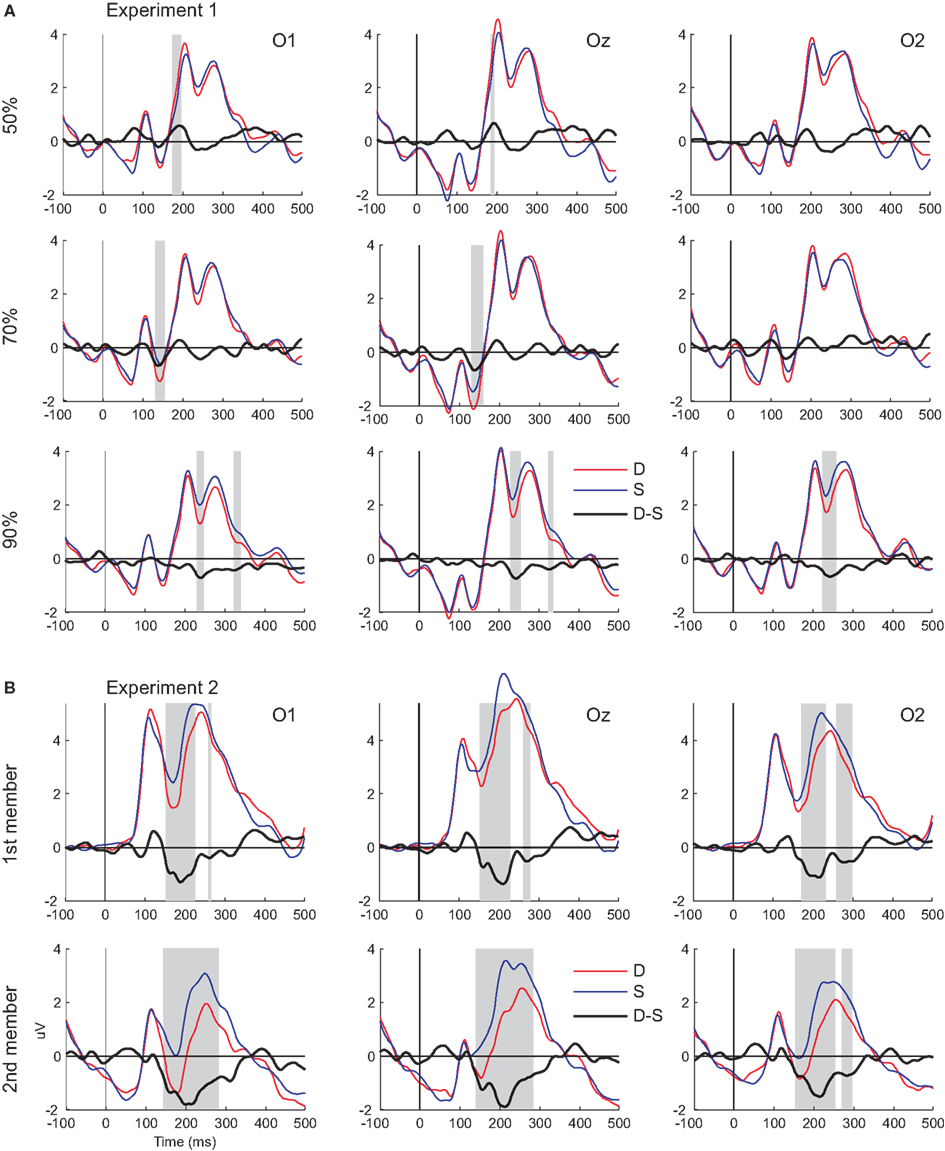
Figure 2. Visual mismatch negativity waveforms and ERP responses to standard and deviant stimuli. (A) Responses from Experiment 1 (upper panel). (B) Responses from Experiment 2 (lower panel). Shaded areas mark the intervals where significant differences were found between deviant and standards (indicated by point-by-point t-tests).
Difference waveforms were created by subtracting the ERPs to the second member of the pairs with identical colors from ERPs to the second member of the pairs with different colors (Figure 3A). Visual inspection of the topographic maps of the difference waveforms confirmed the change-related positivity component in the 50:50 condition and vMMN responses in the 30:70 and 10:90 conditions at parieto-occipital electrodes (Figure 4A). To find the exact intervals where ERPs to standard and deviant stimuli differed in the post-stimulus 100–400 ms time window where change-related effects were expected, we compared ERPs’ amplitude values by point-by-point t-tests (see e.g., Guthrie and Buchwald, 1991) at parieto-occipital electrodes. Mean amplitude were measured within the intervals where the difference between standard and deviant responses was marked as significant on five consecutive point-by-point t-tests at the O1 site for the 50:50 condition and the Oz site for the 30:70 and 10:90 conditions. The change-related positivity component was analyzed using a matrix of six electrodes (PO3, POz, PO4, O1, Oz, O2), whereas vMMN responses were analyzed using a matrix of nine electrodes (P3, Pz, P4, PO3, POz, PO4, O1, Oz, O2). These sets of electrodes corresponded to the expected and observed activity differences elicited by the second member of the pairs with different colors. The effects of stimulus-type on the ERP responses were analyzed with a three-way repeated-measures analysis of variance [ANOVA; stimulus-type (standard vs. deviant) × anteriority (parietal vs. parieto-occipital vs. occipital) × hemisphere (left vs. midline vs. right)]. Greenhouse–Geisser correction of the degrees of freedom was applied where appropriate. Significant interactions were further specified by Tukey HSD post-hoc tests. VMMN peak latencies were defined as the time points of most negative values in the 134–254 ms time window, which included both intervals marked as significantly different for deviants and standards by point-by-point t-tests for the 30:70 and 10:90 conditions.
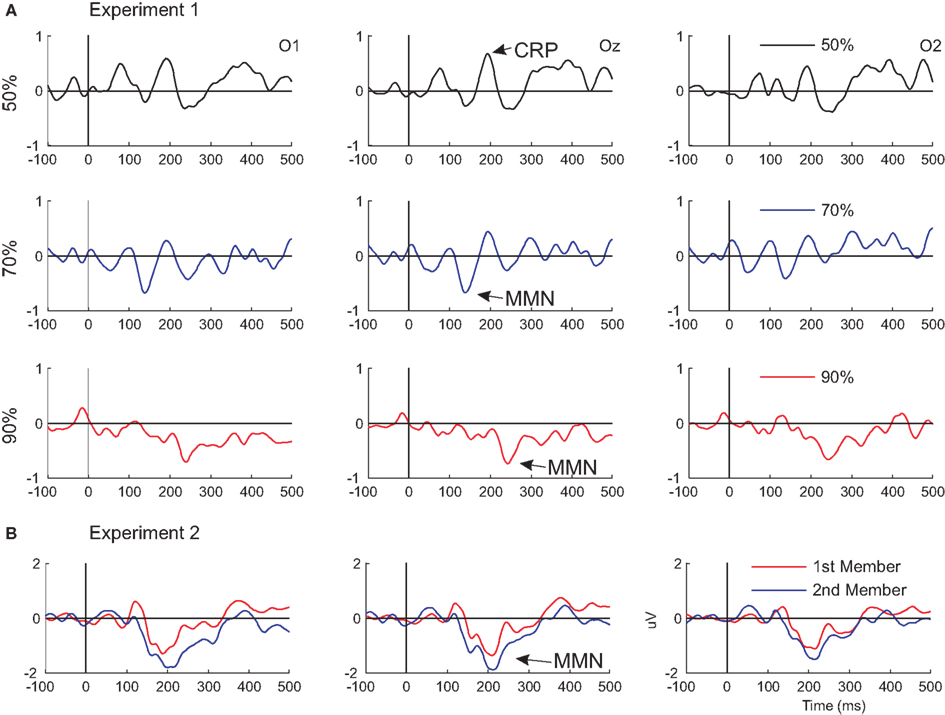
Figure 3. Visual mismatch negativity waveforms superimposed from Experiments 1 and 2. Difference waves from Experiment 1 and 2 are shown in (A, upper panel) and (B, lower panel), respectively.
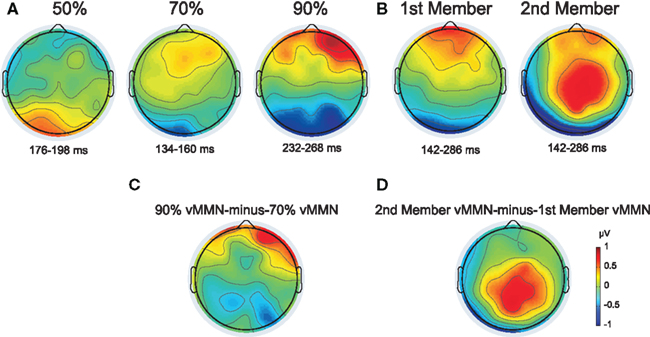
Figure 4. (A and B) Topographic map of the deviant-minus-standard difference potentials from Experiment 1 and 2 (A and B, respectively). The plotted voltage values resulted from averaging data points within the indicated intervals selected by the point-by-point t-tests at Oz site. (C) Difference potential map of the 90–70% vMMN waveforms (measured in the 232–268 and 134–160 ms intervals, respectively). (D) Difference potential map of the 2nd member vMMN minus 1st member vMMN waveforms (both measured in the 142–286 ms interval).
To compare vMMN responses in the 30:70 and 10:90 conditions, a difference waveform was calculated by subtracting the vMMN waveform obtained in the 30:70 condition from the vMMN waveform obtained in the 10:90. Visual inspection of the topographical map of this difference waveform indicated larger negativities in the 10:90 condition at parietal sites (Figure 4C), therefore the effects of deviant probability on the vMMN amplitude were analyzed at parietal electrodes with a two-way repeated-measures ANOVA [condition (70 vs. 90%) × electrode (P3 vs. Pz vs. P4)]. Greenhouse–Geisser correction of the degrees of freedom was applied where appropriate. Significant interactions were further specified by Tukey HSD post-hoc tests.
Experiment 2: Oddball Sequence
This experiment was a traditional oddball paradigm, with the exception that stimuli were presented in a paired fashion (i.e., two alternative ISI durations). Figure 1C shows the schemata of the experimental protocol.
Methods
Participants
Seventeen healthy young volunteer participated in this experiment. Two subjects’ data were excluded from the final analysis due to low trial number. The final sample comprised 15 subjects (mean age = 21.25 years, SD = 1.3 years, nine female).
ERP recording and analysis
The EEG recording and analysis were similar to those in Experiment 1 except the ground and reference electrodes were placed on the forehead and the nose-tip, respectively. Data were off-line re-referenced to the common average.
Stimuli, procedure and analysis
The ERP-related and task stimuli, the task itself and the instruction were identical to those in Experiment 1. In half of the sequences the green, in the other half the red stimuli were used as standard. Deviant stimuli had 20% probability. VMMN was obtained by subtracting the ERPs to standards from the response to deviants (colors were pooled). Figures 2B and 3B show the grand mean ERPs and vMMN waveforms, respectively. Visual inspection of the topographic maps of the vMMN waveforms confirmed the emergence of posterior negativity to deviant (Figure 4B). To find intervals where ERPs to standard and deviant stimuli differed in the post-stimulus 100–400 ms time window where mismatch negativity effects were expected, we compared ERPs’ amplitude values by point-by-point t-tests. Mean amplitude were measured within the intervals where the difference between standard and deviant responses was marked as significant on five consecutive point-by-point t-tests at the Oz site for both members of the stimulus pairs. A matrix of nine electrodes (P3, Pz, P4, PO3, POz, PO4, O1, Oz, and O2) was selected at the posterior scalp for further analysis. The effects of stimulus-type on the ERP responses were analyzed with a four-way repeated-measures ANOVA [stimulus-type (standard vs. deviant) × position (first vs. second) × anteriority (parietal vs. parieto-occipital vs. occipital) × hemisphere (left vs. midline vs. right)]. Greenhouse–Geisser correction of the degrees of freedom was applied where appropriate and ε values are reported in the results. Significant interactions were further specified by Tukey HSD post-hoc tests. Deviant-minus-standard waveforms were calculated (Figure 3B) and mean amplitudes of the observed MMN peaks were also analyzed in a three-way ANOVA with repeated-measures factors of position (first vs. second) × anteriority (parietal vs. parieto-occipital vs. occipital) × hemisphere (left vs. midline vs. right).
Results – Experiment 1
Behavioral Performance
A one-way ANOVA of reaction times showed no significant differences between the conditions [401 ms (SD = 52), 418 ms (SD = 86), and 409 ms (SD = 97) for the 50:50, 30:70, and 10:90 conditions, respectively]. Hit rate was above 95% in each condition, i.e., there were no significant differences between conditions.
Event-Related Potentials
Figure 2A shows grand-averaged ERPs elicited by deviant and standard stimuli at the O1, Oz, and O2 electrode locations. Both stimuli evoked the canonical P1, N1, P2, and N2 components. We found a positive-going deflection in the difference wave for color changes in the 50:50 condition marked as significant by point-by-point t-tests in the 176–198 ms range (Figure 2A). Negative-going peaks of the difference waves were marked as significant in the 134–160 and 232–254 ms intervals for the 30:70 and 10:90 conditions, respectively (Figure 2A). Topographic maps of scalp potential distributions within these intervals are shown in Figure 4A. Mean interval amplitude values used for statistical comparisons are presented in Table 1.
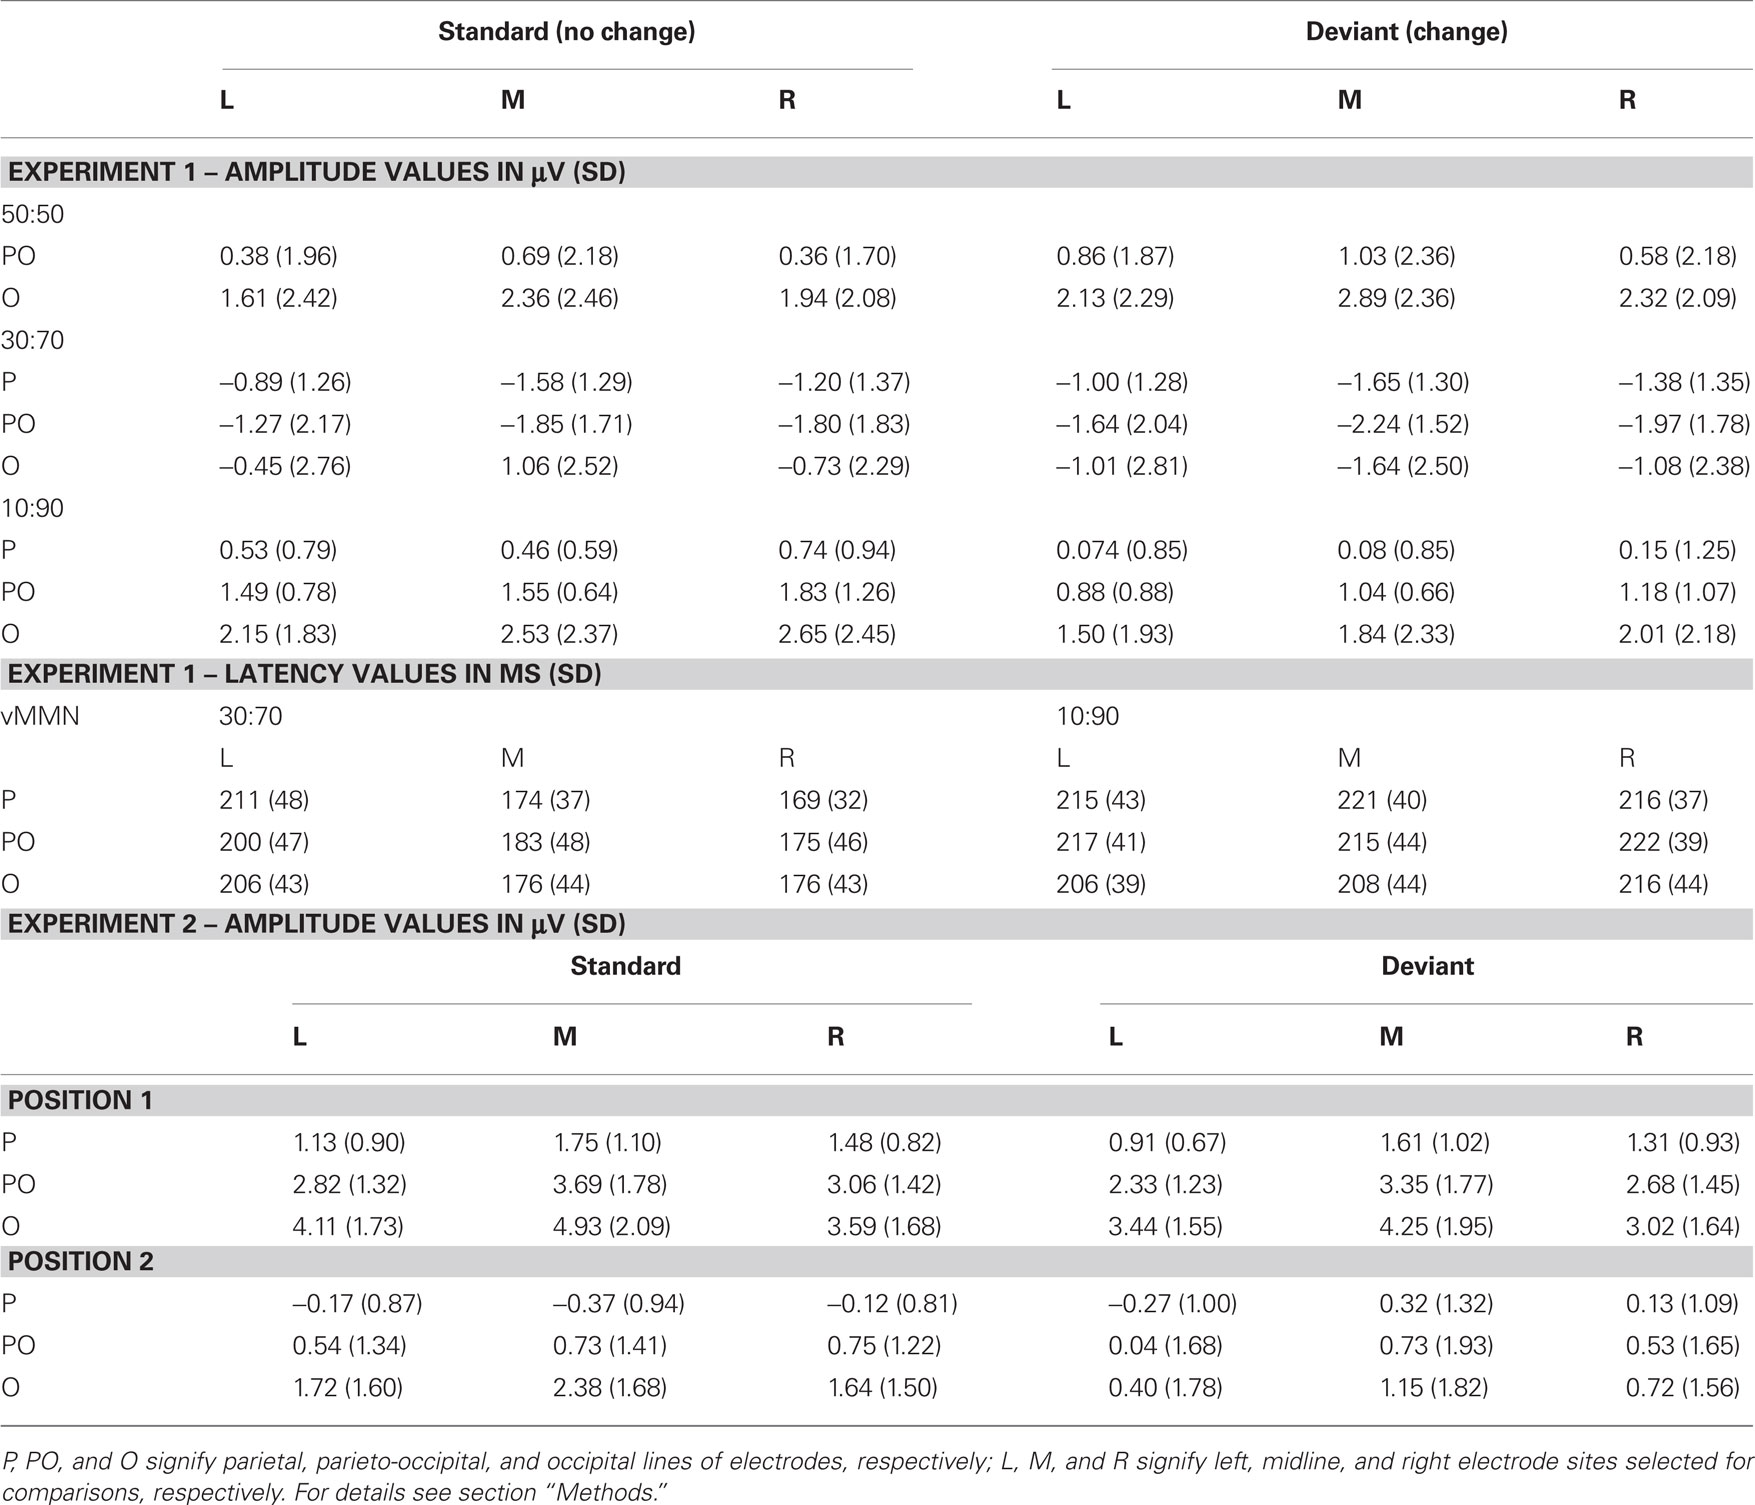
Table 1. Interval amplitude and peak latency values (and SD) used for statistical analyses of ERPs to standards and deviants from Experiments 1 and 2.
The ANOVA of the amplitude values in the 50:50 condition with repeated-measures factors of stimulus-type (standard vs. deviant) × anteriority (parieto-occipital vs. occipital) × hemisphere (left vs. midline vs. right) yielded a significant stimulus-type × anteriority interaction [F(1, 12) = 5.20, p < 0.05 η2 = 0.30], which was due to the more positive responses to changing compared to non-changing stimuli at occipital sites (p < 0.001, Tukey HSD).
The ANOVA of the amplitude values in the 30:70 condition with repeated-measures factors of stimulus-type (standard vs. deviant) × anteriority (parietal vs. parieto-occipital vs. occipital) × hemisphere (left vs. midline vs. right) yielded a significant main effect of stimulus-type [F(1,12) = 5.8354, p < 0.05, η2 = 0.33] caused by more negative responses to deviants compared to standards. A significant stimulus-type × anteriority interaction was also observed [F(2,24) = 5.5456, p < 0.05, η2 = 0.32, ε = 0.62], which was caused by significantly less positive responses to deviants compared to standards at parieto-occipital and occipital sites (p < 0.01 and p < 0.0001, respectively), whereas standard and deviant responses were not significantly different at parietal electrodes.
The ANOVA of the amplitude values in the 10:90 condition yielded a significant main effect of stimulus-type [F(1,12) = 10.819, p < 0.01, η2 = 0.47] caused by less positive responses to deviants compared to standards. A significant main effect of anteriority [F(2, 24) = 6.5458, p < 0.05, η2 = 0.35, ε = 0.52] was also observed, which was due to an anterior-posterior positivity gradient, i.e., larger responses at occipital compared to parietal electrodes (p < 0.01, Tukey HSD).
Difference Potentials – Comparison of vMMN in the 30:70 and 10:90 Conditions
Distribution of vMMN responses in the 30:70 and 10:90 conditions were compared by subtracting the former from the latter one (see Methods). Difference map of the two vMMN responses indicated larger negativity in the 10:90 condition at parietal sites (Figure 4C). The ANOVA of the vMMN amplitude values in the 30:70 and 10:90 conditions, measured within the 134–160 and 232–254 ms intervals, respectively, with factors of condition (70 vs. 90%) × electrode (P3 vs. Pz vs. P4) yielded a main effect of condition [F(1, 12) = 5.4772, p < 0.05, η2 = 0.31] which was due to a larger negativity at parietal electrodes in the 10:90 condition.
Comparison of vMMN peak latencies in the 30:70 and 10:90 conditions was carried out by an ANOVA with factors of condition (30:70 vs. 10:90), anteriority (parietal vs. parieto-occipital vs. occipital) and hemisphere (left vs. midline vs. right). A main effect of condition was found [F(1, 12) = 4.8018, p < 0.05, η2 = 0.29], caused by significantly later vMMN peaks in the 10:90 compared to the 30:70 condition. A significant condition × hemisphere interaction [F(2, 24) = 7.6417, p < 0.01, η2 = 0.39, ε = 0.81] was due to the earlier MMN peaks at the midline and right compared to the left electrodes in the 30:70 condition (all p < 0.01, Tukey HSD). VMMN peak latency values used for statistical comparisons are presented in Table 1.
Results – Experiment 2
Behavioral Performance
The mean reaction time in Experiment 2 was 458 ms (SD = 116). The mean hit rate was 97%.
Event-Related Potentials
Figure 2B shows grand-averaged ERPs elicited by deviant and standard stimuli at the O1, Oz, and O2 electrode locations. Both stimuli evoked the canonical P1, N1, P2, and N2 components. Deviant-minus-standard difference waveforms showed negative-going peaks for both members of the stimulus pair. The difference between deviants and standards were marked as significant by point-by-point t-tests in the 154–230 and 262–280 ms intervals for the first member within the pair, whereas for the second member a continuous interval of 142–286 ms was marked (Figure 2B). As the vMMN waveforms for the first and second members showed a high overall similarity (Figure 3B), amplitude measurements were done in the time window of 142–286 ms for both members of the stimulus pairs1 for the ERP and vMMN analyses. Topographic maps of scalp potential distributions within this interval are shown in Figure 4B. Mean interval amplitude values used for statistical comparisons are presented in Table 1.
The ANOVA of the ERP amplitude with factors of stimulus-type (standard vs. deviant) × position (first vs. second) × anteriority (parietal vs. parieto-occipital vs. occipital) × hemisphere (left vs. midline vs. right) yielded a main effect of stimulus-type [F(1, 14) = 8.0207, p < 0.01, η2 = 0.36] caused by less positive responses to deviants compared to standards. A main effects of position [F(1, 14) = 56.634, p < 0.00001, η2 = 0.80] was observed, originating from more positive response to the first member of the pair compared to that of the second. A topographic map of the difference potential resulting from subtraction of the vMMN waveform to the first member from the vMMN waveform to the second member of the pairs is shown in Figure 4D.
A significant stimulus-type × anteriority interaction [F(2, 28) = 47.779, p < 0.00001, η2 = 0.77, ε = 0.77] was found, which was due to the less positive responses to deviants compared to standards at the parieto-occipital and occipital line of electrodes (all p < 0.001, Tukey HSD). A significant position × anteriority interaction [F(2, 28) = 12.225, p < 0.001 η2 = 0.47, ε = 0.63] was caused by less positive responses to the second compared to the first member of the pair at parietal, parieto-occipital and occipital lines of electrodes (all p < 0.001, Tukey HSD; the 1st member at parietal and 2nd at occipital did not differ).
Discussion
As expected, deviant colors elicited vMMN in the oddball sequences of our control experiment, and vMMN was slightly larger for deviant second members of the stimulus pairs. The ISI before the first member was longer than before the second one. These results of our control experiment are in line with prior studies of auditory mismatch negativity (e.g., Czigler et al., 1992; Jääskeläinen et al., 1999). Furthermore, these results fit both to the memory-trace mismatch account (e.g., Näätänen, 1992), and the regularity violation account of the visual (Czigler, 2010; Kimura et al., 2010a) and the auditory MMN (Schröger, 2007; Winkler, 2007). As the oddball results show, our stimuli and the parameters of stimulus presentation (ISI) were feasible to elicit vMMN.
The main purpose of our study was the investigation of ERPs to occasional sequential deviancy in the visual domain in Experiment 1. In the 50% color change condition there was no regularity in the stimulus sequence. In this condition, the second member of the stimulus pairs with color change elicited a posterior positivity with 192 ms peak latency. Similar positivity emerged in tasks with double-stimulus (S1-S2) paradigms for task-irrelevant changes of stimulus features (Fu et al., 2003; Wang et al. 2003; Kimura et al., 2005, 2006). Emergence of this component (change-related positivity, CRP) is considered as an index of detection of a divergent stimulus feature.
In the 30% within-pair change condition the second member of the pairs elicited a posterior negativity with 140 ms main latency. A posterior negativity with broader distributions over the posterior scalp (Figure 4A) emerged to the second member of the pair in the 10% within-pair condition with 244 ms main latency. Probabilities of the two colors were equal within the 30:70 and 10:90 sequences, therefore color deviancy per se cannot explain the presence of these negativities. Within-pair changes, however, violated a sequential regularity. Unlike in previous studies reported MMN to violation of sequential regularities (Czigler et al., 2006; Kimura et al., 2010a), in the present task deviancy cannot be detected as mismatch to a particular pattern. Instead, the rule can be phrased “if the stimulus green (red) the forthcoming member of the pair is also green (red), i.e., temporally adjacent stimuli are of the same color.” Accordingly, sequential deviants were unpredicted stimuli. In this respect the vMMN in the 30 and 10% conditions can be conceived as a sign of prediction error (Rao and Ballard, 1999; Friston and Kiebel, 2009; Garrido et al., 2009; Bubic et al., 2010; Denham et al., 2010).
Apparently paradox result of the present study is the shorter vMMN latency in the 30% condition, in comparison to the 10% condition (140 and 244 ms, respectively; Figure 3A). One may argue that this is counterintuitive because the rule was “stronger” in the latter condition, and violation of a stronger rule is expected to elicit vMMN with shorter latency. It is interesting to note that in previous studies vMMNs were reported in two latency ranges corresponding to the two ranges we obtained (e.g., Tales et al., 1999; Maekawa et al., 2005; Kimura et al., 2009; for a review see Czigler, 2007). Selective refractoriness to the frequent standard stimulus may contribute to the deviant-minus-standard difference in the earlier range (Kimura et al., 2006), and it is well established that memory dependent processes also contribute to the deviance-related negativity in the 120–160 ms range (Czigler et al., 2002; Astikainen et al., 2008). Larger vMMN at the shorter ISI in the present study argue against the selective refractoriness interpretation.
Latency difference between the vMMN in the 30 and 10% conditions can be attributed to two different brain activities. However, the latency difference observed in our first experiment can be interpreted as reflecting the speed of prediction error signal generation in different hierarchical structures. Recent theories attributed the auditory MMN to such errors (Garrido et al., 2009; Winkler et al., 2009; Denham et al., 2010), and vMMN can be interpreted similarly. Predictive models (Friston, 2005; Baldeweg, 2006; Winkler et al., 2009) emphasize the hierarchical organization of the cortical architecture (Felleman and Van Essen, 1991; Garrido et al., 2007; Hegde and Felleman, 2007) extracting regularities from environmental events and brain imaging results (Summerfield and Koechlin, 2008; Alink et al., 2010) indicate that predictive models are represented in a hierarchical way in the visual system. Here we conjecture that any level of the cortical hierarchy that makes correct predictions about its incoming input passes its predictions onto higher levels. In such a functional architecture, more repetitions of a stimulus reinforcing a possible regularity results in a more extended representation of invariance at higher levels of the hierarchy. The higher the level though, the longer might be the onset of the prediction error signal when the actual inputs do not fit the predictions, at least in the visual domain. As a metaphor for this proposition, we suggest that at a lower level the system detects after a few repetitions of a stimulus/regularity that “there is something going on,” whereas several repetitions leads to the formation of predictions at higher levels (i.e., to more abstract representations of regularities). Some hints of different stages of deviant detection is reflected by the different vMMN distribution in the 30 and 10% probability conditions, but it is evident, that further research is needed to explore the applicability of hierarchical predictive models in automatic registration of sequential regularities in vision.
Conflict of Interest Statement
The authors declare that the research was conducted in the absence of any commercial or financial relationships that could be construed as a potential conflict of interest.
Acknowledgments
We are grateful to Judit Roschéné Farkas for excellent data collection. This study was supported by a grant from the Hungarian National Research Fund (OTKA), grant number 71600.
Footnote
- ^Statistical comparisons were carried out also using the 154–230 ms time window for both members of the pairs, which yielded similar results to those gained by using the time window of 142–286 ms, for both the ERP and MMN analyses. We report here results of the analyses which used the 142–286 ms time window.
References
Alink, A., Schwiedrzik, C. M., Kohler, A., Singer, W., and Muckli, L. (2010). Stimulus predictability reduces responses in primary visual cortex. J. Neurosci. 30, 2960–2966.
Astikainen, P., Lillstrang, E., and Ruusuvirta, T. (2008). Visual mismatch negativity for changes in orientation – a sensory memory-dependent response. Eur. J. Neurosci. 28, 2319–2324.
Astikainen, P., Ruusuvirta, T., Wikgen, J., and Korjonen, T. (2004). The human brain processes visual changes that are not cued by attended auditory stimulation. Neurosci. Lett. 368, 231–234.
Baldeweg, T. (2006). Repetition effects to sounds: evidence for predictive coding in the auditory system. Trends Cogn. Sci. 10, 93–94.
Bubic, A., von Carmon, D. Y., and Schubotz, R. (2010). Prediction, cognition and the brain. Front. Hum. Neurosci. 4, 25. doi: 10.3389/fnhum.2010.00025
Czigler, I. (2007). Visual mismatch negativity: violating of nonattended environmental regularities. J. Psychophysiol. 21, 224–230.
Czigler, I. (2010). “Representation of regularities in visual stimulation: event-related potentials reveal the automatic acquisition,” in Unconscious Memory Representation in Perception, eds I. Czigler and I. Winkler (Amsterdam: John Benjamins Publishing Company), 107–132.
Czigler, I., Balázs, L., and Winkler, I. (2002). Memory-based detection of task-irrelevant visual change. Psychophysiology 39, 869–873.
Czigler, I., Csibra, G., and Csontos, A. (1992). Age and inter-stimulus interval effects on event-related potentials to frequent and infrequent auditory stimuli. Biol. Psychol. 33, 195–206.
Czigler, I., Weisz, J., and Winkler, I. (2006). ERPs and deviance detection: visual mismatch negativity to repeated visual stimuli. Neurosci. Lett. 401, 178–182.
Delorme, A., and Makeig, S. (2004). EEGLAB: an open-source toolbox for analysis of EEG dynamics. J. Neurosci. Methods 134, 9–21.
Denham, S., Dura-Bernal, S., Coath, M., and Balaguer-Ballester, E. (2010). “Neurocomputational models of perceptual organization,” in Unconscious Memory Representation in Perception, eds I. Czigler and I. Winkler (Amsterdam: John Benjamins Publishing Company), 147–177.
Felleman, D. J., and Van Essen, D. C. (1991). Distributed hierarchical processing in the primate cerebral cortex. Cereb. Cortex 1, 1–47.
Friston, K. (2005). A theory of cortical responses. Philos. Trans. R. Soc. Lond. B Biol. Sci. 360, 815–836.
Friston, K., and Kiebel, S. (2009). Predictive coding under the free-energy principle. Philos. Trans. R. Soc. Lond. B Biol. Sci. 364, 1211–1221.
Fu, S., Fan, S., and Chen, L. (2003). Event-related potentials revealed involuntary processing orientation changes in the visual modality. Psychophysiology 40, 770–775.
Garrido, M. I., Kilner, J. M., Kiebel, S. J., Stephan, K. E., and Friston, K. J. (2007). Dynamic causal modelling of evoked potentials: a reproducibility study. Neuroimage 36, 571–580.
Garrido, M. I., Kilner, J. M., Stephan, K. E., and Friston, K. J. (2009). The mismatch negativity: a review of underlying mechanisms. Clin. Neurophysiol. 120, 453–463.
Guthrie, D., and Buchwald, J. (1991). Significance testing of difference potentials. Psychophysiology 28, 240–244.
Hegdé, J., and Felleman, D. J. (2007). Reappraising the functional implications of the primate visual anatomical hierarchy. Neuroscientist 13, 416–421.
Heslenfeld, D. J. (2003). “Visual mismatch negativity,” in Detection of Change: Event-Related Potential and fMRI Findings, ed J. Polich (Boston, MA: Kluver Academic Press), 41–59.
Jääskeläinen, I. P., Hautamäki, M., Näätänen, R., and Ilmoniemi, R. J. (1999). Temporal span of auditory sensory memory and mismatch negativity: revisited. NeuroReport 10, 1305–1308.
Kimura, M., Katayama, J., and Murohashi, H. (2005). Positive difference in ERPs reflects independent processing of visual changes. Psychophysiology 42, 369–379.
Kimura, M., Katayama, J., and Murohashi, H. (2006a). An ERP study of visual change detection: effects of magnitude of spatial frequency changes on the change-detection on the change-related posterior positivity. Int. J. Psychophysiol. 62, 14–23.
Kimura, M., Katayama, J., and Murohashi, H. (2006b). Probability-independent and -dependent ERPs reflecting visual change detection. Psychophysiology 43, 180–189.
Kimura, M., Katayama, J., Ohira, H., and Schröger, E. (2009). Visual mismatch negativity: new evidence from the equiprobable paradigm. Psychophysiology 46, 402–409.
Kimura, M., Schröger, E., Czigler, I., and Ohira, H. (2010a). Human visual system automatically encodes sequential regularities of discrete events. J. Cog. Neurosci. 22, 1124–1139.
Kimura, M., Widmann, A., and Schröger, E. (2010b). Human visual system automatically represents large-scale sequential regularities. Brain Res. 1317, 165–179.
Kimura, M., Widmann, A., and Schröger, E. (2010c). Top-down attention affects sequential regularity representation in the human visual system. Int. J. Psychophysiol. 77, 126–134.
Maekawa, T., Goto, Y., Kinukawa, N., Taniwaki, T., Kanba, S., and Tobimatsu, S. (2005). Functional characterization of mismatch negativity to visual stimulus. Clin. Neurophysiol. 116, 2392–2402.
Näätänen, R., Paavilainen, P., Rinne, T., and Alho, K. (2007). The mismatch negativity (MMN) in basic research of central auditory processing: a review. Clin. Neurophysiol. 118, 2544–2590.
Näätänen, R., and Winkler, I. (1999). The concept of auditory stimulus representation in cognitive neuroscience. Psychol. Bull. 125, 826–859.
Pazo-Alvarez, P., Ameneno, E., and Cadaveira, F. (2004). Automatic detection of motion direction change in the human brain. Eur. J. Neurosci. 19, 1978–1986.
Pazo-Alvarez, P., Cadaveira, F., and Amendeo, E. (2003). MMN in the visual modality: a review. Biol. Psychol. 63, 199–236.
Rao, R. P., and Ballard, D. H. (1999). Predictive coding in the visual cortex: a functional interpretation of some extra-classical receptive-field effects. Nat. Neurosci. 47, 79–87.
Sato, Y., Yabe, H., Hiruma, T., Sutoh, T., Shinozaki, N., Nashida, T., and Kaneko, S. (2000). The effect of deviant stimulus probability on the human mismatch process. NeuroReport 11, 3703–3708.
Schröger, E. (2007). Mismatch negativity: a microphone into auditory memory. J. Psychophysiol. 21, 138–146.
Stagg, C., Hindley, P., Tales, A., and Butler, S. (2004). Visual mismatch negativity: the detection of stimulus change. Neuroreport 15, 659–663.
Summerfield, C., and Koechlin, E. (2008). A neural representation of prior information during perceptual inference. Neuron 59, 336–347.
Tales, A., Newton, P., Troscianko, T., and Butler, S. (1999). Mismatch negativity in the visual modality. Neuroreport 10, 3363–3367.
Wang, Y., Tian, A., Wang, H., Cui, L., Zhang, Y., and Zhang, X. (2003). Event-related potentials evoked by multi-feature conflict under different attentive conditions. Exp. Brain Res. 148, 451–457.
Keywords: event-related potential, oddball, predictive models, probability, sequential regularity, visual mismatch negativity
Citation: Stefanics G, Kimura M and Czigler I (2011) Visual mismatch negativity reveals automatic detection of sequential regularity violation. Front. Hum. Neurosci. 5:46. doi: 10.3389/fnhum.2011.00046
Received: 22 December 2010; Accepted: 06 May 2011;
Published online: 17 May 2011.
Edited by:
Hans-Jochen Heinze, University of Magdeburg, GermanyReviewed by:
Burkhard Pleger, Max Planck Institute for Human Cognitive and Brain Sciences, GermanyPiia Astikainen, University of Jyväskylä, Finland
Copyright: © 2011 Stefanics, Kimura and Czigler. This is an open-access article subject to a non-exclusive license between the authors and Frontiers Media SA, which permits use, distribution and reproduction in other forums, provided the original authors and source are credited and other Frontiers conditions are complied with.
*Correspondence: István Czigler, Institute for Psychology, Hungarian Academy of Sciences, 83-85 Szondi u., Budapest 1068, Hungary. e-mail: czigler@cogpsyphy.hu