All about the money – external performance monitoring is affected by monetary, but not by socially conveyed feedback cues in more antisocial individuals
- Social, Cognitive and Affective Neuroscience Unit, Faculty of Psychology, University of Vienna, Vienna, Austria
This study investigated the relationship between feedback processing and antisocial personality traits measured by the PSSI questionnaire (Kuhl and Kazén, 1997) in a healthy undergraduate sample. While event-related potentials [feedback related negativity (FRN), P300] were recorded, participants encountered expected and unexpected feedback during a gambling task. As recent findings suggest learning problems and deficiencies during feedback processing in clinical populations of antisocial individuals, we performed two experiments with different healthy participants in which feedback about monetary gains or losses consisted either of social–emotional (facial emotion displays) or non-social cues (numerical stimuli). Since the FRN and P300 are both sensitive to different aspects of feedback processing we hypothesized that they might help to differentiate between individuals scoring high and low on an antisocial trait measure. In line with previous evidence FRN amplitudes were enhanced after negative and after unexpected feedback stimuli. Crucially, participants scoring high on antisocial traits displayed larger FRN amplitudes than those scoring low only in response to expected and unexpected negative numerical feedback, but not in response to social–emotional feedback – irrespective of expectancy. P300 amplitudes were not modulated by antisocial traits at all, but by subjective reward probabilities. The present findings indicate that individuals scoring high on antisociality attribute higher motivational salience to monetary compared to emotional–social feedback which is reflected in FRN amplitude enhancement. Contrary to recent findings, however, no processing deficiencies concerning social–emotional feedback stimuli were apparent in those individuals. This indicates that stimulus salience is an important aspect in learning and feedback processes in individuals with antisocial traits which has potential implications for therapeutic interventions in clinical populations.
Introduction
Individual behavior lacking consideration of others, no matter whether intentional or not, is known as antisocial behavior (Berger, 2003). The pathological manifestation of antisocial behavior is the so-called antisocial personality disorder (ASP). The DSM-IV classification (American Psychiatric Association, 1994) of ASP includes diagnostic characteristics such as lack of respect for social norms, reckless and aggressive behavior, irresponsibility, and lack of remorse and guilt (Rodrigo et al., 2010). The corresponding diagnosis of the ICD-10 (World Health Organization, 1992) classification scheme, the so-called dissocial personality disorder, adds another important diagnostic characteristic: the inability to learn from experience, in particular from punishment. Dinn and Harris (2000) suggested that these learning deficits might be triggered by an inability to effectively process negative and positive feedback stimuli. Considering a dimensional account of the distribution of personality characteristics, non-clinical manifestations of ASP symptoms should also be observable in healthy individuals (Walters, 2009). In particular, the characteristic deficits in learning from experience give rise to the question whether or not healthy individuals with antisocial tendencies process and respond to external feedback in a comparable way to healthy individuals without these behavioral tendencies.
Event-related potentials (ERPs) are a useful tool to investigate neural processes related to feedback processing, in particular as their high temporal resolution allows detecting early differences in processing between individuals. Therefore, the main objective of the present study was to investigate the relationship of individual differences in antisocial personality traits with two ERP components related to external feedback processing, the feedback related negativity (FRN) and the P300, respectively.
The FRN is a negative-going deflection over frontal electrode sites which can be determined within 200–300 ms after negative external feedback, such as the indication of an incorrect response or of monetary loss (Miltner et al., 1997; Nieuwenhuis et al., 2004; Yeung et al., 2004). The FRN is thought to be generated in or near what has been originally labeled as anterior cingulate cortex (ACC; Miltner et al., 1997; Gehring and Willoughby, 2002; Holroyd and Coles, 2002) but according to later neuroanatomical evidence has been determined as anterior medial cingulate cortex (aMCC; Vogt, 2005). Holroyd and Coles (2002) postulated to view the FRN as a reinforcement signal induced by the mesencephalic dopamine system which is conveyed to the aMCC to optimize new action–outcome relations. Furthermore, the authors assumed that outcomes that are worse than expected would elicit the largest amplitude deflections. Another important aspect of their theory is the account of FRN amplitude back propagation after learning. The better one learns specific action–outcomes – i.e., the less unexpected these outcomes become – the smaller the FRN amplitudes get after successful acquisition of the action–outcome relation. In contrast to this reinforcement learning account, Gehring and Willoughby (2002) stated that the FRN might rather reflect the subjective negative evaluation of self-relevant information than the commission of an error per se. Following their hypothesis, the FRN has been proposed to reflect a neuronal signal which detects discrepancies between internal and external representations (i.e., discrepancies between subjective reward expectations and objective reward contingencies) to highlight motivationally salient outcomes (Yeung et al., 2005). This interpretation is in line with recent findings from our group using a similar experimental paradigm as in the present study (Pfabigan et al., 2011). Notably, the learning of action–outcome relations led to more predictable outcomes and decreases motivational salience of these respective outcomes. Thus, the observation of FRN amplitudes becoming smaller in amplitude after these relations have been learned (Holroyd and Coles, 2002; Nieuwenhuis et al., 2004; Sailer et al., 2010) is in line with both the reinforcement learning and the motivational salience accounts.
While the specific link between feedback processing, FRN, and antisocial traits has never been explored, a related study by Von Borries et al. (2010) attempted to establish a relationship between learning, feedback processing, and psychopathy. Psychopathy is a personality construct bearing some conceptual overlap with ASP, with comorbidity of ASP and psychopathy amounting to 30% (Hart and Hare, 1996; Coid and Ullrich, 2010). Nevertheless, ASP and psychopathy may not be equalized since ASP focuses on observable behavior whereas psychopathy emphasizes personality traits. Unfortunately, these two concepts are repeatedly mixed up in literature. Psychopathy is assessed via semi-structured questionnaires in forensic samples [Psychopathy Checklist-Revised (PCL-R); Hare, 2003] and via self-report questionnaires in healthy individuals [e.g., Psychopathic Personality Inventory-Revised (PPI-R), Lilienfeld and Andrews, 1996]. Notably, DSM-IV and ICD-10 do not incorporate all symptoms necessary for a PCL-R-based psychopathy diagnosis, thus the concept of psychopathy is not adequately represented in these diagnostic manuals (World Health Organization, 1992; Widinger, 2007). Von Borries et al. (2010) reported learning deficits as well as altered ERPs related to performance monitoring in a forensic sample scoring high on the PCL-R. The authors suggested that negative feedback cues were not adequately assessed by the psychopathic participants to adapt behavior in subsequent actions. Nevertheless, no significant group differences were reported by Von Borries et al. (2010) regarding FRN amplitudes.
The P300 is another ERP component commonly investigated during feedback processing. It is characterized by a positive deflection peaking around 300–600 ms after stimulus onset at posterior recording sites, and P300 has been shown to be sensitive to the significance and occurrence probability of a stimulus (Duncan-Johnson and Donchin, 1977; Johnson and Donchin, 1980) as well as task complexity (Israel et al., 1980). Increased P300 amplitude is thought to reflect the increased allocation of neural resources and related enhanced stimulus processing (Polich, 2007). Moreover, P300 amplitude modulation was found in decision and outcome evaluation tasks, supposedly reflecting the functional or motivational significance of the feedback stimuli (Yeung and Sanfey, 2004; Hajcak et al., 2005; Yeung et al., 2005; Luu et al., 2009). Ambiguous results have been reported regarding the relationship between P300 amplitude, psychopathy, and antisocial behavior, as different studies report both enhanced (Raine and Venables, 1988) and decreased P300 amplitudes in psychopathic and antisocial individuals (Costa et al., 2000; Bernat et al., 2007). Hicks et al. (2007) suggested that P300 amplitude reduction is in particular associated with antisocial facets of psychopathy. Several studies focused on P300 latency and antisociality, with a recent review by Gao and Raine (2009) suggesting that delayed P300 amplitudes in more antisocial individuals might reflect deficits in stimulus processing speed.
The aim of the present study was to investigate the relationship between individual differences in antisocial personality traits measured in healthy individuals with ERP correlates of external feedback processing. To the best of our knowledge, no study has investigated this relationship yet, which is surprising given the importance of antisocial behavior. Antisocial personality traits are a prevalent problem for individuals and society alike. By identifying their potential mechanisms in healthy individuals we aim to further the knowledge regarding these personality traits and associated clinically relevant manifestations. Based on the observation of FRN amplitude decrease after learning from incorrect responses (FRN amplitude back propagation; Holroyd and Coles, 2002; Nieuwenhuis et al., 2004), and the ICD-10 classification postulating deficits in learning from external cues in individuals with ASP, we expected individuals with distinctive antisocial personality traits to show larger FRN amplitudes after negative feedback than individuals lacking these personality traits. Irrespective of antisociality, we expected larger FRN amplitudes after negative compared to positive feedback (Miltner et al., 1997; Holroyd and Coles, 2002), and after unexpected compared to expected feedback (Nieuwenhuis et al., 2004; Hajcak et al., 2007; Pfabigan et al., 2011). Regarding P300 amplitudes, we expected an amplitude decrease in individuals scoring high on an antisociality measure compared to the ones scoring low (Gao and Raine, 2009) indicating inefficient allocation of neural resources during the processing of task relevant information. In general, we expected larger P300 amplitudes in response to unexpected compared to expected feedback stimuli (Duncan-Johnson and Donchin, 1977). Additionally, high-scoring participants might display delayed P300 latencies (Costa et al., 2000; Bernat et al., 2007). Furthermore, we were interested in whether the dimension of motivational salience of the feedback stimuli (i.e., social–emotional vs. non-social) would affect feedback processing in a comparable way in both groups or discriminate them. Thus, we conducted two experiments using either numbers indicating monetary gain or loss (experiment 1) or emotional faces (experiment 2) as feedback stimuli. Human facial expressions can be considered as valuable social cues since they incorporate crucial information necessary in social exchange situations (Rolls, 2000). Consequently, antisocial behavior per se gives rise to the question whether or not the processing of social–emotional cues is disrupted in antisocial individuals compared to socially oriented ones. Indeed, Marsh and Blair (2008) reported deficits while recognizing fearful faces in antisocial individuals. However, since we did not include fearful facial expressions as feedback stimuli, we had no directional hypothesis regarding group differences for the dimension of the feedback stimuli.
The experimental paradigm applied was a gambling task in which participants encountered expected and unexpected positive and negative feedback outcomes.
Experiment 1: Monetary Feedback
Methods
Participants
Initially, 31 right-handed psychology students of the University of Vienna (16 females) participated in the first study. The data of two male participants had to be excluded due to data acquisition problems. The mean age of the remaining 29 participants was 26.10 ± 3.11 years. Handedness was assessed by the Edinburgh Handedness Inventory (Oldfield, 1971). Participants had normal or corrected-to-normal vision and reported no history of neurological or psychiatric disorders. The study was conducted in accordance with the Declaration of Helsinki and local guidelines of the University of Vienna. Informed written consent was obtained from each participant prior to participation. At the end of the experiment participants received an individually adjusted bonus depending on their performance in the experimental task (between 10 and 25 Euros).
Prior to electroencephalogram (EEG) data collection, participants completed the PSSI questionnaire (Kuhl and Kazén, 1997). The PSSI is a self-assessment tool covering the manifestation of 14 non-pathologic personality traits related to personality disorders described in the DSM-IV and the ICD-10 diagnostic criteria. For this study, the so-called antisociality (AS) scale of the PSSI was of particular interest. Its reliability (Cronbach’s α = 0.86 – AS-scale) and validity are reported to be satisfactory (Kuhl, 2001). Raw scores were transformed into standardized T-values (mean of 50, SD of 10) for all participants. High T-values on the AS subscale, which consists of 10 items (e.g., “If people turn against me, I can wear them down.”), characterize people with self-determined and inconsiderate behavior to achieve individual goals. Furthermore, individuals scoring high on the AS subscale are described to act overly self-centered, offending, and humiliating while interacting with others, and to have problems adjusting to social and legal norms. Participants scored on average with a T-value of 49.00 ± 10.95 on the AS-scale, individual T-values ranged from 34 to 72. Based on the distribution of these individual T-scores, participants were separated into three groups; approximately below, above, and within two thirds of the sample’s SD. This classification scheme was chosen by the authors particularly for the present study to effectively separate more social from more antisocial individuals. Twelve participants formed the low-trait group (mean 38.33 ± 2.74, range of 34–42; seven females), six participants formed the middle group (mean 48.50 ± 4.59, range of 44–54; three females), and 11 participants constituted the high-trait group (mean 60.91 ± 4.93, range of 55–72; six females). There was no influence of sex on the individual scores on the AS-scale [independent samples t-test: t(27) = 0.57, p > 0.50]. Only the 12 low-trait (“social group”) and the 11 high-trait (“antisocial group”) participants were considered for data analysis to enhance the separation effect for antisocial traits. The T-values of these two groups differed significantly from each other [independent samples t-test: t(21) = 13.74, p < 0.001], indicating that our group categorization was successful.
Experimental procedures
Participants were comfortably seated 70 cm in front of a 21″ cathode ray tube monitor with a 75-Hz refresh rate (Sony GDM-F520). Stimulus presentation was controlled by a Pentium IV 3.00 GHz computer and E-Prime 2.0 software (Psychology Software Tools, Inc., Pittsburgh, PA, USA). The paradigm used was identical to that described in Pfabigan et al. (2011). The experimental session began with a training run of 48 trials where participants learned specific cue–response contingencies for a forthcoming experimental task. Each trial started with a black fixation cross on a gray screen, followed by an imperative cue consisting of a black line drawing of a simple figure (Bates et al., 2000; circle, triangle, or star, each presented 16 times during training; 10.5 cm × 10.5 cm in size). During the subsequent presentation of a black question mark, participants had to choose one of two buttons on a response pad. Feedback was provided afterward. The imperative cue remained on the screen for 500 ms; the question mark appeared immediately following the cue offset and remained on the screen until the participant responded, or 2000 ms had elapsed. Approximately 350 ms after the offset of the question mark which was triggered either by a button press or elapse of 200 ms, the feedback stimulus appeared on the screen for 700 ms. During the inter-trial-interval, the fixation cross was presented again for a randomly varied duration of 2200–2700 ms. In the training run, one of the three imperative cues was associated with 100% reward probability for button one (cue “one”), and another cue was associated with 75% reward probability for button two (cue “two”). Irrespective of button choice the third cue was not rewarded at all (cue “three”). The German word for correct (RICHTIG) was presented after rewarded choices and the one for incorrect (FALSCH) with all other choices (including failure to enter a choice with the allotted time window). The assignment of the three cues to the different reward probabilities was counterbalanced across participants. After having learnt these simple cue–response-mappings the experimental task consisting of 900 trials started. Participants were now asked to search for more complex button press response patterns on the basis of these simple cue–response-mappings (e.g., pressing button one thrice, and button two twice in five consecutive trials). This instruction was chosen to sustain participants’ expectations regarding the different reward probabilities for the three cues during the whole experiment. However, unknown to the participants, no such button press response pattern existed. Although this instruction to search for meta-rules might have induced monitoring and working memory processes during the decision phase, it was indispensable for making the occurrence of unexpected feedback plausible.
After completing 48 training trials, participants started with the first block of the experimental task (150 trials). Here, a correct choice was indicated by the central presentation of the number 15 in green color (2 cm × 1.5 cm in size), announcing a gain of 15 Eurocents. An incorrect choice was indicated by the number 15 in red color, announcing a loss of 15 Eurocents. If participants had missed the response interval they were informed about it and also lost 15 Eurocents; the respective trials were discarded from further analysis. After a block of 150 trials, participants were provided with overall performance feedback about how much money they had won. Afterward, they were instructed to search for a new button press response pattern in the next block. After three blocks, a 5-min break took place, where participants were paid with the amount of money they had already won to maintain their motivation. In contrast to the training run, participants were now provided with positive feedback in 75% of the trials where they selected the previously learned buttons for cue “one” and “two.” With cue “three” participants were provided with positive feedback in 25% of these trials. This contrast between the new reward contingencies and those of the training session ensured that participants encountered trials where a gain was highly expected (cue “one”), but a loss occurred, i.e., feedback was worse than expected. Likewise, participants encountered trials where a loss was highly expected (cue “three”), but a gain occurred, i.e., feedback was better than expected (Table 1, for details). The data corresponding to cue “two” were not further analyzed since subjective expectation levels had not changed with this cue (75% probability for gain during the training and the experimental session). Nevertheless, cue “two” was essential in this experimental paradigm – otherwise the occurrence of unexpected feedback stimuli would not have been plausible to the participants.
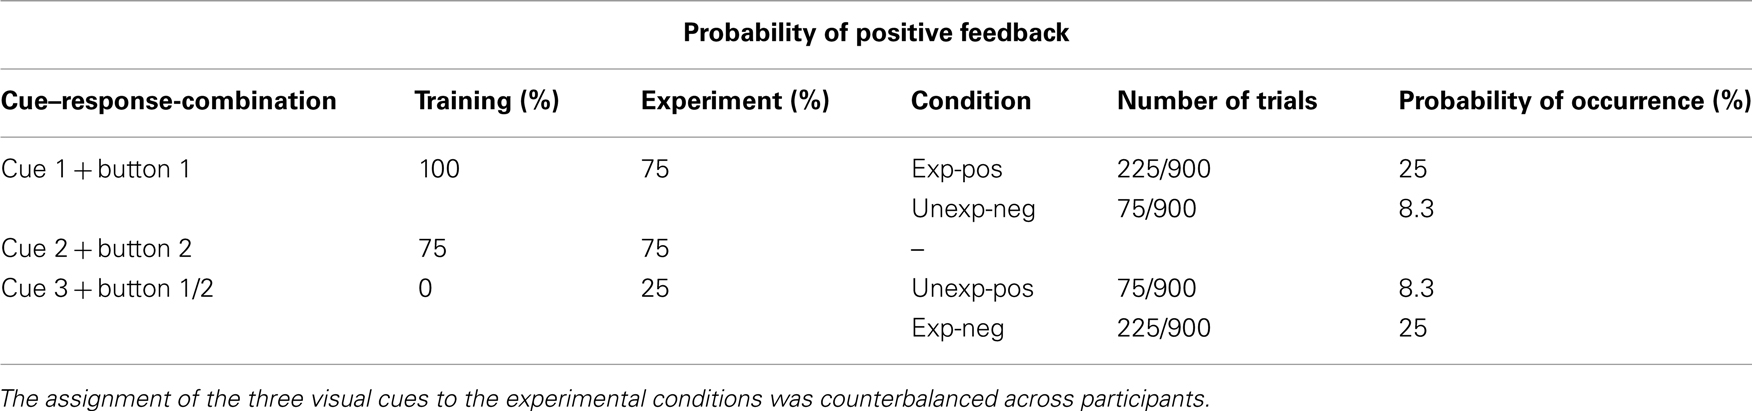
Table 1. Reward probabilities in training and experimental sessions, classification of conditions, and probability of occurrence in both studies.
The experiment ended after six blocks. Afterward, participants were asked to estimate the subjectively perceived reward frequencies of the three cues in a brief questionnaire. Finally, they were rewarded with the remaining money won in the last three blocks. Including a seed capital of 5 Euros, participants gained on average 18.58 ± 4.34 Euros. Finally, participants were debriefed about the external feedback manipulation. The whole experiment took about 70 min.
EEG acquisition and preprocessing
The EEG was recorded via 61 Ag/AgCl ring electrodes, arranged equidistantly in an elastic electrode cap (EASYCAP GmbH, Herrsching, Germany; model M10). A balanced non-cephalic sterno-vertebral reference was used (Stephenson and Gibbs, 1951). Vertical and horizontal electrooculograms (EOG) were recorded bipolarly with electrodes placed 1 cm above and below the left eye and on the outer canthi, respectively, to enable off-line eye movement artifact correction. During two pre-experimental calibration trials, participants performed vertical and horizontal eye movements. These data were used to calculate subject- and channel-specific coefficients for eye movement correction (Bauer and Lauber, 1979). Skin abrasion at each recording site (Picton and Hillyard, 1972) and degassed conductance gel ensured electrode impedances below 2 kΩ. Signals were amplified using an AC amplifier set-up with a time constant of 10 s (Ing. Kurt Zickler GmbH, Pfaffstätten, Austria). All signals were recorded within a frequency range of 0.016–125 Hz and sampled at 250 Hz for digital storage.
Off-line and prior to analysis the weighted EOG signals were subtracted from the EEG signals. Subsequently, blink coefficients were calculated using a template matching procedure and blink artifacts were also subtracted from the EEG signals (Lamm et al., 2005, for details). EEGLAB 6.03b (Delorme and Makeig, 2004) was used for further analysis. A low-pass filter (cut-off frequency 30 Hz, roll-off 6 dB per octave) was applied to the EEG data. For ERP analysis signal epochs started 200 ms before feedback onset and lasted 900 ms, with the mean of the first 200 ms serving as the baseline. Before applying extended (infomax) independent component analysis (ICA; Bell and Sejnowski, 1995; Lee et al., 1999) trials contaminated by muscular or movement artifacts were rejected based on visual inspection. ICA was performed to remove residual ocular artifacts, as described in Delorme et al. (2007), and afterward a semi-automatic artifact removal procedure was employed to eliminate epochs containing voltage values exceeding ±75 μV in any channel. Due to the experimental set-up the data sets per subject consisted of three times more expected feedback trials than unexpected feedback trials. Therefore, numbers of trials per condition were equalized per subject in order to adjust for the signal-to-noise ratio of the ERPs. For each participant, we randomly drew the same number of trials that were available for unexpected positive feedback trials out of all expected positive feedback trials (surviving artifact screening). The same procedure was applied to the unexpected and expected negative feedback trials.
Data analysis
Artifact-free epochs were averaged separately for each subject and each of the following four conditions: (1) expected positive feedback (exp-pos; cue “one”), (2) expected negative feedback (exp-neg; cue “three”), (3) unexpected positive feedback (unexp-pos; cue “three”), and (4) unexpected negative feedback (unexp-neg; cue “one”). FRN amplitudes were assessed at electrode site FCz which was chosen based upon existing literature (Gehring and Willoughby, 2002; Holroyd and Coles, 2002) and the visual inspection of the data. The peak-to-peak voltage difference between the most negative peak between 200 and 400 ms after feedback onset (FRN) and the preceding positive peak (P2) was calculated (Holroyd et al., 2003). P300 amplitudes were obtained by searching for local positive maxima (in relation to baseline) between 300 and 600 ms after feedback onset at electrode site Pz where the P300 was most prominent. P300 latency was measured from feedback onset to the corresponding positive maximum.
Feedback related negativity amplitude differences were analyzed by means of a mixed-design 2 × 2 × 2 ANOVA with the between-subjects factor group (low-trait, high-trait), and the within-subjects factors expectation (expected, unexpected) and valence (positive, negative). The same ANOVA model was applied to P300 peak amplitudes and P300 peak latencies. Regarding the a priori FRN hypothesis on group differences after negative feedback stimuli, we calculated a linear contrast. Furthermore, significant interaction effects without a priori hypotheses were explored with Tukey’s HSD post hoc test To demonstrate the effect size of the ANOVA results, partial eta-squared ( ) is reported (Cohen, 1973). All statistical analyses were performed using SPSS 15 (IBM SPSS Statistics 15, Somer, NY, USA).
Experiment 2: Emotional Faces Feedback
Methods
Participants
Initially, 28 right-handed female psychology students of the University of Vienna participated in the second experiment. We included only women in the second study since no gender differences emerged in experiment 1 and because of easier participant recruitment. The data of two participants had to be excluded from further analysis due to data acquisition artifacts. The mean age of the remaining 26 participants was 23.38 ± 3.41 years. The study was conducted in accordance with the Declaration of Helsinki and local guidelines of the University of Vienna. Informed written consent was obtained from each participant prior to participation. At the end of the experiment each participant received a fixed bonus of 15 Euros for participation.
Again, the PSSI questionnaire was administered before EEG data collection. The average score on the AS-scale in this sample was 49.69 ± 10.65, ranging from 31 to 72. Participants were divided into three groups based on whether their T-values lay approximately below, above, or within two thirds of the samples’ SD (comparable to experiment 1). Ten participants formed the low-trait group (mean 39.20 ± 3.68, range of 31–42), six participants the middle group (mean 49.00 ± 3.69, range of 45–54), and the remaining 10 participants constituted the high-trait group (mean 60.60 ± 6.26, range of 56–72). Only the 10 low-trait (“social group”) and the 10 high-trait (“antisocial group”) participants were considered for analysis. The T-values of these two groups differed significantly from each other [independent samples t-test: t(18) = 9.33, p < 0.001], again indicating that our group categorization was successful. No differences of the individual AS-scale scores were observed when comparing both experiments either [independent samples t-test; t(53) = 0.24, p > 0.80] although experiment 2 comprised only female participants.
Experimental procedures
Experimental procedures were equivalent to those in experiment 1, with the only exception that participants were presented with emotional faces instead of colored numbers depicting positive and negative feedback. In particular, feedback stimuli consisted of pictures of faces with emotional expressions taken from the standardized Ekman series (Ekman and Friesen, 1976; 4 cm × 5 cm in size). Two male and two female faces showing the emotions “happiness” and “anger” were used as positive (“happy” face) and negative (“angry” face) feedback stimuli, with poser gender balanced across experimental trials. Participants were familiarized with the emotional faces during task instruction. Participants were informed that they could earn 10–15 Euros depending on their task performance, i.e., the number of correct responses. After each of the six experimental task blocks participants were given an overall performance feedback in terms of the number of correct responses. Afterward they were informed that they had performed extremely well – and regardless of their points accumulated – all were paid 15 Euros. Finally, they were debriefed about the external feedback manipulation.
EEG acquisition and preprocessing
Data acquisition and preprocessing procedures were identical to experiment 1. Data were recorded from 61 Ag/AgCl ring electrodes. The same eye movement and blink correction algorithms were applied as described in experiment 1.
Data analysis
Subject- and condition-wise averages were calculated for the four conditions (1) expected positive feedback (exp-pos; cue “one”), (2) expected negative feedback (exp-neg; cue “three”), (3) unexpected positive feedback (unexp-pos; cue “three”), and (4) unexpected negative feedback (unexp-neg; cue “one”). Subsequently, FRN and P300 peaks were extracted using the same criteria as in experiment 1. For FRN analysis, data were subjected to a mixed-design 2 × 2 × 2 ANOVA with the between-subjects factor group (low-trait, high-trait), and the within-subjects factors expectation (expected, unexpected) and valence (positive, negative). Regarding the a priori FRN hypothesis on group differences after negative feedback stimuli, we calculated a linear contrast. The same ANOVA model was applied for P300 peak and latency analysis.
To address the question whether or not FRN amplitude differences between low-scoring and high-scoring participants in experiment 1 differed significantly from those in experiment 2, we compared the Cohen’s d effect sizes of the between-subject factor group of both experiments by means of a homogeneity test based on the Q statistic with CMA v2.2.030 software (Comprehensive Meta-Analysis; Biostat™, Englewood, USA).
Results Experiment 1: Monetary Feedback
Behavioral Results
Participants learned the cue–response contingencies in the training session. Button one was chosen in 90.43% of cue “one” trials, and button two in 79.95% of cue “two” trials. No button preference emerged for cue “three” trials (42.24% button one vs. 49.92% button two).
In the post-experimental questionnaire, participants estimated the probability of occurrence of positive feedback after cue “one” with a median of 70, range of 50–90, after cue “two” with a median of 70, range of 20–85, and after cue “three” with a median of 20, range of 1–70. Positive feedback was expected significantly more often after cue “one” than cue “three” (Wilcoxon signed-ranks test: Z = −4.79, p < 0.001).
ERP Results
Figure 1 displays feedback-locked average ERPs for expected and unexpected, positive and negative feedback conditions for the low-trait and the high-trait group at electrode site FCz of experiment 1.
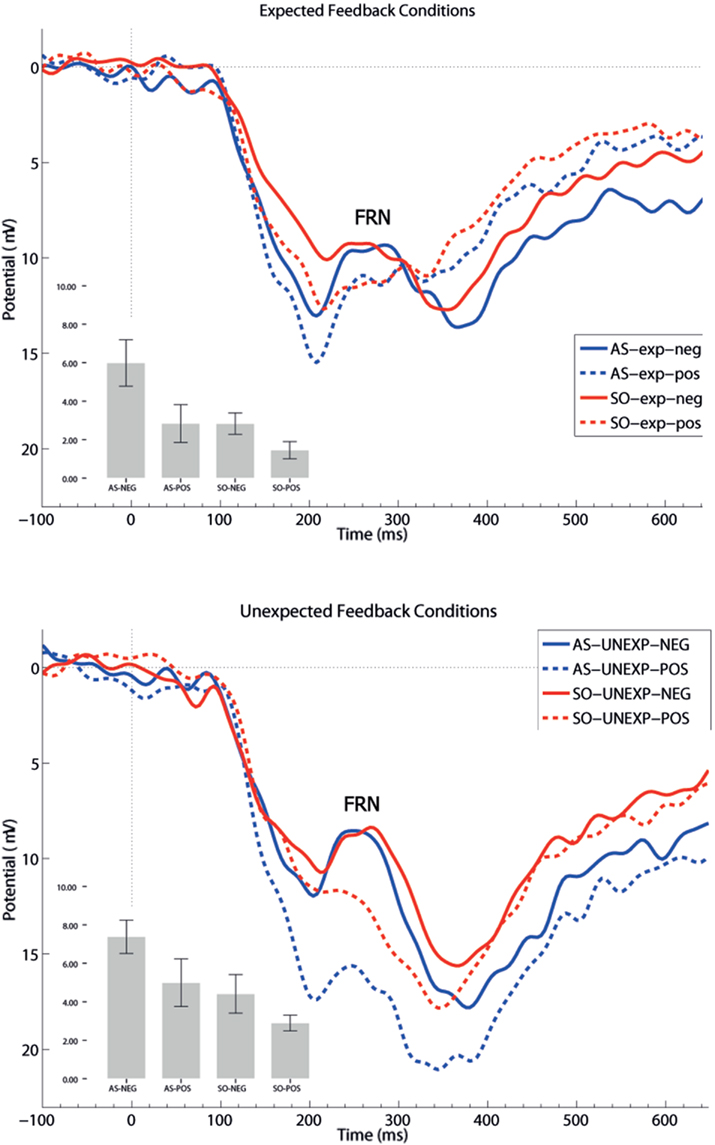
Figure 1. Grand average ERPs of experiment 1. Grand averages at electrode sites FCz for expected (upper panel) and unexpected (lower panel) positive (POS) and negative (NEG) feedback conditions differentiating low-trait (SO) and high-trait (AS) participants for experiment 1. Negative is drawn upward per convention; feedback presentation started at 0 ms. The bar chart depicts the respective peak-to-peak mean FRN amplitude values. Error bars indicate 1 SE.
Regarding FRN amplitudes, analysis revealed main effects for expectation [F(1,21) = 8.94, p = 0.007,  ], valence [F(1,21) = 26.38, p < 0.001,
  ], and group [F(1,21) = 7.20, p = 0.014,
  ]. FRN amplitudes were more pronounced after unexpected compared to expected feedback, and after negative compared to positive feedback. Furthermore, high-scoring participants displayed enhanced FRN amplitudes compared to low-scoring ones. A linear contrast testing the a priori hypothesis of group differences regarding negative feedback stimuli revealed significantly larger FRN amplitudes after negative feedback in the high-trait group compared to the low-trait group (p = 0.015). No significant interaction effects emerged (all ps > 0.123).
Regarding P300 amplitudes, analysis revealed a main effect for the factor expectation [F(1,21) = 65.37, p < 0.001,  ], indicating that P300 amplitudes were largest after unexpected compared to expected feedback. The expectation x valence interaction showed a trend toward significance [F(1,21) = 3.80, p = 0.065,
  ], thereby pointing toward largest P300 amplitudes after unexpected positive feedback. Regarding P300 latency, analysis revealed main effects for expectation [F(1,21) = 22.85, p < 0.001,
  ] and valence [F(1,21) = 13.84, p = 0.001,
  ], but no interaction effects (all ps > 0.151). P300 latencies were prolonged after unexpected as well as negative feedback stimuli. No effects of group emerged for P300 amplitude (p > 0.758) and latency analyses (p > 0.881).
Results Experiment 2: Emotional Faces Feedback
Behavioral Results
Again, participants learned the cue–response contingencies in the training session. Button one was chosen in 90.60% of cue “one” trials, and button two in 77.34% of cue “two” trials. No button preference emerged for cue “three”-trials (44.53% button one vs. 54.68% button two).
In the post-experimental questionnaire, participants estimated the probability of occurrence of positive feedback after cue “one” with a median of 70, range of 60–90, after cue “two” with a median of 70, range of 50–80, and after cue “three” with a median of 30, range 2–40. Again, positive feedback was expected significantly more often after cue “one” than cue “three” (Wilcoxon signed-ranks test: Z = −4.48, p < 0.001).
ERP Results
Figure 2 displays feedback-locked average ERPs for expected and unexpected, positive and negative feedback conditions for the low-trait and the high-trait group at electrode site FCz for experiment 2.
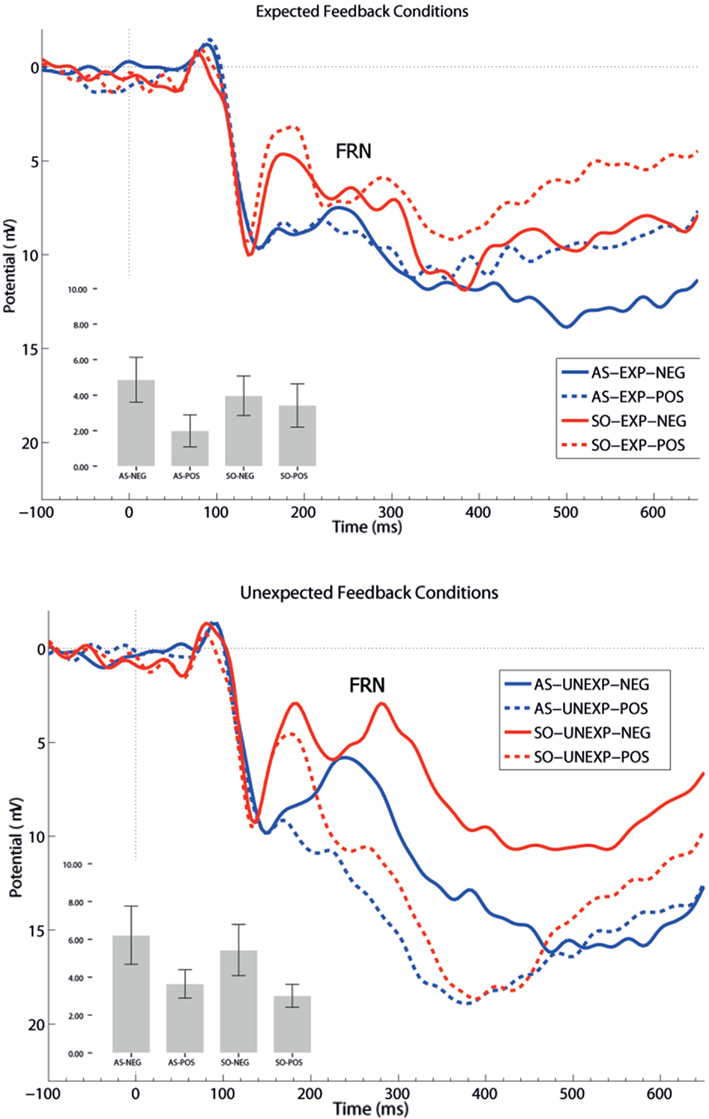
Figure 2. Grand average ERPs of experiment 2. Grand averages at electrode sites FCz for expected (upper panel) and unexpected (lower panel) positive (POS) and negative (NEG) feedback conditions differentiating low-trait (SO) and high-trait (AS) participants for experiment 2. Negative is drawn upward per convention; feedback presentation started at 0 ms. The bar chart depicts the respective peak-to-peak mean FRN amplitude values. Error bars indicate 1 SE.
Regarding FRN amplitudes, statistical analysis revealed main effects for expectation [F(1,18) = 6.93, p = 0.017,  ] and valence [F(1,18) = 13.53, p = 0.002,
  ]. FRN amplitudes were larger after unexpected compared to expected feedback, as well as after negative compared to positive feedback. The linear contrast testing the a priori hypothesis of group differences regarding negative feedback stimuli revealed no amplitude differences between the low-trait and the high-trait group (p > 0.641). Otherwise, no significant main effect for group (p > 0.877), nor any significant interaction effects were observed (all ps > 0.205).
For P300 amplitudes, we observed a main effect of expectation [F(1,18) = 27.49, p < 0.001,  ], and a significant interaction of expectation x valence [F(1,18) = 17.56, p = 0.001,
  ]. Significantly smaller P300 amplitudes were found after expected positive compared to the remaining three feedback conditions (all ps < 0.012), and after expected negative compared to unexpected positive feedback (p < 0.004). No expectation effect was present for negative feedback conditions (p > 0.383), and no valence effect was present for unexpected feedback conditions (p > 0.115). Regarding P300 latency, the ANOVA revealed main effects of expectation [F(1,18) = 4.93, p = 0.039,
  ] and valence [F(1,18) = 11.25, p = 0.004,
  ], but no interaction effects (all ps > 0.109). P300 latencies were longer after unexpected as well as negative feedback stimuli. No effects of group emerged for the P300 amplitude (p > 0.826) and latency analyses (p > 0.403). P300 peak amplitudes and latencies of both experiments are depicted in Table 2.
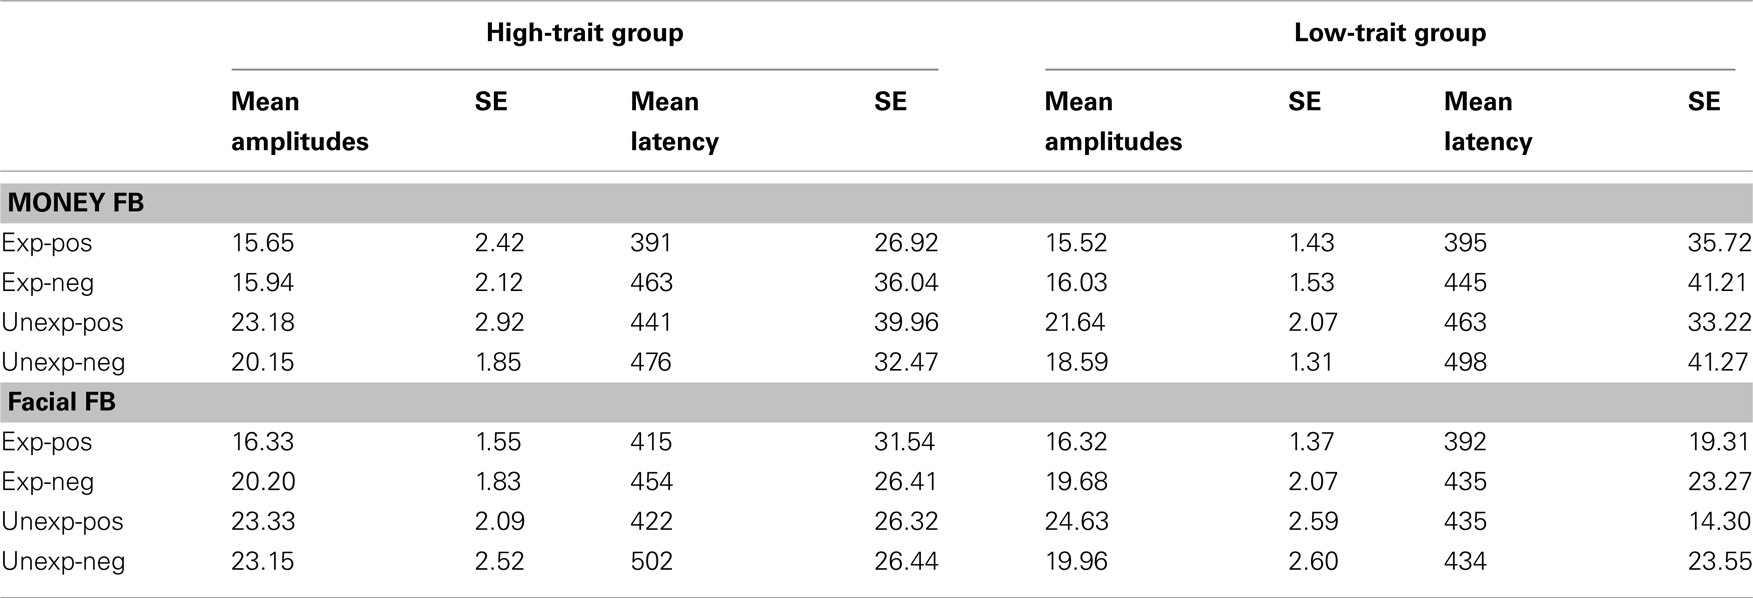
Table 2. Mean base-to-peak amplitude values and mean latencies and corresponding SE values of the P300 at Pz for the high-trait group and the low-trait group for experiment 1 (money FB) and experiment 2 (facial FB).
Comparison of experiment 1 and 2
The Cohen’s d effect size for the group factor was −1.502 in experiment 1, and −0.147 in experiment 2. The comparison of both effect sizes by means of a homogeneity test corroborated our previous findings. FRN amplitude differences between low-scoring and high-scoring individuals were only significantly different from each other when monetary feedback was provided ( p = 0.003).
Discussion
The main objective of the present study was to investigate neuronal correlates of feedback processing in healthy individuals scoring high or low on an antisociality measure by applying a gambling task with two different types of feedback stimuli. No group differences were observed between low-scoring and high-scoring participants when administering emotional faces as feedback stimuli. However, when administering numbers directly indicating monetary gain or loss as feedback stimuli, the high-trait group displayed enhanced FRN amplitudes compared to the low-trait group. In particular, FRN amplitudes were larger after expected and unexpected negative feedback indicating monetary loss in high-scoring individuals, but not in low-scoring ones. This is the main finding of the present experiment. To be more explicit, it is the monetary gambling task which successfully discriminates individuals based on their scores on the PSSI antisociality scale. P300 amplitudes and latencies were not affected by antisociality.
Feedback related negativity enhancement after negative compared to positive feedback stimuli, and after unexpected compared to expected feedback stimuli is in line with recent literature (Miltner et al., 1997; Gehring and Willoughby, 2002; Holroyd and Coles, 2002). A general FRN amplitude enhancement can be interpreted as error signal (Miltner et al., 1997), as response conflict signal (Botvinick et al., 2001), or as indicator for outcomes worse than expected (Holroyd and Coles, 2002). The response conflict account would imply that high-scoring participants experienced more cognitive conflict after monetary feedback presentation, no matter whether they won or lost money and irrespective of expectancy. On the contrary, the error signal account would imply that each possible feedback outcome was worse than expected for the high-scoring participants. However, both assumptions do not seem plausible since neither susceptibility for enhanced cognitive conflict nor a general negativity bias have been reported in antisocials. Further theories on FRN modulation emphasize subjective stimulus evaluation and motivational significance of the depicted stimuli (Gehring and Willoughby, 2002; Yeung et al., 2005). Both accounts would indicate that the feedback stimuli comprising in particular monetary losses, but not the feedback stimuli comprising emotional faces, were more salient to high-scoring than to low-scoring participants. Thus, one might argue that the high-scoring individuals process emotional faces adequately and comparable to the low-scoring individuals. It is most likely that the additional monetary incentive triggers an increase in motivational salience which then yields to neuronal processing differences between the two groups.
To our knowledge, no other study has investigated the relationship between antisociality in a community sample and feedback processing yet. Therefore, we will discuss studies investigating constructs related to antisociality and ASP, namely psychopathy and the concept of externalizing psychopathology.
Regarding psychopathy, Von Borries et al. (2010) conducted a feedback processing study in a forensic sample. The authors applied a probabilistic gambling task to incarcerated psychopathic violent offenders and to a free and healthy control group. Von Borries et al. (2010) found reduced error-related activity in the psychopathic group which was discussed as being an indicator for a disability in forming an internal template of the presented learning rule. This observation of reduced neuronal activity regarding internal performance monitoring in psychopathy has already been reported. Brazil et al. (2009) observed psychopaths to show deficits in later stages of error processing and subsequent behavioral adaption. Munro et al. (2007) reported diminished error-related brain activity during a face flanker task compared to a letter flanker task. External performance monitoring (as indexed by learning rate and FRN amplitudes) was statistically comparable in psychopaths and healthy controls in the study of Von Borries et al. (2010). This non-significant result might be explainable by the fact that the authors did not distinguish between different aspects of psychopathy. Recently, dual deficit models propose two sub dimensions of psychopathy (Lykken, 1995; Fowles and Dindo, 2009). The so-called primary psychopathy is associated with deficits in emotional and interpersonal domains (Hare, 2003). Contrary, the so-called secondary psychopathy is associated with impulsive and antisocial behavior (Hare, 2003). Unfortunately, Von Borries et al. (2010) as well as studies investigating neural correlates of error processing did not distinguish between these two facets of psychopathy. Thus, the lack of group differences regarding feedback processing might be attributed to participants rather scoring high on primary than on secondary psychopathy, which is not considered to be associated with antisocial behavior (Hare, 2003).
The concept of externalizing psychopathology describes another personality facet and is considered to reflect an underlying vulnerability factor for impulse control deficits which can be found in conduct disorder, substance-use disorders, and adult ASP (Krueger, 1999; Krueger et al., 2001). Furthermore, personality dimensions such as aggression and impulsivity were suggested to be basic markers of an externalizing vulnerability (Krueger et al., 2001). To cross-reference proneness to externalizing and psychopathy, Patrick (2007) suggested a relation of secondary psychopathy with externalizing psychopathology. Apart from the incorporation of antisocial behavior, externalizing psychopathology shares another relevant theoretical assumption with ASP, namely a failure to learn from experience, which can be found in the components of externalizing psychopathology (Hall et al., 2007). For example, reduction in neuronal activity has been reported in relation to internal performance monitoring in highly impulsive individuals (Pailing et al., 2002; Potts et al., 2006), as well as in individuals scoring high on the externalizing construct (Hall et al., 2007). Recently, Bernat et al. (2011) investigated the neuronal correlates of gain/loss feedback and externalizing psychopathology. Applying time frequency decomposition measures, the authors found no relation between FRN time frequency measures and proneness to externalizing. Thus, Bernat et al. (2011) assumed that performance monitoring deficits in highly externalizing individuals were limited to internal performance monitoring processes, whereas external performance monitoring processes reflected by FRN amplitudes were not affected. Their results are partly in line with data on psychopathy (Von Borries et al., 2010) and with the results of our second experiment where no group differences due to antisociality were observed. However, Bernat et al. (2011) did not reward their participants based on their task performance in comparison to our first experiment; although they also presented their participants with numbers indicating gain or loss. The monetary reward cues of our first experiment might hold responsible for the difference between the results of Bernat et al. (2011) and ours. Indeed, Bernat et al. (2011) stated that individuals prone to externalizing might be extremely sensitive to immediate and concrete reward, whereas abstract and more symbolic reward cues like the ones used in their study might have decreased individual reactivity to rewards. This might be also applicable to healthy antisocial individuals. Thus, the data of our first experiment point toward the assumption that the prospect of tangible monetary reward or loss is crucial when investigating external performance monitoring and its association with antisociality.
P300 enhancement after unexpected compared to expected feedback stimuli is in line with previous findings (Duncan-Johnson and Donchin, 1977; Johnson and Donchin, 1980). P300 amplitude enhancement can be interpreted as indicator of subjective reward probability. The observation of slightly larger P300 amplitudes after unexpected positive feedback might index subjective stimulus salience in all participants (Hajcak et al., 2005; Yeung et al., 2005). P300 latencies were prolonged after unexpected compared to expected, and after negative compared to positive feedback stimuli in both experiments. This observation might indicate that these feedback stimuli were more difficult to classify as the expected and positively valenced ones (Polich, 2007). The healthy student sample might be the main reason why the present data did not yield any group differences between low-scoring and high-scoring individuals regarding P300 amplitudes and latencies. It is possible that the proposed P300 decrement in antisocials (Gao and Raine, 2009) is only observable in clinical populations with known resource allocation or attention deficits. Our results indicate that both groups allocated a comparable amount of cognitive resources to the processing of the feedback stimuli and that they experienced subjective reward probability alike.
The rather small sample size of the low- and high-trait groups in both experiments poses a limitation of the present study. Thus, the present results have to be considered preliminarily. Although no gender differences were apparent for FRN or P300 analysis in the first experiment (all Fs < 1), we are aware that prevalence rates of ASP are typically higher in men than in women (Grant et al., 2004). Consequently, future studies should emphasize homogeneous samples of participants. Furthermore, future studies should investigate external feedback processing in healthy antisocial controls in relation to individuals suffering from ASP, primary, and secondary psychopathy.
To summarize, the present findings indicate that only individuals scoring high on antisocial traits attribute higher motivational salience to concrete and monetary compared to more abstract and social reinforcers. This is reflected in FRN amplitude enhancement after expected and unexpected negative feedback. No processing deficiencies concerning emotional feedback stimuli were apparent in those individuals in our study since comparable neuronal responses were observed in both participating groups. Thus, we propose to consider stimulus salience as an important aspect in feedback processes in individuals scoring high on antisocial traits. Since feedback processing is essential in learning processes, potential implications for therapeutic interventions in these individuals arise. Antisocials might profit the most from therapeutic programs including concrete and economically valid reinforcers.
Conflict of Interest Statement
The authors declare that the research was conducted in the absence of any commercial or financial relationships that could be construed as a potential conflict of interest.
Acknowledgments
Participants’ financial remuneration was funded by a scholarship of the University of Vienna to Daniela Melitta Pfabigan (Förderstipendium StudFG). We thank Michael Zeiler for his assistance concerning the CMA effect size analysis.
References
American Psychiatric Association. (1994). Diagnostic and Statistical Manual of Mental Disorders – DSM-IV. Washington, DC: American Psychiatric Press.
Bates, E., Federmeier, K., Herron, D., Iyer, G., Jacobsen, T., Pechmann, T., D’Amico, S., Devescovi, A., Wicha, N., Orozco-Figueroa, A., Kohnert, K., Gutierrez, G., Lu, C. C., Hung, D., Hsu, J., Tzeng, O., Andonova, E., Gerdjikova, I., Mehotcheva, T., Székely, A., and Pléh, C. (2000). Introducing the CRL International Picture-Naming Project (CRL-JPNP). Center Res. Lang. Newslett. 12, 1–14.
Bauer, H., and Lauber, W. (1979). Operant conditioning of brain steady potential shifts in man. Biofeedback Self Regul. 4, 145–154.
Bell, A. J., and Sejnowski, T. J. (1995). An information-maximization approach to blind separation and blind deconvolution. Neural Comput. 7, 1129–1159.
Berger, K. S. (2003). The Developing Person Through Childhood and Adolescence. New York, NY: Worth Publishers.
Bernat, E. M., Hall, J. R., Steffen, B. V., and Patrick, C. J. (2007). Violent offending predicts P300 amplitude. Int. J. Psychophysiol. 66, 161–167.
Bernat, E. M., Nelson, L. D., Steele, V. R., Gehring, W. J., and Patrick, C. J. (2011). Externalizing psychopathology and gain-loss feedback in a simulated gambling task: dissociable components of brain response revealed by time-frequency analysis. J. Abnorm. Psychol. 120, 352–364.
Botvinick, M. M., Braver, T. S., Barch, D. M., Carter, C. S., and Cohen, J. D. (2001). Conflict monitoring and cognitive control. Psychol. Rev. 108, 624–652.
Brazil, I. A., de Bruijn, E. R. A., Bulten, B. H., von Borries, A. K. L., van Lankveld, J. J. D. M., Buitelaar, J. K., and Verkes, R. J. (2009). Early and late components of error monitoring in violent offenders with psychopathy. Biol. Psychiatry 65, 137–143.
Cohen, J. (1973). Eta-squared and partial eta-squared in fixed factor ANOVA designs. Edu. Psychol. Measurements 33, 107–111.
Coid, J., and Ullrich, S. (2010). Antisocial personality disorder is on a continuum with psychopathy. Compr. Psychiatry 51, 426–433.
Costa, L., Bauer, L., Kuperman, S., Porjesz, B., O’Conner, S., Hesselbrock, V., Rohrbaugh, J., and Begleiter, H. (2000). Frontal P300 decrements, alcohol dependence, and antisocial personality disorder. Biol. Psychiatry 47, 1064–1071.
Delorme, A., and Makeig, S. (2004). EEGLAB: an open source toolbox for analysis of single trial EEG dynamics including independent component analysis. J. Neurosci. Methods 134, 9–21.
Delorme, A., Sejnowski, T., and Makeig, S. (2007). Enhanced detection of artifacts in EEG data using higher- order statistics and independent component analysis. Neuroimage 34 1443–1449.
Dinn, W. M., and Harris, C. L. (2000). Neurocognitive function in antisocial personality disorder. Psychiatry Res. 97, 173–190.
Duncan-Johnson, C. C., and Donchin, E. (1977). On quantifying surprise: the variation of event-related potentials with subjective probability. Psychophysiology 14, 456–467.
Ekman, P., and Friesen, W. V. (1976). Pictures of Facial Affect. Palo Alto, CA: Consulting Psychologists Press.
Fowles, D. C., and Dindo, L. (2009). Temperament and psychopathy. A dual-pathway model. Curr. Opin. Psychol. Sci. 18, 179–183.
Gao, Y., and Raine, A. (2009). P3 event-related potential impairments in antisocial and psychopathic individuals: a meta-analysis. Biol. Psychol. 82, 199–210.
Gehring, W. J., and Willoughby, A. R. (2002). The medial frontal cortex and the rapid processing of monetary gains and losses. Science 14, 385–602.
Grant, B. F., Hasin, D. S., Stinson, F. S., Dawson, D. A., Chou, S. P., Ruan, W. J., and Pickering, R. P. (2004). Prevalence, correlates, and disability of personality disorders in the united states: results from the national epidemiologic survey on alcohol and related conditions. J. Clin. Psychiatry 65, 948–958.
Hajcak, G., Holroyd, C. B., Moser, J. S., and Simons, R. F. (2005). Brain potentials associated with expected and unexpected good and bad outcomes. Psychophysiology 42, 161–170.
Hajcak, G., Moser, J. S., Holroyd, C. B., and Simons, R. F. (2007). It’s worse than you thought: the feedback negativity and violations of reward prediction in gambling tasks. Psychophysiology 44, 905–912.
Hall, J. R., Bernat, E. M., and Patrick, J. C. (2007). Externalizing psychopathology and the error-related-negativity. Psychol. Sci. 18, 326–333.
Hart, S. D., and Hare, R. D. (1996). Psychopathy and antisocial personality disorder. Curr. Opin. Psychiatry 9, 129–132.
Hicks, B. M., Bernat, E., Malone, S. M., Iacono, W. G., Patrick, C. J., Krueger, R. F., and McGue, M. (2007). Genes mediate the association between P3 amplitude and externalizing disorders. Psychophysiology 44, 98–105.
Holroyd, C. B., and Coles, M. G. H. (2002). The neural basis of human error processing: reinforcement learning, dopamine, and the error-related negativity. Psychol. Rev. 109, 679–709.
Holroyd, C. B., Nieuwenhuis, S., Yeung, N., and Cohen, J. D. (2003). Errors in reward prediction are reflected in the event-related brain potential. Neuroreport 14, 2481–2484.
Israel, J. B., Chesney, G. L., Wickens, C. D., and Donchin, E. (1980). P300 and tracking difficulty: evidence for multiple resources in dual-task performance. Psychophysiology 27, 259–273.
Johnson, R., and Donchin, E. (1980). P300 and stimulus categorization: two plus one is not so different from one plus one. Psychophysiology 17, 167–178.
Krueger, R. F., McGue, M., and Iacono, W. G. (2001). The higher-order structure of common DSM mental disorders: internalization, externalization, and their connections to personality. Pers. Individ. Diff. 30, 1245–1259.
Kuhl, J. (2001). Motivation und Persönlichkeit. Interaktionen psychischer Systeme. Göttingen: Hogrefe.
Kuhl, J., and Kazén, M. (1997). Persönlichkeits-Stil und Störungs-Inventar (PSSI). Göttingen: Hogrefe Verlag.
Lamm, C., Fischmeister, F. P., and Bauer, H. (2005). Individual differences in brain activity during visuo-spatial processing assessed by slow cortical potentials and low resolution electromagnetic tomography. Brain Res. Cogn. Brain Res. 25, 900–912.
Lee, T. W., Girolami, M., and Sejnowski, T. J. (1999). Independent component analysis using an extended infomax algorithm for mixed subgaussian and supergaussian sources. Neural Comput. 11, 417–441.
Lilienfeld, S. O., and Andrews, B. P. (1996). Development and preliminary validation of a self report measure of psychopathic personality traits in noncriminal populations. J. Pers. Assess. 66, 488–524.
Luu, P., Shane, M., Pratt, N. L., and Tucker, D. M. (2009). Corticolimbic mechanisms in the control of trial and error learning. Brain Res. 1247, 100–113.
Marsh, A. A., and Blair, R. J. R. (2008). Deficits in facial affect recognition among antisocial populations: a meta-analysis. Neurosci. Biobehav. Rev. 32, 454–465.
Miltner, W. H. R., Braun, C. H., and Coles, M. G. H. (1997). Event-related brain potentials following incorrect feedback in a time-estimation task: evidence for a “generic” neural system for error detection. J. Cogn. Neurosci. 9, 788–798.
Munro, G. E. S., Dywan, J., Harris, G. T., McKee, S., Unsal, A., and Segalowitz, S. J. (2007). ERN varies with degree of psychopathy in an emotion discrimination task. Biol. Psychol. 76, 31–42.
Nieuwenhuis, S., Holroyd, C. B., Mol, N., and Coles, M. G. H. (2004). Reinforcement-related brain potentials from medial frontal cortex: origins and functional significance. Neurosci. Biobehav. Rev. 28, 441–448.
Oldfield, R. C. (1971). The assessment and analysis of handedness: the Edinburgh inventory. Neuropsychologia 9, 97–113.
Pailing, P. E., Segalowitz, S. J., Dywan, J., and Davies, P. L. (2002). Error negativity and response control. Psychophysiology 39, 198–206.
Patrick, C. J. (2007). “Antisocial personality disorder and psychopathy,” in Handbook of Personality Disorders, eds W. O’Donohue, K. A. Fowler, and S. O. Lilienfeld (New York: Sage), 109–166.
Pfabigan, D. M., Alexopoulos, J., Bauer, H., and Sailer, U. (2011). Manipulation of feedback expectancy and valence induces negative and positive reward prediction error signals manifest in event-related brain potentials. Psychophysiology 48, 656–664.
Picton, T. W., and Hillyard, S. A. (1972). Cephalic skin potentials in electroencephalography. Electroencephalogr. Clin. Neurophysiol. 33, 419–424.
Polich, J. (2007). Updating P300: an integrative theory of P3a and P3b. Clin. Neurophysiol. 118, 2128–2148.
Potts, G. F., Martin, L. E., Burton, P., and Montague, P. R. (2006). When things are better or worse than expected: the medial frontal cortex and the allocation of processing resources. J. Cogn. Neurosci. 18, 1112–1119.
Raine, A., and Venables, P. H. (1988). Enhanced P3 evoked potentials and longer P3 recovery times in psychopaths. Psychophysiology 25, 30–38.
Rodrigo, C., Pajapakse, S., and Jayananda, G. (2010). The “antisocial” person: an insight in to biology, classification and current evidence on treatment. Ann. Gen. Psychiatry 9, 1–31.
Sailer, U., Fischmeister, F. P., and Bauer, H. (2010). Effects of learning on feedback-related brain potentials in a decision-making task. Brain Res. 1342, 85–93.
Stephenson, W., and Gibbs, F. A. (1951). A balanced non-cephalic reference electrode. Electroencephalogr. Clin. Neurophysiol. 3, 237–240.
Vogt, B. A. (2005). Pain and emotion. Interactions in subregions of the cingulate gyrus. Nat. Rev. Neurosci. 6, 533–544.
Von Borries, A. K. L., Brazil, I. A., Bulten, B. H., Buitelaar, J. K., Verkes, R. J., and de Bruijn, E. R. A. (2010). Neural correlates of error-related learning deficits in individuals with psychopathy. Psychol. Med. 40, 1559–1568.
Walters, G. D. (2009). Latent structure of a two-dimensional model of antisocial personality disorder: construct validation and taxometric analysis. J. Pers. Disord. 23, 647–660.
Widinger, T. A. (2007). “Psychopathy and DSM-IV psychopathology,” in Handbook of Psychopathy, ed. C. J. Patrick (New York, NY: Guilford Press), 156–171.
World Health Organization. (1992). The ICD-10 Classification of Mental and Behavioural Disorders. Geneva: World Health Organization.
Yeung, N., Botvinick, M. M., and Cohen, J. D. (2004). The neural basis of error detection: conflict monitoring and the error-related negativity. Psychol. Rev. 111, 931–959.
Yeung, N., Holroyd, C. B., and Cohen, J. D. (2005). ERP correlates of feedback and reward processing in the presence and absence of response choice. Cereb. Cortex 15, 535–544.
Keywords: antisocial personality, feedback processing, FRN, P300
Citation: Pfabigan DM, Alexopoulos J, Bauer H, Lamm C and Sailer U (2011) All about the money – external performance monitoring is affected by monetary, but not by socially conveyed feedback cues in more antisocial individuals. Front. Hum. Neurosci. 5:100. doi: 10.3389/fnhum.2011.00100
Received: 04 July 2011;
Accepted: 30 August 2011;
Published online: 20 September 2011.
Edited by:
Patrizia Thoma, Ruhr-University Bochum, GermanyReviewed by:
David Polezzi, Ruhr-University of Bochum, GermanyInti Brazil, Donders Institute for Brain Cognition and Behaviour, Netherlands
Copyright: © 2011 Pfabigan, Alexopoulos, Bauer, Lamm and Sailer. This is an open-access article subject to a non-exclusive license between the authors and Frontiers Media SA, which permits use, distribution and reproduction in other forums, provided the original authors and source are credited and other Frontiers conditions are complied with.
*Correspondence: Daniela Melitta Pfabigan, Social, Cognitive and Affective Neuroscience Unit, Faculty of Psychology, University of Vienna, Liebiggasse 5, A-1010 Vienna, Austria. e-mail: daniela.pfabigan@univie.ac.at