Functional significance of the emotion-related late positive potential
- 1Department of Psychology, Cognitive Psychology Unit, Institute of Psychology, Leiden University, Leiden, Netherlands
- 2Leiden Institute for Brain and Cognition (LIBC), Leiden, Netherlands
The late positive potential (LPP) is an event-related potential (ERP) component over visual cortical areas that is modulated by the emotional intensity of a stimulus. However, the functional significance of this neural modulation remains elusive. We conducted two experiments in which we studied the relation between LPP amplitude, subsequent perceptual sensitivity to a non-emotional stimulus (Experiment 1) and visual cortical excitability, as reflected by P1/N1 components evoked by this stimulus (Experiment 2). During the LPP modulation elicited by unpleasant stimuli, perceptual sensitivity was not affected. In contrast, we found some evidence for a decreased N1 amplitude during the LPP modulation, a decreased P1 amplitude on trials with a relatively large LPP, and consistent negative (but non-significant) across-subject correlations between the magnitudes of the LPP modulation and corresponding changes in d-prime or P1/N1 amplitude. The results provide preliminary evidence that the LPP reflects a global inhibition of activity in visual cortex, resulting in the selective survival of activity associated with the processing of the emotional stimulus.
Introduction
In recent years, emotion has become an important and well-respected topic of neuroscientific research. One of the most powerful neuroscientific methods for assessing emotional processing in the human brain is the study of event-related potentials (ERPs). In the past decade, researchers have identified an ERP component, the late positive potential (LPP), that is strongly modulated by the emotional intensity of a stimulus: Emotional stimuli of either a positive or negative valence elicit a larger (i.e., more positive) LPP than neutral stimuli (Cuthbert et al., 2000; Keil et al., 2002; Hajcak et al., 2010) and more arousing neutral pictures (e.g., scenes that include people) elicit a larger LPP than less arousing neutral pictures (such as scenes without people; Weinberg and Hajcak, 2010). This modulation is most pronounced around 400–600 ms following the stimulus (Schupp et al., 2006), but can continue for up to a second after the offset of the stimulus (Hajcak and Olvet, 2008). The LPP has been used in a range of applied fields. For example, it has been used as an index of abnormal emotional responding in both adults and children (Dennis and Hajcak, 2009; Horan et al., 2010; Marissen et al., 2010), to study social biases in ingroup/outgroup classification (Hurtado et al., 2009; Crites et al., 2010), and as a tool in criminological lie detection (Matsuda et al., 2009).
The conditions that modulate the amplitude of the LPP have been charted extensively (Schupp et al., 2006; Olofsson et al., 2008; Hajcak et al., 2010). For example, stimuli that are rated as more arousing elicit a larger (i.e., more positive) LPP (Cuthbert et al., 2000; de Rover et al., 2012). Most LPP studies have used pictures from the International Affective Picture System (IAPS; Lang et al., 1999), but the emotion-related LPP modulation can also be evoked by other stimulus types, such as threatening faces or emotional gestures (Schupp et al., 2004b; Flaisch et al., 2011). Although most studies present emotional and neutral pictures for 5–6 s, an LPP modulation has also been observed with much shorter presentation times, even down to 120 ms (Schupp et al., 2004a). Furthermore, the LPP is relatively robust to multiple presentations of the same stimulus material (Codispoti et al., 2007).
Although the antecedent conditions of the LPP have been thoroughly studied, the functional significance of the LPP remains rather elusive. As Donchin (1981) argued, in the context of the P3: “I want to emphasize the distinction between an enumeration of the antecedent conditions and a process theory of a phenomenon. […] The theory I seek is to be a description of the functional significance of this process. The theory should elucidate the specific processing activities undertaken by the neuronal population whose activity is manifested on the scalp by a component.” (p. 498/500). As we will discuss below, emotional stimuli appear to be able to both enhance and impair visual perception (Bocanegra and Zeelenberg, 2009b). This allows us to formulate two contrasting hypotheses about the functional significance of the LPP.
The implicit or (sometimes) explicit assumption in many LPP studies is that the LPP reflects a spatially non-specific (i.e., global), temporary increase in attention, that serves to facilitate the processing of the affective stimulus that elicited the LPP. This enhanced perception hypothesis of the LPP is consistent with the neural generators of the LPP in ventral and dorsal visual areas (Sabatinelli et al., 2007; Frühholz et al., 2009; Baetens et al., 2011; Moratti et al., 2011) and with the typical finding that emotional stimuli automatically attract attention (Fox et al., 2000; Vuilleumier, 2005) and are processed more efficiently (Zeelenberg et al., 2006). Comparable increases in temporal attention have been reported in the accessory stimulus paradigm, in which a task-irrelevant auditory accessory stimulus accompanying a visual target shortens reaction times (RTs) by decreasing the time needed to encode the target (e.g., Jepma et al., 2009); and in the temporal cuing paradigm in which cues that predict the moment of target presentation are used by subjects to optimize RTs, in part by speeding up the encoding of the target (Correa et al., 2005).
Although the enhanced perception hypothesis is plausible, it is not supported by any direct evidence. The fact that emotional stimuli modulate the LPP and are processed efficiently reflects a correlation and does not imply a causal relationship. The efficient processing of emotional stimuli may be due not to the process underlying the LPP but to other, earlier processes, some of which may be visible in the EEG signal. For example, emotional stimuli elicit an early posterior negativity (EPN), an ERP component that like the LPP is modulated by the emotional intensity of a stimulus, but that peaks earlier than the LPP (Schupp et al., 2006). Improved perception after emotional stimuli has also been related to early interactions between the amygdala and the magnocellular processing channel (Bocanegra and Zeelenberg, 2009a).
However, while emotional stimuli are generally processed more efficiently, they often impair the perception of concurrently presented neutral stimuli when they are in spatial competition (e.g., Pourtois et al., 2005). In addition, Bocanegra and Zeelenberg (2009b) review evidence that, under some circumstances, the presentation of emotional stimuli can impair the perception of a subsequent neutral stimulus if the two stimuli are presented in close temporal proximity. Thus, the capturing of attention by emotional stimuli may be accompanied by and/or followed by a global inhibition of other representations in the visual cortex, and the LPP may reflect this global inhibition. This global inhibition hypothesis of the LPP is consistent with work by Birbaumer and colleagues, who have argued, on the basis of biophysical arguments, that slow cortical positivities, like the LPP, must reflect decreased cortical excitability (Birbaumer et al., 1990).
To contrast these two hypotheses of the LPP, we require a paradigm that allows us to differentiate between the effects on perception of the LPP process and other, earlier brain processes like the EPN by separating the emotional stimulus (that elicits the LPP) and a subsequent target (that is used to probe the perceptual system). The critical question that can then be asked is whether the presentation of a non-emotional target during the LPP but after other processes like the EPN, will lead to improved or impaired perception of that target. Recent behavioral studies have used this paradigm to demonstrate that early perception of non-emotional stimuli is modulated after seeing emotional faces (Phelps et al., 2006; Bocanegra and Zeelenberg, 2009a; for a similar paradigm, see Bradley et al., 2006). However, these results do not inform the current research question because of the short stimulus onset asynchronies (SOAs: around 100 ms) used: the modulation of the LPP by emotional faces starts considerably later.
We conducted two experiments to contrast the enhanced perception hypothesis and global inhibition hypothesis of the LPP. In Experiment 1, we examined the relationship between LPP magnitude and perceptual sensitivity to non-emotional stimuli presented during the LPP. In Experiment 2, we examined the relationship between LPP magnitude and neural signatures of visual cortical excitability: the P1 and N1 components of the ERP waveform evoked by non-emotional stimuli.
Experiment 1
In Experiment 1, we examined the relationship between LPP magnitude and a behavioral index of perception. We manipulated LPP magnitude by varying the emotional valence of a series of IAPS pictures (negative or neutral valence; each presented for 200 ms) and measured the effect of the pictures on participants' sensitivity to the orientation of a subsequent Gabor patch. The low spatial frequency of our Gabor patch was based on Bocanegra and Zeelenberg (2009a), who reported a beneficial effect on orientation sensitivity of an immediately preceding fearful face picture (SOA = 100 ms). The SOA between the IAPS picture and the Gabor target in our experiment was systematically varied between 570, 1070 (both during the LPP modulation) and 1570 ms (presumably after the LPP modulation). We used IAPS pictures because they are commonly used in psychophysiological research on emotion and elicit reliable and pronounced LPPs. We used an orientation discrimination task because orientation is processed in ventral and dorsal visual areas where the LPP is generated (Faillenot et al., 2001). To avoid competition for temporal attention between the IAPS picture and the target (cf. Bocanegra and Zeelenberg, 2009b), we chose the shortest SOA to be longer than the typical attentional blink (Shapiro et al., 1997). We also took various measures to avoid competition for spatial attention between the two stimuli (see Methods).
If the emotion-induced LPP modulation reflects increased global perceptual sensitivity, then orientation sensitivity should be enhanced following negative pictures, but only for the short and medium SOA (i.e., during the LPP modulation). Furthermore, participants with a larger LPP modulation should show a larger increase in orientation sensitivity following negative pictures. In contrast, the global inhibition hypothesis predicts the opposite pattern of results: orientation sensitivity should be decreased following negative pictures, and participants with a larger LPP modulation should show a larger decrease in orientation sensitivity following negative pictures. We used d′ as an unbiased measure of perceptual sensitivity.
Materials and Methods
Participants
Twenty healthy young females, aged 19–28 years, took part in a single 2-h experimental session in return for course credit or €15. Participants were informed on the research procedures before their inclusion in the study.
Task
Participants performed a computerized decision-making task, based on that used by Bocanegra and Zeelenberg (2009a). Each trial started with a 500 ms fixation point (a white plus sign on a gray background), followed by the presentation, for 200 ms, of a picture from the IAPS (Lang et al., 1999) of either negative (e.g., mutilations, frightening animals) or neutral (e.g., faces with a neutral expression, clouds) valence (Figure 1). These pictures1 (166 neutral and 167 negative) were repeated randomly to create a total of 252 trials of either valence. The negative and neutral pictures differed in mean normative valence rating (2.59 vs. 5.36, t165 = 33.29; p < 0.001) and mean normative arousal rating (6.04 vs. 3.24, t165 = 37.58; p < 0.001; Lang et al., 1999). The entire task consisted of 504 trials, split up in eight blocks that each lasted about 5 min. In half of these trials neutral IAPS pictures were shown; in the other half, negative pictures. Pictures were shown in a random order. A yellow rectangle (visual angle 13.7° × 8.2°) was overlaid on the IAPS pictures and participants were instructed not to move their eyes outside of this rectangle. This measure was taken to ensure that participants' attention stayed focused on the center of the screen, which contained the most salient part of the IAPS picture and the target stimulus, and to preclude eye movements as much as possible. The IAPS picture was followed by a blank screen of 350–390, 850–890, or 1350–1390 ms (equiprobable within each valence, all jittered in steps of 20 ms, with means of 370, 870, and 1370 ms). Then, a Gabor stimulus (visual angle 1.8° × 1.8°) was presented in one of the four corners of the yellow rectangle for 40 ms. Gabor patches (2° Gaussian enveloped sinusoidal gratings) were created in MATLAB (The MathWorks Benelux), with a Michelson luminance contrast of 20% and a spatial frequency of 1.98 cycles per degree. The stimulus onset asynchrony (SOA) between the IAPS picture and the Gabor stimulus was, on average, 570 (short SOA), 1070 (medium SOA), or 1570 ms (long SOA). The task of the participant was to decide whether a Gabor patch was either tilted or not and to respond to straight Gabor patches by pressing a response button with their left hand, and to tilted Gabor patches by pressing a response button with their right hand. After the Gabor stimulus, a blank screen was presented until the participant's response, with a maximum duration of 1500 ms. This screen was followed by a short blank screen, which was presented for 250 ms. Finally, a red plus sign was presented for 1500 ms; the participant was instructed to try to blink only during the presentation of this screen.
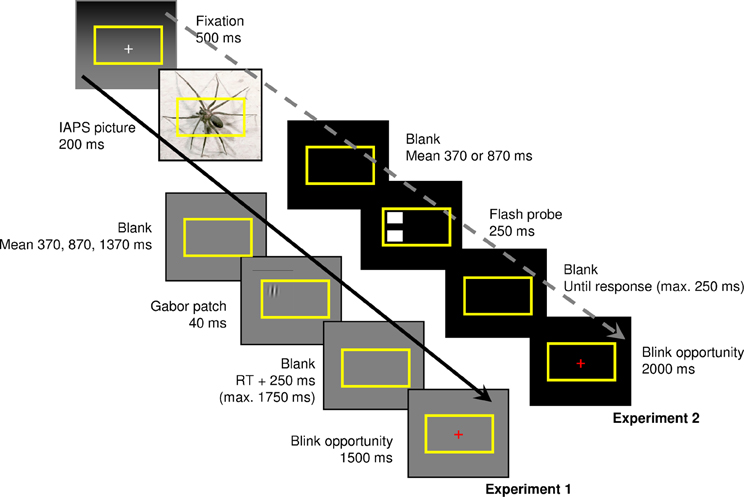
Figure 1. Sequence of trial events in Experiment 1 (continuous arrow) and Experiment 2 (discontinuous arrow). The participants' goal was to indicate whether a Gabor patch was tilted (Experiment 1), or to make a spatially compatible button press in case two flashes were presented to the left or right of fixation (Experiment 2).
Prior to the start of the task, participants first performed a short practice block (20 trials), in which the tilt of the Gabor patches was very pronounced (8°), so as to familiarize the participants with the purpose of the task. After these trials, the participants performed a practice block of 10 trials, in which the tilt of the Gabor patches was 4°. This block was repeated until the participants reached an accuracy of 70% or greater. Once this level of accuracy was established, the participants then performed 4 blocks of 10 trials each, in which the tilt of the Gabor patch varied per block (2°, 3°, 4°, or 5°). After finishing the fourth of these blocks, the participants' accuracy was evaluated per block, and the tilt that was associated with a performance of approximately 70% correct responses was selected to be used in the actual task. No IAPS stimuli were presented during these practice and tilt-adaptation blocks.
EEG recording and analyses
We recorded EEG from 30 Ag/AgCl scalp electrodes (Fpz, Fz, FC1, FCz, FC2, C3, C1, Cz, C2, C4, CP3, CP1, CPz, CP2, CP4, P7, P5, P3, P1, Pz, P2, P4, P6, P8, PO7, PO3, POz, PO4, PO8, Oz), and from the left and right mastoids. We measured the horizontal and vertical electro-oculogram (EOG) using bipolar recordings from electrodes placed approximately 1 cm lateral of the outer canthi of the two eyes and from electrodes placed approximately 1 cm above and below the participant's right eye. The EEG signal was pre-amplified at the electrode to improve the signal-to-noise ratio and amplified with a gain of 16× by a BioSemi ActiveTwo system (BioSemi B.V., Amsterdam). The data were digitized at 24-bit resolution with a sampling rate of 512 Hz using a low-pass fifth order sinc filter with a half-power cutoff of 102.4 Hz. Each active electrode was measured online with respect to a common mode sense (CMS) active electrode producing a monopolar (non-differential) channel, and was referenced offline to the average of the left and right mastoids. EEG and EOG were high-pass filtered at 0.01 Hz (24 dB/octave) and low-pass filtered at 15 Hz (24 dB/octave). Both of these filters are fourth-order Butterworth zero-phase filters.
Ocular and eyeblink artifacts were corrected using the method of Gratton et al. (1983). Epochs with other artifacts (a gradient greater than 30 μ V, spike artifacts [50 μ V/2 ms] and slow drifts [300 μ V/200 ms]) were also discarded. We extracted single-trial epochs for a period from 100 ms before until 1800 ms after picture onset. Then, for each participant and stimulus type, we averaged the EEG epochs to create stimulus-locked ERPs. The average signal during the 100 ms pre-stimulus baseline was subtracted from each ERP. In the main analyses, the LPP was defined as the mean signal amplitude in medium- and long-SOA trials (i.e., unconfounded by target-evoked ERPs) over electrodes CP1, CPz, and CP2 during the interval 400–1200 ms, where the LPP modulation was maximal. In follow-up analyses, we computed “local” LPP modulations corresponding to each SOA, by creating negative—neutral difference scores for three time windows (600–700 ms, 1100–1200 ms, and 1600–1700 ms, corresponding to the short, medium, and long SOAs). We conducted 2 (valence) × 3 (SOA) repeated-measures analyses of variance (ANOVAs) on d′ and mean LPP amplitudes. A Greenhouse-Geisser correction was applied when appropriate. To examine the participants' perceptual sensitivity, we calculated d′ as z(number of hits)—z(number of false alarms; Stanislaw and Todorov, 1999).
Results
Late positive potential
Figure 2 displays the ERPs elicited by the negative and neutral IAPS pictures. For each SOA there is a clear emotion-induced LPP modulation, starting around 400 ms post-stimulus and ending roughly 1 s later. As expected, the mean amplitude of the LPP was more positive following negative pictures (3.1 μ V) than following neutral pictures (0.9 μ V), F(1,19) = 81.89, p < 0.0005, η2p = 0.81. There was no interaction between valence and SOA, F(2,38) < 1, p = 0.57, η2p = 0.03. As expected, the local LPP difference between negative and neutral pictures was significant for the short (3.9 vs. 0.7 μ V, t19 = 7.27, p < 0.0005) and medium SOAs (1.5 vs. −0.6 μ V, t19 = 4.22, p = 0.0005). Contrary to our expectations, the local LPP difference for the long SOA was also significant (−0.1 vs. −1.4 μ V, t19 = 2.27, p = 0.04).
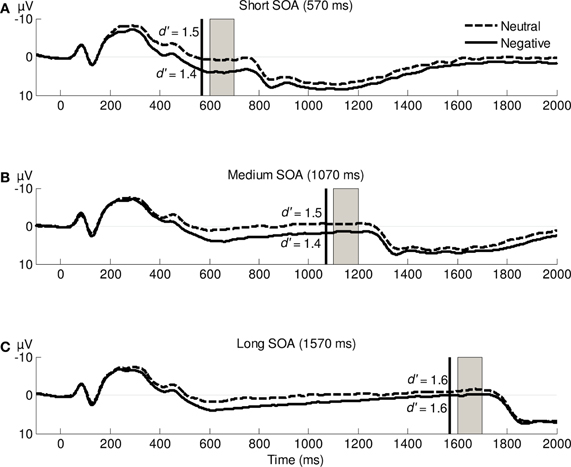
Figure 2. Stimulus-locked grand-average ERP waveforms averaged across electrodes CP1, CPz, and CP2 following the presentation of negative or neutral IAPS pictures. Vertical black lines indicate the onset of presentation of the Gabor patch; gray rectangles represent the time window used for the analysis of the local LPP modulations1. d′ averages for each SOA and valence are printed near the corresponding ERPs.
Behavioral results
In line with our methods, error rates were close to 30%: 26% for negative pictures and 25% for neutral pictures. The d′ values in each condition are reported in Figure 2. d′ was neither influenced by valence, F(1,19) < 1, p = 0.36, η2p = 0.05, nor by SOA duration, F(2,38) = 1.60, p = 0.22, η2p = 0.08. Furthermore, although we expected to find increased or decreased perceptual sensitivity during the time of maximal LPP modulation (i.e., for the short and medium SOAs), the interaction between valence and SOA was not significant, F(2,38) < 1, p = 0.50, η2p = 0.04. These results indicate that visual perception was not improved or impaired during the LPP modulation.
LPP-behavior correlations
We calculated negative—neutral d′ difference scores for each SOA, and calculated cross-subject Pearson correlations between these difference scores and the mean magnitude of the LPP modulation (in the time window 400–1200 ms). In contrast with our expectations, we found no robust relationship between the magnitude of the LPP modulation and d′ difference scores: correlations varied between −0.35 and 0.03 (Figure 3A). In addition, we calculated, for each SOA, the correlation between the d′ difference score and the corresponding local LPP modulation (Figure 3B). Again, we found no significant correlations, which indicates that larger LPP modulations following negative pictures were not accompanied by commensurate improvements or impairments in visual perception. However, it is noteworthy that most of the reported correlations were negative.
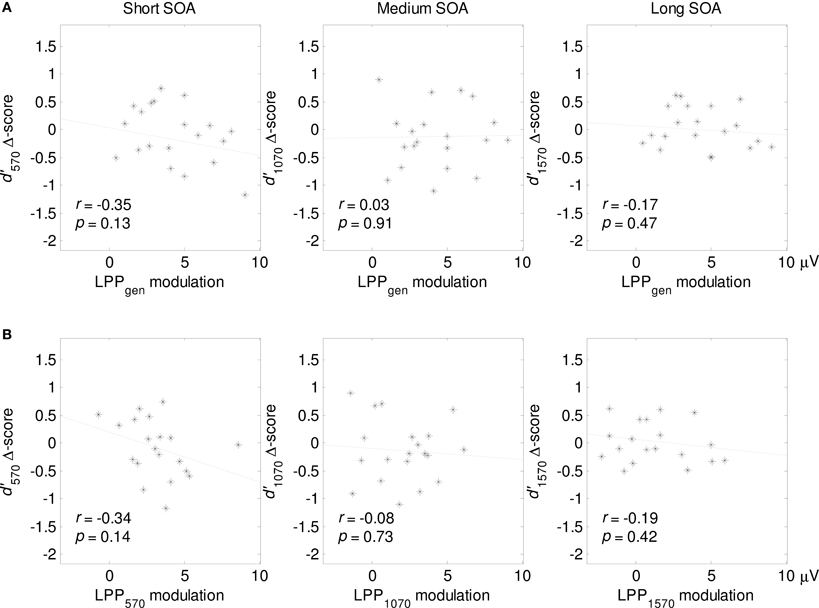
Figure 3. (A) Cross-subject correlations between a general LPP measure (LPPgen: averaged over a 400–1200 ms time window) and the d′ negative—neutral difference scores for each SOA. Subscripts indicate SOA length. (B) Correlations between local LPP modulations for each SOA (see Methods and Figure 2) and the corresponding d′ negative—neutral difference scores.
Within-subject comparisons between LPP amplitude quartiles
In addition to the inter-individual correlations described above, we also exploited intra-individual, trial-to-trial differences in LPP amplitude. We computed single-trial LPP values, using the same “global LPP” definition as in previous analyses. We then binned the trials in four quartiles, based on single-trial LPP value, separately for the negative and neutral IAPS trials, but collapsed across the three SOAs to collect enough trials per bin. Finally, we computed the average d′ value for the trials in the first and fourth quartiles, and submitted these to a repeated-measures ANOVA with quartile (1 vs. 4) and valence as within-subjects factors. Small-LPP trials (quartile 1: d′ = 1.4) and large-LPP trials (quartile 4: d′ = 1.4) were associated with a similar d′ value, F < 1, and quartile did not interact with valence.
Discussion
In Experiment 1, we briefly presented vertically oriented and slightly tilted Gabor patches during and after a robust emotion-induced modulation of the LPP. The results did not provide unequivocal evidence in favor of either the enhanced perception hypothesis or the global competition hypothesis: perceptual sensitivity to the orientation of the Gabor stimuli was neither improved nor impaired during the LPP modulation. Furthermore, individuals with larger LPP modulations did not show more improvement or impairment in d′ after negative pictures. If anything, the results seem tentatively compatible with the global inhibition hypothesis, because all but one of the reported correlations were negative: Individuals with larger LPP modulations showed a decline in orientation sensitivity after negative pictures. To examine if these findings were robust across tasks and measures, we conducted a second experiment.
Our behavioral results seem at odds with Bocanegra and Zeelenberg (2009b), who found that a negative visual stimulus (a briefly presented word, like “rape”) improved perception of a neutral target word presented ∼1000 ms later. An interesting question for future research is whether this discrepancy reflects the similarity between the emotional cue and the target stimulus, which was low in our experiment and high in Bocanegra and Zeelenberg (2009b). These authors did not collect ERP data, so it is unclear whether their emotional cue modulated the LPP.
Experiment 2
In Experiment 2, we investigated the relation between the LPP and direct electrophysiological correlates of perceptual sensitivity. As in the previous experiment, we manipulated LPP amplitude by varying the emotional valence of a series of briefly presented IAPS pictures. After one of two SOAs (570 or 1070 ms; both during the LPP modulation), the IAPS picture was followed by a non-emotional stimulus—a brief high-intensity flash known to elicit sizeable P1 and N1 components. The P1 and N1 reflect the early processing of stimuli in the visual cortex and are sensitive to spatially non-specific increases in attention. For example, increases in temporal attention after accessory stimuli and temporal cues are often associated with increased target-evoked P1 and/or N1 amplitudes (Correa et al., 2006; Jepma et al., 2009; Böckler et al., 2011). If the emotion-induced LPP modulation reflects increased global visual-cortex excitability, then the P1 and N1 to the flash probes should be larger after negative pictures (during the LPP modulation). Furthermore, participants with larger LPP modulations should show larger emotion-related increases in P1 and N1 amplitude. In contrast, if the LPP modulation reflects global inhibition of activity in visual cortex, the P1 and N1 amplitudes should be reduced after negative pictures, and especially so in participants with larger LPP modulations.
Materials and Methods
Participants
Twenty-five healthy young adults (22 women; no overlap with Experiment 1), aged 18–27 years, took part in a single 2-h experimental session in return for course credit or €15. Participants were informed on the experimental procedures before their inclusion in the study.
Task
Participants performed a straightforward RT task (Figure 1). On each trial of this task, participants saw an IAPS picture depicting either a neutral event (158 individual pictures), or a negative event (158 individual pictures)2. The negative and neutral pictures differed in mean normative valence rating (2.54 vs. 5.30, t319 = 51.69; p < 0.0001) and mean normative arousal rating (6.09 vs. 3.19, t319 = 54.16; p < 0.0001). Each picture was presented twice during the course of the task, in a randomized order. After a 500 ms fixation stimulus (a white plus sign on a black background) the IAPS picture was presented for 200 ms. As in Experiment 1, a yellow rectangle was overlaid on the IAPS pictures and participants were instructed not to move their eyes outside of this rectangle. The IAPS picture was followed by a blank screen for either 350–390 ms (jittered in steps of 20 ms; mean 370 ms) or 850–890 ms (mean 870 ms). This blank screen was followed by one of four probe events: two white rectangles (“flashes”; visual angle 6.9° × 5.7°) were presented (1) in the upper and lower left corners of the screen; or (2) in the upper and lower right corners of the screen (lateral flashes); (3) in all four corners of the screen (quadruple flashes); or (4) no white rectangles were presented at all (no flashes). The probe stimulus lasted 250 ms, resulting in SOAs between picture onset and flash onset of, on average, 570 ms (short SOA) or 1070 ms (medium SOA). These SOAs are identical to the short and medium SOAs used in Experiment 1. A blank screen followed the stimulus until the participant's response, with a maximum of 250 ms. If participants did not respond before termination of this screen (which happened rarely), the trial was considered incorrect. Finally, a red plus sign was presented for 2000 ms; participants were asked to blink only during the presentation of this screen. Participants were instructed to respond as quickly as possible to lateral flashes by pressing a spatially compatible button. The purpose of this task was to actively engage the participants during the task and to be able to investigate effects of valence on RT (cf. Weinberg and Hajcak, 2011). Participants were instructed to refrain from responding to quadruple flashes or when no flashes were presented. The quadruple-flash trials were used to measure the flash-elicited P1 and N1, uncontaminated by response-related ERP components. The no-flash trials were used to measure the LPP, in a way that is not contaminated by visual ERP components evoked by the flashes. The task consisted of 640 trials in total: 160 with lateral flashes, 320 with quadruple flashes, and 160 with no flashes. There was a short break after every 80 trials. The total trial duration was between 3450 and 3990 ms.
EEG recording and analyses
The EEG recording and analysis methods were the same as in Experiment 1, with the following exceptions. For the P1 and N1 components, EEG and EOG were high-pass filtered at 3 Hz (24 dB/octave) and low-pass filtered at 15 Hz (24 dB/octave). Both of these filters are fourth-order Butterworth zero-phase filters. We used a different high-pass filter for the LPP and the P1 and N1 components to make sure that the mean-amplitude measurements of the latter high-frequency components were not distorted by simultaneous, unrelated low-frequency shifts. The P1 was defined as the mean amplitude over electrodes PO7 and PO8, during the interval 80–120 ms. The N1 was defined as the mean amplitude measured over PO3 and PO4 during the interval 140–180 ms. Both were measured relative to the 100 ms pre-stimulus baseline. As in Experiment 1, the local LPPs were defined as the average signal in the 600–700 and the 1100–1200 ms windows, corresponding to the short and medium SOAs, respectively. We performed 2 (valence) × 2 (SOA) repeated-measures ANOVAs on mean RTs and mean P1/N1 amplitudes.
Results
Late positive potential
Figure 4 displays the stimulus-locked ERPs for the no-flash trials. As expected, the mean amplitude of the LPP was more positive following negative pictures (0.42 μ V) than following neutral pictures (−1.3 μ V), F(1,24) = 18.02, p < 0.0005, η2p = 0.43. Furthermore, the local LPP difference between negative and neutral pictures was significant for both the short (1.1 vs. −0.7 μ V, t24 = 3.93, p = 0.001) and the medium SOA (0.9 vs. −0.6 μ V, t24 = 3.52, p = 0.002).
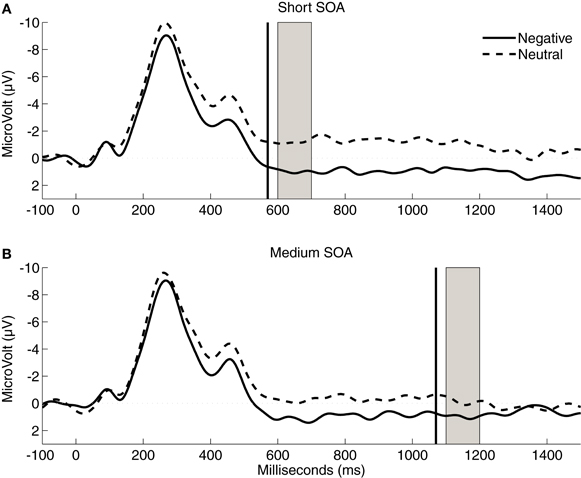
Figure 4. Stimulus-locked grand-average ERP waveforms averaged across electrodes CP1, CPz, and CP2 following the presentation of negative or neutral IAPS pictures. Vertical black lines indicate the onset of presentation of the flashes; gray rectangles represent the time window used for the analysis of the local LPP modulations.
P1/N1 complex
Figure 5 displays the ERPs elicited by the flash probes on quadruple-flash trials. Contrary to the predictions of the two examined hypotheses, P1 amplitudes (reported in Figure 5) were not affected by the valence of the IAPS picture, F(1,24) < 1, p = 0.64, η2p = 0.01. Importantly, however, N1 amplitudes were lower after negative pictures (−3.3 μ V) than after neutral pictures (−3.8 μ V), F(1,24) = 12.97; p = 0.001, η2p = 0.35: an effect consistent with the global inhibition hypothesis. This significant main effect of valence was qualified by a significant interaction with SOA, F(1,24) = 40.17, p < 0.0005, η2p = 0.63. Post-hoc pairwise comparisons showed that the difference between N1 amplitudes was significant for the short SOA, t24 = 6.05, p < 0.0005, but not for the medium SOA, t24 = 0.32, p= 0.76.
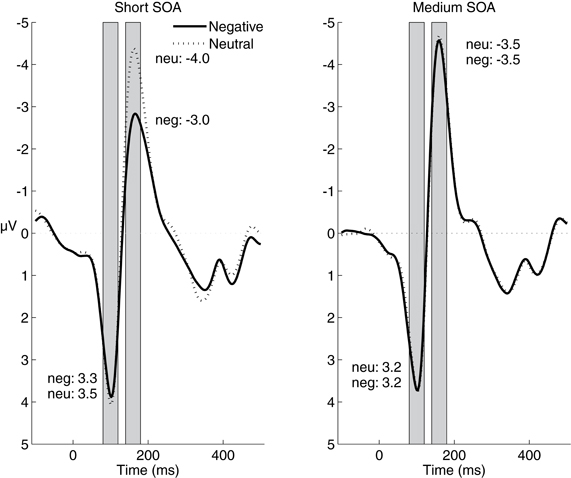
Figure 5. Stimulus-locked grand-average ERP waveforms averaged across electrodes PO7 and PO8 following the presentation of quadruple flashes. Gray rectangles represent the time windows used for the analysis of the P1/N1 effects. Average P1 and N1 amplitudes are printed near the corresponding waveform components.
It is possible that we did not find increased P1 and N1 amplitudes after negative pictures because these components already reached a maximum amplitude in the neutral condition, perhaps because of the high-intensity of the flash probe. To address the possibility of a ceiling effect, we computed the ipsilateral and contralateral P1 and N1 on neutral lateral-flash trials. As expected, given the topographical organization of the visual cortex, the ipsilateral P1 (1.9 μ V) was smaller than the contralateral P1 (3.5 μ V), F(1,24) = 15.21; p = 0.001, η2p = 0.39. This indicates that the ipsilateral P1 in the neutral condition was not at ceiling and could be modulated upwards. However, the corresponding ipsilateral P1 after negative pictures (1.7 μ V) was numerically smaller instead of larger, F(1,24) = 3.51, p = 0.07, η2p = 0.13. We conducted a comparable analysis for the N1 amplitudes. The ipsilateral N1 after neutral pictures was smaller (i.e., less negative; 1.2 μV) than the contralateral N1 (–0.9 μV), F(1,24) = 27.05, p < 0.0005, η2p = 0.53. And yet, the ipsilateral N1 was not modulated after negative pictures (1.3 μ V), F(1,24) < 1, p = 0.58, η2p = 0.01. These findings indicate that the absence of a P1/N1 amplitude increase after negative pictures cannot be due to a ceiling effect.
LPP-P1/N1 correlations
For each SOA we calculated cross-subject correlations between the negative—neutral LPP difference scores and the negative—neutral P1/N1 difference scores (Figure 6A). To circumvent confusion about negative and positive effect sizes, we reversed the signs of the N1 difference scores, such that the enhanced perception hypothesis predicted positive correlations and the global inhibition hypothesis predicted negative correlations in all of the analyses reported here. To further examine the relationship between the picture-related LPP and flash-related P1/N1, we correlated local LPP modulations with corresponding P1 and (sign-reversed) N1 difference scores (Figure 6B). As shown in Figure 6, all of the eight correlations were negative but none of them were significant.
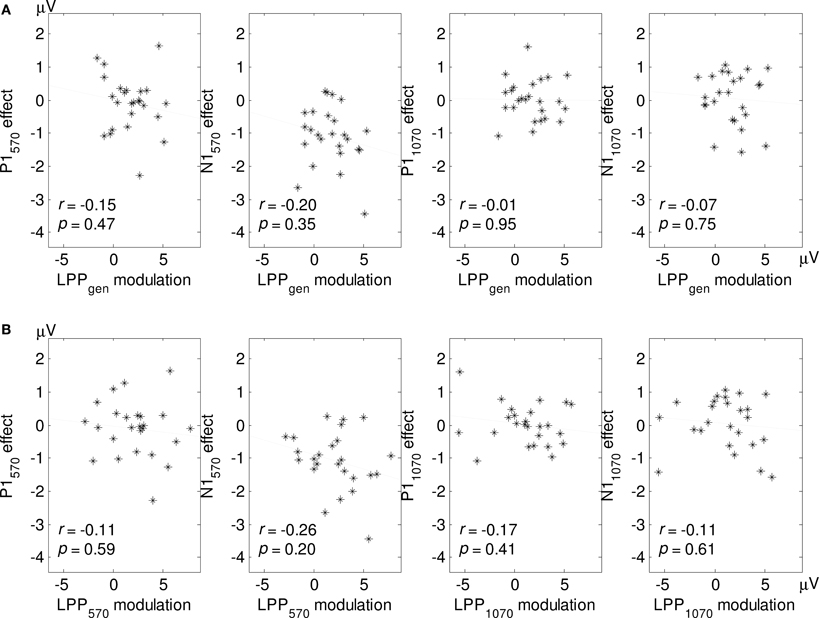
Figure 6. (A) Cross-subject correlations between a general LPP measure (LPPgen: averaged over a 400–1200 ms time window) and P1 and N1 effects for each SOA. Subscripts indicate SOA length. (B) Correlations between local LPP modulations for each SOA (see Methods and Figure 4) and the corresponding P1/N1 effects. Note that N1 effects have been sign-reversed to facilitate visual comparisons between the graphs (see Methods).
Within-subject comparisons between LPP amplitude quartiles
As in Experiment 1, we also exploited intra-individual, trial-to-trial variability in LPP magnitude to test our main predictions. Because this required a comparison between the LPP and P1/N1 from the same trials, the analysis was necessarily based on the quadruple-flash trials, such that the LPP measures were contaminated by flash-elicited ERP components, including P1 and N1. We binned the trials in four quartiles, based on single-trial LPP value, separately for each task condition. Finally, we computed the average P1 and N1 amplitudes for the trials in the first and fourth quartiles (to compare the most extreme LPP amplitudes within participants), and submitted these to a repeated-measures ANOVA with quartile (1 vs. 4), valence, and SOA as within-subjects factors.
P1 amplitudes were lower for large-LPP trials (quartile 4: 3.1 μ V) than for small-LPP trials (quartile 1: 3.3 μ V), F(1,24) = 6.3, p = 0.02. Note that this effect, predicted by the global inhibition hypothesis, is in the opposite direction of any effect caused by the confound described above. N1 amplitudes were also lower for large-LPP trials (−3.2 μ V) than for small-LPP trials (−3.4 μ V), but this difference was not significant, F(1,24) = 1.3, p = 0.27. Quartile did not interact with SOA or valence.
Behavioral results
Mean correct RTs on lateral-flash trials were similar in the negative (422 ms) and neutral condition (421 ms), F(1,24) < 1, p = 0.76, η2p = 0.0. Because mean error rates were very low and did not differ much between the negative (1.9%) and neutral condition (1.5%), we did not analyze them further.
Discussion
In Experiment 2 we presented high-intensity flashes during a robust emotion-induced modulation of the LPP. The amplitude of the P1 to these flashes was not affected by the emotional intensity of the preceding IAPS pictures. In contrast, N1 amplitudes were significantly smaller following negative pictures, but only if the interval between the picture and the flash was relatively short (570 ms). Furthermore, in line with Experiment 1, all cross-subject correlations between LPP modulations and corresponding changes in P1/N1 amplitudes were negative, although (again) none were statistically significant. Within-subject comparisons demonstrated that large-LPP trials were associated with lower P1 amplitudes. Taken together, these findings provide some support for the global inhibition hypothesis, but any truly existing effect is likely to be modest.
We found no difference in RTs and accuracy after negative pictures. These findings appear to contrast with results of Weinberg and Hajcak (2011), who reported small but reliable increases in RT following positive and negative IAPS pictures. This discrepancy is probably due to differences in stimulus duration. Weinberg and Hajcak presented the IAPS pictures for 1000 ms immediately before, and for 400 ms immediately after the target stimulus, which was presented for 150 ms. That is, direct competition between the IAPS picture and the target for spatial and/or temporal attention was probably larger than in our study, and this competition may have been increased for arousing stimuli. Furthermore, subjects were planning and executing their response while the IAPS picture was back on the screen, allowing a direct effect of picture valence on RTs. We note that these response-time effects are of secondary interest to the current purposes, because RTs include the duration of several processes other than perception.
General Discussion
We conducted two experiments to gain insight into the functional significance of the LPP. In particular, we contrasted the enhanced perception hypothesis with the global inhibition hypothesis. The enhanced perception hypothesis proposes that the LPP reflects a broadly enhanced perceptual sensitivity throughout the visual field, a potentially adaptive attentional response to emotional stimuli. Conversely, the global inhibition hypothesis assumes that the LPP reflects a global inhibition of potentially competing representations in the visual cortex, which may allow more selective processing of the emotional stimulus. Given that the LPP modulation outlasts the presentation duration of the emotional stimulus itself, we assumed that the effect of the underlying process would carry over onto the visual processing of subsequently presented neutral stimuli (cf. Bocanegra and Zeelenberg, 2009b). However, we found no conclusive evidence for either an improved or an impaired relationship between LPP amplitude and a behavioral measure of perceptual sensitivity (Experiment 1) or more direct neural signatures of visual cortical excitability (Experiment 2).
Nevertheless, the results seemed to reveal a pattern. In Experiment 1, the behavioral index of perceptual sensitivity (d′) was unaffected by the valence of IAPS stimuli. More specifically, the robust LPP modulation to negative pictures was not accompanied by enhanced or impaired perception of non-emotional targets presented during the LPP modulation. In Experiment 2, however, the N1 (but not P1) elicited by non-emotional stimuli presented during the LPP modulation was smaller following negative than following neutral IAPS stimuli, specifically when the interval between the IAPS picture and the flash probe was relatively short. Furthermore, the P1 (but not N1) was smaller on trials with a large LPP than on trials with a small LPP. Finally, participants with a larger LPP modulation tended to show an impairment in perceptual sensitivity (Experiment 1) and a (larger) decrease in P1 and N1 amplitude (Experiment 2). Although these correlations were of small to modest size, and not statistically significant, 13 out of 14 of the reported correlations were negative—a striking proportion. Thus, if anything, the pattern of results provides tentative support for the global inhibition hypothesis.
Let us, for the moment, assume that the LPP reflects global inhibition of activity in visual cortex. What might be the mechanism underlying this global inhibition? An interesting possibility is that the global inhibition reflects the threshold control of cortical excitability (Elbert and Rockstroh, 1987; Elbert, 1990). According to this account, the presentation of a motivationally significant stimulus is immediately followed by an increase in neuronal firing threshold, such that ongoing (pre-stimulus) neural activity will instantaneously drop to a low level, and activity will survive only in cell assemblies processing the just arrived stimulus. This interrupt function, while preventing overactivation in a network with primarily excitatory connections, will facilitate the processing of the motivationally significant stimulus and inhibit cortical excitability elsewhere in the visual cortex. This threshold regulation may be achieved by a local population of inhibitory interneurons or, more likely, by non-specific thalamo-cortical afferents (Elbert, 1990). Importantly, Birbaumer, Elbert and colleagues have argued that the reflexive up-regulation of firing threshold after an important stimulus, and corresponding dampening of competing neural activity, should manifest at the scalp as a slow positive potential, such as the LPP (Birbaumer et al., 1990). Future studies could test a prediction of this account that larger LPPs should be accompanied by an increased threshold for effects of transcranial magnetic stimulation of the visual cortex.
A perhaps closely related possibility is that the LPP reflects a phase resetting of low-frequency delta oscillations, caused by the presentation of the emotionally arousing stimulus (cf. Schroeder and Lakatos, 2009). Lakatos and colleagues have found that the smallest visual-evoked responses and the slowest RTs occur when stimuli are presented around the positive peak of delta oscillations, which they refer to as low-excitability phase (as opposed to the negative peak/high-excitability phase; Lakatos et al., 2008). Thus, we propose that the indications that we found for a global inhibition of visual processing during the LPP may reflect the consequences of a positive-amplitude low-excitability phase of delta oscillations, reset by the presentation of emotional stimuli. In this case, the evidence for a reduction of P1/N1 amplitudes during the LPP reflects a case of cross-frequency coupling, with the power of faster oscillations (reflected in P1/N1 amplitude) modulated by the phase of slower (delta) oscillations. An interesting possibility is that phase resetting of delta oscillations is a result of the threshold-regulation process discussed above.
Although we found very little effects of our manipulations, we are confident that our dependent measures were sufficiently sensitive. Bocanegra and Zeelenberg (2009a) have reported emotion-related improvements in orientation sensitivity for the same Gabor stimuli that we used in Experiment 1. P1 and N1 amplitude, used in Experiment 2, are broadly accepted measures of perceptual sensitivity, and we demonstrated that the results could not be attributed to ceiling effects on these component amplitudes. In theory, it is possible that the manipulation of LPP amplitude was not sufficiently strong to be accompanied by robust effects on behavior. Our IAPS pictures, presented for only 200 ms, yielded LPP modulations of 2.2 μ V (Experiment 1) and 1.7 μ V (Experiment 2). These modulations would probably have been larger if the picture duration had been longer. However, our paradigm required that the IAPS pictures disappeared well before the onset of the neutral target stimuli.
We do not understand why negative pictures were followed by a reduction of the probe-related N1 amplitude but not P1 amplitude. Studies using other temporal-attention tasks, like the accessory-stimulus task and the temporal-cuing task, have reported similar variable results: at times the P1 is modulated while the N1 is not, and sometimes the reverse is found (Correa et al., 2006; Jepma et al., 2009; Böckler et al., 2011). However, in these tasks the P1 and/or N1 increased in amplitude under conditions of enhanced temporal attention, whereas in our experiment the probe-related N1 decreased in amplitude. In contrast, Rockstroh et al. (1992) found similar results, using a paradigm that is much more comparable to our paradigm. These authors presented a probe (auditory click) during the P3 evoked by an oddball stimulus, and found decreased probe-related N1 amplitudes compared to probes presented during the small P3 evoked by standard stimuli. In contrast, the probe-related P1 was relatively unaffected by the size of the P3. A tentative hypothesis is that the emotionally arousing effects induced by the IAPS pictures in our study (and oddball stimuli in Rockstroh et al. study) only affect later stages of perceptual processing (reflected by the N1), which might account for the unmodulated P1. However, this seems incompatible with findings that emotion can affect very early stages of perceptual processing (e.g., Bocanegra and Zeelenberg, 2009b). Indeed, the within-subject comparison between trials with small and large LPP amplitudes (controlled for valence) revealed a reduction of the P1 but not N1 amplitude for large-LPP trials.
In sum, our results do not allow us to unequivocally reject or confirm either the enhanced perception hypothesis or the global inhibition hypotheses. However, while we found no evidence whatsoever for the enhanced perception hypothesis, some aspects of the results are consistent with the global inhibition hypothesis—the notion that the LPP reflects a dampening of activity in visual cortex, perhaps as a result of reflexive threshold regulation after an emotionally arousing stimulus. In any case, we believe that our study provides significant clues for future studies that will try to link the LPP to cognitive and behavioral functions; we hope that our study will encourage others to study not just when the LPP occurs, but also what function it reflects.
Conflict of Interest Statement
The authors declare that the research was conducted in the absence of any commercial or financial relationships that could be construed as a potential conflict of interest.
Footnotes
- ^The following IAPS pictures were used. Neutral valence: 1121 1313 1333 1450 1610 1616 1670 1675 1910 2038 2102 2104 2190 2191 2200 2210 2214 2220 2221 2235 2270 2305 2320 2357 2370 2372 2381 2385 2393 2396 2397 2440 2441 2445 2480 2487 2493 2495 2499 2501 2512 2513 2516 2560 2570 2575 2579 2580 2593 2620 2745.1 2840 2850 2870 2880 2890 2980 4000 4100 5000 5020 5030 5120 5130 5200 5390 5410 5471 5500 5510 5520 5530 5532 5533 5534 5535 5551 5711 5731 5740 5750 5760 5779 5800 5870 5875 5890 5891 5900 5982 5990 5991 5994 6150 6900 6930 7000 7002 7004 7006 7009 7010 7020 7025 7030 7031 7034 7035 7036 7037 7038 7039 7040 7041 7042 7043 7044 7050 7052 7053 7055 7056 7059 7060 7080 7090 7100 7110 7130 7140 7150 7160 7161 7170 7175 7179 7180 7185 7187 7190 7205 7217 7224 7233 7234 7235 7490 7491 7500 7545 7547 7550 7595 7640 7700 7705 7900 7950 8475 9070 9080 9171 9210 9360 9700 9913. Negative valence: 1050 1052 1070 1111 1114 1120 1200 1201 1205 1220 1240 1270 1300 1310 1321 1525 1930 1931 1932 2053 2095 2110 2120 2200 2276 2352.2 2455 2490 2683 2688 2703 2710 2730 2800 2811 2981 3000 3010 3016 3017 3030 3051 3053 3060 3061 3063 3064 3068 3069 3071 3080 3100 3101 3102 3110 3120 3130 3140 3150 3160 3168 3170 3180 3181 3191 3215 3220 3225 3230 3261 3266 3300 3350 3400 3500 3530 3550.1 5971 5972 6020 6021 6022 6190 6200 6210 6212 6213 6230 6242 6243 6244 6250 6260 6300 6311 6312 6313 6314 6315 6350 6360 6370 6410 6415 6510 6530 6540 6550 6555 6560 6570 6571 6821 6830 6834 6836 6838 6840 7359 7380 8230 8480 8485 9040 9042 9050 9140 9160 9180 9250 9252 9253 9254 9300 9301 9400 9402 9405 9409 9410 9419 9423 9424 9425 9426 9427 9428 9429 9433 9500 9520 9570 9571 9600 9611 9620 9621 9622 9630 9635.1 9800 9810 9900 9902 9910 9920 9921.
- ^We used the same IAPS pictures as in Experiment 1, except for the following: 1240 1270 1310 3230 3220 6311 6314 9140 9402 (negative valence) and 2516 2560 2575 5890 5982 5990 5991 5994 (neutral valence).
References
Baetens, K., Van der Cruyssen, L., Achtziger, A., Vandekerckhove, M., and Van Overwalle, F. (2011). N400 and LPP in spontaneous trait inferences. Brain Res. 1418, 83–92.
Bocanegra, B. R., and Zeelenberg, R. (2009a). Emotion improves and impairs early vision. Psychol. Sci. 20, 707–713.
Bocanegra, B. R., and Zeelenberg, R. (2009b). Dissociating emotion-induced blindness and hypervision. Emotion 9, 865–873.
Birbaumer, N., Elbert, T., Canavan, A. G., and Rockstroh, B. (1990). Slow potentials of the cerebral cortex and behavior. Physiol. Rev. 70, 1–41.
Böckler, A., Alpay, G., and Stürmer, B. (2011). Accessory stimuli affect the emergence of conflict, not conflict control. Exp. Psychol. 58, 102–109.
Bradley, M. M., Codispoti, M., and Lang, P. J. (2006). A multi-process account of startle modulation during affective perception. Psychophysiology 43, 486–497.
Codispoti, M., Ferrari, V., and Bradley, M. M. (2007). Repetition and event-related potentials: distinguishing early and late processes in affective picture perception. J. Cogn. Neurosci. 19, 577–586.
Correa, M., Lupiáñez, J., Madrid, E., and Tudela, P. (2006). Temporal attention enhances early visual processing: a review and new evidence from event-related potentials. Brain Res. 1076, 116–128.
Correa, A., Lupiáñez, J., and Tudela, P. (2005). Attentional preparation based on temporal expectancy modulates processing at the perceptual level. Psychon. Bull. Rev. 12, 328–334.
Crites, S. L. Jr., Mojica, A. J., Corral, G., and Taylor, J. H. (2010). An event-related potential paradigm for identifying (rare negative) attitude stimuli that people intentionally misreport. Psychophysiology 47, 984–988.
Cuthbert, B. N., Schupp, H. T., Bradley, M. M., Birbaumer, N., and Lang, P. J. (2000). Brain potentials in affective picture processing: covariation with autonomic arousal and affective report. Biol. Psychol. 52, 95–111.
Dennis, T. A., and Hajcak, G. (2009). The late positive potential: a neurophysiological marker for emotion in children. J. Child Psychol. 50, 1373–1383.
de Rover, M., Brown, S. B. R. E., Boot, N., Hajcak, G., van Noorden, M. S., van der Wee, N. J. A., and Nieuwenhuis, S. (2012). Beta receptor-mediated modulation of the late positive potential in humans. Psychopharmacology 219, 971–979.
Elbert, T. (1990). “Slow cortical potentials reflect the regulation of cortical excitability,” in Slow Potential Changes of the Human Brain, ed. W. C. McCallum (New York, NY: Plenum Press), 235–251.
Elbert, T., and Rockstroh, B. (1987). Threshold regulation: a key to the understanding of the combined dynamics of EEG and event-related potentials. J. Psychophysiol. 1, 317–333.
Faillenot, I., Suneart, S., Van Hecke, P., and Orban, G. A. (2001). Orientation discrimination of objects and gratings compared: an fMRI study. Eur. J. Neurosci. 13, 585–596.
Flaisch, T., Häcker, F., Renner, B., and Schupp, H. T. (2011). Emotion and the processing of symbolic gestures: an event-related brain potential study. Soc. Cogn. Affect. Neurosci. 6, 109–118.
Fox, E., Lester, V., Russo, R., Bowles, R. J., Pichler, A., and Dutton, K. (2000). Facial expressions of emotion: are angry faces detected more efficiently? Cogn. Emotion 14, 61–92.
Frühholz, S., Fehr, T., and Herrmann, M. (2009). Early and late temporo-spatial effects of contextual interference during perception of facial affect. Int. J. Psychophysiol. 74, 1–13.
Gratton, G., Coles, M. G. H., and Donchin, E. (1983). A new method for off-line removal of ocular artifact. Electroencephalogr. Clin. Neurophysiol. 55, 468–484.
Hajcak, G., MacNamara, A., and Olvet, D. M. (2010). Event-related potentials, emotion, and emotion regulation: an integrative review. Dev. Neuropsychol. 35, 129–155.
Hajcak, G., and Olvet, D. M. (2008). The persistence of attention to emotion: brain potentials during and after picture presentation. Emotion 8, 250–255.
Horan, W. P., Wynn, J. K., Kring, A. M., Simons, R. F., and Green, M. F. (2010). Electrophysiological correlates of emotional responding in schizophrenia. J. Abnorm. Psychol. 119, 18–30.
Hurtado, E., Haye, A., Gonzáles, R., Manes, F., and Ibáñez, A. (2009). Contextual blending of ingroup/outgroup face stimuli and word valence: LPP modulation and convergence of measures. BMC Neurosci. 10, 69.
Jepma, M., Wagenmakers, E-J., Band, G. P. H., and Nieuwenhuis, S. T. (2009). The effects of accessory stimuli on information processing: evidence from electrophysiology and a diffusion model analysis. J. Cogn. Neurosci. 21, 847–864.
Keil, A., Bradley, M. A., Hauk, O., Rockstroh, B., Elbert, T., and Lang, P. J. (2002). Large-scale neural correlates of affective picture processing. Psychophysiology 39, 641–649.
Lakatos, P., Karmos, G., Mehta, A. D., Ulbert, I., and Schroeder, C. E. (2008). Entrainment of neuronal oscillations as a mechanism of attentional selection. Science 320, 110–113.
Lang, P. J, Bradley, M. M., and Cuthberth, B. N. (1999). International Affective Picture System (IAPS): Technical Manual and Affective Ratings. Gainesville, Fl. The Center for Research in Psychophysiology, University of Florida.
Marissen, M. A. E., Meuleman, L., and Franken, I. H. A. (2010). Altered emotional information processing in borderline personality disorder: an electrophysiological study. Psychiatry Res. 181, 226–232.
Matsuda, I., Nittono, H., Hirota, A., Ogawa, T., and Takasawa, N. (2009). Event-related brain potentials during the standard autonomic-based concealed information test. Int. J. Psychophysiol. 74, 58–68.
Moratti, S., Saugar, C., and Strange, B. (2011). Prefrontal-occipital coupling underlies late latency human neuronal responses to emotion. J. Neurosci. 31, 17278–17286.
Olofsson, J. K., Nordin, S., Sequeira, H., and Polich, J. (2008). Affective picture processing: an integrative review of the ERP findings. Biol. Psychol. 77, 247–265.
Phelps, E. A., Ling, S., and Carrasco, M. (2006). Emotion facilitates perception and potentiates the perceptual benefits of attention. Psychol. Sci. 17, 292–299.
Pourtois, G., Grandjean, D., Sander, D., and Vuilleumier, P. (2005). Electrophysiological correlates of rapid spatial orienting towards fearful faces. Cereb. Cortex 14, 619–633.
Rockstroh, B., Müller, M., Cohen, R., and Elbert, T. (1992). Probing the functional brain state during P300-evocation. J. Psychophysiol. 6, 175–184.
Sabatinelli, D., Lang, P. J., Keil, A., and Bradley, M. M. (2007). Emotional perception: correlation of functional MRI and event-related potentials. Cereb. Cortex 17, 1085–1091.
Schroeder, C. E., and Lakatos, P. (2009). Low-frequency neuronal oscillations as instruments of sensory selection. Trends Neurosci. 32, 9–18.
Schupp, H. T., Flaisch, T., Stockburger, J., and Junghöfer, M. (2006). Emotion and attention: event-related brain potential studies. Prog. Brain Res. 156, 31–51.
Schupp, H. T., Junghöfer, M., Weike, A. I., and Hamm, A. O. (2004a). The selective processing of briefly presented affective pictures: an ERP analysis. Psychophysiology 41, 441–449.
Schupp, H. T., Öhman, A., Junghöfer, M., Weike, A. I., Stockburger, J., and Hamm, A. O. (2004b). The facilitated processing of threatening faces: an ERP analysis. Emotion 4, 189–200.
Shapiro, K. L., Arnell, K. M., and Raymond, J. E. (1997). The attentional blink. Trends Cogn. Sci. 8, 291–296.
Stanislaw, H., and Todorov, N. (1999). Calculation of signal detection theory measures. Behav. Res. Methods Instrum. Comput. 31, 137–149.
Vuilleumier, P. (2005). How brains beware: neural mechanisms of emotional attention. Trends Cogn. Sci. 12, 585–594.
Weinberg, A., and Hajcak, G. (2010). Beyond good and evil: the time-course of neural activity elicited by specific picture content. Emotion 10, 767–782.
Weinberg, A., and Hajcak, G. (2011). The late positive potential predicts subsequent interference with target processing. J. Cogn. Neurosci. 23, 2994–3007.
Keywords: late positive potential, LPP, emotion, perception, ERP, global inhibition
Citation: Brown SBRE, van Steenbergen H, Band GPH, de Rover M and Nieuwenhuis S (2012) Functional significance of the emotion-related late positive potential. Front. Hum. Neurosci. 6:33. doi: 10.3389/fnhum.2012.00033
Received: 01 November 2011; Accepted: 14 February 2012;
Published online: 27 February 2012.
Edited by:
Shuhei Yamaguchi, Shimane University, JapanReviewed by:
Hiroshi Nittono, Hiroshima University, JapanTvzetan Popov, University Konstanz, Germany
Copyright: © 2012 Brown, van Steenbergen, Band, de Rover and Nieuwenhuis. This is an open-access article distributed under the terms of the Creative Commons Attribution Non Commercial License, which permits non-commercial use, distribution, and reproduction in other forums, provided the original authors and source are credited.
*Correspondence: Stephen B. R. E. Brown, Department of Psychology, Cognitive Psychology Unit, Institute of Psychology, Leiden University, Wassenaarseweg 52, 2333 AK, Leiden, Netherlands. e-mail: brownsbre@fsw.leidenuniv.nl